
Heriot-Watt University Research Gateway
A Global Study Into the Reasons for Lean Six Sigma ProjectFailures
Citation for published version:Antony, J, Lizarelli, FL & Fernandes, MM 2020, 'A Global Study Into the Reasons for Lean Six SigmaProject Failures: Key Findings and Directions for Further Research', IEEE Transactions on EngineeringManagement. https://doi.org/10.1109/TEM.2020.3009935
Digital Object Identifier (DOI):10.1109/TEM.2020.3009935
Link:Link to publication record in Heriot-Watt Research Portal
Document Version:Peer reviewed version
Published In:IEEE Transactions on Engineering Management
Publisher Rights Statement:© 2020 IEEE. Personal use of this material is permitted. Permission from IEEE must be obtained for all otheruses, in any current or future media, including reprinting/republishing this material for advertising or promotionalpurposes, creating new collective works, for resale or redistribution to servers or lists, or reuse of anycopyrighted component of this work in other works.
General rightsCopyright for the publications made accessible via Heriot-Watt Research Portal is retained by the author(s) and /or other copyright owners and it is a condition of accessing these publications that users recognise and abide bythe legal requirements associated with these rights.
Take down policyHeriot-Watt University has made every reasonable effort to ensure that the content in Heriot-Watt ResearchPortal complies with UK legislation. If you believe that the public display of this file breaches copyright pleasecontact [email protected] providing details, and we will remove access to the work immediately andinvestigate your claim.
Download date: 02. Jan. 2022

A Global study into the reasons for Lean Six Sigma project failures: key findings
and directions for further research
Jiju Antony, Fabiane Letícia Lizarelli and Marcelo Machado Fernandes
Low success rate of improvement projects is one of the causes of the discontinuity of
Lean Six Sigma (LSS) initiatives in companies. It is essential to identify and evaluate the
reasons why LSS improvement projects fail in order to enable LSS, Lean, and Six Sigma
sustainability. This paper presents the findings from a global survey conducted with 201
LSS experts around the world in both service and manufacturing sectors. The results of
our study point out to significant failure rates for LSS projects and alert that projects had
higher termination rates in measure and analyze phases (DMAIC – Define, Measure,
Analyze, Improve and Control). Failures occur primarily at the corporate level. The main
causes of project failures identified were lack of commitment by top management,
resistance to change, inadequate rewards and recognition mechanisms, inconsistent
monitoring and control of the projects, and poor communication. Our study shows that
there are some minor differences in terms of ranking of these factors between
manufacturing and service sectors but there is significant difference in terms of continent
and belt level (Master Black Belts, Black Belts, and Green Belts).
Keywords: Six Sigma, Lean Six Sigma, Project Failures, Survey, Continuous
Improvement
Managerial relevance statement: The findings have several implications for managing
organizations that are implementing or supporting LSS. Firstly, the failure rate of LSS
projects must be monitored, for trend analysis and elimination of the potential causes of
failures. Secondly, management must be careful, especially in the Measure and Analyze
phases, when the project is being carried out, and management must be aware of actions
at the corporate level to minimize the chances of projects failing. Attention in the Measure
and Analyze phases can direct measures such as better communication among team
members and choice of team members with the appropriate skills and problem-solving
knowledge, causes of project failures that may be associated with the project's termination
in these phases. The third implication is that management should create mechanisms to
decrease the chances of project failures by understanding the factors and the variables
that lead to them. Actions that can be taken are, increasing commitment on behalf of the
top management to project planning and execution, creating mechanisms to reduce
resistance to employee change, creating reward policies, and creating better
communication mechanisms among project stakeholders.
1. Introduction
Lean Six Sigma (LSS) is a business strategy and methodology that increases process
performance resulting in enhanced customer satisfaction and improved results [1]. It
seeks to improve the bottom-line results of organizations in hard-cash savings and to
create value for customers and shareholders [1], [2]. LSS differs from other quality
management approaches in its structure and organization [3] as LSS aligns the cultural
aspects of Lean with the data driven approach of Six Sigma (SS) [4]. LSS created a
holistic improvement methodology - derived from integrating Lean and SS and their
toolboxes - in which the main goal is continuous improvement through a robust and
systematic problem-solving methodology called DMAIC (Define-Measure-Analyze-
Improve-Control) [1], [3], [4].
Many industries have adopted LSS methodology for continuous improvement [5],
however, it is not easy to implement [6], since LSS is not immune from failure [5], [7].
Resistance is a main problem in implementing LSS or SS projects given lack in
understanding and general disbelief as to the effectiveness of such projects [1], [8]. For

this reason, LSS critical success factors and failure factors are topics of interest to both
researchers and managers alike[5], [9].
The low success rate of LSS projects is one of the causes that may lead to discontinuing
LSS initiatives [3]. The failures of SS programs at the project level should be studied and
analyzed [10]. Successful projects are usually the best way to reduce concerns
surrounding LSS [1], [3]. Successful projects result in less doubt surrounding the
implementation of the approach and also increase confidence [1]. The expectation of
tangible benefits using continuous improvement approaches implies that projects must be
successful [11], [12]. As such, LSS project failure is a concern that can easily deter its
implementation [5].
An organization needs to have a project management system, a proper selection
(including prioritization and classification), execution, and review system to ensure the
long-term success of any continuous improvement approach [1], [13]. Another important
aspect of project management is the sustainability of results and clear guidelines for the
initial phases of DMAIC [7], [14]. Furthermore, there should be processes to guide and
sustain improvement to reach project management objectives [14], such as project
tracking and review, communication, recognition and reward, and training [1].
It is critical to understand how to reduce the risk of failure in continuous improvement
projects like LSS [15], [13]. However, only a handful of papers have been published that
studied the factors that lead to the successful completion of improvement projects [16],
[17]. Studying the reasons why LSS projects fail is crucial to the performance of the
overall LSS approach and to business excellence in general [18], [19].
Therefore, this study seeks to respond to the following research gaps: i) identify the
reasons for LSS project failures, since literature focuses on the reasons for the success
and failures of LSS programs [3], [7], [19], or projects success factors (e.g., [20],[21],
[22]); ii) contribute to the discussion on deploying LSS identifying the failure rates of
LSS projects, which is one of the reasons why companies giving up LSS [1], [3], [5],
[22]; iii) rank the project failure reasons, since there is an absence of this type of research
[19], [23]; iv) eliminate the absence of global empirical studies in the theme [18], since
this is the first empirical study with a global scope geared towards understanding the
factors that lead to LSS project failures, and v) verify the impact of variables such as role
in Belt system [24], sector [2], [25], [26], country development [2] and national culture
[25] in the ranking of failure factors.
This paper focuses on the critical factors that lead to LSS project failures. This study
presents a global research with LSS experts from service and manufacturing sectors
containing responses from 201 participants. This study characterizes the rate and levels
at which project failures occur, determines and ranks of the fundamental reasons behind
LSS project failures via an empirical study and verifies variables that can alter the
perception of these reasons, such as respondents' role in Belt system, sectors and national
culture. This study can help senior managers and process improvement experts to reduce
the risks associated with project failures and the costs associated with such failures.
The layout of the paper is as follows: Section 2 presents a literature review on the possible
reasons and factors for LSS project failures; Section 3 details the research methodology
used in this study; Section 4 reports the results and key findings, followed by a discussion
in Section 5. Finally, Section 6 highlights the conclusions, managerial implications,
limitations and suggestions for further research.
2. Literature Review
It is important to research project failures because they result in serious financial and non-
financial losses that can impede the development of other potential projects [19].
Reducing failures in improvement projects can enable LSS, Lean, and SS sustainability
[3], [13]. Furthermore, learning from project failures can play a key role in planning and
monitoring future projects [19].
LSS projects are quite different from other projects conducted by project managers in
many organizations. There are only two types of projects which can be conducted in any
organizational settings. The first type of projects are run by project managers where the
solution is known right from the outset of the project (for instance, development of a new
IT system). The second of projects are run by LSS professionals such as Green Belts
(GBs), Black Belts (BBs) or Master Black Belts (MBBs) where the solutions are unknown
to the problem (for example, the rework and scrap rate of a process is estimated to be 8%
per month and this is costing an organization more than $250k per annum). In the second
type of projects, the root causes of the problem were not known and the purpose of the
project is to reduce the scrap rate on a continuous basis [27]. LSS projects use a specific
problem solving methodology (DMAIC) and associated relevant tools [27] and the
projects need a wide variety of stakeholders [27].
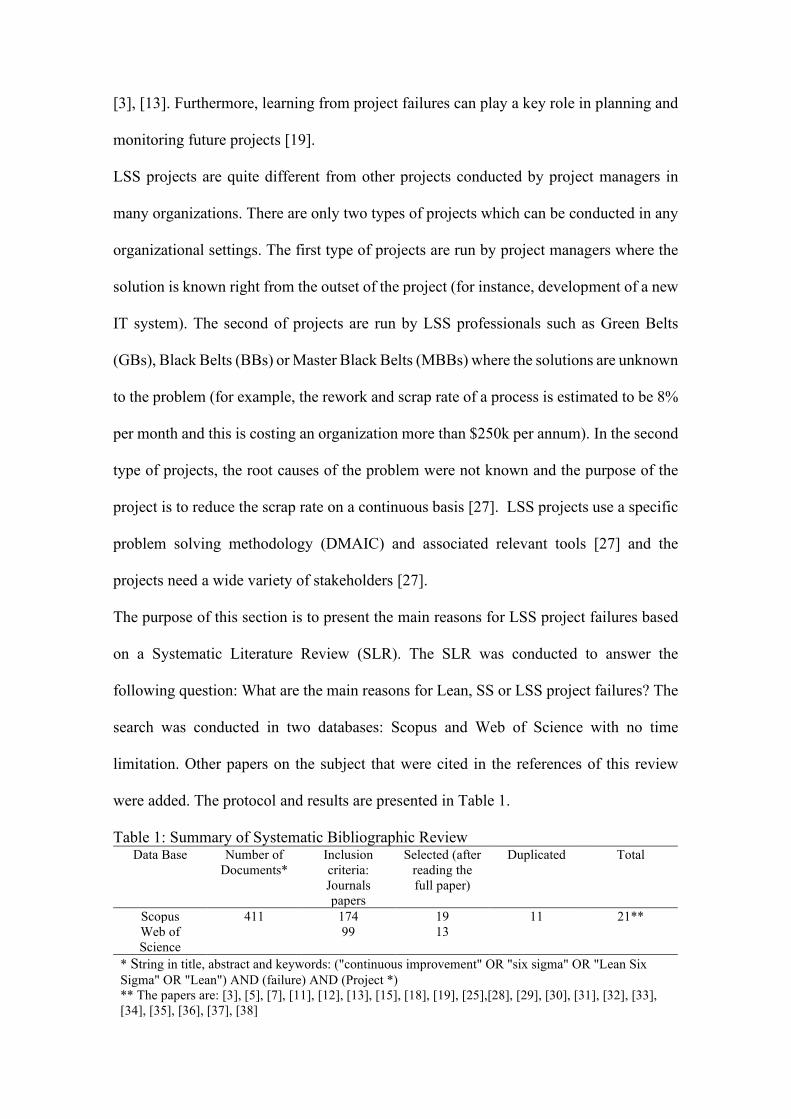
The purpose of this section is to present the main reasons for LSS project failures based
on a Systematic Literature Review (SLR). The SLR was conducted to answer the
following question: What are the main reasons for Lean, SS or LSS project failures? The
search was conducted in two databases: Scopus and Web of Science with no time
limitation. Other papers on the subject that were cited in the references of this review
were added. The protocol and results are presented in Table 1.
Table 1: Summary of Systematic Bibliographic Review Data Base Number of
Documents* Inclusion criteria: Journals papers
Selected (after reading the full paper)
Duplicated Total
Scopus 411 174 19 11 21** Web of Science
99 13
* String in title, abstract and keywords: ("continuous improvement" OR "six sigma" OR "Lean Six Sigma" OR "Lean") AND (failure) AND (Project *) ** The papers are: [3], [5], [7], [11], [12], [13], [15], [18], [19], [25],[28], [29], [30], [31], [32], [33], [34], [35], [36], [37], [38]
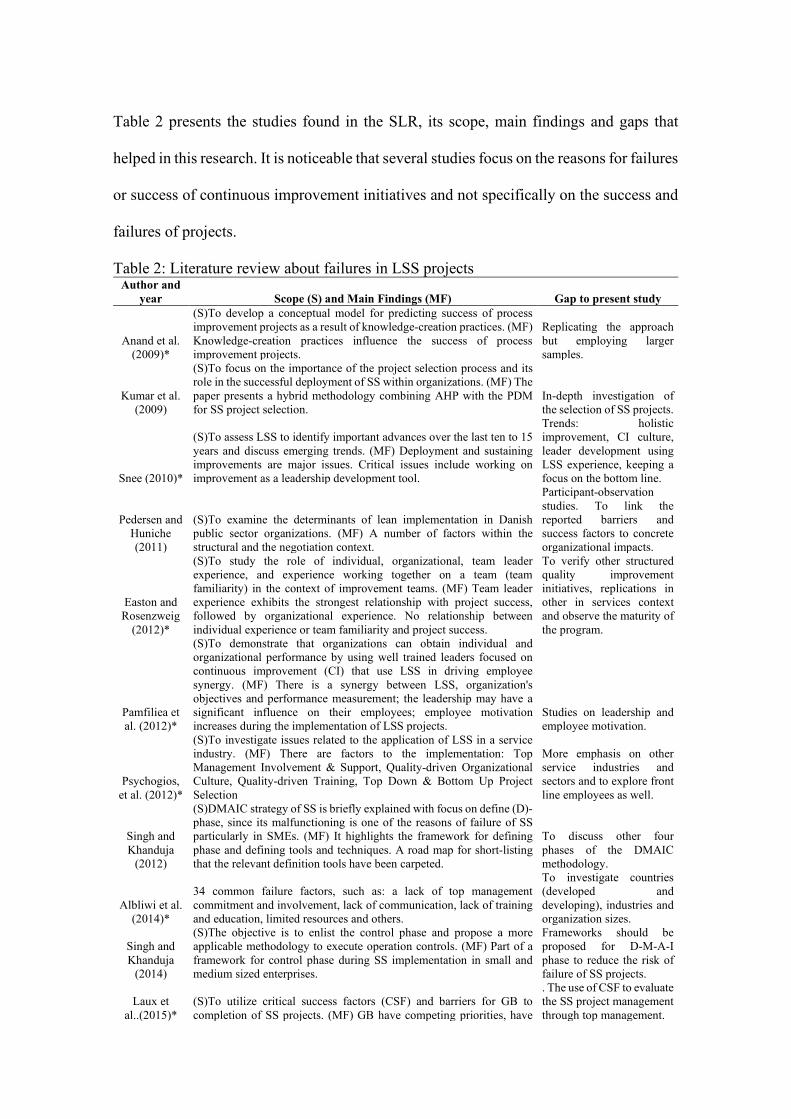
Table 2 presents the studies found in the SLR, its scope, main findings and gaps that
helped in this research. It is noticeable that several studies focus on the reasons for failures
or success of continuous improvement initiatives and not specifically on the success and
failures of projects.
Table 2: Literature review about failures in LSS projects Author and
year Scope (S) and Main Findings (MF) Gap to present study
Anand et al. (2009)*
(S)To develop a conceptual model for predicting success of process improvement projects as a result of knowledge-creation practices. (MF) Knowledge-creation practices influence the success of process improvement projects.
Replicating the approach but employing larger samples.
Kumar et al. (2009)
(S)To focus on the importance of the project selection process and its role in the successful deployment of SS within organizations. (MF) The paper presents a hybrid methodology combining AHP with the PDM for SS project selection.
In-depth investigation of the selection of SS projects.
Snee (2010)*
(S)To assess LSS to identify important advances over the last ten to 15 years and discuss emerging trends. (MF) Deployment and sustaining improvements are major issues. Critical issues include working on improvement as a leadership development tool.
Trends: holistic improvement, CI culture, leader development using LSS experience, keeping a focus on the bottom line.
Pedersen and Huniche (2011)
(S)To examine the determinants of lean implementation in Danish public sector organizations. (MF) A number of factors within the structural and the negotiation context.
Participant-observation studies. To link the reported barriers and success factors to concrete organizational impacts.
Easton and Rosenzweig
(2012)*
(S)To study the role of individual, organizational, team leader experience, and experience working together on a team (team familiarity) in the context of improvement teams. (MF) Team leader experience exhibits the strongest relationship with project success, followed by organizational experience. No relationship between individual experience or team familiarity and project success.
To verify other structured quality improvement initiatives, replications in other in services context and observe the maturity of the program.
Pamfiliea et al. (2012)*
(S)To demonstrate that organizations can obtain individual and organizational performance by using well trained leaders focused on continuous improvement (CI) that use LSS in driving employee synergy. (MF) There is a synergy between LSS, organization's objectives and performance measurement; the leadership may have a significant influence on their employees; employee motivation increases during the implementation of LSS projects.
Studies on leadership and employee motivation.
Psychogios, et al. (2012)*
(S)To investigate issues related to the application of LSS in a service industry. (MF) There are factors to the implementation: Top Management Involvement & Support, Quality-driven Organizational Culture, Quality-driven Training, Top Down & Bottom Up Project Selection
More emphasis on other service industries and sectors and to explore front line employees as well.
Singh and Khanduja
(2012)
(S)DMAIC strategy of SS is briefly explained with focus on define (D)-phase, since its malfunctioning is one of the reasons of failure of SS particularly in SMEs. (MF) It highlights the framework for defining phase and defining tools and techniques. A road map for short-listing that the relevant definition tools have been carpeted.
To discuss other four phases of the DMAIC methodology.
Albliwi et al. (2014)*
34 common failure factors, such as: a lack of top management commitment and involvement, lack of communication, lack of training and education, limited resources and others.
To investigate countries (developed and developing), industries and organization sizes.
Singh and Khanduja
(2014)
(S)The objective is to enlist the control phase and propose a more applicable methodology to execute operation controls. (MF) Part of a framework for control phase during SS implementation in small and medium sized enterprises.
Frameworks should be proposed for D-M-A-I phase to reduce the risk of failure of SS projects.
Laux et al..(2015)*
(S)To utilize critical success factors (CSF) and barriers for GB to completion of SS projects. (MF) GB have competing priorities, have
. The use of CSF to evaluate the SS project management through top management.

time constraints and lack project management skills that reduce timely completion of SS projects.
Salah (2015)
(S)To investigate project selection, prioritization and classification. (MF) It presents a model to select the proper projects of highest priority. It presents an integrated framework for CI, project selection, prioritization and other business blocks.
All CI projects should follow DMAIC and study project selection, prioritization and classification.
Vinodh and Swarnakar
(2015)
(S)To select the optimal LSS project using hybrid fuzzy-based Multi-Criteria Decision-Making (MCDM) approach. (MF) The study integrated fuzzy DEMATEL–ANP–TOPSIS to select the optimal LSS project.
The method could be tested in several industrial scenarios.
Marzagão and Carvalho
(2016)*
(S)To identify and understand the relationship between CSF for SS programs and its projects performance. (MF) Not all the claimed CSF are relevant for project performance, what could direct the effort of companies.
An analysis of the measurable results of a SS project portfolio.
Yousef and Hadi-
Vencheh (2016)
(S)To compare prioritization methods. To select the optimal projects is important to reduce the risk of failure in SS. (MF) Multi-criteria decision-making (MCDM) techniques are more reliable in comparison with DEA, because decision-maker’s point of view is more effective in MCDM techniques.
Comparison of different types of methods for prioritizing projects.
Albliwi et al. (2017)*
(S)To critically assess the current status of LSS implementation in Saudi Arabian organizations. (MF) The implementation of LSS is still in the early stages considering factors such as years of deploying LSS, LSS infrastructure, level of awareness of LSS and impact of LSS on business functions.
Analyze the model in other contexts and countries. Deeper analysis with interviews targeting Champions, MBBs, BBs and GBs.
Ambekar and Hudnurkar
(2017)
(S)To identify the latent constructs of various barriers affecting SS implementation in Indian industries. (MF) The study proposes five constructs: role of top management, cultural change, expected attitude, availability of resources, and level of quality maturity, to overcome barriers in SS.
To verify if the constructs positively influences the success of SS project implementation.
McLean et al. (2017)
(S)To provide a systematic literature review detailing why CI initiatives within manufacturing environments may fail. (MF) The failures were grouped under eight core themes: Motives & Expectations, Culture & Environment, Management Leadership, Implementation, Training, Project Management, Employee Involvement, and Feedback & Results.
Development of an implementation framework through empirical research, mainly for small and medium organizations.
Yadav and Desai (2017)
(S)To identify and prioritize the barriers of LSS for its productive implementation. (MF) The study identifies 27 critical barriers that obstruct the LSS implementation. The barriers were categorized: strategy, technology, organizational, social-cultural and individual.
Prioritization of these barriers will help the practitioners to develop the strategies to tackle the barriers.
Parsnani and Deogaonkar
(2018)
(S)To provide an in-depth analysis about the role of Leadership in SS methodology and the success or failure of the projects. (MF) Factors for SS success are top management involvement, to align the change initiative to the business strategy and goals, creating the organizational culture and providing the necessary resources.
Investigation of the involvement and support of management for the success of the projects.
Antony et al. (2018)
(S)To provide lean and SS professionals and researchers of tomorrow with Ten Commandments of LSS. (MF) The Ten Commandments: alignment of LSS with strategy, project selection, selection of top talent, leadership for LSS, effective training, reward and recognition system, LSS sustainability, linking LSS with organizational learning and Innovation, linking LSS with environmental management and LSS and Big Data.
Global study to evaluate the commandments using various leading academics and practitioners of Lean and SS topics.
DeSanctis et al. (2018)
(S)To study the effect of factors related to national culture and company characteristics of lean implementation barriers. (MF) National culture dimensions, such as Performance Orientation and Gender, influence lean management success. Factors of individuals such as Uncertainty Avoidance, Future Orientation and Institutional Collectivism also help to support a lean culture and overcome human and cultural barriers.
Investigation in companies from different sectors. To verify the impact of national culture in lean success and barriers.
García-Alcaraz et al.
(2018)*
(S)To identify the relationships between managerial commitment, SS implementation strategy, investments in human resources and the economic benefits obtained. (MF) Managerial commitment is the basis for SS success, but requires an implementation strategy focused on customer needs, which must integrate training and teamwork. Managers must have a reward program.
To integrate other variables: management of knowledge generated, the communication and cooperation and investment made in education and training.
Hadi-Vencheh and
Yousef (2018)
(S)A new data envelopment analysis (DEA) model to reduce the risk of failure in SS projects and linear discriminate analysis to examine the validity. (MF) The proposed model is a suitable tool for selecting SS projects.
To use imprecise numbers such as fuzzy numbers to smooth the challenge of exact forecasting the values of the projects’ criteria.
Iyede et al. (2018)
(S)It examines the key success and failure factors, benefits and quality tools influencing LSS initiatives deployment. (MF) Top management commitment, understanding the LSS methodology, tools and techniques, integrating LSS to business strategy, organizational cultural change and training and education were the top success factors.
Comparison of the factors to other countries.
Sreedharan et al. (2018)
(S)Identify the vital failure factors of LSS initiatives. (MF) The study identified 44 critical failure factors and ranked them through decision makers. In addition, the TOPSIS SIMOS approach ranked the vital failure factors enabling the management to avert the LSS initiative from failures.
To use the TOPSIS SIMOS approach to health care, accounting and finances, logistics and public utilities.
Antony et al. (2019)
(S)To present the results of a pilot survey highlighting the most common reasons for process improvement project failures. (MF) The main reasons for project failure include: resistance to change, lack of commitment and support from top management and incompetent teams
Investigation in several countries and types of companies (manufacturing and service).
Antony and Gupta (2019)
(S)To provide the top ten reasons of process improvement projects termination or failure to Lean and SS professionals and researchers. (MF) The top ten reasons: lack of commitment from top management; poor communication; incompetent team; inadequate training and learning; faulty selection of methodology and tools/techniques; inappropriate rewards and recognition system; scope creepiness; sub-optimal team size and composition; inconsistent monitoring and control; and resistance to change.
A global study to critically evaluate the reasons behind process improvement project failures based on a case-study approach.
Singh et al. (2019)
(S)To investigate the barriers of LSS and develop the interrelationship among them using interpretive structural modeling (ISM) and Cross Impact Matrix-Multiplication Applied to Classification (MICMAC). (MF) The ISM model indicates that insufficient management commitment and involvement, lack of resources, lack of training and education, lack of strategic thinking, lack of training funds are strategic factors.
Real-time execution of LSS barrier model at shop floor and structural equation modeling (SEM) can be adopted for validation of the present ISM model.
Singh and Rathi (2019)
(S)To expose the detailed review for benefits and challenges about implementation of LSS in business organization. (MF) It presents the critical barriers and benefits of LSS implementation in manufacturing, health care, human resource, financial and education.
Prioritization and domination of identified major barriers in various sectors individually.
Sony et al. (2019)
(S)The purpose is to answer the question why do organizations discontinue LSS initiatives? (MF) This study finds 11 factors: poor success rate, unrealistic expectations from LSS, unsustainable results, misuse of statistics, large tool set, unsupportive and uncommitted top management, lack of training and development, lack of synergy of LSS and business strategy, lack of link between LSS and customer needs, wrong projects selection and premature discontinuation of LSS experts.
Considering the low success rate of LSS projects, future studies should explore the failure rate in different sectors
Sreedharan and Sunder
(2018)*
(S)To conceptualize a novel LSS framework, and further test it for practical implications.(MF) Focused gaps and shortcomings of the DMAIC framework for LSS project management. A novel approach to LSS project management by conceptualizing ‘SDMMAICS’ framework validated the in real world.
Validation of the SDMMAICS framework in services context.
*Articles found to appear in the SLR article references
The causes of the low success rates for improvement projects may be due to various
factors, ranging from poor project selection to a lack of managerial support [3]. Antony
and Gupta [18] wrote an article based on the reasons/factors for LSS project failures. The
reasons that were identified were then divided into the ten factors presented by Antony
and Gupta [18]. This current research presents each factor broken down into its root
causes (variables) for a more detailed analysis of why improvement projects fail.
2.1 Failure factors of LSS projects
Lack of commitment and support from top management
Successful projects require the commitment of top management to meet the defined
objectives [18]. The results of improvement projects increase proportionally with the
intensity of top management’s involvement [26]. Top management commitment is vital
for LSS deployment, and is a critical factor in implementing LSS, as a lack of
commitment can result in imminent project failure [2], [5].
Poor communication practices
Good communication contributes positively to developing continuous improvement
projects [6]. Communication practices should be developed and applied during project
development, given that gaps in communication are a limiting factor in project
development [5], [18]. Simple practices can improve communication, such as conducting
meetings with core team members [1]. Inadequate communication on the progress,
development, driving, gains, and benefits brought about by LSS projects to the employees
and stakeholders is a recurring problem in LSS project failures [28].
Incompetent teams
The first step in project management is to properly select a project team. This is then
followed by defining the project goals [13]. It is important to identify the right personnel
before starting a project [1]. One specific problem, for example, is having the wrong
people assigned to certain projects [1], [13]. Lack of adequately skilled team members is
one main reason behind project failures [18], [29].
Inadequate training and learning

Inadequate training is also a factor that can lead to LSS project failures [2], [3]. Training
helps develop employee awareness, knowledge, and the hard/soft skills that are associated
with LSS tools and practices [26]. Albliwi et al. [24] affirm that few organizations
encourage employees to learn from each other’s experiences, or from errors during the
implementation process, much less from failed LSS projects. This learning process is a
critical aspect.
Faulty selection of a process improvement methodology and associated tools/techniques
The results of improvement projects are achieved through the structured application of
tools and techniques [7]. The integration of Lean and SS leads to a wide range of tools,
and this can make it harder to understand and use them [13], [14]. In addition to properly
choosing tools, adequate resource allocation is required to analyze, retrieve, and collect
data that will be used as inputs for the tools. Furthermore, one of the main resources is
time for teams to work on projects [1], [11], [18].
Inappropriate rewards and recognition system/culture
Motivation greatly impacts continuous improvement projects [6]. In order to maintain
interest and motivation, employees should be rewarded for their efforts in improvement
projects [39]. The lack of policies to recognize and reward success and appropriate
recognition and rewards for project members are problematic for the progress of the
project [2], [1], [28], [39].
Scope creep
The scope of an improvement project is an very important aspect, since it determines the
results to be obtained, including the financial [12]. The project scope is one of the top
factors that influences success for improvement projects [18], [19]. A poorly defined
project scope is one of the main problems in managing improvement projects [1].
Sub-optimal team size and composition

Other reasons for project failures include sub-optimal or inadequate team size, and little
to no optimization of the team size [1]. For example, an adequate team size is 4-6
members [1]. The team size should also consider the project scope, duration, and
complexity [18]. Another important issue is the participation of key individuals, such as
facilitators [1], MBBs for technical support [1] and people from the functional units[18].
Inconsistent monitoring and control (lack of expert supervision)
Control is the last phase of the DMAIC methodology, and contains activities that ensure
the sustainability of project improvements by tracking key performance processes [29].
Consistently monitoring and controlling processes is key to the long-term sustainability
of project benefits [11], [14]. Better LSS control helps avoid project failures, and
management should be committed to making this happen [5]. Lack of process thinking
and process ownership are two reasons for discontinued results and errors in correctly
identifying improvements [29].
Resistance to change (partial cooperation by employees)
Resistance to change in LSS improvement projects can be extremely high and can occur
at all levels [6]. To guarantee successful LSS deployment, organizations need to change
their culture [2]. Employee motivation is essential for incorporating LSS into the
company culture, especially when facing challenges, and managers should help in this
process [6]. People must be authorized to apply changes if LSS is to be implemented
effectively [31]. Reduced employee involvement is one major obstacle to organizational
cultural change [6].
The factors and variables that were identified in the literature review are presented in
Table 7.
2.2 Research Questions

The low success rate of LSS projects is an important factor for decisions in deploying or
discontinuing LSS initiatives [1], [3], [5]. However, there are few empirical studies on
this issue especially considering a global perspective [19]. LSS projects use a specific
methodology (DMAIC) [13], [14], each phase assists and provides direction in project
management [7]. Identifying the DMAIC phase in which the project ends can assist in
identifying the reasons for failure. In addition to the failure phase, they can also help to
identify the main reasons for these failures, since they can have problems on an individual
level, team level or organizational level [19]. Therefore, the following research questions
(RQs) have been proposed:
RQ1: What is the percentage of unsuccessful LSS projects in the perception of experts?
RQ2: What is the percentage of termination of LSS projects at each phase of DMAIC?
RQ3: At what level do most LSS failures occur (project level, individual level, or
corporate level)?
There may be several reasons for failures in LSS projects [3], [18] and identifying and
prioritizing the main reasons can help in eliminating their causes [19]. For a deeper
analysis, we consider respondents' perspectives that may change the order of
prioritization. The first analysis considers the perspective of the sector. There may be
institutional and contextual factors that affect LSS application and projects, varying by
sector i.e. the service, manufacturing, or even the public sector [26], since different
organizations have specific complexities [26]. Another perspective of analysis is the
respondent's role in the Belt system. These differences in perception can occur because
MBBs are involved in project definition and selection, and developing training materials,
managing the improvement team while mentoring BBs and GBs [40], [41], [42]. GBs are
not required to have the same level of knowledge in the use of tools or leadership skills

since they assist BBs on major projects or lead teams in smaller and specific projects [40],
[41], [42].
The culture and business conditions of developing and developed nations are different
and this influences many factors regarding LSS deployment [43]. The level and rate of
implementation of LSS practices are higher in developed economies and there are
difficulties in implementing the LSS in developing countries [44], [45]. In addition,
empirical studies are still limited in developing countries [43]. Developed and developing
economies can be classified by country or continent [46]. Another factor that can
influence respondents' perceptions is national culture, more specifically
collectivism/individualism because the success of LSS projects and many tools and
practices are inherently based on a group oriented working culture [25], [47]. Therefore,
the following research questions (RQs) have been proposed:
RQ4: What are the top five critical factors for LSS project failures?
RQ5: Is there a difference in the perceptions of critical factors among manufacturing
and service experts?
RQ6: Is there a difference in the perceptions of critical factors based on the role of the
respondent in the Belt system?
RQ7: Is there a difference in the perception of critical factors when considering the
respondent’s continent (South America, Asia or Europe), the country's level of
development, or national culture of the given country (individualism/collectivism)?
3. Research Methodology
The study conducted a literature survey, preparing and testing the survey, analyzing the
sample and data, results, and discussion. The research steps are presented in the flowchart
in Figure 1 and are explained in the subsequent subsections.
3.1. Data collection

The research instrument used for data collection was a web survey directed to LSS experts.
The pilot test of the survey questionnaire was developed with 6 academic professionals
with experience in LSS for research and peer-reviewed papers on the subject, and with 3
practitioners with extensive experience in leading and participating in LSS projects, either
BBs or MBBS. The pilot test allowed for the questions to be adjusted, in turn helping
eliminate measurement errors (writing and understanding the questions) and ensuring that
no constructs have been omitted [48].
Figure 1: Research methodology flowchart
The questionnaire was written in Google Forms, comprised of three parts: general
participant information (sector, country, experience), characterization of the failure rate
(moment of failure and failure rate), 51 statements about the main reasons for LSS project
failures identified from the literature review. Statements relating to project failure were
grouped into ten failure factors (constructs). The structure of part three of the
questionnaire, i.e. the main constructs and variables, is presented in Table 7. A Likert
scale, which is used extensively in research surveys of this type, from 1–5 (very rarely –
very often) was used to measure the variables [49], [50].
The final web survey link was sent to 1000 experts that were identified in social networks
as belonging to groups linked to LSS and having SS Belt training, following several
studies in the area (e.g. [20], [32], [33], [37]). The sample included LSS specialists with
Systematic literaturereview
Factors and variables of failure and research gaps
Literature Review
Researchquestions
Conducting the Survey
Pilot test
Questionnaire sent to 1000 experts
Sample of 201 valid responsesResearch
instrument
Use of PLS-SEM for the formation of
constructs
Conducting the survey
Sample and data analysis
Sample characterization
Results
Main reasons for LSS project failure
Unsuccessful andtermination rate
Group analysis:• Industry x service• GB, BB and MBB• Continents• Developing and
developed• National culture
Discussion Implications
Managerial implications
Discussion of the main findings
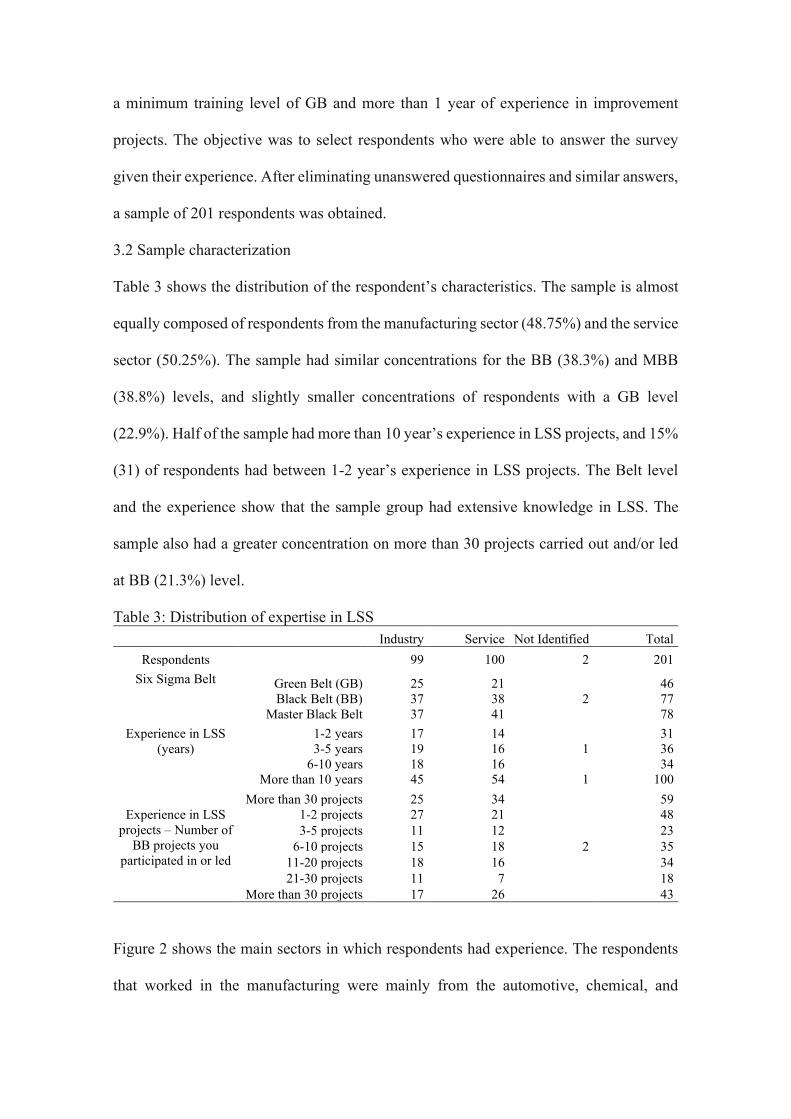
a minimum training level of GB and more than 1 year of experience in improvement
projects. The objective was to select respondents who were able to answer the survey
given their experience. After eliminating unanswered questionnaires and similar answers,
a sample of 201 respondents was obtained.
3.2 Sample characterization
Table 3 shows the distribution of the respondent’s characteristics. The sample is almost
equally composed of respondents from the manufacturing sector (48.75%) and the service
sector (50.25%). The sample had similar concentrations for the BB (38.3%) and MBB
(38.8%) levels, and slightly smaller concentrations of respondents with a GB level
(22.9%). Half of the sample had more than 10 year’s experience in LSS projects, and 15%
(31) of respondents had between 1-2 year’s experience in LSS projects. The Belt level
and the experience show that the sample group had extensive knowledge in LSS. The
sample also had a greater concentration on more than 30 projects carried out and/or led
at BB (21.3%) level.
Table 3: Distribution of expertise in LSS Industry Service Not Identified Total
Respondents 99 100 2 201 Six Sigma Belt Green Belt (GB) 25 21 46
Black Belt (BB) 37 38 2 77 Master Black Belt 37 41 78
Experience in LSS (years)
1-2 years 17 14 31 3-5 years 19 16 1 36
6-10 years 18 16 34 More than 10 years 45 54 1 100
More than 30 projects 25 34 59 Experience in LSS
projects – Number of BB projects you
participated in or led
1-2 projects 27 21 48 3-5 projects 11 12 23
6-10 projects 15 18 2 35 11-20 projects 18 16 34 21-30 projects 11 7 18
More than 30 projects 17 26 43 Figure 2 shows the main sectors in which respondents had experience. The respondents
that worked in the manufacturing were mainly from the automotive, chemical, and

pharmaceutical sectors. With respect to the service sector, 36 (17.9% of the sample)
respondents were LSS or business improvement consultants. The number of different
sectors (43 in total) shows the diversity of the sample, thus compiling different LSS
application perspectives.
Figure 2: Sectors distribution in the sample
Figure 3 shows samples from four continents. 64 (31.8%) respondents were from South
America, 17 (8.5%) from North America, 62 (30.8%) from Europe, and 43 (21.4%) from
Asia. 15 respondents (7.5%) did not enter information about their country, indicating only
that they act globally or omitted the information altogether.
Figure 3: Sample distribution by country
Respondents’ countries were divided into developed and developing countries to allow
for subsequent comparative analysis. We used information on gross national income
05
10152025303540
Aut
omot
ive
Che
mic
als
Phar
mac
eutic
alFo
od a
nd B
ever
ages
Met
als
Elec
troni
cA
grib
usin
ess
Hom
e ap
plia
nces
Elec
tric
Prod
uct
Min
ing
App
arel
Hea
vy M
achi
nery
Sem
icon
duto
rO
il an
d ga
sC
onsu
lting
Info
rmat
ion…
Fina
ncia
l/Ban
king
Hea
lthca
reEd
ucat
ion
Mar
ket R
esea
rch
Ener
gyTe
leco
mPu
blic
Sec
tor
Hos
pita
lity
Manufacturing Service
17 1410
6 6 5 5 4 2 2 2 2 2 2
36
10 9 6 6 5 4 3 2 2
62
1 1
15
2
23
7 5 4 4 3 3 3 2 2 1 1 1 1 1 1
39
1 1 1 10
10203040506070
Bra
zil
Mex
ico
Arg
entin
a
USA
Can
ada
UK
Net
herla
nds
Irel
and
Ger
man
y
Spai
n
Cze
ch re
publ
ic
Italy
Pola
nd
Portu
gal
Swed
en
Luxe
mbo
urg
Slov
akia
Den
mar
k
Cro
atia
Fran
ce
Hun
gary
Indi
a
Turk
ey
Om
an
Phili
ppin
es
Ban
glad
esh
S. America N.America
Europe Asia

(GNI) per capita adjusted annually available from the World Bank [46], [51]. Developing
countries have low and middle income, while developed countries have high income [51],
[52]. Table 4 shows the sample separation in developing and developed countries.
Table 4: Stage of development
Stage of development
Countries Number of respondents
Developing Brazil, India, Mexico, Argentina, Turkey, Philippines and Bangladesh
106
Developed UK, USA, Netherlands, Ireland, Germany, Spain, Czech Republic, Italy, Poland, Portugal, Sweden, Canada, Luxembourg, Slovakia, Denmark, Croatia, France, Hungary and Oman
80
The respondents' countries were divided in relation to national culture, in relation to the
issue of individualism/collectivism, given that the projects are an activity carried out as a
team. National collectivism culture is measured through the IDV culture scores provided
by Hofstede (Table 5). The scores were divided in order to separate the most
individualistic countries (IDV> 50) and the most collectivist countries (IDV <50). As can
be seen, there is a lot of similarity between tables 4 and 5.
Table 5: Stage of development National culture
Countries (IDV) Number of respondents
Individualistic Brazil (38), India (48), Mexico (30), Argentina (46), Turkey (37), Philippines (32), Portugal (27), Croatia (33) and Bangladesh (20)
109
Collectivist UK (89), USA (91), Netherlands (80), Ireland (70), Germany (67), Spain (51), Czech Republic (58), Italy (76), Poland (60), Sweden (71), Canada (80), Luxembourg (60), Slovakia (52), Denmark (74), France (71), Hungary (80) and
76
Note: Oman IDV was not found
3.3 Data analysis
The questionnaire was structured so that each of the LSS failure factors was observed by
means of observable variables. This choice was made because the reasons for failure are
abstract. It is possible to indirectly measure the overall concept of the factor by combining
several items [50]. This ensures that measurement is more accurate and more likely to
represent all of the different conceptual aspects [50]. It is possible to decrease the
measurement error, since it is less likely that all items will be poorly worded [50]. In the
Structural Equation Modeling approach several measures are combined to form a single
composite score - the score of the construct [50].
To identify the factor score, the Partial Least Square – Structural Equation Modeling
(PLS-SEM) was chosen because PLS-SEM is considered to be the best approach for this
purpose [53]. A disadvantage is that PLS-SEM parameter estimates are not optimal
regarding bias and consistency [53], but an advantage is that it is suitable for analyzing
data that does not follow a normal distribution [50]. PLS-SEM results in more precise
estimates for factor scores, since they are calculated as exact linear combinations of the
values of all the items associated with a construct [50], [53]. The scores are calculated by
weighted composites of observable variables, which facilitates accounting for
measurement error [50]. The scores allow researchers to easily prioritize factors and to
identify differences for potential improvements and take managerial decisions [53].
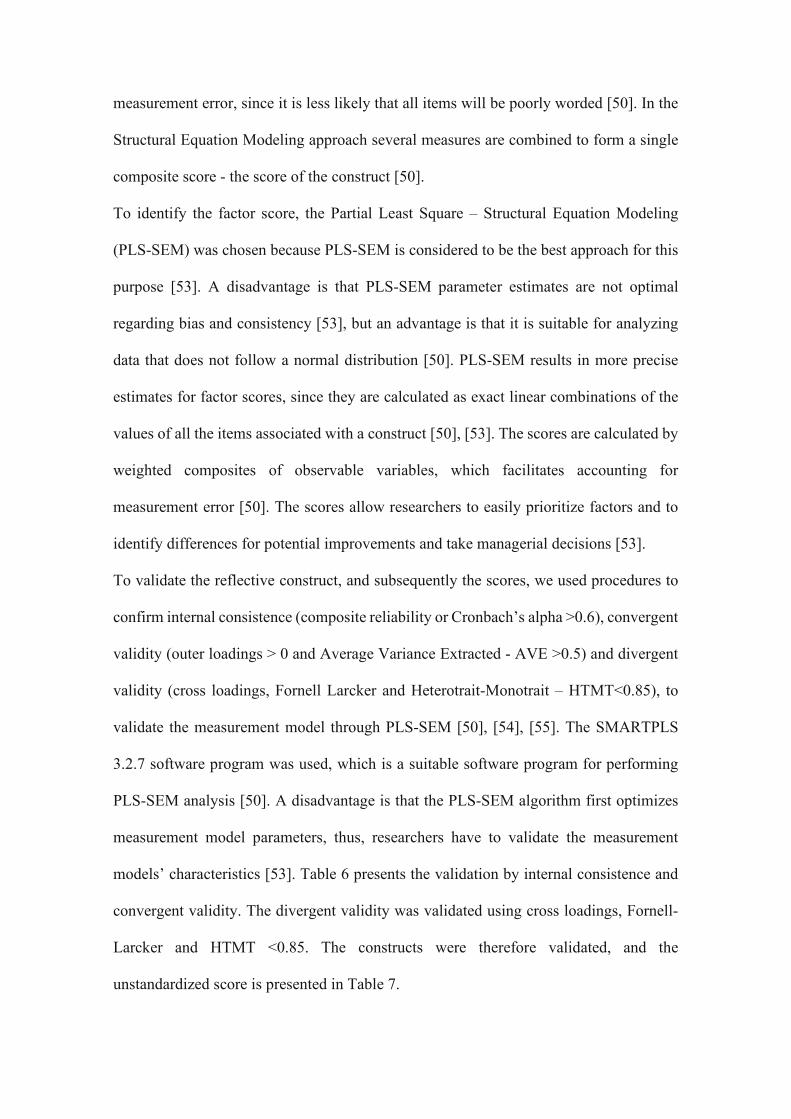
To validate the reflective construct, and subsequently the scores, we used procedures to
confirm internal consistence (composite reliability or Cronbach’s alpha >0.6), convergent
validity (outer loadings > 0 and Average Variance Extracted - AVE >0.5) and divergent
validity (cross loadings, Fornell Larcker and Heterotrait-Monotrait – HTMT<0.85), to
validate the measurement model through PLS-SEM [50], [54], [55]. The SMARTPLS
3.2.7 software program was used, which is a suitable software program for performing
PLS-SEM analysis [50]. A disadvantage is that the PLS-SEM algorithm first optimizes
measurement model parameters, thus, researchers have to validate the measurement
models’ characteristics [53]. Table 6 presents the validation by internal consistence and
convergent validity. The divergent validity was validated using cross loadings, Fornell-
Larcker and HTMT <0.85. The constructs were therefore validated, and the
unstandardized score is presented in Table 7.

It was necessary to conduct analysis between groups in order to answer the research
questions. For these comparisons nonparametric tests were used to compare the groups
(Mann-Whitney or Kruskal-Wallis) given the qualitative ordinal and non-normal
distribution data that was analyzed [56].
Table 6: Internal consistence and convergent validity
Construct Cronbach's Alpha*
Composite Reliability* (AVE)**
Lack of commitment from top management 0.78 0.85 0.53
Resistance to change 0.84 0.88 0.60
Inappropriate rewards and recognition system 0.93 0.97 0.94
Inconsistent monitoring and control 0.79 0.87 0.62
Poor communication 0.90 0.92 0.63
Incompetent team 0.90 0.92 0.58
Inadequate training and learning 0.82 0.89 0.74
Sub-optimal team size and composition 0.83 0.87 0.53
Scope creep 0.83 0.90 0.75
Faulty selection of methodology and its associated tools 0.87 0.90 0.52
*All values are > 0.7 threshold value **All values are > 0.5 threshold value
4. Results
4.1 Unsuccessful and termination rate
When asked about the rate of unsuccessful LSS projects (Figure 4), respondents said that
between 11-20% (22% of sample) and 21-30% (20% of sample) of the projects had failed.
This shows that there is a significant rate of unsuccessful projects, and further highlights
the need for studies on the causes of failures.
Figure 4: Percentage of unsuccessful projects
12%15%
22%20%
12%
7%10%
0%
5%
10%
15%
20%
25%
Less than 5% Between 6-10%
Between 11-20%
Between 21-30%
Between 31-40%
Between 41-50%
More than50%

The project termination rate was identified in the different phases of DMAIC (Figure 5).
The highest concentration of responses was less than 5% for all phases. However,
respondents (approximately 25% of the sample) pointed to project termination rates
between 6-10%, in almost all phases except for control phase, where only 11% of the
specialists measured termination rates between 6-10%. Additionally, 16% and 13% of
respondents indicated that termination rates were between 11-20% in the measure and
analyze phases. These phases require data, knowledge, and commitment from different
areas within the company. This may lead to higher termination rates. Control phase had
the largest number of respondents who said that less than 5% of projects were terminated
in this phase (65%). This shows that the DMAIC cycle generates project maturity, and
when it reaches this phase, it already has high added value and characteristics conducive
for completion.
Figure 5: Termination rate considering DMAIC phases
4.2 Main reasons for LSS project failure When asked about the level at which LSS project failures occur, 42% of those sampled
stated that it was at the corporate level, 31% stated that it was at the project level, and
only 21% stated it was at the individual level. Identifying the causes of failures at the
corporate and project level is essential for decreasing failure rates.
53%48% 50% 54%
65%
24% 27% 30%25%
11%10%16% 13%
9% 6%6% 5% 4% 5% 3%1% 1% 0% 2% 4%1% 1% 1% 3% 2%4% 0% 1% 2%8%
0%
10%
20%
30%
40%
50%
60%
70%
Define Measure Analyse Improve Control
Less than 5% Between 6-10% Between 11-20% Between 21-30%
Between 31-40% Between 41-50% More than 50%

Table 7: Construct scores and mean of observable variables Construct
Score Mean Variables
Authors Mean
Lac
k of
com
mitm
ent a
nd su
ppor
t fro
m to
p m
anag
emen
t (TM
)
3.53
TM1 - Lack of TM commitment in project conceptualization (selection and prioritization)
[2], [3], [5], [11], [13]-[15], [18], [25], [26], [28], [33]-[36], [38] 3.71
TM2 - Lack of TM commitment in project planning (resource allocation)
[11], [26]-[37] 3.64
TM3 - Lack of TM commitment in project implementation (monitoring and controlling)
[23], [26] 3.50
TM4 – Lack of sponsors commitment to aligning project objectives with the corporate strategy
[3], [11], [25], [26] 3.49
TM5 - Lack of champions commitment to aligning project objectives with the corporate strategy
[3], [11], [25], [26], [32] 3.31
Res
ista
nce
to c
hang
e
3.24
CH1 - Lack of employee involvement in problem solving [6], [19], [37] 3.10 CH2 – Lack of immediate action of management to the causes of employee’s resistance or underperformance
[1],[18], [26], [28] 3.44
CH - 3 Employee’s resistance to change [2], [6] 3.58 CH4 - There is no integration of the employees’ opinions in DMAIC phases [18], [37] 2.87 CH5 - There are no strategies to convince resistant employees to maintain a positive attitude in improvement projects [6], [18] 3.24
Inap
prop
riat
e re
war
ds
syste
m
3.22
RE1- Lack of policies to recognize and reward success [2], [26], [32] 3.23 RE2 - Lack of appropriate recognition and rewards for project members
[2], [26], [28], [35], [39] 3.20
Inco
nsis
tent
m
onito
ring
and
cont
rol
2.94
CN1- There is inconsistent monitoring and control of the project processes by a process expert [26], [29] 3.04 CN2 - There is not a permanent process improvement expert for consistent monitoring and control [18], [29] 2.95 CN3 - Lack of a monitoring system designed to track the progress of a project in real-time
[1], [29], [39], [23] 2.93
CN4 - The report of the project monitoring is not disseminated (visual display at the workplace, seminar, meeting, etc.) [1], [26] 2.82
Poor
com
mun
icat
ion
prac
tices
2.84
CM1 - Barriers in communication surrounding the project design and execution [1], [5], [18] 2.85 CM2 - Lack of development of communication practices during the project execution [1], [18] 2.86 CM3 - Lack of communication among project stakeholders [5], [39] 3.10 CM4 -Lack of communication about the progress of the project [28], [37] 2.92 CM5 - Poor communication (i.e., timeliness and usefulness information) [5], [18] 2.88 CM6 - Poor communication among team members (i.e. openness, discussion efficiency and effectiveness) [18], [28], [37] 2.65 CM7 - Lack of using information technologies for knowledge sharing across various projects [20] 2.46
Inco
mpe
tent
team
2.83
TE1 - Lack of a common goal among team members [13], [18] 2.83
TE2 - Lack of adequately skilled team members [1], [2], [5], [13], [21] 2.92
TE3 - Lack of problem-solving knowledge by team members [5], [20] 2.84 TE4 - Lack of motivation on behalf of the team members [6] 2.91 TE5 - Lack of establishing and optimizing the project team based on detailed task descriptions and allocation analysis [18], [22] 2.78 TE6 - Lack of complementing skill among project members [29], [30] 2.58 TE7 - Lack of learning new skills to respond to changes [29] 2.66 TE8 - Lack of project leadership skills necessary to lead the team [1], [2], [30] 3.18
Inad
equa
te
train
ing
and
2.82
TRA1 - Lack of strategies that support organic learning between projects [18], [24] 2.73 TRA2 - Not taking into account the characteristics of the team members in order to determine types of training and their content [18] 2.74

TRA3 – lack of continually review the links between skills, performance and training [1], [37] 3.00
Sub-
optim
al te
am si
ze
and
com
posit
ion
2.81
SIZ1 - Inadequate size of the project team (scope, duration and complexity) [1], [18] 2.67 SIZ2 - There is no optimization for the team size [1], [18] 2.43 SIZ3 - Lack of time for better team cohesion [7] 2.60 SIZ4 - Lack of project facilitators to ensure management commitment [1], [28] 3.32 SIZ5 - Inadequate representation from relevant functional units in the project team [18] 3.03 SIZ6 Lack of participation from MBB in the team as senior coaches [1], [30] 2.65
Faul
ty se
lect
ion
of p
roce
ss
impr
ovem
ent m
etho
dolo
gy a
nd
its a
ssoc
iate
d to
ols/t
echn
ique
s
2.77
MET1 - No selection of the methodology that best fits the problem [28], [29] 2.82
MET2 – No selection of tool/technique that best fits the problem [1]–[3], [28], [29] 2.73
MET3 - There isn’t enough time to data collection in order to deploy tools and techniques effectively [1], [18] 3.27 MET4 - Tools are applied in the incorrect order [18] 2.49 MET5 - There is not enough time to implement the methodologies [1], [11], [18] 3.19 MET6 - There is overuse of tools and techniques [3] 2.39 MET7 - There is underuse of tools and techniques [18] 2.60 MET8 - Lack of tools and methods to identify operation failures [18] 2.69
Scop
e cr
eep
2.77
SCO1 - There is no collaboration between project champions and project leaders to define the scope of the project [12], [18], [32] 2.81 SCO2 - There is a lack of scope management techniques [18] 2.84 SCO3 - There is a lack of proper documentation for the scope of the project outlining the responsibilities of each member [1], [18], [23] 2.68
The level of agreement with the 51 observable variables, associated with 10 different
constructs as the main reasons for LSS project failures is shown in the Table 7. The “lack
of top management commitment” is the construct with the highest score. This may explain
why the corporate was pointes as the level at which most LSS projects fail. The second
construct with highest mean was “resistance to change”. The third construct was
“inappropriate rewards and recognition system/culture”, and this may also be related to
corporate level, a consequence of corporate decisions. The fourth and fifth factors for
were “inconsistent monitoring and control”, and “poor communication practices”,
respectively.
4.3 Group analysis
The first analysis between groups (Table 8) was done to observe if there were differences
between the view of specialists who have experience in the manufacturing sector, and in
the service sector. The only construct with differences was “scope creep”, where there
was a higher mean and median in the opinion of service-experienced specialists.

Table 8: Mann-Whitney test between industry and service specialists
Construct
Industry (n=99) Service (n=100) p-
value Score mean
Score median
Score mean
Score median
Lack of top management commitment 3.49 3.60 3.56 3.59 0.59 Resistance to change 3.12 3.18 3.34 3.39 0.19 Inappropriate rewards and recognition 3.20 3.00 3.20 3.50 0.88 Inconsistent monitoring and control 2.89 3.00 2.96 3.00 0.84 Poor communication 2.72 2.72 2.92 2.95 0.15 Incompetent team 2.73 2.71 2.91 2.75 0.25 Inadequate training and learning 2.70 2.96 2.91 3.00 0.16 Sub-optimal team size and composition 2.70 2.71 2.90 2.88 0.07
Faulty selection of methodology 2.65 2.66 2.86 2.82 0.12 Scope creep 2.60 2.35 2.90 3.00 0.04* *Significant at 0.05 level
The second comparison considered the roles in the Belt system (Table 9). Analysis of the
mean and median showed that the GBs tend to evaluate the factors as more problematic,
distancing themselves, mainly from the opinion of MBBs. There is a statistically
significant difference in: "resistance to change", "inconsistent monitoring and control",
"poor communication", "incompetent team", “sub-optimal team size and composition”
and "faulty selection of methodology". MBBs have a view that failure reasons related to
"poor communication" and "incompetent team" are much less important, ranking them
ninth and eighth, respectively. The factors "inadequate training", "sub-optimal team size",
and "faulty selection of methodology" would be closer to the top rankings for MBBs.
While for GBs "inadequate training and learning" is the reason with the least impact for
LSS project failures, followed by "faulty selection of methodology", showing the
differences in MBBs and GB perceptions. BBs present a view very similar to the general
view of the study (Table 7), with a greater emphasis on "poor communication" and a small
inversion between the positions of "faulty selection of methodology" and "sub-optimal
team size and composition".

Table 9: Kruskal-Wallis test between GB, BB and MBB specialists
Constructs Green Belt (n=46)
Black Belt (n=77)
Master Black Belt (n=78) p-
value Mean Median Mean Median Mean Median
Lack of top management commitment 3.54 3.60 3.60 3.63 3.46 3.56 0.70 Resistance to change 3.49 3.61 3.28 3.35 3.05 2.99 0.03* Inappropriate rewards and recognition 3.35 4.00 3.14 3.00 3.21 3.25 0.57 Inconsistent monitoring and control 3.20 3.13 3.01 3.00 2.70 2.77 0.02* Poor communication 3.03 3.04 3.08 3.14 2.49 2.43 0.00* Incompetent team 3.03 3.01 2.98 2.84 2.56 2.46 0.01* Inadequate training and learning 2.97 3.29 2.91 2.97 2.64 2.82 0.20 Sub-optimal team size and composition 3.04 3.21 2.83 2.71 2.66 2.72 0.06**
Faulty selection of methodology 2.98 3.04 2.84 2.83 2.58 2.63 0.06** Scope creep 3.02 3.32 2.81 2.68 2.59 2.34 0.11 * Significant at 0.05 level **Significant at 0.1 level
The third analysis looked at the difference in the opinions of experts from three different
continents, South America, Europe, and Asia (Table 10). North America was not
considered due to the low number of respondents. The main differences were that the
Asian respondent group had a higher mean and median for the constructs than the other
groups. This difference was statistically significant for the “poor communication”,
“incompetent team”, “inadequate training and learning”, and "scope creep".
The “incompetent team” construct was higher than “poor communication” for both South
America and Europe. For Asian respondents it was the fourth major reason for LSS
project failures. "Inadequate training and learning" was the fifth major reason for LSS
failures for Asian respondents, showing greater difficulty with team and training when
compared to respondents from other continents. The “scope creep” factor, although
higher for Asian respondents, was the least reason from all three continents.
A comparison was made between respondents from developing and developed countries
(Table 11). The first difference is that the mean and median of respondents in developing
countries is higher than in developed countries. The main differences from developed
countries for the overview (Table 7) is that "poor communication" would be the ninth
factor with the lowest mean, while "scope creep" would be the fifth factor in the ranking.

Respondents from developing countries considered the "incompetent team" factor as the
fourth, while it would be the last for developed countries.
Table 10: Kruskal-Wallis test between specialists from distinct continents
Constructs South America (n=64) Europe (n=62) Asia (n=43)
p-level Mean Median Mean Median Mean Median Lack of top management commitment 3.46 3.60 3.53 3.58 3.77 3.81 0.23
Resistance to change 3.28 3.26 3.22 3.36 3.41 3.42 0.67
Inappropriate rewards and recognition 3.19 3.00 3.10 3.00 3.53 3.50 0.22
Inconsistent monitoring and control 3.06 3.01 2.79 2.76 3.18 3.22 0.11
Poor communication 2.98 3.19 2.58 2.63 3.20 3.29 0.00*
Incompetent team 3.00 3.00 2.60 2.57 3.28 3.23 0.00*
Inadequate training and learning 2.97 3.00 2.66 2.68 3.26 3.33 0.01*
Sub-optimal team size and composition 2.92 2.92 2.81 2.74 3.04 3.26 0.19
Faulty selection of methodology 2.86 2.95 2.78 2.76 2.92 3.11 0.64
Scope creep 2.66 2.66 2.67 2.66 3.12 3.00 0.02*
* Significant at 0.05 level
Table 11: Mann-Whitney test between respondents from developing and developed countries
Construct Developed (n=80) Developing (n=106)
p-value Score Mean Score median Score Mean Score median
Lack of top management commitment 3.52 3.58 3.57 3.62 0.60 Resistance to change 3.19 3.29 3.33 3.35 0.39 Inappropriate rewards and recognition 3.02 3.00 3.33 3.50 0.08 Inconsistent monitoring and control 2.79 2.78 3.11 3.04 0.03* Poor communication 2.58 2.61 3.06 3.23 0.00* Incompetent team 2.55 2.46 3.12 3.10 0.00* Inadequate training and learning 2.59 2.68 3.10 3.15 0.00* Sub-optimal team size and composition 2.71 2.71 2.98 3.18 0.02* Faulty selection of methodology 2.71 2.72 2.89 3.00 0.15 Scope creep 2.72 2.82 2.84 2.68 0.57
* Significant at 0.05 level
The separation of respondents by national culture, considering individualism/collectivism,
the results were very similar to separation by developed/developing countries. The Mann-
Whitney test generated equal results.
5. Discussion
This study serves as the first explorative step towards understanding the main reasons and
factors behind LSS project failures. Unlike other studies in existing literature, which focus
on the critical factors for implementing improvement approaches, i.e. Lean (e.g., [35],

[25]), SS (e.g., [11], [20], and LSS (e.g. [9]; [2]), this study focuses on carrying out
improvement projects. A more detailed analysis of the research questions shows the
following findings:
44% of the LSS experts surveyed from around the world stated that between 11% and
30% of LSS projects fail. 10% of the experts surveyed said that this rate is higher than
50%, and only a small percentage of those surveyed said that this failure rate was less
than 5%. Although several authors stress the importance of LSS project success for the
overall approach [1] and point out low success rates [3], unsuccessful projects rates have
not been clearly stated in existing literature, therefore, this study aids in clarifying this
issue.
Regarding LSS project termination rates at each phase of DMAIC, the highest
concentration of responses for all phases showed termination rates less than 5%. Measure
and analyze phases should be given special attention due to the slightly higher project
termination rates. Understanding the factors and reasons for project failures can help
identify possible actions to improve these rates [12], [14], [29]. For example, the top
management, could direct efforts to support measure and analyze phases.
42% of those sampled stated that most LSS failures occur at the corporate level. This can
be explained by the factors that were considered to be the most critical, i.e. top
management commitment, followed by resistance to change, and inappropriate rewards
and recognition systems. These factors and reasons are largely related to actions at the
corporate level, so respondents considered them to be the primary reasons for project
failures.
This study also addressed the top five critical factors for LSS project failures. The
empirical study identified that these top five factors were: lack of commitment and
“support from top management”; “resistance to change”; “inappropriate rewards and

recognition systems”; “inconsistent monitoring and control”; and “poor communication”
practices. In addition to enumerating the main factors, it was possible to identify the
variables that contributed to the failures, making it easier for managers to avoid such
failures. For example, variables that impact the constructs and that can explain failure
rates, confirming findings in existing literature, are: lack of commitment in project
conceptualization [2], [5], [18]; planning [11], [37]; implementation [23], [26]; employee
resistance to change [2], [6]; a lack of policies to recognize and reward success [2], [32];
inconsistent monitoring and control of project [26], [29]; and a lack of communication
among project stakeholders [5], [39].
There is an absence of studies that rank the reasons for LSS project failures. However,
information such as that provided by Minitab [57] allows for a comparison of results. In
the study of approximately 150 customers from nearly 100 different companies, 42
reasons for SS project failures were identified, but the top eight represented 62 percent of
the total. Minitab states that the main reason is “no management support”, similar to the
results found in this study [57]. Other reasons that appear in both cases are not enough
training and a project scope that is too big, both occupying similar rankings [57]. The
other reasons pointed out by the study also touch on issues that were identified in this
paper: the project had no data or bad data, the project forced into DMAIC, the project
was too small for DMAIC’s rigor, and the project solution was not implemented.
The last aspects studied were the results of the analysis between groups. An analysis by
industry showed that there was a statistically significant difference (p-value < 0.05) for
the “scope creep” factor, which importance was higher for service experts. This is due to
differences between projects across different sectors. It may be more difficult to
collaborate between project champions and project leaders in the service sector, where
there is a greater lack of scope management and documentation describing the
responsibility of each member. This fact corroborates the findings of [26], who stated that
introducing LSS in the service industry may be more complex.
The analysis showed that there are statistically significant differences (p-value < 0.1) in
six factors when considering the level in the Belt system. In general, GBs affirmed that
the factors were more problematic than MBBs. MBBs often have a broader view by
taking on a coaching role in LSS projects [40], [41]. MBBs emphasize reasons geared to
the practical nature of acquiring and using knowledge, tools, and methodology. The
position and level of training in the Belt system alter the perception of the reasons for
failures. GBs, with an execution position within the project, say that training and
methodology are not important reasons for failures, while BBs have a broader view of
project management, and cite deficiencies in this issue. Furthermore, GBs and BBs are
immersed in projects [40]–[42], which causes them to perceive factors differently. The
differences may be due to the positions held, the breadth of the project vision, and project
experience, all characteristics reinforced in [40]–[42].
When analyzing the continent of the respondents, there was a statistically significant
difference (p-value < 0.05) in four factors: “poor communication”; “incompetent teams”;
“inadequate training”; and “learning and scope creep”. Respondents from Asia said that
these factors caused LSS project failures more than respondents form other continents,
showing that the scenario differs according to continental characteristics. This shows that
difficulties in deploying projects may vary more depending on the location of the
company than, for example, the type of industry.
Deeper analyses in relation to differences in development and culture were obtained
through tests considering developed and developing countries and the national culture
represented by individualism/collectivism. Five factors differed (p-value<0.05), which
allows us to infer that the perception of failures is greater in developing countries, as well

as the difficulty of implementing and conducting projects, showing the need to generate
skills and motivation to conduct projects. Developing countries, with a more collective
profile, considered "incompetent team", "inadequate training and learning", and "poor
communication" as the most important reasons for project failures. It can be inferred that
collectivist cultures can make respondents prioritize factors associated with progress,
formation and group development. Results that corroborate similar views from other
studies [25], [47].
6. Conclusions
This study answered a number of research questions via an empirical survey of 201 LSS
experts with leadership expertise and participation in LSS projects around the world. The
key findings indicate that experts affirm that LSS projects fail, projects are terminated in
the various phases of DMAIC, and that there is more concern surrounding measure and
analyze phases. We were able to identify the level at which project failures occurred,
especially at the corporate level. Additionally, it was possible to identify the critical
factors that lead to project failures. We also found that there is little difference in
perception of failure factors among experts from the service sector vs. the manufacturing
sector. These differences increase when considering issues such as the role in Belt system,
and the culture and development where the respondents work. Therefore, issues such as
hierarchy in LSS projects can lead to differing opinions as to the main failure factors.
The development level and national culture may also influence failure factors, which can
direct management actions to minimize these causes.
6.1 Managerial implications
The findings have several implications for managing organizations that are implementing
or supporting LSS. Firstly, when LSS project failures are observed they must be
monitored, analyzed, and documented. Thirdly, project leaders must be careful, especially
in the Measure and Analyze phases. Top management must be aware of actions at the
corporate level to minimize the chances of projects failing. The fourth implication is that
management should create mechanisms to decrease the chances of project failures by
understanding the factors and the variables that lead to them. Actions that can be taken
are, increasing commitment on behalf of the top management to project planning and
execution, creating mechanisms to reduce resistance to employee change, creating reward
policies and creating better communication mechanisms among project stakeholders.
6.2 Limitations and future research
The study was limited in several ways, as it did not compare other regions around the
globe. We were also not able to identify specific differences between the manufacturing
and service sectors. This may only be possible with a larger sample size, or with studies
dedicated specifically to making these comparisons. Additionally, studies could be
carried out to verify the causes of failures when considering project leaders, team
members, and senior management. The study used the view of experts in the Belt system,
but because it is exploratory and perception based, this study can generate biases towards
the judgment of experts. Surveys generally do not allow for in-depth studies of project
failures. Therefore, we cannot specifically comment on the occurrence of failures in
greater detail from the perspective of stakeholders.
A qualitative investigation of cases would allow an in-depth analysis of projects that
failed, making it possible to investigate the failure reasons. The focus could be to identify
causes as potential triggers for the root causes of project failures. This qualitative
investigation could approach companies with different contextual factors and levels of
LSS maturity. This in loco investigation of these differences could allow further
identification of the failure reasons.

We suggest that future research focus on studying the reasons for project failures from a
business point of view by comparing qualitative and quantitative data. Qualitative
investigation, together with the results presented in this study, can help create a model
that considers the inter-relationship of failure factors, proposing and verifying the cause
and effect relationship between them. The model could be formed using constructs and
observable variables, and instead of a prioritization, the structural model would aim to
confirm the relationships between the causes of failures. It may be possible, through
statistical analysis, to identify the specific factors that can reduce project failures,
including identifying differences in models for different sectors and company types.
References [1] R. D. Snee, “Lean Six Sigma – getting better all the time,” Int. J. Lean Six Sigma,
vol. 1, no. 1, pp. 9–29, 2010, doi: 10.1108/20401461011033130.
[2] S. Albliwi, J. Antony, S. A. H. Lim, and T. van der Wiele, “Critical failure
factors of lean Six Sigma: A systematic literature review,” Int. J. Qual. Reliab.
Manag., vol. 31, no. 9, pp. 1012–1030, 2014, doi: 10.1108/IJQRM-09-2013-
0147.
[3] M. Sony, S. Naik, and K. K. Therisa, “Why do organizations discontinue Lean
Six Sigma initiatives?,” Int. J. Qual. Reliab. Manag., vol. 36, no. 3, pp. 420–436,
2019, doi: 10.1108/IJQRM-03-2018-0066.
[4] M. P. J. Pepper and T. A. Spedding, “The evolution of lean Six Sigma,” Int. J.
Qual. Reliab. Manag., vol. 27, no. 2, pp. 138–155, 2010, doi:
10.1108/02656711011014276.
[5] V. R. Sreedharan, G. V. Gopikumar, S. Nair, A. Chakraborty, and J. Antony,
“Assessment of critical failure factors (CFFs) of Lean Six Sigma in real life
scenario: Evidence from manufacturing and service industries,” Benchmarking,

vol. 25, no. 8, pp. 3320–3336, 2018, doi: 10.1108/BIJ-10-2017-0281.
[6] R. Pamfilie, A. J. P. (Draghici), and M. Draghici, “The Importance of Leadership
in Driving a Strategic Lean Six Sigma Management,” Procedia - Soc. Behav.
Sci., vol. 58, pp. 187–196, 2012, doi: 10.1016/j.sbspro.2012.09.992.
[7] R. S. McLean, J. Antony, and J. J. Dahlgaard, “Failure of Continuous
Improvement initiatives in manufacturing environments: a systematic review of
the evidence,” Total Qual. Manag. Bus. Excell., vol. 28, no. 3–4, pp. 219–237,
2017, doi: 10.1080/14783363.2015.1063414.
[8] A. S. Choo, “Solving Problems Efficiently in R&D Projects: An Empirical Study
of the Application of Six Sigma Tools in an Industrial Research Center,” IEEE
Trans. Eng. Manag., pp. 1–14, 2019, doi: 10.1109/tem.2019.2941942.
[9] F. A. Abu Bakar, K. Subari, and M. A. Mohd Daril, “Critical success factors of
Lean Six Sigma deployment: a current review,” Int. J. Lean Six Sigma, vol. 6, no.
4, pp. 339–348, 2015, doi: 10.1108/IJLSS-04-2015-0011.
[10] M. Sony, J. Antony, S. Park, and M. Mutingi, “Key Criticisms of Six Sigma: A
Systematic Literature Review,” IEEE Trans. Eng. Manag., pp. 1–13, 2019, doi:
10.1109/tem.2018.2889517.
[11] S. Ambekar and M. Hudnurkar, “Factorial structure for Six Sigma project
barriers in Indian manufacturing and service industries,” TQM J., vol. 29, no. 5,
pp. 744–759, 2017, doi: 10.1108/TQM-02-2017-0021.
[12] B. J. Singh and D. Khanduja, “Essentials of D-phase to secure the competitive
advantage through Six Sigma,” Int. J. Bus. Excell., vol. 5, no. 1–2, pp. 35–51,
2012, doi: 10.1504/IJBEX.2012.044572.
[13] S. Salah, “A project selection, prioritisation and classification approach for
organisations managing continuous improvement (CI),” Int. J. Proj. Organ.

Manag., vol. 7, no. 1, pp. 98–110, 2015, doi: 10.1504/IJPOM.2015.068006.
[14] R. Sreedharan V and V. Sunder M, “A novel approach to lean six sigma project
management: a conceptual framework and empirical application,” Prod. Plan.
Control, vol. 29, no. 11, pp. 895–907, 2018, doi:
10.1080/09537287.2018.1492042.
[15] A. Hadi-Vencheh and A. Yousefi, “Selecting Six Sigma project: a comparative
study of DEA and LDA techniques,” Int. J. Lean Six Sigma, vol. 9, no. 4, pp.
506–522, 2018, doi: 10.1108/IJLSS-11-2016-0067.
[16] V. Arumugam, J. Antony, and K. Linderman, “The influence of challenging
goals and structured method on Six Sigma project performance : A mediated
moderation analysis,” Eur. J. Oper. Res., vol. 254, pp. 202–213, 2016, doi:
10.1016/j.ejor.2016.03.022.
[17] M. M. Fernandes, J. Hurst, J. Antony, J. B. Turrioni, and M. B. Silva, “18 Steps
to Six Sigma Project Success,” Qual. Prog., vol. 52, no. 2, pp. 16–23, 2019.
[18] J. Antony and S. Gupta, “Top ten reasons for process improvement project
failures,” Int. J. Lean Six Sigma, vol. 10, no. 1, pp. 367–375, 2019, doi:
10.1108/IJLSS-11-2017-0130.
[19] J. Antony, F. L. Lizarelli, M. M. Fernandes, M. Dempsey, A. Brennan, and J.
McFarlane, “A study into the reasons for process improvement project failures:
results from a pilot survey,” Int. J. Qual. Reliab. Manag., vol. 36, no. 10, pp.
1699–1720, 2019, doi: 10.1108/IJQRM-03-2019-0093.
[20] D. S. L. Marzagão and M. M. Carvalho, “Critical success factors for Six Sigma
projects,” Int. J. Proj. Manag., vol. 34, no. 8, pp. 1505–1518, 2016, doi:
10.1016/j.ijproman.2016.08.005.
[21] G. Anand, P. T. Ward, and M. V Tatikonda, “Role of explicit and tacit

knowledge in Six Sigma projects : An empirical examination of differential
project success,” J. Oper. Manag., vol. 28, pp. 303–315, 2010, doi:
10.1016/j.jom.2009.10.003.
[22] G. S. Easton and E. D. Rosenzweig, “The role of experience in six sigma project
success : An empirical analysis of improvement projects,” J. Oper. Manag., vol.
30, pp. 481–493, 2012, doi: 10.1016/j.jom.2012.08.002.
[23] C. Laux, M. Johnson, and P. Cada, “Project barriers to Green Belts through
critical success factors,” Int. J. Lean Six Sigma, vol. 6, no. 2, pp. 138–160, 2015,
doi: 10.1108/IJLSS-02-2014-0006.
[24] S. A. Albliwi, J. Antony, N. Arshed, and A. Ghadge, “Implementation of lean six
sigma in Saudi Arabian organisations: Findings from a survey,” Int. J. Qual.
Reliab. Manag., vol. 34, no. 4, pp. 1–29, 2017, doi: 10.1108/IJQRM-09-2015-
0138.
[25] I. DeSanctis, J. B. Ordieres Mere, M. Bevilacqua, and F. E. Ciarapica, “The
moderating effects of corporate and national factors on lean projects barriers: a
cross‐national study,” Prod. Plan. Control, vol. 29, no. 12, pp. 972–991, 2018,
doi: 10.1080/09537287.2018.1494345.
[26] A. G. Psychogios, J. Atanasovski, and L. K. Tsironis, “Lean Six Sigma in a
service context: A multi-factor application approach in the telecommunications
industry,” Int. J. Qual. Reliab. Manag., vol. 29, no. 1, pp. 122–139, 2012, doi:
10.1108/02656711211190909.
[27] J. Antony, S. Vinodh, and E. V. Gijo, Lean Six Sigma for small and medium sized
enterprises : A practical guide. Boca Raton, FL, USA: CRC Press, 2016.
[28] R. Iyede, E. F. Fallon, and P. Donnellan, “An exploration of the extent of Lean
Six Sigma implementation in the West of Ireland,” Int. J. Lean Six Sigma, vol. 9,
no. 3, pp. 444–462, 2018, doi: 10.1108/IJLSS-02-2017-0018.
[29] B. J. Singh and D. Khanduja, “Perspectives of control phase to manage Six
Sigma implements: An empirical study,” Int. J. Bus. Excell., vol. 7, no. 1, pp. 88–
111, 2014, doi: 10.1504/IJBEX.2014.057860.
[30] L. Parsnani and A. Deogaonkar, “The Strategic Role of Leadership in Six Sigma
Methodology ‘Lead the Change,’” Helix, vol. 8, no. 6, pp. 4190–4195, 2018, doi:
10.29042/2018-4190-4195.
[31] M. Singh and R. Rathi, A structured review of Lean Six Sigma in various
industrial sectors, vol. 10, no. 2. 2019.
[32] J. Antony, S. Gupta, V. Sunder, and E. V. Gijo, “Ten commandments of Lean
Six Sigma : a practitioners ’ perspective,” Int. J. Product. Perform. Manag., vol.
67, no. 6, pp. 1033–1044, 2018, doi: 10.1108/IJPPM-07-2017-0170.
[33] G. Yadav and T. N. Desai, “A fuzzy AHP approach to prioritize the barriers of
integrated Lean Six Sigma,” Int. J. Qual. Reliab. Manag., vol. 34, no. 8, pp.
1167–1185, 2017, doi: 10.1108/IJQRM-01-2016-0010.
[34] A. Yousefi and A. Hadi-Vencheh, “Selecting Six Sigma projects: MCDM or
DEA?,” J. Model. Manag., vol. 11, no. 1, pp. 309–325, 2016, doi: 10.1108/JM2-
05-2014-0036.
[35] E. R. G. Pedersen and M. Huniche, “Determinants of lean success and failure in
the Danish public sector: A negotiated order perspective,” Int. J. Public Sect.
Manag., vol. 24, no. 5, pp. 403–420, 2011, doi: 10.1108/09513551111147141.
[36] M. Kumar, J. Antony, and B. R. Cho, “Project selection and its impact on the
successful deployment of Six Sigma,” Bus. Process Manag. J., vol. 15, no. 5, pp.
669–686, 2009, doi: 10.1108/14637150910987900.
[37] M. Singh, P. Kumar, and R. Rathi, “Modelling the barriers of Lean Six Sigma for
Indian micro-small medium enterprises: An ISM and MICMAC approach,” TQM
J., vol. 31, no. 5, pp. 673–695, 2019, doi: 10.1108/TQM-12-2018-0205.
[38] S. Vinodh and V. Swarnakar, “Lean Six Sigma project selection using hybrid
approach based on fuzzy DEMATEL–ANP–TOPSIS,” Int. J. Lean Six Sigma,
vol. 6, no. 4, pp. 313–338, 2015, doi: 10.1108/IJLSS-12-2014-0041.
[39] J. L. García-Alcaraz, G. Alor-Hernández, C. Sánchez-Ramírez, E. Jiménez-
Macías, J. Blanco-Fernández, and J. I. Latorre-Biel, “Mediating role of the six
sigma implementation strategy and investment in human resources in economic
success and sustainability,” Sustain., vol. 10, no. 6, 2018, doi:
10.3390/su10061828.
[40] R. Stankalla, F. Chromjakova, and O. Koval, “A review of the Six Sigma belt
system for manufacturing small and medium-sized enterprises,” Qual. Manag. J.,
vol. 26, no. 2, pp. 100–117, 2019, doi: 10.1080/10686967.2019.1580119.
[41] D. C. Montgomery and W. H. Woodall, “An Overview of Six Sigma,” Int. Stat.
Rev., vol. 76, no. 3, pp. 329–346, 2008, doi: 10.1111/j.1751-5823.2008.00061.x.
[42] Y. C. Ho, O. C. Chang, and W. B. Wang, “An empirical study of key success
factors for Six Sigma Green Belt projects at an Asian MRO company,” J. Air
Transp. Manag., vol. 14, no. 5, pp. 263–269, 2008, doi:
10.1016/j.jairtraman.2008.05.002.
[43] A. Schmidt, T. T. Sousa-Zomer, J. M. Andrietta, and P. A. Cauchick-Miguel,
“Deploying Six Sigma practices to General Electric subsidiaries in a developing
economy: An empirical analysis,” Int. J. Qual. Reliab. Manag., vol. 35, no. 2, pp.
446–462, 2018, doi: 10.1108/IJQRM-09-2016-0155.
[44] F. D. Shrafat and M. Ismail, “Structural equation modeling of lean manufacturing
practices in a developing country context,” J. Manuf. Technol. Manag., vol. 30,

no. 1, pp. 122–145, 2019, doi: 10.1108/JMTM-08-2017-0159.
[45] G. Yadav, S. Luthra, D. Huisingh, S. K. Mangla, B. E. Narkhede, and Y. Liu,
“Development of a lean manufacturing framework to enhance its adoption within
manufacturing companies in developing economies,” J. Clean. Prod., vol. 245,
2020, doi: 10.1016/j.jclepro.2019.118726.
[46] W. Bank, “World Bank Country and Lending Groups,” 2020. [Online].
Available: https://datahelpdesk.worldbank.org/knowledgebase/articles/906519-
world-bank-country-and-lending-groups. [Accessed: 12-May-2020].
[47] F. Wiengarten, C. Gimenez, and B. Fynes, “Exploring the importance of cultural
collectivism on the efficacy of lean practices Taking an organisational and
national perspective,” 2014, doi: 10.1108/IJOPM-09-2012-0357.
[48] C. Forza, “Survey research in operations management : a process-based
perspective,” Int. J. Oper. Prod. Manag., vol. 22, no. 2, pp. 152–194, 2002, doi:
10.1108/01443570210414310.
[49] B. B. Flynn, S. S. Kakibara, R. G. Schroeder, K. A. Bates, and E. J. Flynn,
“Empirical Research Methods in Operations Management,” Empir. Res. methods
Oper. Manag., vol. 9, no. 2, pp. 250–284, 1990.
[50] J. F. Hair, G. T. M. Hult, and C. M. Ringle, A Primer on Partial Least Squares
Structural Equation Modeling (PLS-SEM), 2nd ed. Sage, 2017.
[51] N. Fantom and U. Serajuddin, “The World Bank ’ s Classification of Countries
by Income,” 2016.
[52] H. Kong, R. Osei-kyei, and A. P. C. Chan, “Empirical comparison of critical
success factors for public-private partnerships in developing and developed
countries,” Eng. Contruction Archit. Manag., vol. 24, no. 6, pp. 1222–1245,
2017, doi: 10.1108/ECAM-06-2016-0144.

[53] J. F. Hair, C. M. Ringle, M. Sarstedt, J. F. Hair, C. M. Ringle, and M. Sarstedt,
“PLS-SEM : Indeed a Silver Bullet,” J. Mark. Theory Pract., vol. 19, no. 2, pp.
139–152, 2011, doi: 10.2753/MTP1069-6679190202.
[54] J. Henseler, C. M. Ringle, and M. Sarstedt, “A new criterion for assessing
discriminant validity in variance-based structural equation modeling,” J. Acad.
Mark. Sci., vol. 43, pp. 115–135, 2015, doi: 10.1007/s11747-014-0403-8.
[55] C. M. Ringle, M. Sarstedt, and D. Straub, “Editor’s Comments,” MIS Q., vol. 36,
no. 1, pp. iii–xiv, 2012.
[56] J. D. Gibbons and S. Chakraborti, Nonparametric Statistical Inference, Fourth
Edition: Revised and Expanded, Fourth Edi. New York: Marcel Dekker, 2003.
[57] Minitab, “Project falure: eight reasons by Minitab,” 2020. [Online]. Available:
https://www.isixsigma.com/community/blogs/project-failure-eight-reasons-
minitab/. [Accessed: 01-May-2020].


