
A Future for the IABP in Cardiogenic Shock?
Holger Thiele Medical Clinic II (Cardiology/Angiology/Intensive Care)
University of Lübeck, Germany

Disclosures
Funding:
German Research Foundation
German Heart Research Foundation
German Cardiac Society
EU
Arbeitsgemeinschaft Leitende Kardiologische Krankenhausärzte
Terumo
Lilly
Maquet Cardiovascular
Teleflex Medical
Consulting:
Maquet Cardiovascular, Lilly
Speaker Honoraria:
Lilly, Astra Zeneca, Daiichi Sankyo, Boehringer Ingelheim, Maquet
Cardiovascular, Medicines Company
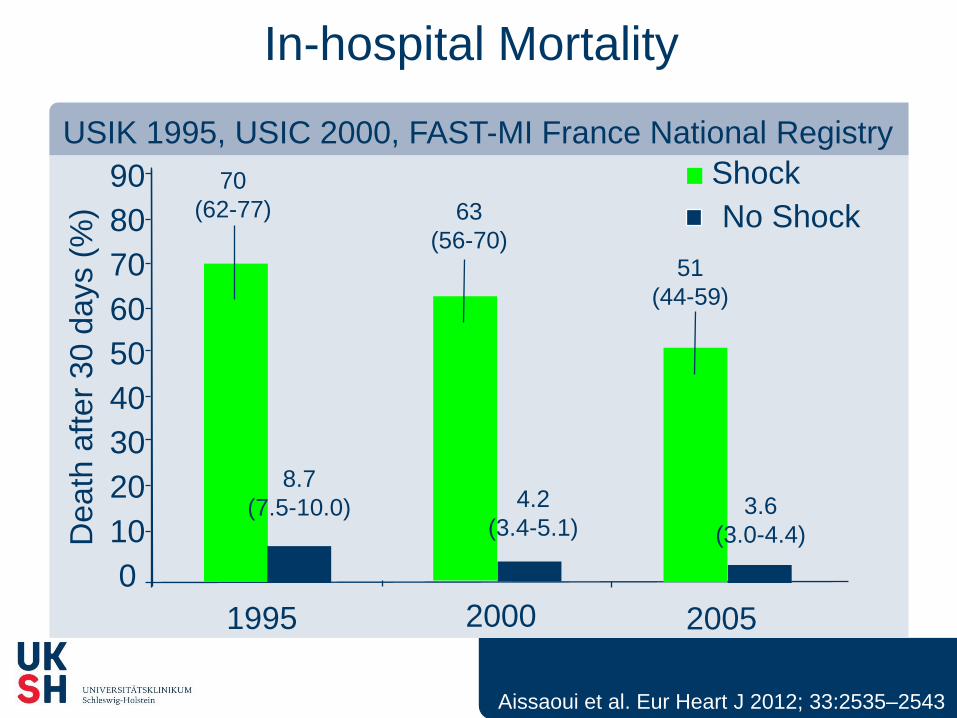
In-hospital Mortality
Aissaoui et al. Eur Heart J 2012; 33:2535–2543
USIK 1995, USIC 2000, FAST-MI France National Registry
1995 2000 2005
90
80
70
60
50
40
30
20
10
0
Death
aft
er
30 d
ays (
%)
8.7
(7.5-10.0) 4.2
(3.4-5.1) 3.6
(3.0-4.4)
51
(44-59)
63
(56-70)
70
(62-77)
Shock
No Shock

Trial n/N n/N
Relative Risk
95% CI
Relative Risk
95% CI
0 0.5 1 2 3
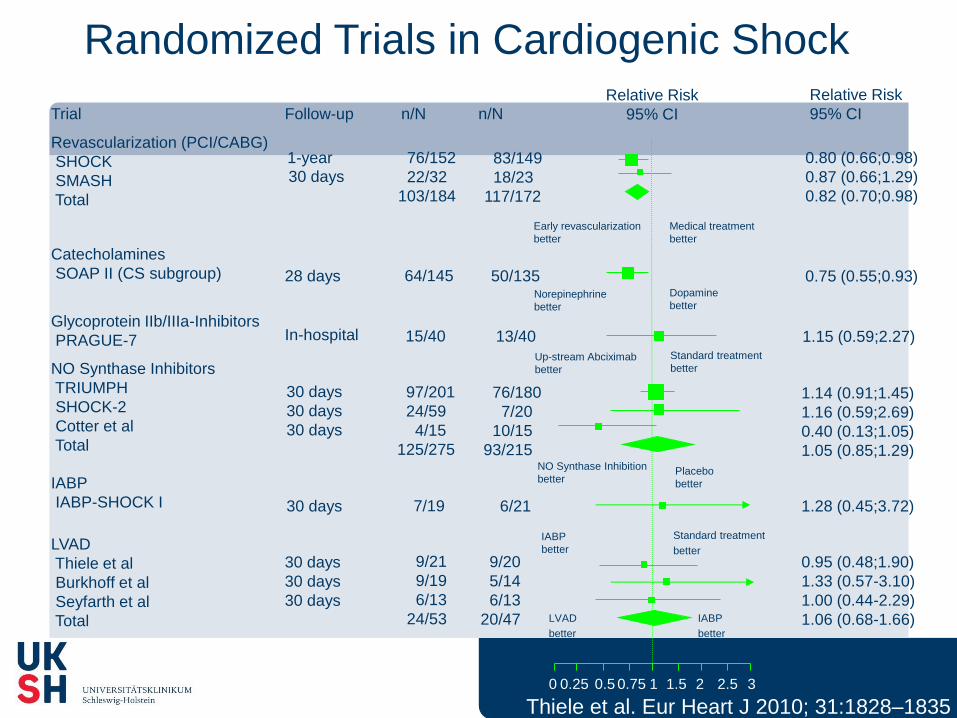
Randomized Trials in Cardiogenic Shock
Follow-up
Revascularization (PCI/CABG)
SHOCK
SMASH
Total
76/152
22/32
103/184
83/149
18/23
117/172
0.80 (0.66;0.98)
0.87 (0.66;1.29)
0.82 (0.70;0.98)
1-year
30 days
Early revascularization
better
Medical therapy
better
0.75 1.5 2.5 0.25
Thiele et al. Eur Heart J 2010; 31,1828–1835

„Stunned“ Myocardium
Partial stenosis Reperfusion
Hours Hours
7 Days
N=5
Control 0 1 2 3 4 5 0 24 48 72
100
70
50
30
% o
f contr
ol
**
** **
**
**
**P<0,05 vs. control
Matsuzaki et al. Circulation 1983;68:170-178

IABP History
History:
1962 Animal trials
Moulopoulos et al, Am Heart J 1962;63:669-675
1968 1. clinical description in shock
Kantrowitz et al, JAMA 1968;203:135-140
1973 Hemodynamic effects, mortality unchanged
Scheidt et al, NEJM 1973;288:979-984
> 40 years > 1 Million patients treated, low complication rate,
Benchmark registry
Ferguson et al, JACC 2001;38:1456-1462
Overview
IABP – Hemodynamic effects
IABP in cardiogenic shock

Diastolic Augmentation
Assisted ed Aortic Pressure
Assisted
Systole
Non-assisted
Systole
Balloon-
inflation
Non-assisted
Aortic Pressure
140
120
100
80
60
mm
Hg
IABP – Arterial Pressure Curves Improvement of coronary perfusion
Reduction afterload
Myocardial O2-consumption
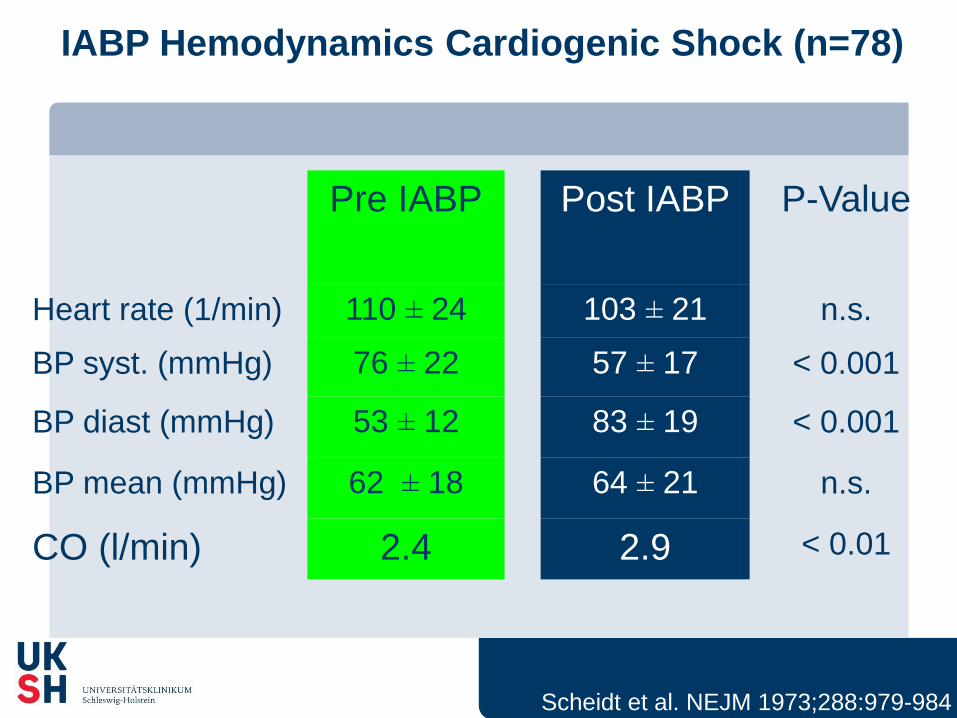
IABP Hemodynamics Cardiogenic Shock (n=78)
Pre IABP Post IABP P-Value
Heart rate (1/min) 110 ± 24 103 ± 21 n.s.
BP syst. (mmHg) 76 ± 22 57 ± 17 < 0.001
BP diast (mmHg) 53 ± 12 83 ± 19 < 0.001
BP mean (mmHg) 62 ± 18 64 ± 21 n.s.
CO (l/min) 2.4 2.9 < 0.01
Scheidt et al. NEJM 1973;288:979-984

IABP vs. Control Cardiogenic Shock (n=40)
Prondzinsky et al. Shock 2012:37:378-384
P<0.009
IABP-SHOCK I
IABP No IABP
Prior 24 h 48 h 72 h 96 h
8
7
6
5
4
3
2
1
0 Time
Card
iac o
utp
ut
(l/m
in) P=n.s.
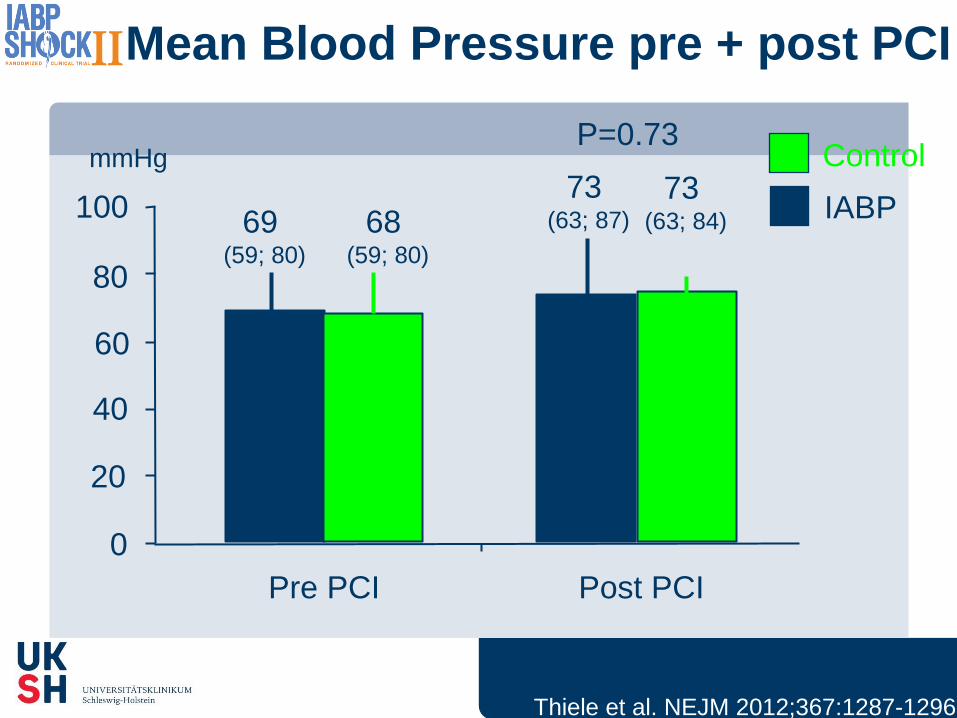
Mean Blood Pressure pre + post PCI
69 (59; 80)
20
80
Pre PCI
mmHg Control
IABP
P=0.73
60
40
100
0
Post PCI
Thiele et al. NEJM 2012;367:1287-1296
68 (59; 80)
73 (63; 87)
73 (63; 84)

Overview
IABP – Hemodynamic effects
IABP in cardiogenic shock

Guidelines
IABP in STEMI complicated by cardiogenic shock
Class 1B → IIa B
ACC/AHA
ESC
Class IC → IIb B
Antman et al. Circulation 2004;110:82-292
O’Gara et al. Circulation. 2013;127:e362-e425
Van de Werf et al. Eur Heart J 2008;29:2909-2945
Steg et al. Eur Heart J.2012;33:2569-2619
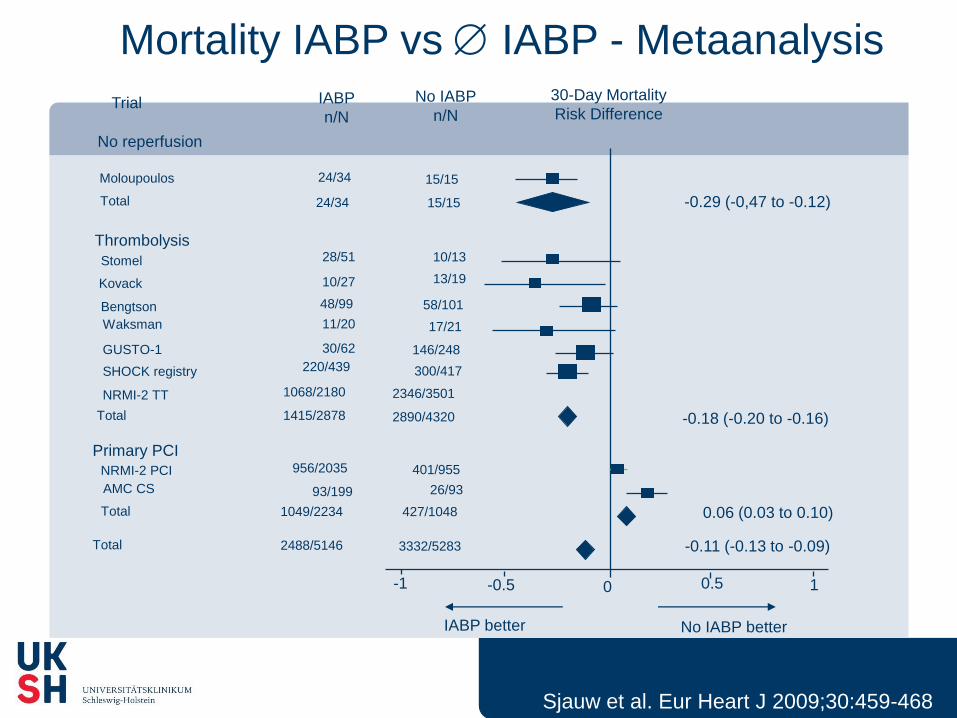
Sjauw et al. Eur Heart J 2009;30:459-468
Mortality IABP vs IABP - Metaanalysis
-1 -0.5 0.5 1 0
No IABP better IABP better
30-Day Mortality
Risk Difference IABP
n/N
No IABP
n/N Trial
-0.18 (-0.20 to -0.16) Total
Thrombolysis
Stomel
Kovack
Bengtson
Waksman
GUSTO-1
SHOCK registry
NRMI-2 TT
28/51
10/27
48/99
11/20
30/62
220/439
1068/2180
1415/2878
10/13
13/19
58/101
17/21
146/248
300/417
2346/3501
2890/4320
-0.11 (-0.13 to -0.09) Total 2488/5146 3332/5283
Total 1049/2234 0.06 (0.03 to 0.10)
Primary PCI
NRMI-2 PCI
AMC CS
956/2035
93/199
401/955
26/93
427/1048
-0.29 (-0,47 to -0.12)
No reperfusion
24/34
24/34
15/15
15/15
Moloupoulos
Total
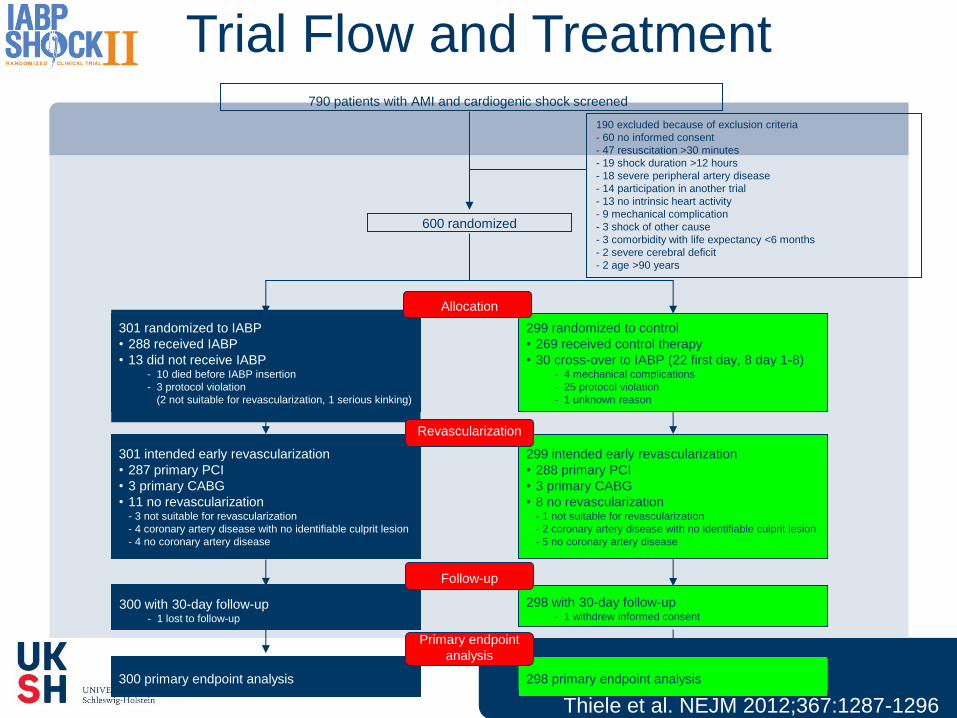
298 primary endpoint analysis
600 randomized
299 randomized to control
• 269 received control therapy
• 30 cross-over to IABP (22 first day, 8 day 1-8) - 4 mechanical complications
- 25 protocol violation
- 1 unknown reason
300 with 30-day follow-up - 1 lost to follow-up
298 with 30-day follow-up - 1 withdrew informed consent
Follow-up
300 primary endpoint analysis
Primary endpoint
analysis
790 patients with AMI and cardiogenic shock screened
299 intended early revascularization
• 288 primary PCI
• 3 primary CABG
• 8 no revascularization - 1 not suitable for revascularization
- 2 coronary artery disease with no identifiable culprit lesion
- 5 no coronary artery disease
190 excluded because of exclusion criteria
- 60 no informed consent
- 47 resuscitation >30 minutes
- 19 shock duration >12 hours
- 18 severe peripheral artery disease
- 14 participation in another trial
- 13 no intrinsic heart activity
- 9 mechanical complication
- 3 shock of other cause
- 3 comorbidity with life expectancy <6 months
- 2 severe cerebral deficit
- 2 age >90 years
Trial Flow and Treatment
301 randomized to IABP
• 288 received IABP
• 13 did not receive IABP - 10 died before IABP insertion
- 3 protocol violation
(2 not suitable for revascularization, 1 serious kinking)
301 intended early revascularization
• 287 primary PCI
• 3 primary CABG
• 11 no revascularization - 3 not suitable for revascularization
- 4 coronary artery disease with no identifiable culprit lesion
- 4 no coronary artery disease
Thiele et al. NEJM 2012;367:1287-1296
Revascularization
Allocation
Thiele et al. NEJM 2012;367:1287-1296

0
1
2
3
4
5
6
7
8
9
P=0.43
P=0.12
P=0.06
P=0.32 P=0.32 P=0.37
Baseline 8 h 16 h 24 h 32 h 40 h 48 h
Seru
m lacta
te (
mm
ol/l)
P=0.09
Control IABP
Serum Lactate
Thiele et al. NEJM 2012;367:1287-1296

Mort
alit
y (
%)
Time after randomization (days)
P=0.92; log-rank test
Relative risk 0.96; 95% CI 0.79-1.17; P=0.69; Chi2-Test
Primary Study Endpoint (30-Day Mortality)
Control 41.3%
IABP 39.7%
0
10
20
30
40
50
0 5 10 15 20 25 30
Thiele et al. NEJM 2012;367:1287-1296
0 0.5 1 1.5 2 2.5
IABP better Control better
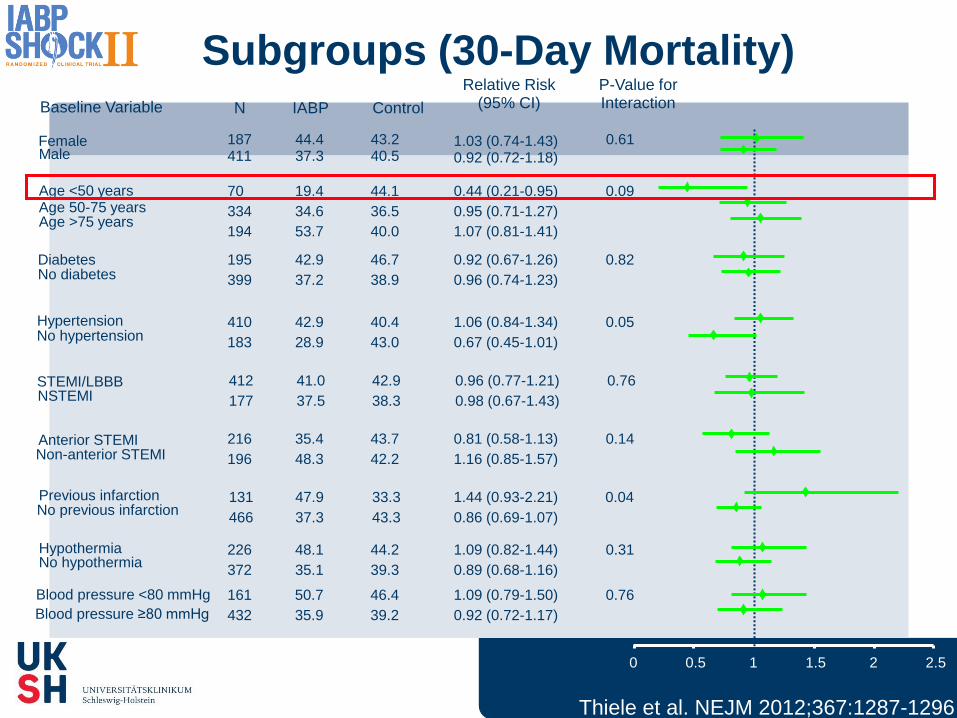
Subgroups (30-Day Mortality)
187 411
Baseline Variable N
30-Day Mortality (%)
IABP Control
Relative Risk (95% CI)
P-Value for Interaction
Female Male
Age <50 years Age 50-75 years Age >75 years
Diabetes No diabetes
Hypertension No hypertension
STEMI/LBBB NSTEMI
Anterior STEMI Non-anterior STEMI
Previous infarction No previous infarction
Hypothermia No hypothermia
70
334
194
195
399
410
183
412
177
216
196
131
466
226
372
44.4 37.3
19.4
34.6
53.7
42.9
37.2
42.9
28.9
41.0
37.5
35.4
48.3
47.9
37.3
48.1
35.1
43.2 40.5
44.1
36.5
40.0
46.7
38.9
40.4
43.0
42.9
38.3
43.7
42.2
33.3
43.3
44.2
39.3
1.03 (0.74-1.43) 0.92 (0.72-1.18)
0.44 (0.21-0.95)
0.95 (0.71-1.27)
1.07 (0.81-1.41)
0.92 (0.67-1.26)
0.96 (0.74-1.23)
1.06 (0.84-1.34)
0.67 (0.45-1.01)
0.96 (0.77-1.21)
0.98 (0.67-1.43)
0.81 (0.58-1.13)
1.16 (0.85-1.57)
1.44 (0.93-2.21)
0.86 (0.69-1.07)
1.09 (0.82-1.44)
0.89 (0.68-1.16)
0.61
0.09
0.82
0.05
0.76
0.14
0.04
0.31
Blood pressure <80 mmHg
Blood pressure ≥80 mmHg
161
432
50.7
35.9
46.4
39.2
1.09 (0.79-1.50)
0.92 (0.72-1.17)
0.76
Thiele et al. NEJM 2012;367:1287-1296
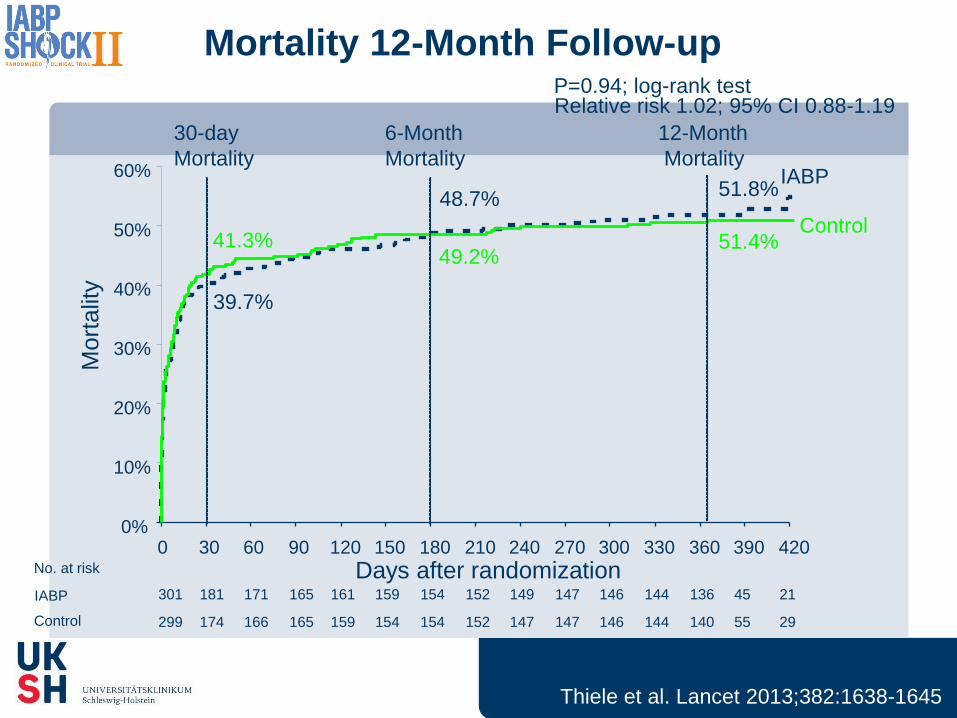
Mortality 12-Month Follow-up
Control
IABP
0%
10%
20%
30%
40%
50%
60%
0 30 60 90 120 150 180 210 240 270 300 330 360 390 420
Mort
alit
y
Days after randomization
P=0.94; log-rank test Relative risk 1.02; 95% CI 0.88-1.19
12-Month
Mortality
49.2%
48.7%
6-Month
Mortality
30-day
Mortality
41.3%
39.7%
51.8%
51.4%
301 181 171 165 161 159 154 152 149 147 146 144 136 45 21
299 174 166 165 159 154 154 152 147 147 146 144 140 55 29
No. at risk
IABP
Control
Thiele et al. Lancet 2013;382:1638-1645

Mortality 12-Month Follow-up – As Treated
P=0.94; log-rank test Relative risk 1.02; 95% CI 0.88-1.19
0%
10%
20%
30%
40%
50%
60%
0 30 60 90 120 150 180 210 240 270 300 330 360 390 420
Control
IABP
Mo
rta
lity
Days after randomization
P=0.41; log-rank Test
Relative Risk 0.97; 95% CI 0.82-1.14; P=0.68; Chi2-Test
Thiele et al. Lancet 2013;382:1638-1645
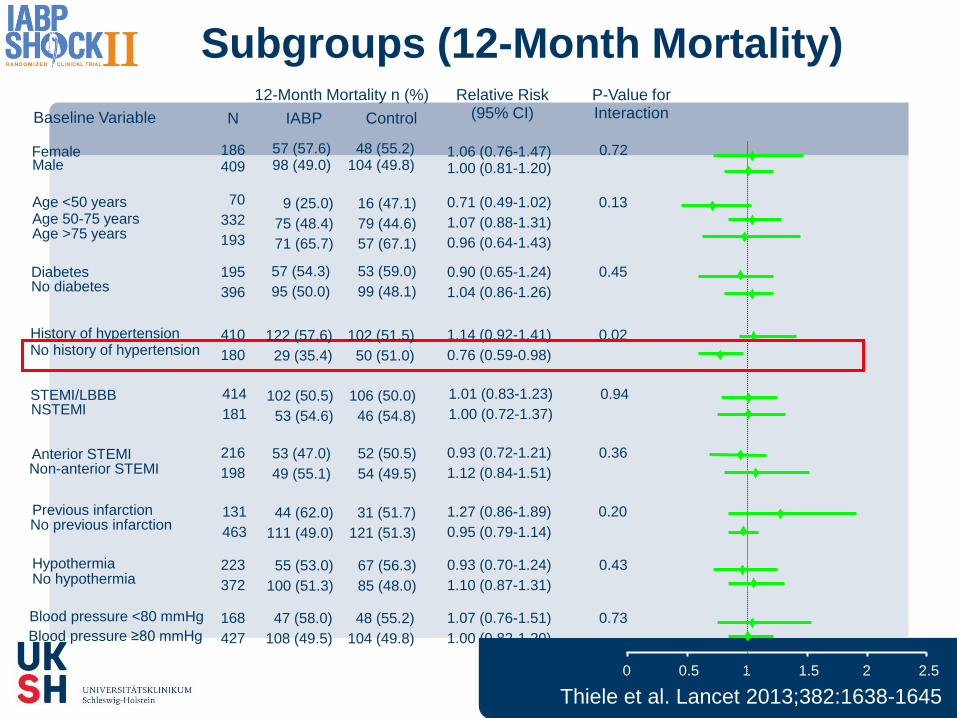
Subgroups (12-Month Mortality)
0 0.5 1 1.5 2 2.5
186 409
Baseline Variable N
12-Month Mortality n (%)
IABP Control
Relative Risk (95% CI)
P-Value for Interaction
Female Male
Age <50 years Age 50-75 years Age >75 years
Diabetes No diabetes
History of hypertension No history of hypertension
STEMI/LBBB NSTEMI
Anterior STEMI Non-anterior STEMI
Previous infarction No previous infarction
Hypothermia No hypothermia
70
332
193
195
396
410
180
414
181
216
198
131
463
223
372
1.06 (0.76-1.47) 1.00 (0.81-1.20)
0.71 (0.49-1.02)
1.07 (0.88-1.31)
0.96 (0.64-1.43)
0.90 (0.65-1.24)
1.04 (0.86-1.26)
1.14 (0.92-1.41)
0.76 (0.59-0.98)
1.01 (0.83-1.23)
1.00 (0.72-1.37)
0.93 (0.72-1.21)
1.12 (0.84-1.51)
1.27 (0.86-1.89)
0.95 (0.79-1.14)
0.93 (0.70-1.24)
1.10 (0.87-1.31)
0.72
0.13
0.45
0.02
0.94
0.36
0.20
0.43
IABP better Control better
Blood pressure <80 mmHg
Blood pressure ≥80 mmHg
168
427
1.07 (0.76-1.51)
1.00 (0.82-1.20)
0.73
57 (57.6) 98 (49.0)
9 (25.0)
75 (48.4)
71 (65.7)
57 (54.3)
95 (50.0)
122 (57.6)
29 (35.4)
102 (50.5)
53 (54.6)
53 (47.0)
49 (55.1)
44 (62.0)
111 (49.0)
55 (53.0)
100 (51.3)
48 (55.2) 104 (49.8)
16 (47.1)
79 (44.6)
57 (67.1)
53 (59.0)
99 (48.1)
102 (51.5)
50 (51.0)
106 (50.0)
46 (54.8)
52 (50.5)
54 (49.5)
31 (51.7)
121 (51.3)
67 (56.3)
85 (48.0)
47 (58.0)
108 (49.5)
48 (55.2)
104 (49.8)
Thiele et al. Lancet 2013;382:1638-1645
Trial n/N n/N
Relative Risk
95% CI
Relative Risk
95% CI
0 0.5 1 2 3
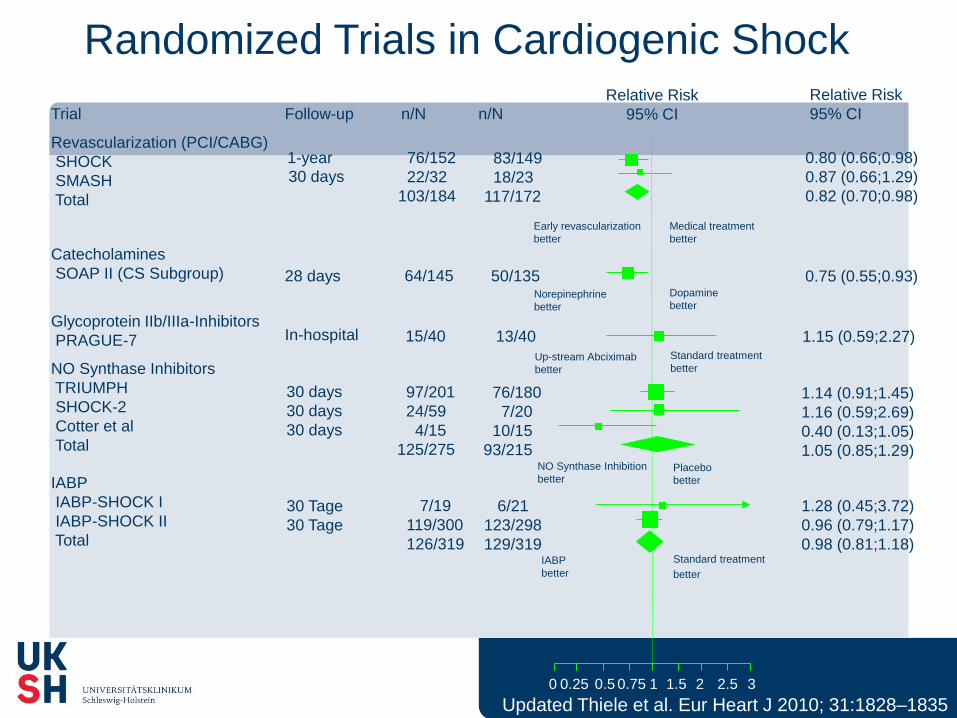
Randomized Trials in Cardiogenic Shock
Follow-up
Revascularization (PCI/CABG)
SHOCK
SMASH
Total
76/152
22/32
103/184
83/149
18/23
117/172
0.80 (0.66;0.98)
0.87 (0.66;1.29)
0.82 (0.70;0.98)
1-year
30 days
Early revascularization
better
Medical treatment
better
0.75 1.5 2.5 0.25
Norepinephrine
better
0.75 (0.55;0.93) 64/145 50/135 28 days Dopamine
better
Catecholamines
SOAP II (CS Subgroup)
In-hospital 15/40 13/40 1.15 (0.59;2.27) Up-stream Abciximab
better
Standard treatment
better
Glycoprotein IIb/IIIa-Inhibitors
PRAGUE-7
30 days
30 days
30 days
97/201
24/59
4/15
125/275
76/180
7/20
10/15
93/215
1.14 (0.91;1.45)
1.16 (0.59;2.69)
0.40 (0.13;1.05)
1.05 (0.85;1.29) NO Synthase Inhibition
better Placebo
better
NO Synthase Inhibitors
TRIUMPH
SHOCK-2
Cotter et al
Total
Updated Thiele et al. Eur Heart J 2010; 31:1828–1835
30 Tage
30 Tage
7/19
119/300
126/319
6/21
123/298
129/319 IABP
better
Standard treatment
better
1.28 (0.45;3.72)
0.96 (0.79;1.17)
0.98 (0.81;1.18)
IABP
IABP-SHOCK I
IABP-SHOCK II
Total
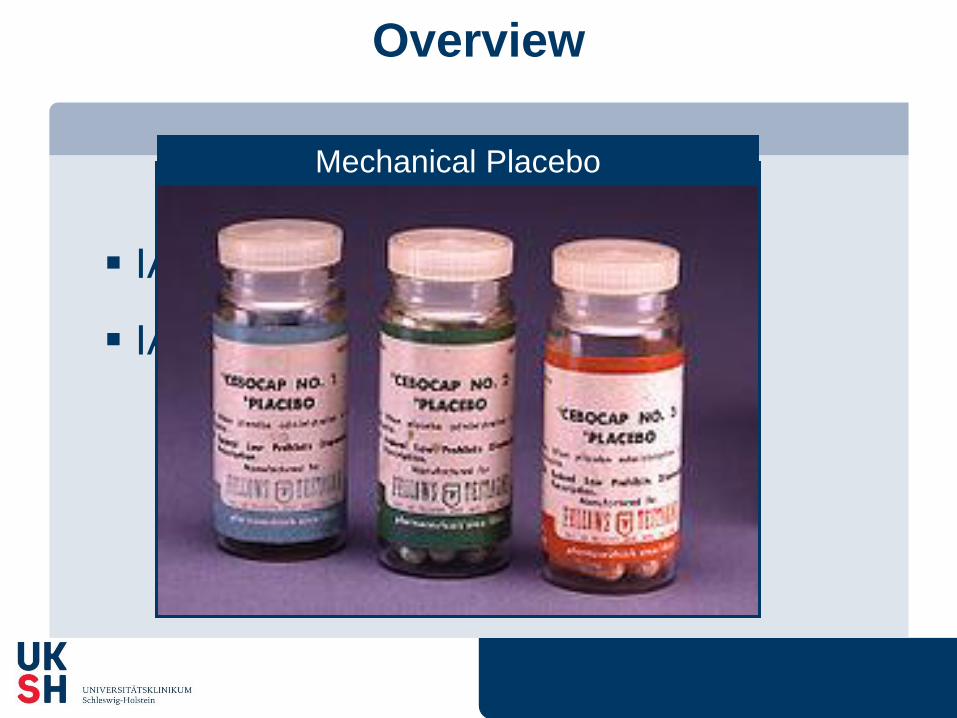
Overview
IABP – Hemodynamic effects
IABP in cardiogenic shock
Mechanical Placebo
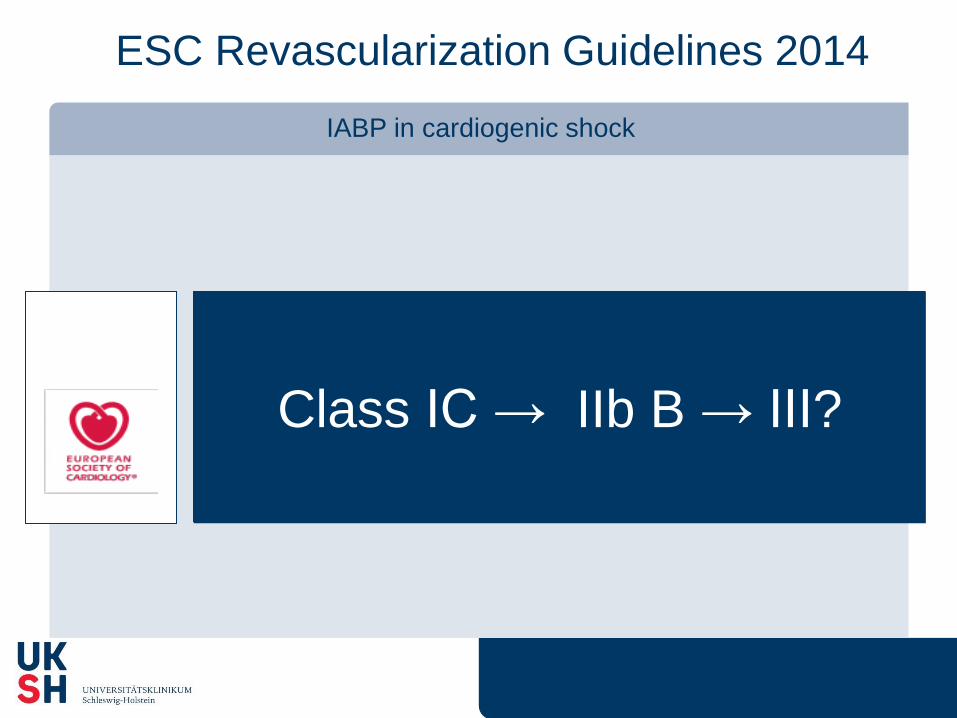
ESC Revascularization Guidelines 2014
IABP in cardiogenic shock
ESC
Class IC → IIb B → III?
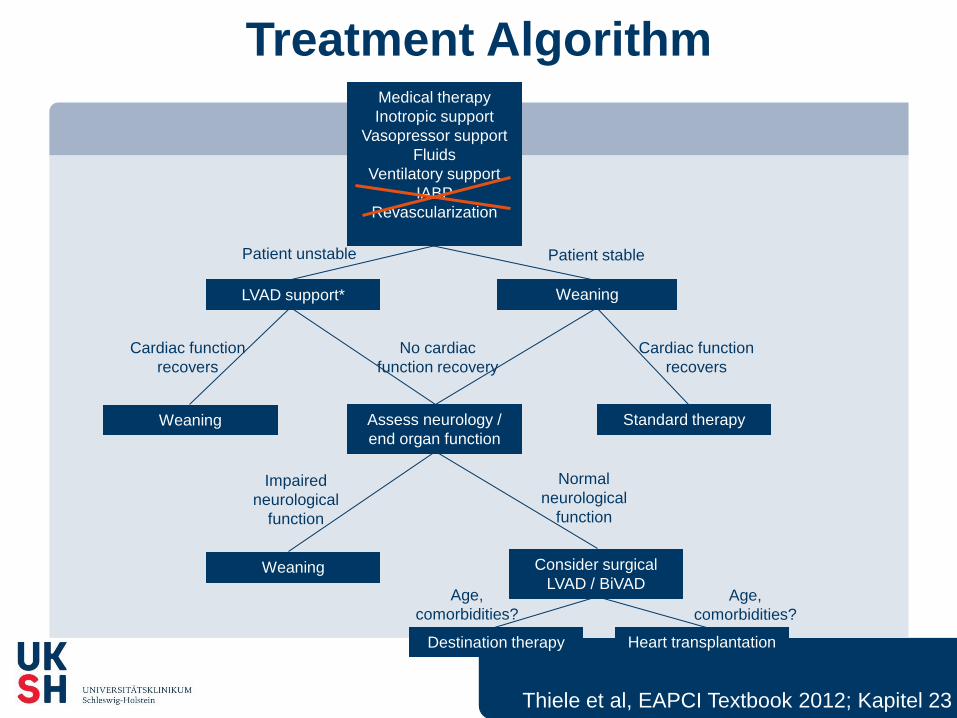
Treatment Algorithm
Thiele et al, EAPCI Textbook 2012; Kapitel 23
Patient unstable
LVAD support*
Medical therapy
Inotropic support
Vasopressor support
Fluids
Ventilatory support
IABP
Revascularization
Weaning
Patient stable
Cardiac function
recovers
Weaning Assess neurology /
end organ function
Cardiac function
recovers
Weaning Consider surgical
LVAD / BiVAD
Standard therapy
Normal
neurological
function
Impaired
neurological
function
No cardiac
function recovery
Destination therapy Heart transplantation
Age,
comorbidities?
Age,
comorbidities?

Cardiogenic Shock - Guidelines
Steg et al. Eur Heart J.2012;33:2569-2619

302 398
55 80 57 45
600
0
100
200
300
400
500
600
700
N P
atients
Patient Inclusion in Cardiogenic Shock Trials
Sto
p –
no
effe
ct
Sto
p s
low
re
cru
itm
ent
Un
de
rpo
we
red
Surr
ogate
endpoin
t
706
Sto
p –
slo
w r
ecru
itm
ent

Trial n/N n/N
Relative Risk
95% CI
Relative Risk
95% CI
0 0.5 1 2 3
Randomized Trials in Cardiogenic Shock
Follow-up
Revascularization (PCI/CABG)
SHOCK
SMASH
Total
76/152
22/32
103/184
83/149
18/23
117/172
0.80 (0.66;0.98)
0.87 (0.66;1.29)
0.82 (0.70;0.98)
1-year
30 days
Early revascularization
better
Medical treatment
better
0.75 1.5 2.5 0.25
Norepinephrine
better
0.75 (0.55;0.93) 64/145 50/135 28 days Dopamine
better
Catecholamines
SOAP II (CS subgroup)
In-hospital 15/40 13/40 1.15 (0.59;2.27) Up-stream Abciximab
better
Standard treatment
better
Glycoprotein IIb/IIIa-Inhibitors
PRAGUE-7
30 days
30 days
30 days
97/201
24/59
4/15
125/275
76/180
7/20
10/15
93/215
1.14 (0.91;1.45)
1.16 (0.59;2.69)
0.40 (0.13;1.05)
1.05 (0.85;1.29) NO Synthase Inhibition
better Placebo
better
NO Synthase Inhibitors
TRIUMPH
SHOCK-2
Cotter et al
Total
30 days 7/19 6/21
IABP
better
Standard treatment
better
1.28 (0.45;3.72)
IABP
IABP-SHOCK I
30 days
30 days
30 days
9/21
9/19
6/13
24/53
9/20
5/14
6/13
20/47
0.95 (0.48;1.90)
1.33 (0.57-3.10)
1.00 (0.44-2.29)
1.06 (0.68-1.66) LVAD
better
IABP
better
LVAD
Thiele et al
Burkhoff et al
Seyfarth et al
Total
Thiele et al. Eur Heart J 2010; 31:1828–1835
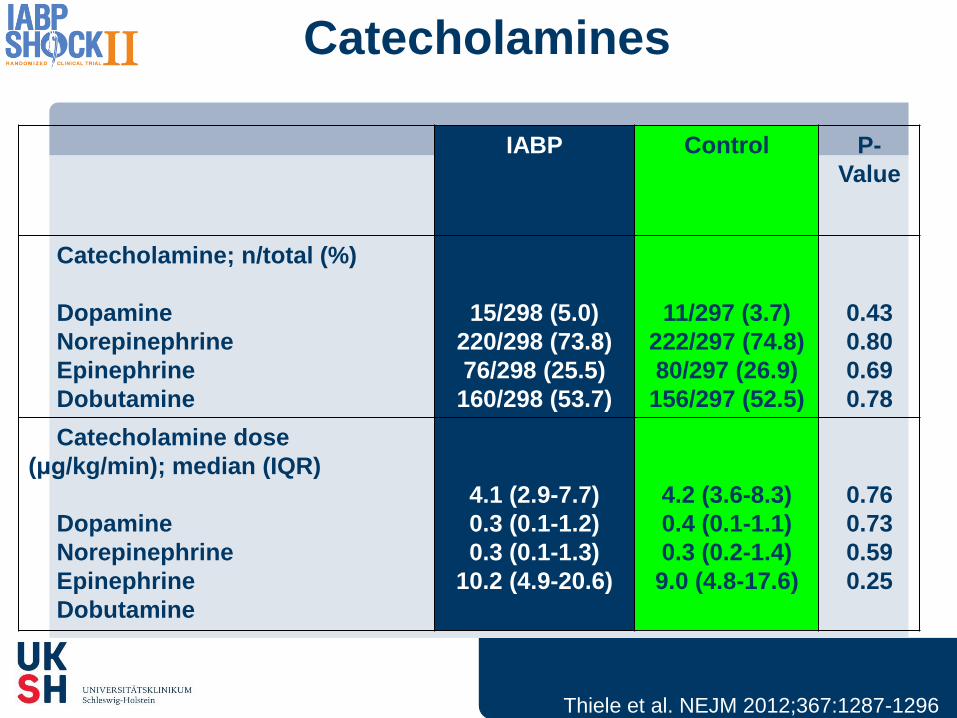
Catecholamines
IABP Control P-
Value
Catecholamine; n/total (%)
Dopamine
Norepinephrine
Epinephrine
Dobutamine
15/298 (5.0)
220/298 (73.8)
76/298 (25.5)
160/298 (53.7)
11/297 (3.7)
222/297 (74.8)
80/297 (26.9)
156/297 (52.5)
0.43
0.80
0.69
0.78
Catecholamine dose
(μg/kg/min); median (IQR)
Dopamine
Norepinephrine
Epinephrine
Dobutamine
4.1 (2.9-7.7)
0.3 (0.1-1.2)
0.3 (0.1-1.3)
10.2 (4.9-20.6)
4.2 (3.6-8.3)
0.4 (0.1-1.1)
0.3 (0.2-1.4)
9.0 (4.8-17.6)
0.76
0.73
0.59
0.25
Thiele et al. NEJM 2012;367:1287-1296

Sjauw et al. Eur Heart J 2009;30:459-468
STEMI - IABP versus no IABP - Metaanalysis

MRI Core Lab – University of Leipzig – Heart Center
USA Netherlands
Ireland U.K.
Belgium
France
Italy
India
Australia
Germany IABP pre PCI Standard-PCI
Primary Endpoint: Infarct size in MRI
1. All Patients with MRI data
2. Patients with prox. LAD-occlusion TIMI 0/1 flow
Routine Post PCI Treatment Min. 12 h IABP post PCI
Anterior MI
without Shock
Randomised
Open Label
(n ~ 300)
Cardiac MRI Day 3-5 post PCI
Study Design
Clinical Events – 6 Months
Patel et al. JAMA 2011;306:1329-1337
Inclusion criteria • Anterior STEMI
2 mm in 2 contiguous leads or > 4 mm in anterior leads
•Planned primary PCI < 6 h
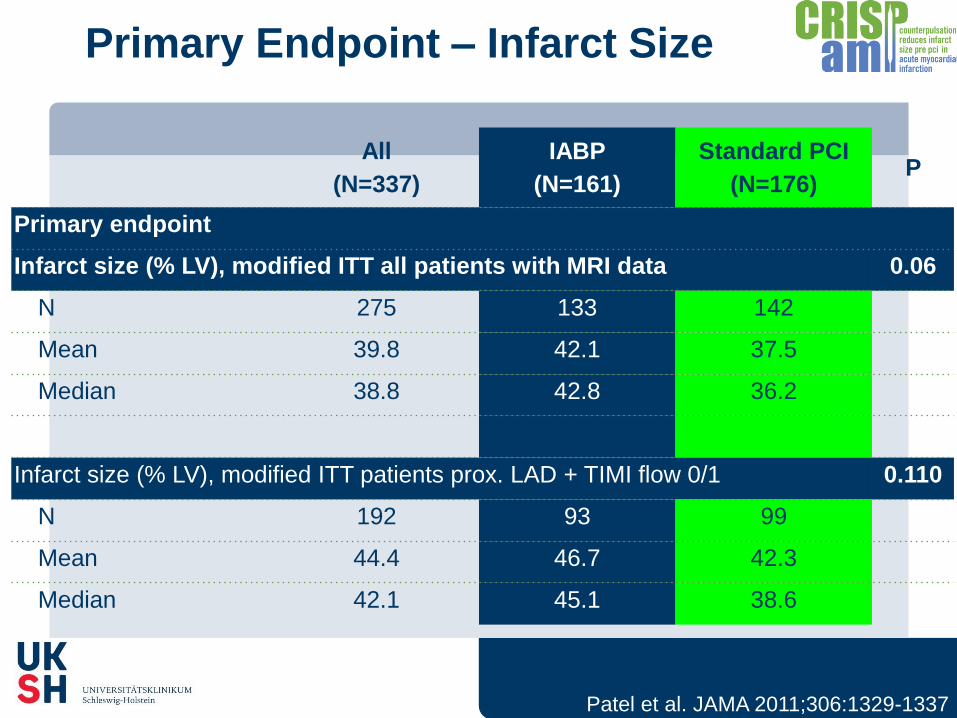
Primary Endpoint – Infarct Size
All
(N=337)
IABP
(N=161)
Standard PCI
(N=176) P
Primary endpoint
Infarct size (% LV), modified ITT all patients with MRI data 0.06
N 275 133 142
Mean 39.8 42.1 37.5
Median 38.8 42.8 36.2
Infarct size (% LV), modified ITT patients prox. LAD + TIMI flow 0/1 0.110
N 192 93 99
Mean 44.4 46.7 42.3
Median 42.1 45.1 38.6
Patel et al. JAMA 2011;306:1329-1337


