
arX
iv:g
r-qc
/060
5155
v1 3
1 M
ay 2
006
A Demonstration of LISA Laser Communication
S E Pollack† and R T Stebbins‡
† JILA, University of Colorado, Boulder, CO 80309-0440
present address: CENPA, Nuclear Physics Laboratory, University of Washington,
Seattle, WA 98195-4290
‡ NASA/GSFC Code 661, Greenbelt, MD 20771
E-mail: [email protected]
Abstract. Over the past few years questions have been raised concerning the use of
laser communications links between sciencecraft to transmit phase information crucial
to the reduction of laser frequency noise in the LISA science measurement. The
concern is that applying medium frequency phase modulations to the laser carrier
could compromise the phase stability of the LISA fringe signal. We have modified the
table-top interferometer presented in [1] by applying phase modulations to the laser
beams in order to evaluate the effects of such modulations on the LISA science fringe
signal. We have demonstrated that the phase resolution of the science signal is not
degraded by the presence of medium frequency phase modulations.
PACS numbers: 04.80.Nn, 07.50.-e, 95.30.Sf, 95.75.Kk, 95.75.Pq
Submitted to: Class. Quantum Grav.
1. Introduction
There are numerous interferometric fringe signals in the LISA interferometer. Most of
these fringes are created by heterodyning a local laser on one spacecraft with a remote
laser located on another spacecraft. The characteristics of the received beam cause the
LISA fringe to have several unique aspects. In [1] we presented a test-bed interferometer
designed to produce LISA-like fringes. We captured three aspects of the LISA-like fringe:
(1) a baseband fringe frequency which ranges from zero to tens of MHz, (2) the fringe
sweeps at a rate up to 1Hz/s, and (3) the fringe has a small signal level resulting from
the heterodyning of 100 pW and 0.5mW laser beams. We mentioned in [1] the utility
of our setup to demonstrate and investigate other aspects of the LISA interferometry
measurement system. In this paper we discuss a plan for laser communication and
demonstrate this plan with our table-top interferometer.
The three LISA sciencecraft operating in concert constitute the gravitational
wave detector. The photoreceivers on each optical bench in the LISA constellation
record phase information. The measurement of gravitational waves requires at least
two working arms of the LISA constellation. In addition, the lasers on-board each

A Demonstration of LISA Laser Communication 2
sciencecraft must be related to each other somehow in order to make the proper phase
comparisons which lead to a strain measurement. Each laser is independently stabilized
to a frequency reference or to the LISA arms [2, 3, 4]. An alternative stabilization
scheme is to stabilize all lasers to one master laser, and yet another is to allow the six
lasers to run independently (see e.g., [5]). Regardless of the choice to stabilize, or which
stabilization method will be implemented, the frequency difference and noise between
the lasers must be measured and canceled out to reach the required strain sensitivity
for LISA. The frequency noise correction system is based on an algorithm known as
time-delay interferometry (TDI) which is well discussed in the literature (see e.g., [6]
and references therein).
2. LISA Telemetry and Ranging
Time-delay interferometry (TDI) is the process of combining phase information with
time-delays inserted to cancel out phase noise. In particular, the phase noise due
to frequency jitter in the lasers can be reduced dramatically. TDI requires not only
the phase information produced by the interferometric fringe of LISA, but also some
knowledge of the relative jitter between the ultra-stable oscillators (USOs) onboard each
sciencecraft.
2.1. Ultra-Stable Clock Oscillator
Onboard each LISA sciencecraft is an ultra-stable oscillator (USO) which provides
the reference frequency for the LISA frequency distribution system (FDS). The FDS
provides frequencies to several key LISA systems, including the phase measurement
system, the laser stabilization system, the frequency noise correction system, and the
telemetry system.
Jitter in the USOs on each sciencecraft will appear as jitter in the phase of the
LISA fringe signal. Therefore it is imperative to actively measure the phase noise of the
USOs onboard LISA.
In each optical assembly a high frequency sideband derived from the USO will
be modulated onto the laser beam. This will be referred to throughout this paper
interchangeably as the USO sideband, the USO subcarrier, or just simply the subcarrier.
The subcarrier will be present on each laser beam so that it will be sent both ways on
each of the arms and between the optical benches contained in each sciencecraft. Beating
of this sideband with the sideband produced by the local USO produces the error signal
used for frequency noise correction.
The current baseline plan for modulating the USO onto the laser beam is as follows.
Each laser will consist of a neodymium yttrium-aluminum-garnet (Nd:YAG) master
oscillator fiber-coupled to a ytterbium (Yb:YAG) fiber amplifier. The current plan is
to insert a fiber modulator before the fiber amplifier. The fiber modulator will be an
electro-optic (EO) device used for phase modulation. The modulation depth of the EO

A Demonstration of LISA Laser Communication 3
will be about 10% to facilitate transfer of this signal.
Naturally there is some requirement on the measurement of the USO sideband.
This is determined by the requirement on sampling synchronization from TDI. The
phase measurement requirement on the USO sideband is 10−4 cycles/√Hz at 1 mHz [7].
The frequency selection of the USO sideband has two constraints: (1) it must be
of high enough frequency to minimize the effect of shot noise, and (2) it must be of low
enough frequency to be realized with an EO modulator. The current baseline design
for LISA is to utilize sideband-sideband beatnotes to allow the USO sideband frequency
to be much higher than in a sideband-carrier scheme. This further reduces the effect
of shot noise in the phase measurement of the USO. The USO sideband frequency
currently is set at 2GHz [8]. The USO sidebands on each sciencecraft will be slightly
different. For instance they might be 2MHz apart. In this way the sideband-sideband
beatnote will be ±2MHz around the carrier-carrier beatnote between the incoming and
local laser beams. The carrier-carrier beatnote contains the science information (i.e.,
gravitational wave signals). The frequency of all the beatnotes will be shifted by the
Doppler frequency due to orbital motions of the sciencecraft over the course of a year,
roughly ± 20 MHz.
2.2. Ranging Tones
In addition to the USO signal on the LISA laser beam, ranging tones may be modulated
onto the beam. The TDI algorithm for laser frequency noise correction requires absolute
knowledge of the armlength differences of the LISA constellation to tens of meters
accuracy [6]. This requirement is not easily met using ground tracking alone. Combining
the ground tracking with a laser-based ranging measurement will yield an estimate of the
armlengths to the required accuracy. One alternative to using ranging tones would be
to determine the distance using the new technique of time-delay interferometric ranging
whereby the ranging distances are solved for by a minimization of the noise in the TDI
variables rather than actually being measured [9]. However, for now we will assume that
ranging tones will still be required for LISA.
To prevent contamination of the LISA science data, the ranging tones will be phase
modulated onto the USO signal before phase modulation onto the laser beam. This is the
source of the terminology of the USO sideband being referred to as the subcarrier. This
second-order phase modulation, or phase-modulated phase modulation, will suppress
ranging tone sidebands around the LISA science fringe signal.
The current baseline plan for ranging tone modulation is to phase modulate the
USO signal before injection into the fiber modulator. The modulation depth of the
ranging tones will be half that of the USO. The frequency selection of the ranging tones
will be on the order of 100 kHz. This selection yields a distance ambiguity of roughly
3 km. Varying this tone during acquisition, or using multiple tones can reduce this
ambiguity. [8]

A Demonstration of LISA Laser Communication 4
2.3. Digital Data Transmission
Complicating the situation further, one operating mode for the LISA mission is expected
to be that digitally recorded phase data from each sciencecraft are sent to one selected
sciencecraft for data preprocessing. This preprocessed data is then downloaded to Earth
from the master sciencecraft. Again, to prevent contamination of the LISA science data,
the digital data transmission between LISA sciencecraft will be phase modulated onto
the USO sideband. Currently it is thought that digital data modulation will happen
in a similar way to the ranging tones described above. The frequency of modulation
most likely will be in the MHz range to facilitate high data rates and good frequency
separation from other signals. One difference between the digital data modulation and
ranging tones or the clock tone is that the data modulation sideband cannot be beat
against another data sideband if any usable information is to be extracted. Instead, the
digital data sideband on the incoming beam will be beat against the USO subcarrier on
the local beam. We describe this process in more detail in §3.1. Alternatively, both the
digital phase data and the ranging tones might be modulated onto the subcarrier using
pseudo-random codes and 180◦ phase-shift keying [8].
2.4. Modulation Summary
The LISA laser beam will be phase modulated with a phase modulated subcarrier at
gigahertz frequencies derived from the USO. The subcarrier is modulated with ranging
tones in the hundreds of kilohertz and possibly data in the megahertz. After traversing
the five million kilometers between sciencecraft the laser will have been Doppler shifted.
The Doppler shift ranges in frequency up to 20MHz and changes at a rate up to about
1Hz/s. Beatnotes between the incoming laser beam and the local laser beam will contain
the following signals to be measured: the science signal from which the gravitational
waves will be extracted is the result of beating the two laser carrier frequencies, the USO
signal is the result of beating the two USO subcarrier frequencies, the ranging signals
are the result of beating different ranging sidetones, the digital data signal is the result
of beating the digital data sideband on one laser with the USO subcarrier on another
laser.
In this paper we present results from our table-top interferometer with data
modulation present on the laser beam. In particular we demonstrate the ability to
transmit a clock tone with a ranging sidetone and audio data on the laser beam from
the distant sciencecraft and receive that transmission.
3. Laser Communication Design and Implementation
In [1] we presented a test-bed interferometer which produces LISA-like fringes. To
investigate the effects of modulating information on the LISA laser beam, we need only
make slight modifications to our test-bed interferometer. In particular, we add optical

A Demonstration of LISA Laser Communication 5
elements to modulate data onto the laser beam and electronic components to read out
the data.
As described in §2.1, the baseline plan for LISA is to modulate the laser beams
using electro-optic modulators (EOMs). Our table-top interferometer simulates one end
of one arm of the LISA interferometer. As described in [10], we make use of a modified
Mach-Zehnder design which utilizes polarized light. One arm of our interferometer
is attenuated to 100 pW by using neutral density filters (NDFs). This “dim beam”
represents the incoming light from one of the far sciencecraft. The “bright beam”
represents light from the laser beam on the local sciencecraft. The power of the bright
beam is very nearly 0.5mW.
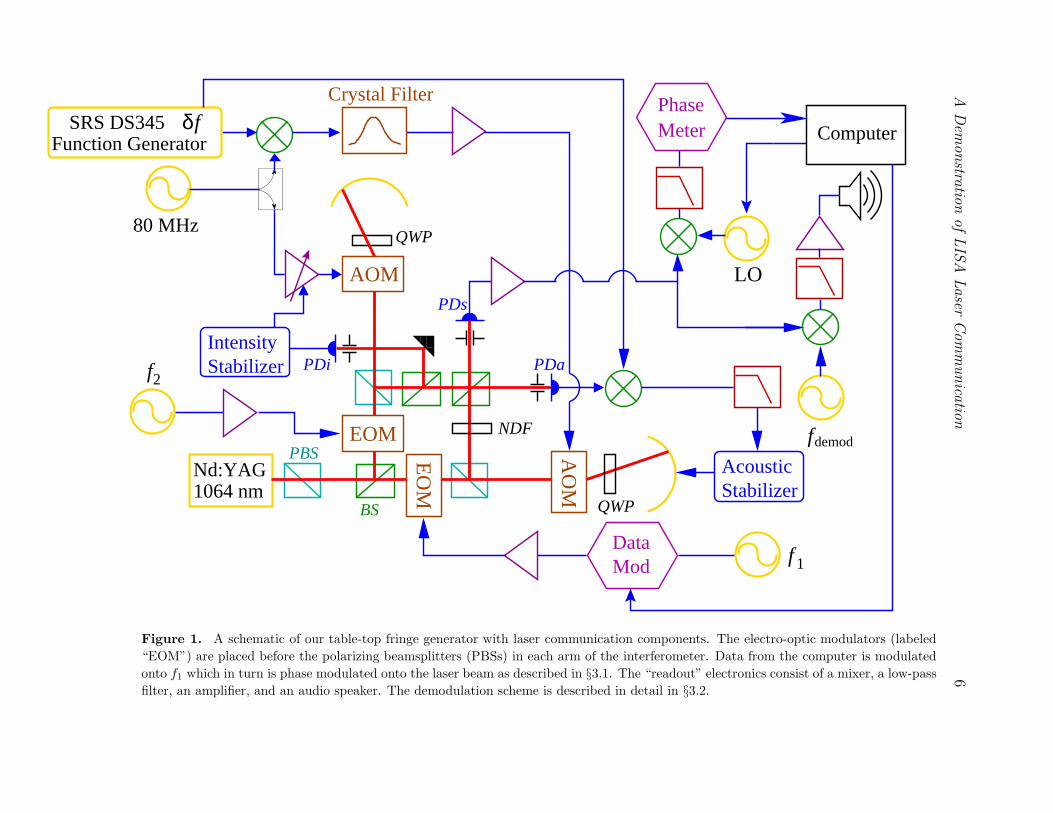
Our experimental setup is shown in Figure 1. In order not to double pass our EOMs
we place them before the polarizing beamsplitters (PBSs) in each arm. For the dim arm,
this placement simulates the LISA situation in which the laser beam is modulated before
attenuation by the pathlength distance between sciencecraft.
3.1. Implementation of Data Modulation
Our 5 × 5 × 20mm birefringent crystals are made of lithium niobate (LiNbO3). We
drive each EO crystal with synthesized function generators. The maximum frequency
of these devices is 30MHz. The maximum signal level of these devices is 10 volt-peak.
For our setup, the resulting modulation depth with maximum signal level is about 3%.
The modulation depth planned for LISA is 10% [11].
Each frequency synthesizer provides us with the subcarrier frequency for data
transmission. These signals are modulated with ranging tones and digital data and
then sent to the EOM, as shown in Figure 1. The frequencies f1 and f2 represent the
USO derived signals used in LISA. In LISA the sideband-sideband beatnote will contain
the relative phase jitters between the USOs on-board the two sciencecraft. In our setup
this beatnote contains phase jitters resulting from the relative electronic phase noise in
the two frequency synthesizers.
Ideally we would simultaneously simulate both the ranging tone modulation and
the digital data stream modulation. Due to hardware limitations, and for simplicity, we
have made measurements with only one of the modulations present at any time.
Our frequency synthesizers have a built-in phase modulation option. The ranging
tone sidebands, fm1 and fm2, are chosen to be in the hundreds of kHz. Their separation,
|fm1 − fm2|, is in the several tens of kHz. The ranging sideband-sideband beatnote will
be used as a vernier to determine meter-scale distance changes between the sciencecraft.
The larger scale distance determination between sciencecraft will be performed by
ground-based measurements.
For simplicity, when simulating digital data modulation we have opted to use the
built-in analog amplitude modulation port of our frequency synthesizers rather than use
a third-party data modulator, such as a phase-shift keyer. We utilize this port to stream
data from our computer to the EOM. When transmitting data we do not have ranging
ADem
onstra
tionofLISA
Laser
Communica
tion
6
StabilizerIntensity
AO
M
EO
M
EOM
DataMod
���������������
���������������
AOM
QWP80 MHz
SRS DS345Function Generator
StabilizerAcoustic
Crystal Filter
Computer
BS QWP
fδPhaseMeter
PDi
PDs
1064 nm
PBS
PDa
Nd:YAG
LO
2
1
NDF
f
f
demod f
Figure 1. A schematic of our table-top fringe generator with laser communication components. The electro-optic modulators (labeled
“EOM”) are placed before the polarizing beamsplitters (PBSs) in each arm of the interferometer. Data from the computer is modulated
onto f1 which in turn is phase modulated onto the laser beam as described in §3.1. The “readout” electronics consist of a mixer, a low-pass
filter, an amplifier, and an audio speaker. The demodulation scheme is described in detail in §3.2.
A Demonstration of LISA Laser Communication 7
tones present on the EO frequencies, f1 or f2. For the case of digital data modulation we
do not utilize a sideband-sideband beatnote. Instead we beat the digital data sideband
on one laser beam with the subcarrier sideband on the other laser beam. This produces
a signal with frequency given by, e.g., δf + |f1 − f2| + fd, where δf is the difference
frequency between the carriers, and fd is the digital data modulation frequency. Ideally
we would chose fd to be in the MHz. Since we are not using an external data modulator
our digital data modulation frequency is limited to ten kilohertz. For timely feedback
on fidelity while aligning the interferometer we stream audio data from the computer
onto the laser for our “digital” data transfer. The speaker shown in Figure 1 is used for
“readout” of this signal.
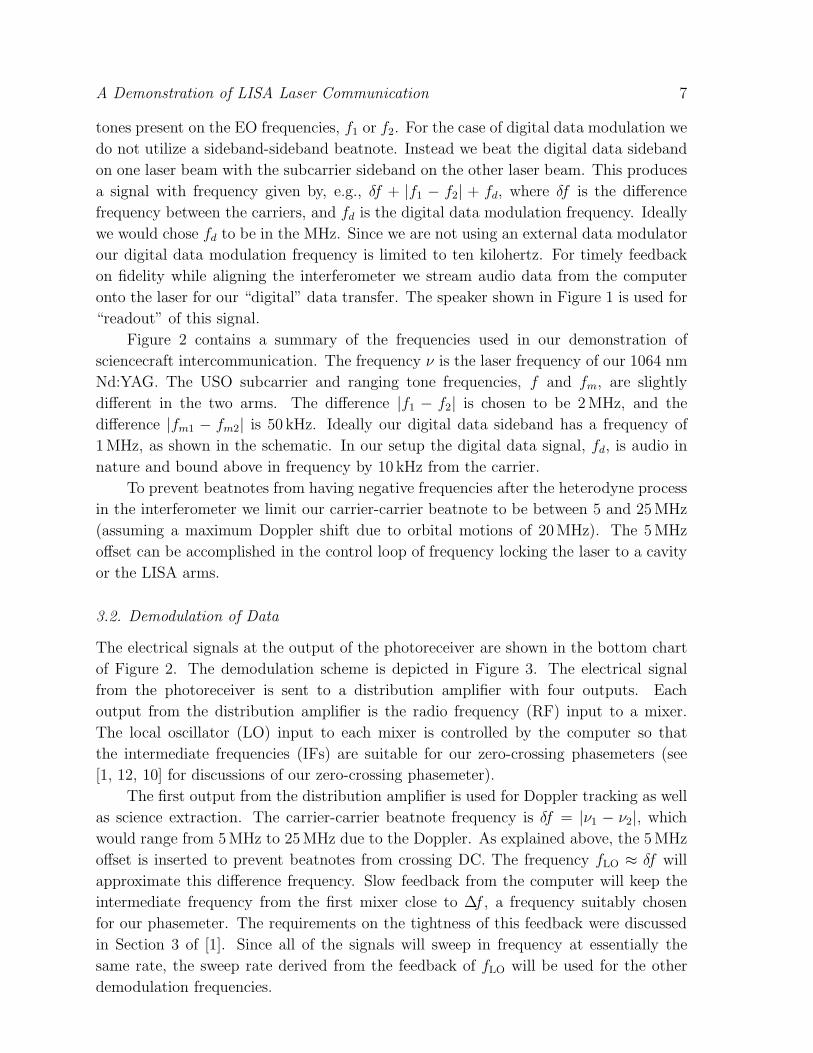
Figure 2 contains a summary of the frequencies used in our demonstration of
sciencecraft intercommunication. The frequency ν is the laser frequency of our 1064 nm
Nd:YAG. The USO subcarrier and ranging tone frequencies, f and fm, are slightly
different in the two arms. The difference |f1 − f2| is chosen to be 2MHz, and the
difference |fm1 − fm2| is 50 kHz. Ideally our digital data sideband has a frequency of
1MHz, as shown in the schematic. In our setup the digital data signal, fd, is audio in
nature and bound above in frequency by 10 kHz from the carrier.
To prevent beatnotes from having negative frequencies after the heterodyne process
in the interferometer we limit our carrier-carrier beatnote to be between 5 and 25MHz
(assuming a maximum Doppler shift due to orbital motions of 20MHz). The 5MHz
offset can be accomplished in the control loop of frequency locking the laser to a cavity
or the LISA arms.
3.2. Demodulation of Data
The electrical signals at the output of the photoreceiver are shown in the bottom chart
of Figure 2. The demodulation scheme is depicted in Figure 3. The electrical signal
from the photoreceiver is sent to a distribution amplifier with four outputs. Each
output from the distribution amplifier is the radio frequency (RF) input to a mixer.
The local oscillator (LO) input to each mixer is controlled by the computer so that
the intermediate frequencies (IFs) are suitable for our zero-crossing phasemeters (see
[1, 12, 10] for discussions of our zero-crossing phasemeter).
The first output from the distribution amplifier is used for Doppler tracking as well
as science extraction. The carrier-carrier beatnote frequency is δf = |ν1 − ν2|, whichwould range from 5MHz to 25MHz due to the Doppler. As explained above, the 5MHz
offset is inserted to prevent beatnotes from crossing DC. The frequency fLO ≈ δf will
approximate this difference frequency. Slow feedback from the computer will keep the
intermediate frequency from the first mixer close to ∆f , a frequency suitably chosen
for our phasemeter. The requirements on the tightness of this feedback were discussed
in Section 3 of [1]. Since all of the signals will sweep in frequency at essentially the
same rate, the sweep rate derived from the feedback of fLO will be used for the other
demodulation frequencies.

A Demonstration of LISA Laser Communication 8
2f m=200 kHz
50 kHzRanging Data
2 MHz
δf = f1fm2 f2ν2fm1" "
ν
Am
plitu
deA
mpl
itude
Frequencyν−
1064 nm = 282 THz
2f d =2 MHz
Science Data5 MHz−−25 MHz
Frequency
30 MHz
1 MHz
USO DataDigital Data
− −1ν −
ν+f f
""−" "f f2 d1
Figure 2. Frequency plan for our laser intercommunication demonstration. The top
chart represents the frequency plan for each arm of the interferometer after the phase
modulating EOM and before the frequency shifting AOM. The bottom chart shows
the collection of beatnotes at the science photoreceiver, PDs.
The second output from the distribution amplifier is used in the extraction of
the USO signal. The USO data is located in frequency space at δf ± |f1 − f2|. The
frequency fClock approximates this frequency: fClock = fLO+2MHz. Slow feedback from
the computer will fix the IF of the second mixer at ∆f , suitable for our phasemeter.
The third output from the distribution amplifier is used for extraction of ranging
information. In our frequency plan, Figure 2, the ranging tone sideband-sideband
beatnote is at 50 kHz. This allows us to set the demodulation frequency fRange −∆f =

A Demonstration of LISA Laser Communication 9
f∆LO f −
PhaseMeter
PhaseMeter
f∆
PhaseMeter
f∆Clock f
Range f
Data f
Com
puter
PDs
−
−
ADC1−bit
Figure 3. Our proposed demodulation plan for use with the zero-crossing phasemeter.
The intermediate frequency ∆f is chosen appropriately for our phasemeter to be on
the order of ten kilohertz. Feedback from the computer adjusts the oscillators for the
slow Doppler frequency sweep due to orbital motions of the sciencecraft.
fClock. In this way the IF from the third mixer will be 50 kHz. Although higher than our
usual IF of 10 kHz, 50 kHz is an acceptable frequency for our phasemeter. As discussed
in [1], our phasemeter can accommodate IFs as high as 100 kHz without being dominated
by timing noise errors.
Our proposal for the digital data signal is to use phase-shift keying. The
demodulation process would proceed as follows. The data demodulation frequency
approximates the expected frequency of the digital data sideband beatnote: fData =
fClock + 1MHz. Instead of mixing the signal from PDs with fData − ∆f , which would
result in a phase-shift keyed ∆f signal, we propose to mix the PDs signal with fData.
This results in a TTL-like signal jumping from high to low based on the phase-shifts
between the LO and the signal from PDs. This TTL-like signal can then be sampled
A Demonstration of LISA Laser Communication 10
with a 1-bit ADC.
As mentioned in §3.1, for simplicity we are modulating audio data onto our
subcarrier rather than a sub-subcarrier containing phase-shift keyed digital data. When
audio data is present there are no ranging tones on the subcarriers. In this setup the
subcarrier for the dim arm of the interferometer is amplitude modulated with audio
data. The demodulation scheme used for this setup is that shown in the schematic of
Figure 1. The demodulation frequency used for the audio data demodulation is set to the
USO frequency, fdemod = fClock, just as in the case for the ranging data demodulation.
The demodulated output is amplified and sent to a speaker rather than the phasemeter.
When the speaker is turned on, the streaming audio data sent by the computer is heard
quite readily.
An alternative demodulation scheme would be to mix-out the signal in successive
steps. This scheme is similar to that which most likely would be used with a digital
phasemeter. At each step the signal is split into two paths. One path demodulates the
signal to an IF suitable for the phasemeter, and the other path demodulates the signal to
“DC”. The first demodulation step is to take out the carrier-carrier difference frequency
of δf . The Doppler is included in this demodulation step. The next largest frequency
component is the subcarrier-subcarrier difference frequency. After this demodulation the
ranging tone sideband-sideband beatnote and the digital data sideband remain. The
disadvantages with this demodulation scheme for an analog phasemeter is the increased
number of mixers and frequency sources. For a digital phasemeter, these disadvantages
are not present since the demodulation process occurs in software.
4. Data Comm Results
We present data taken from our modified table-top interferometer with the zero-crossing
phasemeter, presented in [1], of the science fringe signal, the USO signal, and the ranging
signal. In our setup the digital data signal was an analog audio stream which was heard
on a speaker as described above. In all cases the dim arm of the interferometer is 100 pW
and the bright arm of the interferometer is 0.5mW, as explained in [1].
To demonstrate that the EOM phase modulation does not adversely affect the LISA
science results we take science fringe data at a collection of Doppler offset frequencies,
δf , ranging from 50 kHz to 20MHz, similar to the data presented in [1]. In all cases
the Doppler frequency sweeps at a rate of 1Hz/s. In [1] we demonstrated that our
phasemeter is capable of handling sweep rates as fast as 1 kHz/s. The phase noise that
we present is computed by subtracting the known phase of our signal generator from the
reconstruction of the phase from our phasemeter (see [12]). From this set of residuals
we compute an amplitude spectral density, the phase noise, as a function of frequency
from the signal frequency.
A Demonstration of LISA Laser Communication 11
4.1. Timing a LISA-like Fringe with Data Modulation Present
The data presented in Figure 4 were taken while streaming audio was sent from the
computer to the EO crystal in the dim arm of the interferometer. The signal to the EO
crystal in the bright arm of the interferometer was unmodulated. This creates a data
modulated signal on the fringe 2MHz from the fringe frequency, which is the carrier-
carrier beatnote. The low-pass filter in our data demodulation scheme (see Figure 3)
removes the unwanted signals, such as the audio data and the subcarrier-subcarrier
beatnotes, and isolates the much larger amplitude science fringe frequency.
Each of the spectra in Figure 4 is the average of four 4.5-hour long data sets. For
this data we instructed the LO to keep the IF between 1 and 2 kHz. Since the subcarriers
are small in amplitude, and separated in frequency by 2MHz, the subcarrier frequency
has little effect on the science results.
There is some residual noise at approximately 3mHz. Instructing the frequency
synthesizer to output a constant frequency removes this noise bump. Figure 5 shows
data with swept and constant frequency signals. This increase in phase noise most
likely is caused by small changes in the phase delay through the crystal filter used in the
frequency generation technique explained in [1]. The phase delay through the crystal
filter is frequency dependent. This small change in phase appears to be the source of
the increased phase noise around 30mHz, although why it peaks up near 30mHz is not
clear. This noise source was not apparent in the data of [1] because acoustic noise was
the dominating noise source below 100mHz. The reduction of acoustic noise has been
mediated in this data by enclosing the interferometer in a sound-insulating box.
4.2. Timing the USO Subcarrier-Subcarrier Beatnote
It is important not only to preserve the phase integrity of the science fringe when data
modulation is present, but also to preserve the data modulation integrity itself. In
particular, as discussed at the beginning of this article, the subcarrier will be a signal
derived from the USO. In the data presented in the previous section we amplitude
modulated the subcarrier in the dim arm with audio data. This audio data was
modulated onto the laser beam in our interferometer, and we listened to a speaker
to verify fidelity.
To determine the phase integrity of the subcarrier frequency which represents the
information transfer of an ultra-stable clock, we do not modulate on streaming audio.
Audio frequencies range from 20Hz to 20 kHz. If we wish to time the subcarrier-
subcarrier beatnote by mixing it, e.g., from δf + 2MHz, to a suitable IF for our
phasemeter, e.g., ∆f = 10 kHz, then our signal will be contaminated with irremovable
audio data.
Modulating a sub-subcarrier onto the subcarrier at a much higher frequency, e.g.,
1MHz as shown in the frequency plan of Figure 2, would make filtering the audio data far
more feasible. Our frequency synthesizer has a maximum analog modulation frequency
of 10 kHz. Using an external modulator, such as a phase-shift keyer with an additional

A Demonstration of LISA Laser Communication 12
Figure 4. Phase noise of LISA-like fringes with a data modulation present. The
phase noise appears independent of baseband frequency over the range examined. See
Figure 5 for comparision of phase noise levels with and without data modulations.
Figure 5. Comparision of phase noise of LISA-like fringes with and without data
modulations present. The noise bump at 30mHz is present only for the data where the
interferometric fringe is sweeping in frequency and is due to the frequency generation
technique as explained in the text. The addition of data modulations does not hinder
the science performance of our interferometer.

A Demonstration of LISA Laser Communication 13
Figure 6. Phase noise of the USO subcarrier-subcarrier beatnote. The ranging
tone sideband-sideband beatnote is at 51 kHz when the USO beatnote is mixed to
1 kHz. Strong filtering after mixing effectively removes the ranging tone from this
measurement. The LISA USO requirement is set by TDI [7].
frequency source, would allow us to have a higher frequency modulation rate.
Instead of modulating audio data onto the subcarrier in the dim arm while leaving
the subcarrier in the bright arm unmodulated, we phase modulate a 100 kHz ranging
tone onto one subcarrier and a 150 kHz ranging tone onto the other. The sidebands
present on the subcarrier-subcarrier beatnote are the two ranging tones individually as
well as the ranging tone sideband-sideband beatnote. Since the ranging tones are in
the hundreds of kilohertz and the ranging tone beatnote is 50 kHz, we use an IF of
∆f = 1kHz with strong filtering to remove the unwanted signals.
Recall from §2.1 that the phase noise requirement on the USO signal is less
stringent than that on the fringe signal, the requirement is 10−4 cycles/√Hz at 1mHz.
Figure 6 contains the phase noise spectrum of the subcarrier-subcarrier beatnote
signal passing through the interferometer as well as the phase noise spectrum of the
subcarrier-subcarrier signal sent directly to the demixer, without passing through the
interferometer. The latter case signal was generated by mixing the two subcarriers
together, sending them through a low-pass filter, producing a |f1 − f2| signal, and then
a demixer to a suitable IF, ∆f = 1kHz. The noise level of the subcarrier beatnote
is higher than that of the fringes presented in Figure 4 but still below the LISA USO
requirement. The increase in phase noise is due to the smaller signal amplitude of the
subcarrier beatnote on the output of the photoreceiver as well as the fact that our
acoustical stabilization loop attempts to fix the phase of the fringe signal but does not

A Demonstration of LISA Laser Communication 14
Figure 7. 100 kHz and 150 kHz tones are phase modulated onto onto the subcarriers.
The phase modulation depth was set to 90◦. The phase noise level is being dominated
by voltage noise in our photoreceiver circuit. The assumed LISA ranging requirement
of 20m is about 6.7× 10⁻³ cycles/√Hz, well above the noise levels presented here.
stabilize other signals [1].
4.3. Timing the Ranging Tone Sideband-Sideband Beatnote
Ranging tones may be modulated onto the subcarrier and used to assist in the
determination of the armlengths of the LISA interferometer. The ranging tones on
LISA will be in the hundreds of kilohertz, and the modulation depths will be about
5% of the total laser beam. This is a 50% modulation on the subcarrier. We can
demonstrate this process by modulating tones onto our subcarriers in much the same
way that is planned to be done on LISA.
As for the case of timing the USO subcarrier-subcarrier beatnote, we do not
modulate on streaming audio as this will confuse the phase of our subcarrier and tone.
We modulate one subcarrier with 100 kHz and the other with 150 kHz. We demodulate
the signal from the photoreceiver PDs with fRange−∆f = fClock as described in §3.2. Theresulting signal frequency after filter is 50 kHz. Changes in the phase of this signal are
a result from changes in the pathlength difference of our interferometer, akin to LISA.
Figure 7 contains phase noise data of this 50 kHz signal as well as the corresponding
electronic signal created by mixing the two subcarrier signals electronically.
There is no firm LISA requirement on the ranging tones. However, it is assumed
that a measurement sensitivity of ∆L = 20m would be a reasonable goal. At f =
100 kHz this is a phase measurement of f∆L/c = 6.7 × 10⁻³ cycles/√Hz. Our data
A Demonstration of LISA Laser Communication 15
exceeds this measurement requirement.
5. Summary
We have modified our table-top interferometer presented in [1] with a laser
communication system. We have successfully modulated hundred-kilohertz phase-
modulated 28 and 30MHz signals onto our laser beam. We have timed the phase of
the ranging tone sideband-sideband beatnote and the subcarrier-subcarrier beatnotes
separately and have demonstrated that the phase noise levels are below the LISA
requirements. For verification of data transfer on the subcarrier we amplitude modulated
the subcarrier in the dim arm with analog audio data. During this exercise the subcarrier
in the bright arm of the interferometer was unmodulated. This data was received,
demodulated, and the audio data was played back on a speaker.
There are a number of differences between our setup and the one which will be
implemented in LISA. We have phase modulated each arm of our interferometer with
signals derived from phase locked frequency synthesizers. In the case of LISA the
phase modulations will be derived from independently running USOs. The phase of the
heterodyned beatnote is measured. In the case of LISA this phase information contains
the relative phase fluctuations between the USOs on-board the two sciencecraft, and
is used in the TDI algorithm to correct for laser frequency noise. In our case this
phase information contains the relative jitter between our two phase locked frequency
synthesizers. The phase noise level of the USO signal we have measured is much smaller
than that expected for LISA. Regardless of the level of the noise, the measurement
precision required by TDI is 10−4 cycles/√Hz. We have measured the noise to a precision
of 10µcycles/√Hz.
Another difference between our experiment and LISA is the choice of frequencies.
The USO subcarrier frequency will be in the gigahertz range on LISA, whereas we used
28 and 30MHz. Using a much higher frequency further reduces the effects on the science
fringe. In addition, having a high frequency phase modulation, such as 2GHz, reduces
the effect of laser frequency noise contamination of the subcarriers. In our experimental
setup, since we use one laser for the heterodyne measurement, the laser frequency noise
contribution to our measurement is effectively absent.
An improvement to our experimental setup would be to better demonstrate the full
LISA laser communication plan described in §3.1. In particular we would use an external
phase-shift keyer to modulate sub-subcarrier signals at fd1 and fd2. These frequencies
might be 1MHz and 3MHz (see Figure 2). These sub-subcarriers would then be phase
modulated onto the subcarriers f1 and f2 before modulation onto the laser beams with
the EOMs. Demodulation of the science photoreceiver signal by fData = fClock + 1MHz
or by fData = fClock+3MHz would produce a TTL-like signal containing the phase-shift
keyed data.
A Demonstration of LISA Laser Communication 16
Acknowledgments
Support for this work has been provided under NGT5-50451 and S-73625-G. We would
like to thank Peter L. Bender, John Hall, and Jun Ye for their generous insight to
aspects of this project.
References
[1] S E Pollack and R T Stebbins, “Demonstration of the Zero-Crossing Phasemeter with a LISA
Test-bed Interferometer”, submitted to Class. Quantum Grav. (2005).
[2] B S Sheard, M B Gray, D A Shaddock and D E McClelland, “Laser frequency noise suppression
by arm-locking in LISA: progress towards a bench-top demonstration”, Class. Quantum Grav.
22 (2005), S221–S226.
[3] A F G Marin, et. al., “Phase locking to a LISA arm: first results on a hardware model”, Class.
Quantum Grav. 22 (2005), S235–S242.
[4] Julien Sylvestre, “Simulations of laser locking to a LISA arm”, Phys. Rev. D 70 (2004), 102002.
[5] M Tinto, D A Shaddock, J Sylvestre and J W Armstrong, “Implementation of time-delay
interferometry for LISA”, Phys. Rev. D 67 (2003), 122003.
[6] M Tinto, F B Estabrook and J W Armstrong, “Time delay interferometry with moving spacecraft
arrays”, Phys. Rev. D 69 (2004), 082001.
[7] Paul McNamara, “Requirements by IMS Subsystem”, NASA GSFC, January 2005.
[8] IMS ITAT, “Functional Definition and Reference Architecture of the IMS for LISA”, ESA and
NASA, November 2004.
[9] M Tinto, M Vallisneri, and J W Armstrong, “Time-delay interferometric ranging for space-borne
gravitational-wave detectors”, Phys. Rev. D 71 (2005), 041101(R).
[10] O Jennrich, R T Stebbins, P L Bender, and S Pollack, “Demonstration of the LISA phase
measurement principle”, Class. Quantum Grav. 18 (2001), 4159–4164.
[11] LISA Team, “LISA System and Technology Study Report”, edition 1.04, ESA, July 2000.
[12] S E Pollack, O Jennrich, R T Stebbins, and P Bender, “Status of LISA Phase Measurement work
in the U.S.”, in Finn [13], pp. S192–S200.
[13] L S Finn (ed.), “Proceedings of the 4th International LISA Symposium”, Class. Quantum Grav. ,
vol. 20, number 10, Penn State University, 19–24 July 2002, Institute of Physics, May 2003.
[14] P L Bender, K V Danzmann, and the LISA Study Team, “Laser Interferometer Space Antenna
for the Detection of Gravitational Waves, Pre-Phase A Report”, MPQ-233 2nd ed., Max-Planck
Institute for Quantum Optics, Garching, Germany, 1998.

ADemonstrationofLISA
LaserCommuni ation
13
StabilizerIntensity
AO
M
EO
M
EOM
DataMod
f
f
���������������
���������������
AOM
QWP80 MHz
SRS DS345Function Generator
StabilizerAcoustic
Crystal Filter
Computer
BS QWP
fδPhaseMeter
PDi
PDs
1064 nm
PBS
PDa
Nd:YAG
LO
fdemod
2
1
NDF
Figure 2. A s hemati of our table-top fringe generator with laser ommuni ation omponents. The ele tro-opti modulators (labeled
\EOM") are pla ed before the polarizing beamsplitters (PBSs) in ea h arm of the interferometer. Data from the omputer is modulated
onto f
1
whi h in turn is phase modulated onto the laser beam as des ribed in x3.1. The readout ele troni s onsist of a bandpass �lter, a
mixer, a low-pass �lter, an ampli�er, and an audio speaker. The demodulation s heme is des ribed in detail in x3.2.


