
A CORRELATIONAL STUDY OF THE MOTIVATION AND ENGAGEMENT IN
TEACHERS: EXPERIENCE AND EFFECTIVENESS
by
Cynthia A. Phillips
Liberty University
A Dissertation Presented in Partial Fulfillment
Of the Requirements for the Degree
Doctor of Education
Liberty University
2016

2
A CORRELATIONAL STUDY OF THE MOTIVATION AND ENGAGEMENT IN
TEACHERS: EXPERIENCE AND EFFECTIVENESS
by Cynthia A. Phillips
A Dissertation Presented in Partial Fulfillment
Of the Requirements for the Degree
Doctor of Education
Liberty University, Lynchburg, VA
2016
APPROVED BY:
Linda L. Holcomb, EdD, Committee Chair
Reginald Kimball, EdD, Committee Member
Lindsay B. Masland, PhD, Committee Member
Scott Watson, PhD, Associate Dean, Advanced Programs

3
ABSTRACT
The purpose of this correlational study was to determine if there is a relationship between the
motivation and engagement level of induction (first four years) teachers as compared to veteran
(five or more years) teachers using the overall score on the Teacher Keys Effectiveness System
(TKES, 2013) and the Motivation and Engagement Scale (MES-W, 2012) developed by Martin
(2012). Teachers from four participating districts located in northeast Georgia were divided into
two groups based on years of teaching experience. Both groups participated in an online survey
(MES-W, 2012), which collected demographic data as well as responses to the MES-W survey.
School districts provided the researcher with the TKES overall score data. Data were analyzed
using a series of statistical analyses, which included ANCOVA, t-tests, correlations, and multiple
regressions. The MES-W (2012) results and the TKES overall scores were analyzed to
investigate the relationship of motivation and engagement and the number of years of experience
of the respondents. There was not a statistically significant relationship found between the
criterion variable of the MES-W and the predictor variables of years of experience for the two
groups (induction level n = 35; veteran level n = 126). A variety of limitations and implications
were presented along with suggested future research opportunities.
Keywords: Motivation, engagement, self-efficacy, self-determination, autonomy,
intrinsic, extrinsic

4
Dedication and Acknowledgements
“For I know the plans I have for you,” declares the LORD, “plans to prosper you and not
to harm you, plans to give you hope and a future” (Jeremiah 29:11, New International Version).
I would like to give thanks and praise to my Lord and Savior, Jesus Christ. As a
Christian and an educator, the only things I have accomplished in this life have been through
God’s provision and grace.
This dissertation is dedicated to my husband, David, whose support (including endless
meals and chauffeur services) enabled me to pursue this dream. I also acknowledge and thank
my children, Courtney P. Callicutt (and son-in-law Joshua) and Grayson Phillips (and daughter-
in-law Victoria) for believing in me, encouraging me, and supporting me.
I especially give thanks and appreciation to Dr. Linda Holcomb for her patience and
guidance and Dr. Gary Adams for his tireless efforts as my research consultant.

5
Table of Contents
ABSTRACT .................................................................................................................................... 3
Dedication And Acknowledgements ...............................................................................................4
List Of Tables ..................................................................................................................................8
List Of Figures ...............................................................................................................................10
List Of Abbreviations ....................................................................................................................11
CHAPTER ONE: INTRODUCTION .......................................................................................... 12
Background ........................................................................................................................14
Problem Statement ............................................................................................................ 18
Purpose Statement ............................................................................................................. 18
Significance of the Study .................................................................................................. 19
Research Question(s) ........................................................................................................ 20
Null Hypotheses ................................................................................................................ 21
Alternate Hypotheses ........................................................................................................ 22
Identification of Variables ................................................................................................ 23
Definitions and Acronyms ................................................................................................ 23
Instruments ........................................................................................................................ 24
Research Summary ........................................................................................................... 27
Assumptions and Limitations ........................................................................................... 28
CHAPTER TWO: REVIEW OF THE LITERATURE ................................................................29
Introduction ....................................................................................................................... 29
Theoretical Framework ..................................................................................................... 29
Relationship Between Motivation and Engagement ......................................................... 30

6
Intrinsic Versus Extrinsic Motivation ............................................................................... 36
Teacher Effectiveness and Motivation .............................................................................. 38
Teacher's Role ................................................................................................................... 43
Teacher Perceptions .......................................................................................................... 46
Teacher Self-Efficacy ....................................................................................................... 47
Relational Learning ........................................................................................................... 51
Teacher and Peer Relationships ........................................................................................ 54
Professional Learning and Teacher Preparation ............................................................... 56
Summary ........................................................................................................................... 59
CHAPTER THREE: METHODOLOGY .....................................................................................60
Introduction ....................................................................................................................... 60
Design ............................................................................................................................... 61
Questions and Hypotheses ................................................................................................ 64
Research Question(s) ........................................................................................................ 64
Null Hypotheses ................................................................................................................ 64
Alternate Hypotheses ........................................................................................................ 65
Participants ........................................................................................................................ 66
Instrumentation ................................................................................................................. 68
Procedures ......................................................................................................................... 72
Data Analysis .................................................................................................................... 74
CHAPTER FOUR: FINDINGS .....................................................................................................76
Research Questions ............................................................................................................76
Hypotheses .........................................................................................................................77

7
Descriptive Statistics ..........................................................................................................78
Results ................................................................................................................................89
CHAPTER FIVE: DISCUSSION, CONCLUSIONS, AND RECOMMENDATIONS .............107
Discussion ........................................................................................................................107
Research Problem ............................................................................................................107
Summary of the Findings .................................................................................................108
Discussion of the Results .................................................................................................116
Implications ......................................................................................................................119
Limitations .......................................................................................................................120
Recommendations for Future Research ...........................................................................122
REFERENCES ............................................................................................................................125
APPENDICES .............................................................................................................................140
Appendix A: MES-W Sample .........................................................................................140
Appendix B: TKES Rubric ..............................................................................................142
Appendix C: Superintendent Permission .........................................................................145
Appendix D: Authorized Consent Form ..........................................................................146
Appendix E: IRB Approval .............................................................................................149

8
List of Tables
Table 1: Research Designs Rejected for this Study……………………………………………..62
Table 2: Demographic Data of Participants……………………………………………………..67
Table 3: Statistical Data for Teachers…………………………………………………………...67
Table 4: Teacher Assessment on Performance Standards (TAPS)...……………………………70
Table 5: Frequency Analysis - Teaching Position………………………………………………79
Table 6: Frequency Analysis - Gender………………………………………………………….79
Table 7: Frequency Analysis - Subjects Taught...........................................................................80
Table 8: Frequency Analysis - Years of Experience……………………………………………81
Table 9: Frequency Anaysis - Age (voluntary information)……………………………………82
Table 10: Descriptive Statistics - MES-W Score……………………………………………….83
Table 11: Descriptive Statistics - TAPS Overall Score…………………………………………84
Table 12: Group Descriptive Statistics - MES-W Score & TAPS Overall Score by Years of
experience……………………………………………………………………………………….86
Table 13: Group Descriptive Statistics - MES-W Score & TAPS Overall Score by Teaching
Position…………………………………………………………………………………………..87
Table 14: Group Descriptive Statistics - MES-W Score & TAPS Overall Score by Subject
Taught……………………………………………………………………………………………88
Table 15: Tests of Normality for TAPS Overall Score and MES-W Score…………………….91
Table 16: Mann Whitney U Test - Descriptive Statistics for Groups and Total...……………...93
Table 17: Mean and Sum of Ranks……………………………………………………………..94
Table 18: Mann Whitney U Test Statisticsa…………………………………………………….94
Table 19: Pearson's r Correlation - Induction Teachers Only (<5 years of experience) …….....96

9
Table 20: Spearman rho Correlation Between TAPS Overall Scores and MES-W Scores…….96
Table 21: Spearman rho Correlation Between Components of TAPS and MES-W Scores -
Induction Teachers……………………………………………………………………………….97
Table 22: Descriptive Statistics - Veteran Teachers Only (>5 years of experience)……………99
Table 23: Pearson's r Correlation Between TAPS Overall Scores and MES-W Scores Veteran
Teachers Only……………………………………………………………………………………99
Table 24: Tests of Homogeneity-of-Regression (Slope) Assumption for MES-W Scores……101
Table 25: Descriptive Statistics - Dependent Variable MES-W Score………………………..102
Table 26: Levene’s Test of Equality of Error Variancesa…………………………………….102
Table 27: Tests Between-Subjects Effects-Dependent Variable: MES-W Score……………..103
Table 28: Tests of Homogeneity-of-Regression (Slope) Assumption for MES-W
Scores…………………………………………………………………………………………...104
Table 29: Estimates -Dependent Variable: MES-W Score…………………………………….104
Table 30: Summary of Tests of the Null Hypotheses …………………………………………..105
Table 31: TAPS Summative Cut Scores (TKES, 2013)……………………………………......118

10
List of Figures
Figure 1: Pie Chart of Subject Taught ......................................................................................... 81
Figure 2: Histogram - MES-W Score .......................................................................................... 83
Figure 3: Histogram - TAPS Overall Score ................................................................................. 85
Figure 4: Boxplot for MES-W Scores ......................................................................................... 91
Figure 5: Boxplot of TAPS Overall Scores ................................................................................. 92
Figure 6: Error Bar Plot for TAPS Overall Scores by Years of Experience ................................ 93
Figure 7: Scatterplot of MES-W Scores by TAPS Scores - Induction Teachers Only ................ 96
Figure 8: Scatterplot of MES-W Scores by TAPS Scores - Veteran Teachers Only ................ 100
Figure 9: Estimated Marginal Means Plot - MES-W Scores ..................................................... 105

11
List of Abbreviations
MES-W - Motivation and Engagement Scale, Martin (2012).
TAPS – Teacher Assessment on Performance Standards, the performance evaluation portion of
the Teacher Keys Effectiveness System (GaDOE, 2013).
TKES—Teacher Keys Effectiveness System, Georgia’s new evaluation system for teachers
(GaDOE, 2013).

12
CHAPTER ONE: INTRODUCTION
Teacher burnout has become a costly and damaging phenomenon for school districts
across the nation (Williams, 2015). How big of an issue is teacher burnout? According to The
National Commission on Teaching and America’s Future (NCTAF, 2015), 46% of new
teachers leave the profession within the first five years. This was calculated to be a loss of
about $7.3 billion a year for teacher attrition (NCTAF, 2015). What has caused teacher
burnout?
The quality of the workforce within a school or school district has a direct impact on
the performance outcomes of the students. The first major piece of research that resounded
throughout the country, entitled A Nation at Risk: The Imperative for Educational Reform of
1983, shed light on the issue of the quality of education in the United States and began the first
view into the quality of individual teachers. The research (Nation at Risk, 1983) showed
teacher quality to be an important factor in student achievement. It further indicated that
teacher effectiveness encompassed more than content knowledge and pedagogy (Kroth, 2007;
Kurtz & Knight, 2003; Wilson, 2009; Zhang & Bartol, 2010). In fact, Kroth (2007)
determined that one particular skill that successful teachers must possess is the ability to
motivate. Wilson (2009) reported that the effectiveness of a teacher was also influenced by
the context of a teacher’s work. If teacher effectiveness mattered to such an extent, then
students who had poor quality teachers who lacked the necessary skills to motivate and teach
effectively were at a disadvantage (Akey, 2006; Demir, 2004; Kurtz & Knight, 2003; Martin
2007; Zhang & Bartol, 2010). Kroth (2007) further stated that although the ability to motivate
students was essential to teacher effectiveness, most beginning teachers did not have the
proper preparation and skills to motivate and engage learners.

13
The motivation and engagement level of the students could be distinctively connected to
the motivation and engagement displayed in the classroom by the teachers (Akey, 2006; Kuh,
2007; Redding & Walberg, 2012). Challenges in education have emerged as the Elementary and
Secondary Education Act of 2001, also known as No Child Left Behind (NCLB), presented
rigorous assessment and annual measurable objectives (AMOs) for school districts, which
resulted in a score known as Adequate Yearly Progress (AYP). Additionally, a value-added
evaluation model, such as Georgia’s new Teacher Keys Effectiveness System (TKES, 2012),
placed much higher stakes on evaluating the effectiveness of teachers. The Georgia Professional
Standards Commission (2006) provided data concerning the current and future workforce needs
for the state of Georgia, which outlined a severe teacher shortage by 2020. Unmotivated
students provided a unique challenge to improving student achievement and learning, so how
much of this outcome could be attributed to the teacher’s own motivation and engagement level
(Akey, 2006; Kuh, 2007; Redding & Walberg, 2012)? As a result of improved motivation and
engagement, students developed higher self-efficacy skills. Research shows that enhanced
intrinsic motivation has a direct correlation on student achievement (Akey, 2006; Kuh, 2007;
Redding & Walberg, 2012). Motivation and engagement are not determined by reward and
punishment, but are influenced by emotions and cognitive abilities (Akey, 2006; Redding &
Walberg, 2012). Therefore, a study of the motivation and engagement levels of the induction
(first four years) level and veteran (five or more years) teachers provided insight into the
relationship of teacher effectiveness and the TKES (2012). Since the burnout rate for about 44%
of Georgia’s teachers is between three to five years, a study of the motivation and engagement
levels could provide the insight needed to stop the attrition rate. By separating the research
participants into two categories, induction level (first four years) and veteran (five or more)

14
years, insight into why teachers chose to leave the field of education prematurely could be
gained. One area in which there is a dearth of empirical research is whether or not the teachers’
levels of experience correlated with their motivation and engagement levels. This provided an
important research opportunity that was worth investigating.
Background
Ensuring all students are taught by a highly effective teacher is one of the main objectives
for schools and school districts (Deci, Koestner, & Ryan, 2001). In fact, public education has
generally operated under the premise that a high school diploma was vital for college and/or
career readiness. Hattie (2009) conducted a meta-analysis of student achievement and found that
the influences on student achievement included a variety of factors. Students’ home life
experiences, for example, played a large role in achievement outcomes. These home life
experiences included tertiary factors such as socioeconomic status and parents’ educational level.
Another factor was the innate mental ability of students, which included a particular capacity to
learn certain content areas at high levels. Additionally, the influence of the teacher was highly
correlated to student achievement success. Another contributing factor was the self-efficacy
level of students, which was attributed to motivation and engagement levels (Hattie, 2009;
Appleton, Christenson, & Furlong, 2008). Undoubtedly there is a strong relationship between
student motivation and achievement levels, as documented in a vast amount of research studies.
However, with the advent of value-added teacher evaluation instruments tied to student growth
(TKES, 2013), teacher effectiveness is also an imperative for motivation and engagement (Akey,
2006; Demir, 2011; Garcia-Reid et al., 2005; Mercer & DeRosier, 2010).
Despite the plethora of research about the factors that influence student achievement
levels, the national view was that increased student achievement was the result of increased

15
accountability (Appleton et al., 2008; Hattie, 2009). The big stick, Adequate Yearly Progress
(AYP) as determined by the Federal Department of Education, set national benchmarks toward
the goal of 100% of students meeting grade level standards and graduating from high school by
the year 2014-2015 (ESEA, 2001). Teachers must manage the learning environment, motivate
the students, encourage the parents, and provide adequate support for teaching and learning. For
teachers, the job description often encompassed the “ability to enlist, mobilize, and motivate
others to apply their abilities and resources to a given cause” (Eyal & Roth, 2010, p. 256).
The environment of accountability has caused impediments in teaching higher level
thinking skills. “By engaged learning, we mean that all student activities involve active
cognitive processes such as creating, problem-solving, reasoning, decision-making, and
evaluation” (Kearsley & Shneiderman, 1999, p. 1). More often than not, the environment of a
school did not allow for a great deal of autonomy, either on the part of the students or the adults
in the building. State, federal and local regulations seemed to translate into rigid and strict rules
governing thoughts and actions of the school district. Trilling (2010) also explored the process
of critical thinking, questioning, and problem solving skills, and how this inquiry based learning
positively influences motivation and engagement. Views into classrooms and school buildings
across the nation are reminiscent of the educational system in place a hundred years ago. Even
with the addition of 21st century technology, motivation and engagement levels among students
and adults in the classrooms are stagnant (Kurtz & Knight, 2003; Zhang & Bartol, 2010).
Identifying characteristics of motivation and engagement provides the impetus for
improving motivation and engagement among both students and adults in a school building.
According to Demir (2001), teachers are an important influence in how motivated and engaged
students are in the classroom. Research into intrinsic and extrinsic motivation among teachers

16
(Akey, 2006; Demir, 2004; Kurtz & Knight, 2003; Martin 2007; Zhang & Bartol, 2010) showed
that the working conditions, teacher job satisfaction, and the teachers’ commitment to the job
affected teacher absenteeism. In addition, many teachers who chose to leave the profession cited
similar reasons for disengagement (Demir, 2001).
Consequently, the motivation level of teachers predicted engagement of both teachers and
students (Demir, 2001). This research focused primarily on the self-determination theory, which
examined personality in relation to motivation, and relied on choice and sense of freedom in
decision making to improve intrinsic motivation. For example, the self-determination level of
the individual teacher was correlated to the engagement level of the students. The study
indicated that about 64% of the variance in student engagement was the result of an increase in
intrinsic motivation of the teachers.
Students who perceived the teachers cared about them and took the time to build a
positive relationship with them were more cognitively engaged in their own learning (Akey,
2006; Demir, 2011; Garcia-Reid et al., 2005; Mercer & DeRosier, 2010). Research also
indicated classrooms with established clear expectations exhibited higher engagement levels
among students and teachers (Akey, 2006; Mercer & DeRosier, 2010). A research study by
Hufton, Elliott, and Illushin (2002) determined students who displayed characteristics of
engagement and motivation, such as self-satisfaction and positive attitudes about school,
displayed higher achievement scores. This postulated that intrinsic behaviors, such as positive
attitudes, are correlated to engagement and motivation. Johnson (2008) indicated that teachers
who employed non-traditional strategies to influence student achievement, such as group
decision-making and independent work, provided conditions to improve motivation and
engagement. Research also indicated that choice provided higher levels of self-efficacy and

17
resulted in higher levels of engagement (Deci, Koestner, & Ryan, 2001; Eyal & Roth, 2010;
Green, Nelson, Martin, & Marsh, 2006). Teachers influence motivation and engagement through
the development of self-efficacy skills among stakeholders (Lewandowski, 2005; Martin, 2005).
Martin (2006) conducted research on teacher motivation and discovered that content
competency rather than pedagogy influenced teacher motivation and engagement. This research
also indicated that the teacher’s perception of motivation and engagement is related to his or her
own enjoyment and satisfaction in teaching. Green, et al. (2006) concluded that self-concept is a
key factor in motivated and engaged learners.
Three significant themes seemed to be evident in the previous research on motivation and
engagement. First, all studies reviewed indicated a strong relationship between motivation and
engagement and improved student achievement (Akey, 2006; Deci et al., 2001; Demir, 2011;
Eyal & Roth, 2010; Green et al., 2006; Lewandowski, 2005;). Second, self-efficacy pointed to
beliefs about learning and improved student achievement (Akey, 2006; Appleton et al., 2008;
Garcia-Reid et al., 2005; Kearsley & Shneiderman, 1999). Third, relational learning, which
included skills such as critical thinking and problem solving around relevant, real world issues,
positively correlated to engagement and motivation (Deci et al., 2001; Eyal & Roth, 2010; Green
et al., 2000). The gap in the literature indicated, however, that there was limited current research
on the motivation and engagement levels of the teachers and how this related to burnout and
teacher attrition.
Problem Statement
There is a plethora of research concerning student engagement; however, the gap in the
literature showed little empirical research concerning the impact of teacher experience levels on
motivation and engagement. Teachers manage the learning environment, motivate the students,

18
encourage the parents, and provide adequate support for struggling learners (Corrigan &
Chapman, 2008; Demir, 2011; Eyal & Roth, 2010). Many teachers are leaving the profession
prematurely, leading to a nearly 44% attrition rate in teachers leaving the profession within the
first five years (Akey, 2006; Appleton et al., 2008; Demir, 2011; Garcia-Reid et al., 2005;
Kearsley & Shneiderman, 1999). In the state of Georgia, teachers participate in a new evaluation
system; Teacher Keys Effectiveness System (TKES, 2013), which outlines ten standards that
measure the effectiveness of teachers in the classroom. The TKES system is a value-added
evaluation system, in which teachers are scored on the Teacher Assessment Performance
Standards (TAPS) and growth in student achievement. The value added assessment model has
changed the environment of teacher evaluation, so there are no current data to determine the
effect of the TKES on teacher motivation.
Purpose Statement
The purpose of this predictive correlational study was to investigate the relationship
between the motivation and engagement level of induction (first four years) and veteran level
(five or more years) as measured by the MES-W and the overall score on the TKES (2013). The
Self-Determination Theory (Deci & Ryan, 2000), which focuses on the interplay of the intrinsic
and extrinsic motivation of individuals to affect growth and psychological needs, provided the
framework for this research study. The variables of interest, motivation and engagement, were
generally defined as the willingness or drive to achieve a goal (Ainley, 2004; Deci et al., 2001;
Green et al., 2006; Kuh, 2007). Covariates and predictor variables were years of experience and
evaluation results on the TAPS portion of the Teacher Keys Effectiveness System (TKES).
Engagement was the extent to which someone cognitively persisted in a task (Akey, 2006;
Appleton et al., 2008; Garcia-Reid et al., 2005; Kearsley & Shneiderman, 1999). The variables

19
of interest, motivation and engagement, were measured through the Motivation and Engagement
Scale (see sample in Appendix A), which yielded a comprehensive measure of motivation and
engagement (Leim & Martin, 2011; Martin, 2012). The predictor variable was the teacher
response scores on the MES-W (Martin, 2012). The covariate was years of experience with the
induction level considered as the first four years of teaching and the veteran level considered as
five or more years of teaching. The MES-W and years of experience were correlated to the
summative assessment overall score on the Teacher Keys Effectiveness System (TKES, 2013),
which were reported as Level I (Ineffective), Level II (Needs Development), Level III
(Proficient), and Level IV (Exemplary).
Significance of the Study
The results from this study provided a number of significant and relatable implications in
the field of education. First, students need effective teachers in order to learn and achieve at high
levels (Split, Koomen, & Thijs, 2011). In fact, Harry Wong (2001), noted educational expert,
stated, “Two hundred studies have shown that the only factor that can create student achievement
is a knowledgeable, skillful teacher” (p. 1). In an age of value-added teacher evaluation, pay for
performance, more stringent protocols for teachers to obtain tenure status, and the demand for
more student achievement accountability, educators must determine how to improve factors that
will improve teacher effectiveness in a lasting and systemic way (Georgia Department of
Education, 2012).
Second, problem solving and critical thinking skills are developed as a result of cognitive
social interaction (Deci et al., 2001; Kuh, 2007). These two important cognitive functions are
key factors in developing self-efficacy and improving motivation. Vygotsky (1978) defined the
amount of support necessary to develop self-efficacy as the “zone of proximal development.”

20
The connection between social learning and cognitive process provides the foundation for
motivation and engagement. The Self-Determination Theory (Deci & Ryan, 2000) also
postulates that competence, psychological relatedness, and autonomy are key factors in growth
and critical thinking.
Therefore, it stands to reason that the quality of the teacher is one of the most important
factors (Demir, 2011; Wong, 2001) in school improvement. “An ineffective teacher can affect
student learning for years, but having two ineffective teachers in subsequent years can damage a
student’s academic career” (Wong, 2001, p. 2). If, in fact, the motivation and engagement level
of the teacher provides the foundation for an effective teacher, then it would be important to
identify and research this relationship. A correlation of the variables provided insight into the
relationship of motivation and engagement of the teachers and its related impact on teacher
effectiveness and attrition. It is also important to note that causation was not examined in this
research study, as it is difficult to prove or disprove. This correlational research was conducted
as the basis for perhaps a more rigorous quasi-experimental research project that could examine
causation.
Research Questions
The following are the research questions to be explored in this study:
Research Question 1: Is there a statistically significant difference in the level of
motivation and engagement, as measured by the MES-W (Martin, 2012), between induction
level teachers (first four years) and veteran level teachers (five or more years)?
Research Question 2: For induction level teachers (first four years), is there a
statistically significant relationship between teachers’ motivation and engagement, as measured

21
by the MES-W (Martin, 2012), and the results on the TAPS overall score portion of the Teacher
Keys Effectiveness System (TKES) formative evaluation?
Research Question 3: For veteran level teachers (five or more years), is there a
statistically significant relationship between teachers’ motivation and engagement, as measured
by the MES-W (Martin, 2012), and the results on the TAPS overall score portion of the Teacher
Keys Effectiveness System (TKES) formative evaluation?
Research Question 4: While controlling for the overall score on the TAPS portion of
the TKES, is there a statistically significant difference in the level of motivation and engagement
level, as measured by the MES-W (Martin, 2012), between induction level teachers (first four
years) and veteran level teachers (five or more years)?
Null Hypotheses
The following null hypotheses guided this study:
H01: There is no statistically significant difference in the level of motivation and
engagement, as measured by the MES-W (Martin, 2012), between induction level teachers (first
four years) and veteran level teachers (five or more years).
H02: For induction level teachers (first four years), there is no statistically significant
relationship between teachers’ motivation and engagement, as measured by the MES-W (Martin,
2012), and the results on the TAPS overall portion of the Teacher Keys Effectiveness System
(TKES) formative evaluation.
H03: For veteran level teachers (five or more years), there is no statistically significant
relationship between teachers’ motivation and engagement, as measured by the MES-W (Martin,
2012), and the results on the TAPS overall score portion of the Teacher Keys Effectiveness
System (TKES) formative evaluation.

22
H04: While controlling for the overall score on the TAPS portion of the TKES, there is
no statistically significant difference in the level of motivation and engagement, as measured by
the MES-W (Martin, 2012), between induction level teachers (first four years) and veteran level
teachers (five or more years).
Alternate Hypotheses
H11: There is a statistically significant difference in the level of motivation and
engagement, as measured by the MES-W (Martin, 2012), between induction level teachers (first
four years) and veteran level teachers (five or more years).
H12: For induction level teachers (first four years), there is a statistically significant
relationship between teachers’ motivation and engagement, as measured by the MES-W (Martin,
2012), and the results on the TAPS overall portion of the Teacher Keys Effectiveness System
(TKES) formative evaluation.
H13: For veteran level teachers (five or more years), there is a statistically significant
relationship between teachers’ motivation and engagement, as measured by the MES-W (Martin,
2012), and the results on the TAPS overall score portion of the Teacher Keys Effectiveness
System (TKES) formative evaluation.
H14: While controlling for the overall score on the TAPS portion of the TKES, there is a
statistically significant difference in the level of motivation and engagement, as measured by the
MES-W (Martin, 2012), between induction level teachers (first four years) and veteran level
teachers (five or more years).
Identification of Variables
The variables of interest are motivation and engagement of the induction (first four years)
level teachers and motivation and engagement of the veteran (five or more years) teachers as

23
measured on the MES-W (Martin, 2012), a validated motivation scale. Additionally, the first
predictor variable is the level of teacher experience, with induction level as the first four years or
veteran level of five or more years. The second predictor variable is the teacher’s overall score
as measured by the TAPS portion of the TKES (2013).
Definitions and Acronyms
1. ANCOVA—Analysis of covariance (ANCOVA) is a statistical analysis that provides
the means to explore the differences between groups while controlling for a continuous variable
(Gall, Gall, & Borg, 2007).
2. Engagement—Engagement was defined as the cognitively active participation in the
learning process (Akey, 2006; Appleton et al., 2008; Garcia-Reid et al., 2005; Kearsley &
Shneiderman, 1999). Engagement can be measured through both qualitative and quantitative
data sources (Appleton et al., 2008). Motivation and engagement were supported by self-
efficacy, which was the perceived belief of individuals about their own abilities and
achievements (Fredrick, 2011).
3. Motivation—Motivation was generally defined as a desire, willingness, or drive of an
individual (Ainley, 2004; Deci et al., 2001; Green, et al., 2006; Kuh, 2007). Motivation was
divided into two specific areas, drive and motive. “Drive” identified the internal factors that
affect outcomes and “motives” were the social psychological mechanisms (Ainley, 2004; Berti,
Molinari, & Speltini, 2010; Deci et al., 2001; Green, et al., 2006; Kuh, 2007). However,
motivation in and of itself was not an observable variable, so it was examined in light of the
levels of engagement. Students are motivated to learn when there is a connection between the
content and the relevance to life applications. This promoted engagement, which was active

24
participation in the learning process (Akey, 2006; Appleton et al., 2008; Garcia-Reid et al., 2005;
Kearsley & Shneiderman, 1999).
4. MES-W—Motivation and Engagement Scale, (Martin, 2015)
5. TAPS—Teacher Assessment on Performance Standards, the performance evaluation
portion of the Teacher Keys Effectiveness System (GaDOE, 2015).
6. TKES—Teacher Keys Effectiveness System, Georgia’s new evaluation system for
teachers (GaDOE, 2013).
Instruments
The Motivation and Engagement Scale (MES-W), developed in 2009 by Andrew Martin,
a professor at Sydney University, assessed the adaptive and maladaptive cognitive and
behavioral dimensions of motivation and engagement (Martin, 2010). The MES-W has 11
subscales containing four items each for a total of 44 items, which produce a comprehensive
score for motivation and engagement. The psychometrics for the MES-W reports a confirmatory
factor analysis (CFA) yielded a positive fit to the data (x2 = 2,033.71, df = 847, CFI = .97,
RMSEA = .05) indicated an excellent match to the data (Martin, 2009). A statistical analysis
using Cronbach’s α reports a mean reliability of .78 for the 11 subscales (Martin, 2009).
The Teacher Keys Effectiveness System (TKES, 2013) was developed as a result of
Georgia’s Race to the Top (RT3) Initiative. The RT3 Initiative required that the state of Georgia
develop an evaluation system to ensure an improvement in teacher effectiveness that is
consistent throughout the state. The TKES provides a common definition of teacher
effectiveness through a thoroughly researched set of performance standards for teachers. The 10
Teacher Assessment on Performance Standards (TAPS) are guided by qualitative rubrics, which
were developed by experts in the field of education (TKES, 2013). The TAPS provide a balance

25
of structure and flexibility in teaching style. The prescriptive approach defines the expectations
of effective instructional practices and guides the instruction through common vocabulary and
exemplars (TKES, 2013). Teacher individuality, creativity, and learning styles are not inhibited
through the process; however, the overarching goal of the TKES process is to allow for the
continuous growth of teachers. The 10 TAPS provide samples of performance indicators,
research-based fact sheets, and rubrics to guide teachers along the path of becoming more
effective (TKES, 2013). The TAPS provides a three-tiered approach to define the teacher
expectations, including five domains: planning, instructional delivery, assessment of and for
learning, learning environment, and professionalism and communication (TKES, 2013).
Teachers are rated on the TAPS using a performance appraisal rubric, which is a behavioral
summary scale to guide the evaluators (principals and assistant principals) as to the level of
performance on the standards (TKES, 2013). Principals and assistant principals are trained
through a series of practice evaluations using inter-rater reliability scores to determine if the
school administrator is ready to evaluate teachers (TKES, 2013). The performance indicators
guide the school administrators using sample performance indicators, which are observable,
tangible behaviors for each performance standard. The TAPS rating scale (TKES, 2013)
provides four levels in which to rank behaviors. Teachers who score at Performance Level III
are considered proficient on the TAPS (TKES, 2013). The Level III descriptors contain the same
language as the TKES standards to guide the teacher behaviors. The descriptors at Level III
provide expected quantifying terms such as “consistently demonstrates” to guide the evaluator in
scoring the particular behaviors. Performance Level IV extends beyond simply meeting the
rubric criteria for the TAPS. The descriptors for Level IV outline expectations of meeting all the
requirements for Level III and to demonstrate behaviors that indicate the teacher seeks avenues

26
to be a teacher leader or serve as a role model for others. Descriptors in Level IV use adverbs
such as “continually” rather than the “consistently” utilized in Level III. Evaluators who are
rating teachers at Level IV are seeing evidence of the exemplary behaviors of teacher leaders.
Performance Level II does not meet the TKES standards and provides a rating for teachers who
need improvement. Evaluators see inconsistent demonstration of expected behaviors and
provide feedback for improvement. Performance Level I is an ineffective rating. Teachers who
receive a rating of Level I demonstrate an inadequate or ineffective level of performance (TKES,
2013). It is imperative that both the evaluators and the teachers receive adequate training on the
TAPS and the performance appraisal rubrics accompanying the 10 TKES standards (TKES,
2013).
Research Summary
The research study was conducted using a quantitative model employing a predictive
correlational research design to investigate the relationship between the motivation and
engagement levels of induction and veteran teachers while controlling for the level of experience
and the outcomes of the Teacher Keys Effectiveness System (TKES, 2013). IBM’s Statistical
Package for the Social Sciences (IBM SPSS©) program was used to analyze the data. A variety
of summary statistics were computed and assumptions of normality, homogeneity of variances,
linearity, and homogeneity of regression slope were tested using SPSS. Additionally, analyses of
covariance (ANCOVA) tests were conducted to determine the differences in the motivation and
engagement level as measured by the MES-W of induction (first four years) teachers and veteran
(five or more years) teachers while controlling for the overall score on the TKES. The
researcher was interested in identifying whether a significant relationship existed between the
variables that would also identify any predictive relationships that may exist. This design fit the

27
research proposal because there was no experimental treatment; rather relationships among the
existing conditions provided an explanation to the predictive nature of the variables within the
study (Warner, 2012). Other research studies with similar characteristics also employed the
ANCOVA tests to analyze data (Eyal & Roth, 2010; Green et al., 2006).
According to Howell (2011), the relationship between variables gives the degree to which
that relationship is measured through a correlation coefficient. One of the most common
correlation coefficients is the Pearson product-moment correlation coefficient (r). This allowed
for multiple regressions, which controlled for the interrelationships among the variables as well.
The use of Pearson’s Multiple r (effect size is the r value) helped define the direction or strength
of the relationships between the variables, whether it was strong or weak (Howell, 2011).
Assumptions and Limitations
There were several assumptions and limitations identified for this study.
Assumptions
It was assumed that a strong, positive relationship between teacher engagement and
motivation, years of experience, and the TAPS score existed. There was also an assumption that
the validity and reliability of the MES-W (2010) as utilized for teachers in Georgia remained
steadfast. An additional assumption was that teachers completing the survey presented honest
responses. In addition, a linear relationship between the predictor and criterion variables was
assumed in order to avoid Type II errors (Rovai, Baker, & Ponton, 2013).
Limitations
The use of a convenience sample provided a limitation for this study, due to selection
threat to external validity (Rovai, et al., 2013). The sample in the research study may not
translate to be representative of the entire population (Gall et al., 2007; Rovai et al., 2013). This
posed a threat to external validity since the sample was not randomized. Since this threat

28
existed, it was important that a description of the participants include demographic data and tests
for multivariate normality using a histogram (Rovai, et al., 2013; Tabachnick & Fidell, 2013).
This ensured that participants who were left out or were over-representative of the general
population could be described.
Another limitation was the use of a self-report survey to identify levels of motivation and
engagement. Teachers were provided specific directions for completing the surveys to abate the
limitation of inaccurate responses on the MES-W (2012). Using standardized measures for
administering the surveys also limited the threat to validity.
A final limitation was the threat to validity due to researcher bias. The ethical approach
was to recognize the danger of interpreting the results with a bias while making every attempt to
mitigate the influence (Gall, et al., 2007; Rovai, et al., 2013).

29
CHAPTER TWO: REVIEW OF THE LITERATURE
Introduction
Although motivation and engagement have been widely researched over the past few
years, there have been a variety of findings about the impact on student achievement and teacher
effectiveness (Ainley, 2004; Demir, 2011; Towndrow, Koh, & Hock Soon, 2008; Zimmerman,
1990). The research showed that motivation and engagement are important factors for
autonomy, self-efficacy, relational learning, and student achievement (Baron, 2006; Brown &
Adler, 2008; Collins & Halverson, 2009; Liberman & Pointer, 2010). A review of current
literature linked to a sound methodology provided the foundation to the proposed research study.
The review of literature focused on the relationship between motivation and engagement and
how this affects teacher effectiveness. It also provided insight into intrinsic and extrinsic
motivation, relation learning, and the teacher’s perceptions about motivation and engagement.
The literature review also presented the need to study the role of the teacher’s motivation and
engagement, which lead to improved teacher effectiveness.
Theoretical Framework
The theoretical framework for this study stemmed from the work of Ryan and Deci
(2000) on the self-determination theory (SDT). The SDT is the theory that inherent growth
tendencies paired with the psychological needs of humans provide the foundation for self-
motivation and personality development (Berti, et al., 2010; Ryan & Deci, 2000). Several
factors were essential to this research study as it related to the SDT. Ryan and Deci (2000)
identified three broad areas that related to the needs of motivation and engagement, which were
autonomy, competence, and psychological relatedness. Autonomy is the need to know and
understand not only what to do in a given situation but also how to do it. Competence involves

30
developing skills to manipulate and perhaps even control situations. Relatedness refers to the
social relationship with others (Ryan & Deci, 2000). The SDT was significant to this research
study because it defined the relationship between intrinsic and extrinsic motivation, which is a
process by which individuals internalize external factors to develop self-regulation (Towndrow,
Koh, & Hock Soon, 2008).
Relationship Between Motivation and Engagement
The relationship between motivation and engagement has been the subject of many
research studies (Ainley, 2004; Demir, 2011; Towndrow, et al., 2008; Zimmerman, 1990). For
example, Ainley (2004) explored the educational perspective of student motivation and
engagement, identifying dispositions and traits associated with high levels of motivation and
engagement. The research focused on two perspectives. The first was that motivation resulted
from particular characteristics that closely connected engagement and learning. The second
perspective was the critical nature of providing proper conditions for learning in order to impact
engagement. In fact, Ainley suggested that there are particular types of learning experiences that
promote depth in student engagement and motivation. Ainley defined motivation as “why we do
what we do” (p. 2); whereas engagement describes the action in terms of the energy and
cognitive connections.
Motivation and engagement are closely aligned to success in outcomes (Liem & Martin,
2012). As a result, understanding the relationship between motivation and engagement provided
educators with the knowledge to possibly impact student achievement. Researchers (Bernaus &
Gardner, 2008; Conley & Karabenick, 2006; Towndrow, et al., 2008) found that understanding
this relationship between motivation and engagement was not always clear. Conley and
Karabenick (2006) researched the construct validity of the measures of motivation and

31
engagement. The findings indicated that instruments used to measure motivation and
engagement often fail to consider factors such as interest, aptitude, and self-concept (Conley &
Karabenick, 2006).
Engagement is the extent to which someone cognitively persists in a task (Akey, 2006;
Appleton, Christenson, & Furlong, 2008; Garcia-Reid, Reid, & Peterson, 2005; Kearsley &
Shneiderman, 1999). Those who are motivated and engaged play an active role in the learning
process, and teaching is a reciprocal action on the part of the instructor (Demir, 2011; Mercer &
DeRosier, 2010; Wong, 2001). Individuals who display strong cognitive engagement plan and
manage their learning in a way that develops a high sense of self-efficacy and motivation.
Educators who display a high sense of engagement themselves may be able to better design
instructional activities to tap into improved motivation and engagement among students.
According to Demir (2011), teachers are an important influence on the motivation and
engagement levels of students in the classroom. Demir’s research parallels many others (Ainley,
2004; Akey, 2006; Balfanz, Herzog, & MacIver, 2007; Katz, Assor, & Kanat-Maymon, 2008) in
that it also focused on the reasons for disengagement as a way of clarifying the relationship
between motivation and engagement. For example, the self-determination level of the individual
teacher is correlated to the engagement level of the students (Demir, 2011).
Akey (2006) conducted a longitudinal study to determine if engagement and the
perception of academic competence had any significant effect on student achievement in reading
and mathematics. The findings corroborated with Demir’s (2011) research, in that engagement
in school and students’ perceptions about whether or not they are able to do well in that subject
directly impacted student achievement (Akey, 2006.) Students who perceived goals as attainable
were more likely to be cognitively engaged in school (Akey, 2006; Demir, 2011).

32
Identifying characteristics of motivation and engagement could provide the impetus for
improving motivation and engagement among both students and adults in a school building.
According to Demir (2011), teachers are an important influence in how motivated and engaged
students are in the classroom. Research (Akey, 2006; Demir, 2011; Kurtz & Knight, 2003;
Martin 2007; Zhang & Bartol, 2010) into intrinsic and extrinsic motivation among teachers
showed that the working conditions, teacher job satisfaction, and the teachers’ commitment to
the job affected teacher absenteeism. In addition, many teachers who chose to leave the
profession cited similar reasons for disengagement (Demir, 2011). Consequently, the motivation
level of teachers predicted engagement of both teachers and students (Demir, 2011). Demir’s
research (2011) focused primarily on the self-determination theory, which examined personality
in relation to motivation, and relied on choice and sense of freedom in decision making to
improve intrinsic motivation. For example, the self-determination level of the individual teacher
was correlated to the engagement level of the students. The study indicated that about 64% of
the variance in student engagement was the result of an increase in intrinsic motivation of the
teachers.
Technology is a tool to encourage and enhance engagement for teachers and students
(Parkin, Hepplestone, Holden, Irwin, & Thorpe, 2012; Strom, Strom, & Wing, 2009). In fact,
Strom, Strom, and Wing (2009) studied self-directed learning through the use of technology,
which influences student motivation and engagement and the effect of teacher planning and
preparation on those factors. Teachers also perceived that technology usage increased student
engagement and had a direct relationship with student achievement (Baron, 2006; Brown &
Adler, 2008; Collins & Halverson, 2009; Liberman & Pointer, 2010). Technology was also seen
as a tool to individualize instruction to support struggling learners (Parkin, et al., 2012).

33
Students who perceived that their teachers cared about them and took the time to build a
positive relationship with them were more cognitively engaged in their own learning (Akey,
2006; Demir, 2011; Garcia-Reid et al., 2005; Mercer & DeRosier, 2010). Research also
indicated that classrooms with established clear expectations exhibited higher engagement levels
(Akey, 2006; Mercer & DeRosier, 2010). A research study by Hufton, Elliott, and Illushin
(2002) determined students who displayed characteristics of engagement and motivation, such as
self-satisfaction and positive attitudes about school, received higher achievement scores. This
indicated that intrinsic behaviors such as positive attitudes are correlated to engagement and
motivation. Johnson (2008) indicated that teachers who employed non-traditional strategies to
influence student achievement, such as group decision-making and independent work, provided
conditions to improve student motivation and engagement. Research indicated that choice
provided self-efficacy and resulted in higher levels of engagement (Deci, Koestner & Ryan,
2001; Eyal & Roth, 2010; Green et al., 2006).
Teachers may influence motivation and engagement through the development of self-
efficacy skills among stakeholders (Martin, 2005). In the same vein, teachers traditionally used a
reward and punishment, often referred in educational and psychological circles as the “carrot and
the stick” (Pink, 2009) system within the classroom to get students engaged. Research studies,
such as Demir (2011); Deci et al. (2001); and Redding and Walberg (2012) have indicated that
this does not work. In fact, the meta-analyses conducted by Deci et al. (2001) found that external
rewards had little or no effect on intrinsic motivation among students ranging in age from
elementary school through college. They found that certain tasks that students deemed as
uninteresting or boring resulted in the undermining of the intrinsic level of students (Deci et al.,

34
2001). Rewards became less important to students who developed an interest in something, and
the intrinsic level, as well as their self-efficacy, increased (Redding & Walberg, 2012).
Martin (2006) conducted research on teacher motivation and discovered that content
competency rather than pedagogy influenced teacher motivation and engagement. This research
also indicated that the teacher’s perception of motivation and engagement is related to his or her
own enjoyment and satisfaction in teaching. Tying this particular concept to student engagement
and motivation, Green, et al. (2006) concluded that self-concept is a key factor in motivated and
engaged learners.
A study conducted by Gewertz (2006) reported that lack of motivation is one of the top
reasons high school students dropped out of school. In fact, the research findings indicated there
were several factors affecting motivation, including absence of academic challenges, academic
failures, and problems outside of school that seemed to overwhelm students (Gewertz, 2006).
Walker and Greene’s (2009) research substantiated this in a study of the relationship between the
motivational beliefs of high school students and their cognitive engagement. The report tracked
achievement gains in relation to engagement through implementation of specific learning
strategies designed to improve motivation and engagement (Walker & Greene, 2009).
Disengagement in school was found to be the result of lack of motivation (Balfanz et al., 2007;
Demir, 2011; Gewertz, 2006; Hufton, Elliot, & Illushin, 2002).
The relationship between motivation and engagement is complex (Bryson & Hand, 2007;
Zepke & Leach, 2010). The cognitive investment in learning often elicited an emotional
commitment. Active participation in the cognitive realm generated conditions in which learning
promoted engagement. Motivation also incorporated the will, drive, and task persistence an
individual possessed (Pintrich & Schunk, 2002; Rigby, Deci, Patrick, & Ryan, 1992).

35
Additionally, the various aspects of engagement, such as academic, behavioral, affective,
and cognitive provided complexity since each had its own attributes (Ainley, 2004; Demir, 2011;
Jesus & Lens, 2005; Sargent & Hannum, 2005). For example, academic engagement, the more
visible type of engagement, involved the teacher through the quality of instructional planning
and the appropriateness of the delivery of the instruction (Zepke & Hand, 2010). Behavioral
engagement, however, also pertained to parental involvement, since it was exhibited through
attendance, extra-curricular activities, and discipline (Medley, Little, & Akin-Little, 2008).
Affective engagement involves the emotional side of connecting not only with others but
also with school in general. Specifically, a number of behaviors were associated with the
affective engagement, such as risk-taking, social competency, perception, and task persistence
(Burton, Lydon, D’Alessandro, & Koestner, 2006; Marinak & Gambrell, 2008). Cognitive
engagement described the types of behaviors most often associated with motivation. These
included perceived ability, relevance of the work, self-regulation, and collaboration (Ryan &
Deci, 2000; Towndrow, et al., 2008). Gentry and Steenbergen-Hu, Choi (2011) researched the
student perceived constructs of choice, relevance, complexity, and interest and determined that
highly motivated and engaged teachers incorporated these constructs in classroom instruction.
The complex nature of the relationship between engagement and motivation is further
exacerbated by the fact that the characteristics of engagement and motivation are not consistently
defined (Hart, Stewart, & Jimerson, 2011). Their research focused primarily on behavioral
engagement since this type of engagement may be observed and monitored. The observable
actions of behavioral engagement include not only participation and time on task but also
indicate that other items such as attendance, discipline, and participation in extracurricular
activities are important in interpreting behavioral engagement (Dunn & Rakes, 2011; Gentry,

36
Steenbergen-Hu, & Choi, 2011; Hart, Stewart, & Jimerson, 2011; Klassen, Perry, & Frenzel,
2011; Spilt, Kooman, & Thijs, 2011).
The complex nature of the relationship between motivation and engagement is
asynchronous to school improvement endeavors. In fact, a great deal of time and effort is spent
attempting to improve the motivation to learn. However, research indicated that true motivation
was related to conceptual understanding rather than academic performance (Ryan & Deci, 2000,
2009). Teachers designed rigorous work for students, which provided the impetus to engagement
if the learning was collaborative, interactive, and challenging (Zepke & Leach, 2010). In fact,
despite initial failures, engaged individuals possessed task persistence, which was linked to
intrinsic motivation (Bryson & Hand, 2007; Zepke & Leach, 2010).
Intrinsic Versus Extrinsic Motivation
Daniel Pink (2009), author of the best-selling book Drive, described a different
perspective in motivation and engagement. Pink stated that in order to improve performance and
personal satisfaction, three factors were critical: autonomy, mastery, and purpose, which are
corroborated in the self-determination theory (Ryan & Deci, 2000; Towndrow, et al., 2008). In
fact, Pink stated that classrooms and school buildings across the nation were more often than not
reminiscent of the educational system in place a century ago. Teachers traditionally used a
reward and punishment system within the classroom, the “carrot and stick” process to get
students engaged, which was actually extrinsic motivation. In the same vein, school
administration and superintendents, due to tenure laws and hiring practices, often resorted to a
reward and punishment-like system for teachers. Pink stated, “For routine tasks, which aren’t
very interesting and don’t demand much creative thinking, rewards can provide a small
motivational booster shot without the harmful side effects” (p. 62).

37
Zhang and Bartol (2010) studied a variety of theories linking empowering leadership and
employee creativity. The synthesis of theoretical models of leadership, empowerment, and
creativity on intrinsic motivation provided related research to support replication within a school
setting. In fact, intrinsic motivation may be enhanced by opportunities for creative leadership,
even those that are informal rather than an assigned leadership role (Green, Martin, & Marsh,
2007; Liam & Martin, 2011; Vallerand & Ratelle, 2002).
The idea of reward and punishment as a way to motivate and engage learners has been
well established historically in schools. Several research studies (Corrigan & Chapman, 2008;
Demir, 2011; Jang, 2008; Katz, Assor, & Kanat-Maymon, 2008; Marinak & Gambrell, 2008)
provided an insight into intrinsic motivation, which is viewed by Pink (2009) as the only true
motivation. Intrinsic motivation included specific motivation characteristics such as autonomy,
responsibility, professional growth and achievement (Demir, 2011). “The phrase ‘personally
meaningful’ nicely captures the experience that lies at the intersection of perceived autonomy
and perceived importance” (Jang, 2008, p. 810). In order to improve engagement, one must
concentrate on intrinsic motivation. Reliance on an extrinsic system of rewards did not increase
engagement over time, although it did show short-term improvements. Intrinsic motivation
provided a learner outcome that transcended the learned situation (Adelman & Taylor, 2011).
The importance of intrinsic motivation as it related to engagement and student
achievement was outlined in the research of Corrigan and Chapman (2008) and Marinak and
Gambrell (2008) since task persistence is a proximal reward. Token rewards did not sustain
cognitive engagement (Marinak & Gambrell, 2008). Choice in learning activities seemed to be
a determining factor for intrinsic motivation in another research study conducted by Burton,
Lydon, D’Alessandro, and Koestner (2006). In fact, Burton, et al. discovered that intrinsic

38
motivation had a differential and identified effect on not only achievement but sense of well-
being as well.
Despite the value of intrinsic motivation, Demir (2011) and Corrigan and Chapman
(2008) found that extrinsic motivation had a significant effect on student engagement. Demir
(2011) also found a significant relationship between intrinsic and extrinsic motivation at (β =
0.22, p < 0.001). Demir’s research suggested that both intrinsic motivation and extrinsic
motivation are additive and interactive in a school setting, both working together to improve
engagement.
Teacher Effectiveness and Motivation
Teacher quality trumps all other factors, such as socioeconomic status, ethnicity, and
race, for student achievement and success (Hattie, 2009). The 2001 reauthorization of the
Elementary and Secondary Education Act (ESEA), approved by Congress, outlined a new
description of teacher effectiveness. The terminology borne of this new law required school
districts and states to define teacher quality, while it also established new regulations to
determine teacher effectiveness. This new accountability system changed the nature of
education, in that districts were required to place the most effective teachers with the students
who were more likely to fail (Eppley, 2009; Shannon, 2007). Research on teacher quality
spawned by the ESEA reauthorization revealed issues with teacher effectiveness due to teacher
preparation programs (Eppley, 2009; Shannon, 2007; Wilson, 2009). Teacher quality is not
single faceted, but is a much more complicated issue, not based solely on content knowledge or
ability (Wilson, 2009).
Chait (2009) defined teacher effectiveness as the teacher’s ability to promote learning at
high levels among students in his or her classroom. This definition stretched the purview of

39
teacher quality to include not only content knowledge but also pedagogical skills and some
affective domain skills, as well. There is no single indication of teacher effectiveness, as it is
complex and requires a broader view of teaching skills.
It is also important to note that teacher effectiveness is closely connected to teacher
motivation. Wilson (2009) found that teacher quality and motivation mattered a great deal,
especially for low-income students. Low-income students are considered “disadvantaged;”
however, when they were placed with a highly motivated and effective teacher for at least three
years in a row, the disadvantaged students in Wilson’s study scored at or above similar middle
class students. The converse of this could mean, however, that less effective and motivated
teachers who are placed with disadvantaged students for several years in a row condemned them
to a lifetime of poor achievement (Darling-Hammond, 1997; Eppley, 2009; Fullan, 2010;
O’Keefe, 2000; Ravitch, 2003; Shannon, 2007; Wilson, 2009).
The premise of quantifying and qualifying teacher effectiveness through public reporting
of achievement scores as outlined in the ESEA (2001) provided the impetus for defining teacher
effectiveness in a new way (Eppley, 2009; Fullan, 2010; O’Keefe, 2000; Ravitch, 2003;
Shannon, 2007; Wilson, 2009). This comparison of schools, districts, and states was thought to
stimulate competition, thereby improving teacher effectiveness (Eppley, 2009; Fullan, 2010;
Ravitch, 2003; Shannon, 2007; Wilson, 2009). However, as Eppley’s (2009) research revealed,
many teacher candidates in college preparatory programs were not the most able. He went even
further to assert that the candidates who were becoming public education teachers were mediocre
at best. Further research assertions indicated that the link between teacher effectiveness and
motivation stemmed from ill preparation and the intellect of the teacher candidates in schools or
colleges of education (Eppley, 2009; O’Keefe, 2000; Ravitch, 2003; Shannon, 2007; Wilson,
40
2009). O’Keefe (2000) investigated the teacher workforce and discovered that about one-fourth
of the teachers were ill prepared and lacked course the content knowledge and pedagogy to be
effective in the classroom. The deficits spanned not only public education institutions, but also
the private school sector (O’Keefe, 2000; Ravitch, 2003; Wilson, 2009). Ravitch (2003)
reported that the supply of well-educated, effective, and motivated teachers is not enough to meet
the demands of today’s student needs. Although hiring highly effective and motivated teachers
is a key aspect of improving the quality of education in both public and private schools, there is
dissention on how to accomplish it (Darling-Hammond, 1997; Eppley, 2009; Fullan, 2010;
O’Keefe, 2000; Ravitch, 2003; Shannon, 2007; Wilson, 2009).
There are also disputes among educational experts on what constitutes an effective
teacher (Eppley, 2009; Hattie, 2010; Shannon, 2007; Whitcomb & Rose, 2008; Wilson, 2009).
The achievement gaps reported among the racial and economic lines within student populations
confirm that teacher effectiveness is still an issue (Whitcomb & Rose, 2008). The Federal
definition of teacher quality (ESEA, 2001) stated that teachers must hold at least a bachelor’s
degree in a particular content area, demonstrate content mastery through a standardized
assessment, and receive state licensure; however, his definition did not identify the
characteristics of an effective teacher.
In 2007, the ESEA received new language to clarify the definition of “teacher
effectiveness.” The new language outlined a student growth model as the way to quantitatively
measure the effectiveness of teachers, and utilized a value-added methodology (Chait & Miller,
2010; Whitcomb & Rose, 2009). However, the particular measurement instruments to define
the value-added analyses on the effectiveness of teachers was not identified nor mandated.
The Carnegie Foundation stated that an effective teacher is visible, engaged, attentive,

41
passionate, and provides students with opportunities to excel (Bryk, 2009). Bryk further cited
that effective teachers engaged in problem solving have a positive effect on the values and
commitments of students. The evidence of teacher quality identified in recent research
provided discrepancies in indicators of teacher effectiveness (Bryk, 2009; Chait, 2009; Chait &
Miller, 2010; Eppley, 2009; Fullan, 2010; Whitcomb & Rose, 2008; Wilson, 2009). For
example, certification, or teacher state licensure do not guarantee the effectiveness or
motivation level of a teacher (Whitcomb & Rose, 2008). Additionally, teacher preparation
programs vary in both complexity of required courses and levels of achievement attained. This
does not indicate quality of instructional practices for the individual educator. These variables
in preparation affect teacher quality (Bryk, 2009; Chait, 2009; Chait & Miller, 2010; Eppley,
2009; Fullan, 2010; Whitcomb & Rose, 2008; Wilson, 2009). Research into quality instruction
indicates several conditions that must be present for teachers to be motivated and effective.
Quality effective teaching occurs when teachers feel a collective sense of responsibility to
improve instruction. They examine student work collaboratively. They create a collegial
environment that demonstrates a sense of transparency and trust among peers (Bryk, 2009;
Chait, 2009; Chait & Miller, 2010; Eppley, 2009; Fullan, 2010; Miles & Frank, 2008; Shannon,
2009; Whitcomb & Rose, 2008; Wilson, 2009).
In recent years, the Federal Department of Education provided guidance on teacher
effectiveness through such legislation as the American Recovery and Reinvestment Act
(ARRA) of 2009 and Race to the Top (RT3) grants. The ARRA (2009) provided a substantial
amount of funding to focus on teacher effectiveness rather than on teacher certification alone.
Chait (2009) stated that teacher effectiveness matters, especially for low-income and minority
districts. This research identified the need to not only target certification issues in light of

42
student achievement, but to view the effectiveness of classroom teachers in the growth of
students over time (Bryk, 2009; Chait, 2009; Chait & Miller, 2010; Eppley, 2009; Fullan, 2010;
Miles & Frank, 2008; Shannon, 2009; Whitcomb & Rose, 2008; Wilson, 2009). The ARRA
and RT3 grants provided the funding for college and career readiness standards, high quality
assessments, data reporting systems, and teacher effectiveness measures through a value-added
evaluation system based on growth measures (Chait, 2009; Chait & Miller, 2010).
One of the most visible indicators of teacher effectiveness is the ability to manage the
classroom efficiently (Chait, 2009; Martin, 2009; Stronge, 2007). Teacher expectations for
behavior set the foundations for strong classroom management. Effective teachers
communicate the expectations well and set goals for students (Patrick, Ryan, & Kaplan, 2007;
Ryan & Patrick, 2001). This provides the impetus for academic engagement and motivation
and influences the classroom environment for the teacher and the students (Patrick, Ryan, &
Kaplan, 2007; Ryan & Patrick, 2001). In fact, Carr (2009) proposed that the teacher’s personal
qualities, such as perseverance and motivation provide the foundation for successful
classrooms.
Additionally, teacher motivation and engagement stem from enthusiasm about the
content area (Kunter, Tsai, Klusmann, Brunner, Kraus, & Baumert, 2008; Patrick, Ryan, &
Kaplan, 2007). Teachers display higher levels of engagement when sound instructional
behavior, such as high levels of cognitive demand and personal responsibility are present.
Although not necessarily a prerequisite for teacher motivation, enthusiasm about the content
area and teaching is a mind-frame that impacts teacher effectiveness (Kunter, et al., 2008;
Patrick, Ryan, & Kaplan, 2007). Teachers who are enthusiastic about learning create a safe
environment conducive to student engagement. This characteristic impacts the classroom in a

43
variety of ways, such as student engagement, higher levels of vitality, and greater on-task
behaviors (Hoigaard, Giske, & Sundsli, 2012; Kunter, et al., 2008; Patrick, Ryan, & Kaplan,
2007).
Teacher’s Role
Significant research also supports the effects of teacher motivation on student motivation
and engagement (Akey, 2006; Hufton, et al., 2002; Kurz & Knight, 2003; Vallerand, Fortier, &
Guay, 1997). For example, Hufton, et al. (2002) studied three school districts across three
countries to determine the key factors in motivation and engagement that positively correlated to
improved student achievement. The researchers found that students who displayed
characteristics of engagement and motivation, such as self-satisfaction, had positive attitudes
about school and displayed higher achievement scores. Johnson’s (2008) study also supported
the relationship between the teacher’s motivation and student motivational needs. Johnson noted
that teachers who employed non-traditional strategies to influence student achievement, such as
group decision-making and independent work provided conditions to improve student motivation
and engagement (Johnson, 2008). Additionally, Walker and Greene (2009) studied student
achievement gains in relation to engagement through implementation of specific learning
strategies designed to improve motivation and engagement. Their study employed the use of
several instruments designed to correlate motivation and achievement. Through triangulation of
the survey results, there was a correlation between student achievement and motivation at a score
well above an average of four out of six on the rating scale (p. 467). These studies suggest that
motivation and engagement are closely tied to student achievement. Critical thinking and its
effect on motivation and achievement scores was also a key factor in a study conducted by Green

44
et al. (2006), concerning self-concept and the causal relationship among self-concept,
motivation, and student achievement.
The relationship between students and teachers is reflected in the level of engagement.
For example, students who perceive a positive relationship with their teacher are more
cognitively engaged in their own learning (Akey, 2006; Demir, 2011; Garcia-Reid et al., 2005;
Mercer & DeRosier, 2010). Mercer and DeRosier (2010) noted that these students also
demonstrated more cognitive engagement in independent activities, where the teacher’s presence
was not as prevalent. These studies indicate that the teacher’s role in student engagement is
very important to improved motivation to learn (Akey, 2006; Demir, 2011; Garcia-Reid et al.,
2005; Mercer & DeRosier, 2010). In fact, a recent study indicated that teachers who displayed
enthusiasm through class interactions, possessed a deep knowledge of the standards, and
provided timely, relevant feedback set up the impetus for motivated and engaged students
(Gentry, Steenbergen-Hu, & Choi, 2011). This study further indicated that students could
identify motivated and engaged teachers as those who inspired them, provided choice, and
displayed a positive demeanor (Gentry et al., 2011).
Teachers are in control of the activities designed for students in the classroom.
According to Pugh, Linnenbrink-Garcia, Koskey, Stewart, and Manzey (2009), the types of tasks
students are asked to do could motivate and provide deep levels of engagement. One important
aspect of this transformational learning was to examine the science background knowledge and
interests of the students. Their experimental design was found to have a statistically significant
effect on improving students’ engagement and motivation in science (Pugh et al., 2009).
Hu, Kuh, and Li (2008) researched the effect of inquiry-oriented learning on engagement
of college students. The study results indicated that an inquiry-oriented learning environment

45
did have a significant positive impact on the student’s engagement levels; however, it also
showed that some outcomes of engagement are positive or negative depending on the student.
Their study also further supported the complex nature of the relationship between motivation and
engagement (Gentry, Steenbergen-Hu, & Choi, 2011; Hu, Kuh, & Li, 2008).
The motivation and engagement of students is closely tied to students’ own perceptions
of teachers. Teachers who build positive relationships with students have classrooms in which
the students are more cognitively engaged and self-reliant (Akey, 2006; Demir, 2011; Garcia-
Reid et al., 2005; Mercer & DeRosier, 2010). Research also indicates that clear expectations for
student behaviors produce students who exhibit higher engagement levels (Akey, 2006; Mercer
& DeRosier, 2010). This indicates that intrinsic behaviors, positive attitudes, satisfaction in task
completion, and choice are correlated to engagement and motivation.
Teachers who use novel and unique instructional tools to influence student achievement
provide conditions that improve student motivation and engagement (Johnson, 2008). A variety
of research (Deci et al., 2001; Eyal & Roth, 2010; Green et al., 2006) also indicates that teachers
who provide choice in tasks and learning also have students who exhibit higher achievement
rates.
Learning that is collaborative, interactive, and challenging fosters higher levels of
engagement (Zepke & Leach, 2010). In order for the learning environment to promote
engagement, teachers need to design learning experiences that are challenging. Bryson and
Hand (2007) concluded that students are more likely to be engaged if teachers who establish
inviting learning environments and demand high standards support them. In addition, teachers
who make themselves approachable and available to discuss student learning prompt a deeper
level of engagement, which motivates the learner (Bryson & Hand, 2007; Mearns, 2007; Zepke

46
& Leach, 2010). The teacher who appears approachable compels students to work harder
(Mearns, 2007). Students are also more willing to express opinions if the teacher is perceived to
be well prepared and sensitive to student needs (Bryson & Hand, 2007; Mearns, 2007; Zepke &
Leach, 2010).
Kuh (2007) found that teachers who provided deep learning experiences promoted higher
levels of student engagement. In fact, Zepke and Hand (2010) corroborated this research in that
the teachers in their study were essential to creating the appropriate learning environment to
foster engagement. Hockings, Cooke, Yamashita, McGinty, and Bowl (2008) also supported this
view. Their study showed that students who were disengaged appeared to take a surface
approach to learning, such as copying notes, focusing on just a few fragmented facts, listening
for right answers and simply accepting those answers. These types of learning experiences are
typical in “traditional” classrooms (Kuh, 2007).
Teacher’s Perceptions
The role of the teacher’s own perceptions about motivation and engagement provides
important insight into the connection between motivation and engagement and student
achievement (Gentry et al., 2011; Mansfield & Volet, 2010; Skaalvik & Skaalvik, 2009).
Teachers’ perceived abilities, such as instructional strategies, classroom management, and
content (or subject matter) competency, have an impact on motivation and engagement (Ahmed,
2011; Cardelle-Elawar, & Sanz de Acedo Lizarragam 2010; Kuter, Frenzel, Nagy, Baumert, &
Pekrun, 2011; Yilmaz, 2011). Further investigation into teacher perceptions has also revealed
that enthusiasm for the subject matter or particular content affects teacher motivation and
engagement (Dunn & Rakes, 2011; Hardré & Sullivan, 2009; Kuter et al., 2011; Martin, 2006).
Teachers who have greater confidence in both the subject matter knowledge and a deep

47
understanding of how students learn are more engaged and motivated (Dunn & Rakes, 2011;
Mansfield & Volet, 2010; Skaalvik & Skaalvik, 2009).
The role of a teacher has changed in both complexity and intensity in the past 20 years.
Brante (2008) suggested in his research study that the multi-tasking and synchronous work of
teachers has negatively affected the engagement level of teachers. Brante concluded that the
conflicts between the way schools were designed to operate and the constraints upon teachers to
multitask at high levels lead to teacher disengagement. Reform efforts have defined the type of
work teachers are required to do (Brante, 2008; Dunn & Rakes, 2011; Mansfield & Volet, 2010).
Teacher’s Self-efficacy
Another strong theme in the literature review on motivation and engagement indicates the
importance of self-efficacy (Ahmad, 2011; Liem & Martin, 2011; Green et al., 2007; Kurz, &
Knight, 2003; Martin, 2006; Towndrow, et al., 2006; Zimmerman, 1990). Self-efficacy as it
relates to motivation comprises two dimensions: teaching ability and personal attributes (Ahmed,
2011; Liem & Martin, 2011; Martin, 2011). The intersection of task ability and one’s own
beliefs about ability affects motivation (Ahmed, 2011). In fact, teacher self-efficacy and
confidence in teaching provides increased motivation (Ahmad, 2011; Towndrow et al., 2006;
Yilmaz, 2011). Martin (2006) conducted a study of teachers’ perceptions of motivation and
engagement as related to their own enjoyment and satisfaction in teaching. The results of this
study indicated that there was a significant difference in self-reporting of motivation and
engagement among male versus female teachers. Conversely, elementary school teachers (both
male and female) presented a higher motivation and engagement rating than secondary teachers.
The study also indicated a strong correlation in the teacher’s confidence in the subject matter, the
teacher’s motivation, and resultant student motivation and self-efficacy.

48
Self-belief in learning enhances engagement (Zepke & Leach, 2010). In fact, even a
moderate level of autonomy promotes engagement and competency in achievement (Ahmed,
2011; Cardelle-Elawar & Sanz de Acedo Lizarragam 2010; Kuter et al., 2011; Yilmaz, 2011).
Choice or control over certain areas of decision-making provides autonomy, which is linked to
motivation (Eccles & Wigfield, 2002; Kuter, et al., 2011). Additionally, ability, task persistence,
and effort are all significantly tied to autonomy as it pertains to motivation (Eccles & Wigfield,
2002). Of these, ability is generally not changeable. However, effort and task persistence are
changeable and controllable. Lack of effort or task persistence is attributed as the reason for
disengagement in individuals who are otherwise able to complete a task (Eccles & Wigfield,
2002). The type of feedback given, such as ambiguous statements of “good work,” may
negatively affect a student’s sense of autonomy and intrinsic motivation (Ainley, 2004; Deci,
Koestner, & Ryan, 2001; Hattie, 2009; Hufton et al., 2002). Teachers who provide levels of
choice and autonomy in learning are more likely to see improvement in the motivation and self-
efficacy levels of students than teachers who provide limited choice in learning tasks (Pintrich,
2000).
Self-concept, or the perception of one’s own abilities, is a key factor in motivated and
engaged learners (Eyal & Roth, 2010; Green et al., 2006; Kurz, & Knight, 2003; Martin, 2011;
Martin, 2006). “In support of deeming self-concept as an important educational factor, research
has shown that higher levels of self-concept are linked to various education outcomes such as
academic effort, coursework selections, educational aspirations, and academic achievement”
(Green et al., 2006, p. 535). This longitudinal study provided empirical data to support the
reciprocal effect model and indicated that improved self-concept resulted in improved student
achievement. However, if the reciprocal was not true, then the improvement in self-concept was

49
short-lived. This suggests a strong need for teachers and educational leaders to support strategies
to strengthen self-concept, or self-efficacy, as a co-requisite to improved student achievement,
thus improved motivation and engagement of all stakeholders (Eyal & Roth, 2010; Green et al.,
2006; Kurz & Knight, 2003; Liem & Martin, 2011; Martin, 2006).
Teachers who are satisfied with their job have a tendency to perform at higher levels,
show a displayed task commitment, and be actively engaged in the learning process (Demir,
2011). However, teachers who are dissatisfied with their job are often disengaged, which may
result in higher absences and burnout. Teacher motivation and engagement is fundamental to
ensuring job satisfaction (Demir, 2011; Jesus & Lens, 2005; Sargent & Hannum, 2005).
Teachers who are motivated and engaged display a deeper task commitment, pedagogical
knowledge, and critical thinking skills regardless of the number of years in the classroom
(Gentry et al., 2011).
Teacher self-efficacy is related to motivation and engagement in several ways. First,
teachers who have relationships with parents and students develop a sense of trust that promotes
both individual and collective efficacy (Kunter, et al., 2008; Patrick, Ryan, & Kaplan, 2007).
Additionally, teachers who set goals for themselves display higher self-efficacy (Demir, 2011;
Gentry et al., 2011; Patrick, Ryan, & Kaplan, 2007).
In a study of motivation and engagement and its effects in enrichment programs, Martin
(2005) discovered that certain out of school experiences affected motivation and engagement
during school. The enrichment program was designed to “enhance their [students’] self-esteem,
confidence, sense of self, self-awareness, approach to life, life satisfaction, and general
motivation” (Martin, 2005, p. 179). The study focused on several motivation theories, such as
the needs achievement theory, self-worth motivation theory, and self-efficacy theory. Martin

50
utilized a motivation scale to gather data concerning student motivation, separating out factors
that enhanced or detracted from motivation among the students. As Martin stated, “Motivation
plays such a large part in students’ academic engagement and achievement, and it is important to
identify factors that contribute to their motivation” (p. 181). This study yielded support for
timely interventions to influence self-efficacy and impacts engagement over time. It also
translated to school leaders and teachers the need to influence motivation and engagement
through the development of self-efficacy skills among stakeholders (Liem & Martin, 2011;
Martin, 2005).
Teachers who display high levels of self-efficacy and motivation are considered to be
self-directed learners. They seek opportunities to improve their own pedagogy through higher
education and high quality professional learning (Demir, 2011; Liem & Martin, 2011; Martin &
Hau, 2010; Song, Kim, Chai, & Bae, 2014). Mediating factors such as teacher professional
growth and creativity also have been shown to be a positive influence on teacher engagement
(Demir, 2011; Martin, 2005; Song, et al., 2014).
Relational Learning
The importance of relational learning, such as critical thinking and problem solving,
provides an insight into motivation and engagement (Bernhaus & Gardner, 2008; Kabilan &
Kamaruddin, 2010; Liem & Martin, 2011; Martin & Hau, 2010). Kabilan and Kamaruddin
(2010) conducted a quantitative research study on a specific learning strategy to engage learners’
comprehension, interest, and motivation to learn literature. The purpose of the study was to
examine the relationship between introducing unmotivated students to reader’s theatre and
improving engagement, motivation, and comprehension in literature. The authors’ hypothesis
was, “In order to heighten learners’ interest and motivation to learn literature, teachers should

51
engage learners in an experiential learning environment so that learners are able to experience
learning literature as an element of enjoyment and intellectual stimulation” (p. 133). Although
the sample size for this study was small, the research lent itself to replication with a larger
population. The study showed a statistically significant relationship, with a p value of .001for
the Wilcoxon Matched-pairs Signed-Rank Test, and since this was less than the specified level of
.05, there was a need to reject the null hypothesis.
A related study by Bernaus and Gardner (2008) corroborated the findings of Kabilan and
Kamaurddin (2010). Various innovative strategies to promote improvement in English
achievement for second language learners were enhanced when the teacher employed motivation
strategies that influenced student perceptions. Results of Bernaus and Gardner’s study clearly
indicated that motivation and achievement are improved when teachers employ innovative
strategies rather than traditional instructional methods.
Discovering specific relational learning strategies that impact motivation and engagement
among students is valuable for educational leaders. A recent research study (Archambault,
Pagan, & Fitzpatrick, 2012) provided insight into specific behaviors concerning relational
learning. Results of the study suggested that young children who developed a stronger
relationship with teachers were more likely to share feelings, talk openly, and trust the teacher
than those who did not. Findings showed that these students were more behaviorally engaged
than their peers. In addition, students who followed directions and independently completed
assignments on time developed positive relationships with teachers, regardless of the teachers’
classroom management or personality style (Split, Koomen, & Thijs, 2011).
Additionally, Corrigan and Chapman (2008) studied the relationship between students’
trust in teachers and the motivation to learn. The scales provided a retrospective view of the trust

52
of high school students and teachers to show that the more motivated and empowered they were,
the more the students responded positively. The researchers reported that trust is the result of an
interpersonal relationship, so an underlying assumption was that the teachers were also
motivated to build that relationship as well.
Strom, Strom, and Wing (2009) also studied self-directed learning through the use of
technology, which influenced motivation and engagement, and the effect of teacher planning and
preparation on those factors. The study results suggested that teachers and principals must
examine their roles in order to influence motivation and engagement among students. This study
is corroborated through the work of Trilling (2010) in the research study concerning 21st century
skills used to improve motivation and engagement among all stakeholders. Researchers also
explored the process of critical thinking, questioning, and problem solving skills and how this
inquiry based learning positively influenced motivation and engagement (Lieberman & Pointer-
Mace, 2010; Trilling, 2010). Projects that incorporated technology skills and critical thinking
skills into real world problems “can be the key to unlocking increased student motivation and
engagement, deeper understanding, and effective use of knowledge, and the mastery of 21st
century skills” (Trilling, 2010, p. 11).
Hufton, Elliott, and Illushin (2002) conducted a qualitative study comparing student
attitudes about school to motivation and engagement in three countries: the United States,
England, and Russia. The three areas were targeted for this research study because of the
specific and rigorous educational standards being implemented. In addition, all three areas
suffered from economic downturn, and each country had a very high population of economically
disadvantaged students. New standards and legislated education reform initiatives impacted both
the content being taught and the methodology of the instructional process. This provided the

53
impetus for “exploring the complex relationship between schooling, educational reform,
differing value systems, and the impact of significant socio-economic hardship” (p. 266).
The researchers (Hufton et al., 2002) identified several indicators that affected motivation
and engagement through a thorough interview process. Several attributes were examined,
including attitudes about learning, academic performance, value of education, patterns in work
habits, and future plans. Motivation and engagement as they pertained to these attributes
influenced student achievement. However, the study indicated that academic achievement could
be influenced by “convincing children, their families, and communities that working harder will
produce gains that have both meaning and value” (p. 284).
Positive interactions in school are closely tied to student achievement and motivation
(Akey, 2006; Hsu, 2010; Marinak & Gambrell, 2008). Akey (2006) examined the role that
supportive relationships with teachers played in increased motivation and engagement. The
findings indicated that the teacher’s role, which included behavior management and clear,
consistent expectations supported increased students’ engagement in school tasks. Marinak and
Gambrell (2008) also found that rewards without relationship had a mediating effect on
engagement and motivation, as measured by task persistence. Hsu (2010) found that not only
did teachers’ actual behavior affect student learning attitudes and motivation but also the
perceived actions of teachers; whether they were reality or not did not seem to matter. Teachers
who display a caring and positive attitude while challenging students through rigorous work are
often seen as motivating (Bernhaus & Gardner, 2008; Kabilan & Kamaruddin, 2010; Liem &
Martin, 2011; Martin & Hau, 2010). The social environments of learners, both at school and at
home, influence student self-efficacy (Katz, Assor, & Kanat-Maymon, 2008; Martin, 2009;
Pintrich & Schunk, 2002). Parents and teachers who provide a variety of learning experiences

54
and promote open communication are more often viewed as supportive in the development of
self-efficacy (Ainley, 2004; Deci, Koestner, & Ryan, 2001; Hattie, 2009; Hufton et al., 2002).
Teacher and Peer Relationships
A body of research explored motivation and engagement in teachers as they pertained to
their relationships with students and peers (Dunn & Rakes, 2011; Gentry et al., 2011; Klassen,
Perry & Frenzel, 2011; Spilt, Kooman & Thijs, 2011). The social aspect of education provided
insight into the relationships that promote motivation and engagement in teachers. For example,
teachers who develop strong relationships through a professional learning community of their
peers are more engaged in their own learning. The relationships provided the impetus for
experimentation, professional learning, and shared resources (Dufour, Dufour, Eaker, & Many,
2006). In a recent research study out of Montreal, Canada, data indicated that younger students
who displayed high levels of classroom engagement also demonstrated a strong relationship with
teachers (Archambault, Pagan, & Fitzpatrick, 2012). Behaviors associated with high levels of
classroom engagement included class participation, listening and following directions, task-
persistence, and independently completing assignments. Further, when the researchers examined
the relationship of teachers and students, the data revealed that students whom teachers perceived
to demonstrate high levels of cognitive engagement were treated more positively and warmer
than those who were perceived as being cognitively disengaged. This study also revealed that
students who demonstrated disengaged behaviors in first grade were significantly more likely to
experience academic and behavior problems as well.
The relationship between students and teachers also demonstrated increased engagement
and motivation for teachers. Teachers who had developed good classroom management skills
also reported that relationships with students were important. (Cardelle-Elawar & Sanz de Acedo

55
Lizarraga, (2010). Teachers who displayed positive attitudes and self-efficacy about their own
knowledge also respond more positively to professional learning (Gentry et al., 2011). In fact,
Archambault et al., (2012) presented data that suggested a significant relationship between
cognitive and behavioral engagement among older elementary students and warm, positive
teacher-student relationships. The findings indicated that the behavior of the teacher in the
classroom, by creating a warm and inviting environment, sustained engagement and motivation.
The research also indicated that the data to support this type of environment could lessen
the academic deficits of students who come to school unprepared to learn (Archambault et al.,
2012). What made this research even more relevant was that the research method controlled for
gender, prior school experience, and maternal education level, indicating that the relationship
within the classroom between the teacher and students set the tone for student engagement levels
later in the school experience. Furthermore, the research established the relevance of teacher-
student relationships to promote student engagement and motivation, yet it also provided
analyses on the adult behavior as necessary to create those conditions. Teachers who understood
the relevance of this research and were determined to change the learning environment to
provide strong relationships impacted the engagement and motivation level of students for years.
Specific suggested teacher behaviors from the study included taking time to talk with students,
expressing concern and appreciation to students for interactions, and providing a safe, orderly
environment.
Professional Learning and Teacher Preparation
Professional development for teachers provides teachers with the skills and knowledge to
establish stronger relationships with students (Archambault et al., 2012; Demir, 2011; Gentry et
al., 2011; Song, et al, 2014). Educational psychology courses provide a foundation of

56
knowledge about motivation and engagement, but teachers need a model to show the relevance
of this content knowledge to practical implementation (Ames, 1990).
One significant impact on motivation and engagement of teachers appears to be the
quality of collaboration shared by teams of teachers. The work of Dufour, Dufour, Eaker, and
Many (2010) shed light on the power of the Professional Learning Community (PLC) on teacher
effectiveness. The PLC, when fully functional and effective, held to three main ideas: a focus
on learning, a collaborative culture, and a focus on results (Dufour et al., 2010; Durksen &
Klassen, 2012; Hermansen & Nerland, 2014; Lunenburg, 2010). Teachers who worked
collaboratively to ensure the success of every student were interdependent on each other and held
one another mutually responsible (Dufour et al., 2010). Recent research (Hermansen & Nerland,
2014) supported the power of strong teacher collaboration and its effect on teacher engagement
and motivation, particularly when teachers were discussing strategies to assess student learning.
Collaboration in a true PLC is a process develops over time and includes a high level of trust
among its members (Dufour, et al., 2010). Traditional professional learning opportunities and
teacher preparation programs have not provided teachers with the tools to know how to
collaborate around student learning (Hermansen & Nerland, 2014). Teachers may be required to
meet routinely, but there is seldom guidance to the teams on how to use assessment data to
determine next steps in learning (Dufour et al., 2010). Hermansen and Nerland (2014)
determined that teachers needed guidance and tools in order for collaboration to be truly
effective. Using samples of student work, designing common assessments, and discovering
together how to use the assessment data provides the framework for effective collaboration and
improved teacher engagement (Dufour et al., 2010; Hermansen & Nerland, 2014).

57
An examination of pre-service teacher preparation programs by several researchers
suggested that more time in classroom settings, or practicum opportunities, provides more
practical ways for teacher learning than professional development to remediate (Birchinall, 2013;
Hadjioannou & Hutchinson, 2014; Sherab, 2013; Song, et al., 2014). For example, teacher
preparation programs often only provide a quarter or semester-long practicum prior to college
graduation. Research studies (Bae, Song, Park, & Kim, 2013; Birchinall, 2013; Hadjioannou &
Hutchinson, 2014; Sherab, 2013; Song, et al., 2014) suggested that more time in classrooms
under the supervision of effective teachers could improve both pedagogy and classroom
management skills. Birchinall (2013) and Holt (2012) further asserted that cross-curricular
training could provide an increase in motivation and engagement for the induction level teacher.
Context-based learning promotes creativity and extends teacher confidence. This approach is
incongruent with traditional teacher preparation programs, which are predominately
constructivist in nature (Bae, et al., 2013; Birchinall, 2013; Sherab, 2013). Inquiry based
learning provides pre-service teachers with opportunities to extend professional practices in both
behavioral and cognitive engagement (Birchinall, 2013; Sherab, 2014; Song, et al., 2014).
Additionally, the relationships of pre-service teachers and their supervisors provides
insight into specific organizational and cognitive behavior of the pre-service teachers
(Hadjioannou & Hutchinson, 2014; Song, et al., 2014). The school climate and how teachers
develop a collegial relationship fosters positive work motivation and cognitive engagement (Bae,
et al., 2013; Birchinall, 2013; Hadjioannou & Hutchinson, 2014; Sherab, 2013; Soong, 2012).
Pre-service teachers who spend considerable time in practicum classrooms gain valuable
knowledge about management, rules, rituals, routines, and pedagogy, which are experiences they
may not gain through textbooks or college classrooms (Bae, et al., 2013; Birchinall, 2013;

58
Hadjioannou & Hutchinson, 2014; Sherab, 2013; Soong, 2012). Pre-service teachers benefit
from service learning projects. According to Soong (2012), the benefits of service learning
projects, which are unpaid tutoring opportunities, provide pre-service teachers with an
opportunity to develop skills for dealing with cross-cultural issues. Hadjioannou and Hutchinson
(2014) also found that pre-service teachers developed both analytical and critical thinking skills
through transmediation, a form of multicultural awareness. These types of professional
development for pre-service teachers strengthen their communication and connections, which
promotes improved teacher motivation and engagement (Archambault et al., 2012; Bae, et al.,
2013; Birchinall, 2013; Demir, 2011; Gentry et al., 2011; Hadjioannou & Hutchinson, 2014;
Sherab, 2013; Soong, 2012; Song, et al., 2014).
Ames (1990) also suggested that motivation is not only quantitative (intensity, direction
and duration of behaviors) in nature. The research further suggested that the quality of the task
engagement should be a concern, which was corroborated in many current research studies
(Akey, 2006; Demir, 2011; Garcia-Reid et al., 2005; Mercer & DeRosier, 2010).
Summary
Although the themes discovered throughout the literature review indicated there was a
strong relationship between motivation and engagement and student achievement, there was little
empirical data to support the role that teacher experience level (induction or veteran) played in
teacher motivation and engagement, nor whether that relationship predicted the level of teacher
effectiveness (Bryk, 2009; Chait, 2010; Eppley, 2009; Fullan, 2010; Holt, 2012; Katz, Assor, &
Kanat-Maymon, 2008; Martin 2009; Miles & Frank, 2008; Pintrich & Schunk, 2002; Shannon,
2009; Whitcomb & Rose, 2008; Wilson, 2009). The studies revealed that beliefs about learning,
or self-efficacy, provide impetus to improved student achievement (Akey, 2006; Cho, Xu, &

59
Rhodes, 2010; Demir, 2011). The literature reviewed indicated that there is limited current
research on the teacher experience levels (induction and veteran) and how this relates to the
motivation and engagement levels of teachers to predict outcomes on the TKES (2013).

60
CHAPTER THREE: METHODOLOGY
Introduction
The purpose of this predictive correlational study was to test the self-determination
theory (Deci & Ryan, 2000) that related the variable of interest motivation and engagement of
induction (first four years) level teachers to the motivation and engagement of veteran (five or
more years) level teachers, in order to predict the level of proficiency on the Teacher Keys
Effectiveness System (TKES) evaluation of induction teachers’ and veteran teachers’ classrooms
in northeast Georgia. The variables of interest and motivation and engagement were generally
defined as the willingness or drive to achieve a goal (Ainley, 2004; Deci, Koestner, & Ryan,
2001; Green, et al., 2006; Kuh, 2007). Covariates and predictor variables were years of
experience and evaluation results on the TAPS portion of the Teacher Keys Effectiveness
System (TKES). Engagement was defined as the extent to which someone cognitively persists in
a task (Akey, 2006; Appleton, Christenson, & Furlong, 2008; Garcia-Reid et al., 2005; Kearsley
& Shneiderman, 1999). The variables of interest were measured through the Motivation and
Engagement Scale (MES-W, Martin 2010). The first predictor variable was years of experience
with the induction level considered the first four years of teaching and the veteran level
considered as five or more years of teaching. The second predictor variable was the summative
assessment score on the Teacher Keys Effectiveness System (TKES, 2013), which are reported
as Level 1 (Ineffective), Level II (Needs Development), Level III (Proficient), and Level IV
(Exemplary).
The Motivation and Engagement Scale (MES-W) designed by Martin (2010) was one of
the instruments used for data collection. The MES-W survey questions for this research were
designed to collect data concerning the characteristics of motivation and engagement among the

61
participants. The MES-W instrument is a 44-item survey consisting of stem statements and
responses recorded on a Likert rating scale, ranging from strongly agree (5) to strongly disagree
(1). The MES-W was given at the beginning of the study to ascertain current attitudes about
motivation and engagement. Care was given to protect the anonymity of the teacher
respondents. Surveys provide quantifiable data that are reliable and fairly easy to collect (Gall,
Gall, & Borg, 2007). The rationale for using this approach for the research study was that the
relationship between the variables was correlated through the survey design and achievement
scores. According to Howell (2011), data from this survey can identify trends and patterns of
behavior for motivation and engagement, which allow the researcher to identify statistical
significance among the findings. Teachers participating in the survey did not receive any
treatments to improve motivation and engagement, since the research design was non-
experimental. The surveys were completed in an online format to ease in the aggregation of the
responses for data collection and analysis.
The research study featured key variables of interest, which were motivation and
engagement and the teacher’s level of experience. Relationships between variables were
measured through a series of statistical tests. A hierarchical multiple regression analysis was
completed to show the predictive relationship between the two variables of interest (motivation
and engagement and level of experience) and the predictor variable (level of performance on the
TKES, 2013).
Design
This study followed a correlational research design, which determined if a statistically
significant relationship existed between the variables of interest of motivation and engagement
and the teacher’s level of experience (induction or veteran) to predict the performance level of

62
teachers as measured on the TKES (2013). The objective of this research study was to test the
self-determination theory (Deci & Ryan, 2000) that related the variable of interest, motivation
and engagement, of induction (first four years) level teachers to the motivation and engagement
of veteran (five or more years) level teachers to predict the level of proficiency on the Teacher
Keys Effectiveness System (TKES, 2013) evaluation of induction teachers’ and veteran teachers’
classrooms in northeast Georgia. This research study was non-experimental; therefore, there was
no treatment applied by the researcher to the subjects in the study (Ary, Jacobs, Razavieh, &
Sorensen, 2006).
Predictive correlational research is often used in educational research (Gall, Gall, &
Borg, 2007) because it provides a quantifiable measure to determine relationships and
predictions. Gall, Gall, and Borg also provided guidance in the selection of the appropriate type
of research design based on a number of factors. One type indicates that the research should
unearth significant relationships rather than manipulate outcomes. Table 1 identifies quantitative
research designs and suggests reasons why those designs should be rejected based on the
predictive nature of this study. The Pearson product-moment coefficient was utilized to
determine the strength and direction of the relationship of the variables. The coefficient range is
from -1, which indicates a weaker correlation of the variables, to 1, which indicates a stronger
correlation of the variables (Howell, 2011). The purpose of a correlational study is to look for
possible relationships among variables of interest (Howell, 2011). These relationships were
examined to determine if there is a positive, negative, or no correlation among the variables of
interest (Ary, Jacobs, Razavieh, & Sorensen, 2006).

63
Table 1 Research Designs: Rejected for This Study
Other Designs Rejected Justification
Causal comparative (non-experimental) Seeks to identify causation relationships Seeks to determine group differences Forms groups to measure independent variable Has a control group
Quasi-experimental Examines causal relationships between variables Manipulation of variables with a treatment group Has a control group Pretest/Posttest
Experimental Examines causal relationships between variables Manipulation of variables within a treatment group Has a control group
Note. Adapted from Gall, Gall, and Borg (2007).
Research Questions
The following research questions guided this study:
Research Question 1: Is there a statistically significant difference in the level of
motivation and engagement, as measured by the MES-W (Martin, 2012), between induction
level teachers (first four years) and veteran level teachers (five or more years)?
Research Question 2: For induction level teachers (first four years), is there a
statistically significant relationship between teachers’ motivation and engagement, as measured

64
by the MES-W (Martin, 2012), and the results on the TAPS overall portion of the Teacher Keys
Effectiveness System (TKES) formative evaluation?
Research Question 3: For veteran level teachers (five or more years), is there a
statistically significant relationship between teachers’ motivation and engagement, as measured
by the MES-W (Martin, 2012), and the results on the TAPS overall score portion of the Teacher
Keys Effectiveness System (TKES) formative evaluation?
Research Question 4: While controlling for the overall score on the TAPS portion of
the TKES, is there a statistically significant difference in the level of motivation and engagement
level, as measured by the MES-W (Martin, 2012), between induction level teachers (first four
years) and veteran level teachers (five or more years)?
Null Hypotheses
The research study explored the following null hypotheses:
H01: There is no statistically significant difference in the level of motivation and
engagement, as measured by the MES-W (Martin, 2012), between induction level teachers (first
four years) and veteran level teachers (five or more years).
H02: For induction level teachers (first four years), there is no statistically significant
relationship between teachers’ motivation and engagement, as measured by the MES-W (Martin,
2012), and the results on the TAPS overall portion of the Teacher Keys Effectiveness System
(TKES) formative evaluation.
H03: For veteran level teachers (five or more years), there is no statistically significant
relationship between teachers’ motivation and engagement, as measured by the MES-W (Martin,
2012), and the results on the TAPS overall score portion of the Teacher Keys Effectiveness
System (TKES) formative evaluation.

65
H04: While controlling for the overall score on the TAPS portion of the TKES, there is
no statistically significant difference in the level of motivation and engagement, as measured by
the MES-W (Martin, 2012), between induction level teachers (first four years) and veteran level
teachers (five or more years).
Alternate Hypotheses
H11: There is a statistically significant difference in the level of motivation and
engagement, as measured by the MES-W (Martin, 2012), between induction level teachers (first
four years) and veteran level teachers (five or more years).
H12: For induction level teachers (first four years), there is a statistically significant
relationship between teachers’ motivation and engagement, as measured by the MES-W (Martin,
2012), and the results on the TAPS overall score portion of the Teacher Keys Effectiveness
System (TKES) formative evaluation.
H13: For veteran level teachers (five or more years), there is a statistically significant
relationship between teachers’ motivation and engagement, as measured by the MES-W (Martin,
2012), and the results on the TAPS overall score portion of the Teacher Keys Effectiveness
System (TKES) formative evaluation.
H14: While controlling for the overall score on the TAPS portion of the TKES, there is a
statistically significant difference in the level of motivation and engagement, as measured by the
MES-W (Martin, 2012), between induction level teachers (first four years) and veteran level
teachers (five or more years).
Participants
The participants were a convenience group of teachers, chosen because of availability
and close proximity to one another, from school districts within a regional geographic area

66
(Warner, 2013). The population included 161 teachers from several school districts in rural
northeast Georgia. Teachers were separated into two groups based on level of teaching
experience: induction (first four years) and veteran (more than four years). The participating
schools were reflective of the overall population in demographics: approximately 8% Black,
about 4% Hispanic, and 85% White; 49% male and 51% female; and socioeconomic status of
approximately 70% free and reduced lunch. Demographic data collected for the teacher
participants included years of teaching experience, gender, ethnicity, content, and grade level(s)
taught. For the statistical analyses to yield valid and reliable results, a sample size of two
predictor variables was N > 104 + k, where N represented the number of participants and k
represented the predictor variables (Warner, 2013). Since this study involved two predictor
variables, number of years teaching experience and the level of proficiency on the TKES
summative assessment, the minimum sample size was N > 106. The α level of .05, at a
minimum, provided a medium effect size of (f2 = .15) and power of .80, a priori calculation
suggested a sample size of at least 72 (Warner, 2013). The projected 150 teacher participants
were exceeded by 11, which added strength and minimized the standard error measure (Cohen,
1992; Tabachnick & Fidell, 2007). Demographic data were also collected through the online
survey.
Setting
The participants were induction level (first four years) teachers and veteran (five or more
years) teachers, comprised mostly from small, rural school systems in a Regional Educational
Support Services (RESA) area. The school systems ranged in size from around 1,500 students to
4,000 students. The public school systems are all countywide school districts. The

67
demographics of students within this RESA area reflected the overall population of the region.
Approximately 85% of the population is White, 8% Black, 4% Hispanic, and 3% other races.
Table 2 summarizes the demographic data for northeast Georgia.
Table 2 Demographic Data of the Population in Northeast Georgia
County White % of Population
Black % of Population
Other % of Population
Hispanic % of Population
A 91.7 2.3 4.5 5.7
B 95.6 0.5 2.6 4.1
C 87.3 8.4 2.6 3.9
D 77.4 18.7 2.7 3.1
AVERAGE 85 7.48 3.1 4.2
Note. 2010 U.S. Census demographic data taken from Kriesel, (2012).
Overall in the region, the elementary teachers are mainly female; however, at the middle
and high school levels, approximately 40% of the teachers are male. More than 80% of the
participants in the study were female. Table 3 depicts a county-by-county comparison of the
average years of teaching experience, salary, and minority status.
Table 3 Years of experience, Salary, Advanced Degree and Minority Status for Teachers in the Region
County Average
Year's
Experience
Average
Annual
Salary
Teachers
with
Advanced
Degrees
Minority
Teachers

68
A 11.6 $51,007 71.9 0.5
B 14.57 $55,470 70.7 0.4
C 15.14 $53,562 73.7 6.5
D 15.4 $53,886 70.5 9.4
Averages 14.18 53481.25 71.70 4.20
(Kriesel, 2012)
Instrumentation
Responses from the Motivation and Engagement Scale (MES-W, Martin, 2012) surveys,
as well as reported state results from the TAPS portion of the TKES were utilized as instruments
for this study. Permission to utilize the MES-W was obtained through the purchase rights as
outlined in the agreement with Lifelong Achievement, the publishing company for the MES-W.
The TKES data were provided by the school districts.
Motivation Engagement Scale (MES-W)
Data were collected through the administration of an online survey about motivation and
engagement for teachers. The survey administered to teachers was the Motivation and
Engagement Scale (MES-W), developed by Andrew J. Martin (2012), a senior research fellow at
the University of Sydney, published through Lifelong Achievement. The MES-W was developed
as the result of a meta-analysis of data compiled into one framework to determine not only a
diagnostic view of the levels of engagement and motivation but also for the purpose of
assessment, research, and tracking of both engagement and disengagement. The MES-W
consists of four major quadrants: adaptive cognitive dimensions, adaptive behavioral dimensions,
maladaptive behavioral dimensions, and impeding cognitive dimensions. The four quadrants of
the MES-W are the dimensions of motivation and engagement as identified by Martin with each

69
dimension corresponding to the negative and positive behavioral outcomes. Adaptive cognitive
dimensions include engagement measures, such as task management, planning, and persistence.
The adaptive behavioral dimensions include motivation behaviors such as a focus on learning,
valuing education, and self-belief. The maladaptive behavior dimensions of the MES-W focus
on disengagement and self-sabotage. The impeding cognitive dimensions are anxiety, failure
avoidance, and uncertain control. Collectively, these four quadrants present a comprehensive
measure of motivation and engagement. There are 11 subscales that include four items per each
subscale for a total of 44 rated items. The MES-W utilizes a 7-point Likert-type rating scale;
rating responses in an interval-ratio from strongly disagree to strongly agree. This survey
instrument was validated for content and construct. The Cronbach’s alpha for the 11 subscales of
the MES-W is .78. The MES-W was normed in Australia with over 5,000 adults within 100
classrooms representing about 70 schools. Participants in the norming process were from urban,
rural, and suburban areas. The normed scores translates into a Motivation Quotient Score (MQ
Score), similar to an intelligence quotient (IQ) score, which has a mean score of 100 and a
standard deviation of 15, contributing to a normal curve. The test-retest reliability was .73. A
confirmatory factor analysis was conducted for the construct validity of the 11 subscales.
Teacher Keys Effectiveness System (TKES)
The Teacher Keys Effectiveness System (TKES, 2013) provides a common definition of
teacher effectiveness through a thoroughly researched set of performance standards for teachers.
The 10 Teacher Assessment of Performance Standards (TAPS), guided by qualitative rubrics,
was developed by experts in the field of education (TKES, 2013). Teachers are observed
throughout the school year during four walkthroughs, which consist of a 15-minute evaluation
targeting one or more of the performance standards. Additionally, two formative assessment

70
evaluations are conducted, which consist of a 30-minute observation and information gathered
from documentation submitted, lesson plans, and a review of communication logs. This
preponderance of evidence yields a rating over all 10 of the performance standards. The
observations (walkthroughs and formative) may be announced or unannounced.
The TAPS provides a balance of structure and flexibility in teaching style. The
prescriptive approach defines the expectations for effective instructional practices and guides the
instruction through common vocabulary and exemplars (TKES, 2013). Teacher individuality,
creativity, and learning styles are not inhibited through the process; however, the overarching
goal of the TKES process allows for the continuous growth of teachers. The TKES process
provides samples of performance indicators, research-based fact sheets, and rubrics to guide
teachers along the path of becoming more effective. The TAPS feature a three-tiered approach
to define the teacher expectations, which includes five domains: planning, instructional delivery,
assessment of and for learning, learning environment, and professionalism and communication.
Table 4 displays the 10 TAPS performance standards by which teachers are evaluated.
Table 4 Teacher Assessment on Performance Standards (TAPS)
Domain Standard Description
Planning Standard 1: Professional Knowledge
The teacher demonstrates an understanding of the curriculum, subject, content, pedagogical knowledge, and the needs of students by providing relevant learning experiences.
Standard 2: Instructional Planning
The teacher plans using state and local school district curricula and standards, effective strategies, resources, and data to address the differentiated needs of all students.
Instructional Delivery
Standard 3: Instructional Strategies
The teacher promotes student learning by using research-based instructional strategies relevant to the content to engage students in active learning

71
and to facilitate the students’ acquisition of key knowledge and skills.
Standard 4: Differentiated Instruction
The teacher challenges and supports students’ learning by providing appropriate content and developing skills which address individual learning differences.
Assessment of and for learning
Standard 5: Assessment Strategies
The teacher systematically chooses a variety of diagnostic, formative, and summative assessment strategies and instruments that are valid and appropriate for the content and student population.
Standard 6: Assessment Uses
The teacher systematically gathers, analyzes, and uses relevant data to measure student progress, to inform instructional content and delivery methods, and to provide timely and constructive feedback to both students and parents.
Learning Environment
Standard 7: Positive Learning Environment
The teacher provides a well-managed, safe, and orderly environment that is conducive to learning and encourages respect for all.
Standard 8: Academically Challenging Environment
The teacher creates a student-centered, academic environment in which teaching and learning occur at high levels and students are self-directed learners.
Professionalism and Communication
Standard 9: Professionalism
The teacher exhibits a commitment to professional ethics and the school’s mission, participates in professional growth opportunities to support student learning, and contributes to the profession.
Standard 10: Communication
The teacher communicates effectively with students, parents or guardians, district and school personnel, and other stakeholders in ways that enhance student learning.

72
Procedures
Since human participants were used as part of the study, care was taken to protect human
rights to privacy and protection. The participants were treated with respect and privacy was
protected. The participants were made aware of the benefit of participation in the study, as well
as the fact that there was no compensation for participation or punishment for non-participation.
Proper paperwork was filed and approved by Liberty University’s Institutional Review Board
(IRB) prior to any aspects of the study being implemented. The five members of the IRB
provided guidance to the researcher throughout the process. Permission from the school districts
was obtained in written form IRB approval was obtained (see Appendix E).
Permission to conduct the research study was obtained from the superintendents of all
four of the participating school systems prior to contacting the school principals (see Appendix
C). The signed documentation was also provided to the principals and teachers in order to secure
participation in the research study. The researcher gave the school district superintendents the
letter of informed consent (see Appendix D) explaining the nature of the research study, purpose
for the data collection, and the IRB stamped approval, which then distributed it to the teachers
via email, along with the MES-W survey link. The decision to participate was left up to the
teachers, who decided to click on the link and complete the demographic data and the survey.
The superintendents also provided a data file of the TKES overall scores to the RESA
statistician.
The MES-W teacher survey was completed online for ease of data collection and as a
time saving device for teachers. Teachers were encouraged to participate in the survey during
their planning time or after school. The data from the TKES summative assessments, which are
the end of the year evaluation ratings, were collected from the school district office, and

73
indicated the overall level of performance on the TAPS portion of the TKES (Level IV,
Exemplary; Level III, Proficient; Level II, Needs Development; and Level I, Ineffective).
Demographic data were collected as well (Gall, Gall, & Borg, 2010), in order to provide
clarification of who the participants were. A set beginning and ending date, as outlined in the
IRB approval letter, was embedded in the online survey, to ensure reliability of the results. The
survey question format was short and easy to read to provide more accurate data. In addition,
the survey link given to the teachers became inactive once the survey was completed, in order to
provide for accuracy in reporting only one score per participant. The researcher collected the
MES-W (2012) survey results from the teachers utilizing a password-protected computer to
ensure privacy of the participants. The researcher did not have access to any identifying
information.
The ratings on the MES-W (2012) survey were entered into the Statistical Package for the
Social Sciences (SPSS)© statistical software and then matched to the TKES summative
assessment levels results by a qualified data analyst at the Pioneer Regional Educational Services
Agency (RESA). At no time did the researcher have access to teacher names, school
assignments, or the teachers’ individual TKES scores.
Data Analysis
The statistical analysis was conducted utilizing the SPSS© software. The Mann-Whitney
U test was the inferential test used to measure significant differences in the variables. Tests for
normality were also conducted. Additionally, the Pearson’s r Correlation was used to determine
if a statistically significant relationship existed between the variables. The Spearman rho
Correlation further tested the relationship between the components of the TKES and the MES-W
(Martin, 2012). The analysis of covariance (ANCOVA) test was used to analyze the null

74
hypotheses, which allowed for the researcher to determine the predictive correlation among the
criterion variables (Gall, Gall, & Borg, 2007).
Warner (2013) suggested that the appropriate assumption tests for multiple regression-
analyses include normality (histogram, probability-probability plot), homoscedasticity
(scatterplot), linearity (scatterplot), and extreme outliers (Cook’s Distance and Mahalanobis
Distance for the overall data set). The series of statistical analyses included the homogeneity of
regression (slope) assumption tests to evaluate the interaction between the covariates and the
Levene’s Test of Equality or Error Variances for the dependent variable. Tests for normality
included histograms, skew and kurtosis statistics, and the Kolmogorov-Smirnov test. The results
of the assumptions tests and ANCOVA are presented and discussed in Chapter 4.
The study focused on the general characteristics that highly motivated and engaged
individuals could display. For example, previous research (Ainley, 2004; Deci, Koestner &
Ryan, 2001; Hattie, 2009; Hufton et al., 2002) indicated that students who are motivated tend to
have high achievement levels. The data collected from the MES-W provided statistical analyses
to determine generalizations about the relationship of the teachers’ motivation and engagement
to their level of teaching experience. Descriptive statistics were analyzed to summarize the data
from the sample participants. Descriptive statistics included demographic variables for the
sample size (N), central tendency, standard deviation, and standard error of the mean (Rovai,
Baker, & Ponton, 2013).
Survey results were analyzed using correlational coefficients to test each hypothesis for
inferential statistics (Howell, 2011). A scatterplot (or scattergram) was used to show any
relationships between the variables and the positive or negative direction of the relationship
(Rovai, Baker, & Ponton, 2013). These data were correlated to the overall levels of performance

75
on the TKES to determine the effect of motivation and engagement and years of teaching
experience (Gall, Gall, & Borg, 2010). The survey data collected from the teachers were
correlated to triangulate the statistics from the MES-W (Martin, 2012), the years of teaching
experience, and the level of proficiency on the TKES summative assessment by examining the
alpha score.
The level of statistical significance used for this study was alpha (α) = .05. The
correlation of data was interpreted to either reject the null hypotheses or accept the null
hypotheses. Limitations of the small sample size for the induction (first four years) level
teachers are discussed more fully in Chapter 5.

76
CHAPTER FOUR: FINDINGS
The purpose of this quantitative correlational study was two-fold: first, to contribute
research to previous studies that have explored the relationship between motivation and
engagement and teacher effectiveness, and second, to address the gap in the literature in regards
to the study of motivation and engagement and teachers’ experience levels. Teachers in four
northeast Georgia school districts provided the data collected for this study. This chapter is
divided into five sections. First, the research questions and hypotheses are presented. Second,
the demographic data of the participants are discussed. Third, the sample population is presented
in the descriptive statistics. Fourth, the results of the statistical analyses for each research
question, including related assumptions and interpretations, are presented. Fifth, the summary of
the findings is presented. Chapter Four ends with a preview of the purpose of Chapter Five.
Research Questions
The following research questions guided the study:
Research Question 1: Is there a statistically significant difference in the level of
motivation and engagement, as measured by the MES-W (Martin, 2012), between induction
level teachers (first four years) and veteran level teachers (five or more years)?
Research Question 2: For induction level teachers (first four years), is there a
statistically significant relationship between teachers’ motivation and engagement, as measured
by the MES-W (Martin, 2012), and the results on the TAPS overall score portion of the Teacher
Keys Effectiveness System (TKES) formative evaluation?
Research Question 3: For veteran level teachers (five or more years), is there a
statistically significant relationship between teachers’ motivation and engagement, as measured

77
by the MES-W (Martin, 2012), and the results on the TAPS overall score portion of the Teacher
Keys Effectiveness System (TKES) formative evaluation?
Research Question 4: While controlling for the overall score on the TAPS portion of
the TKES, is there a statistically significant difference in the level of motivation and engagement
level, as measured by the MES-W (Martin, 2012), between induction level teachers (first four
years) and veteran level teachers (five or more years)?
Null Hypotheses
The null hypotheses explored in the research study were:
H01: There is no statistically significant difference in the level of motivation and
engagement, as measured by the MES-W (Martin, 2012), between induction level teachers (first
four years) and veteran level teachers (five or more years).
H02: For induction level teachers (first four years), there is no statistically significant
relationship between teachers’ motivation and engagement, as measured by the MES-W (Martin,
2012), and the results on the TAPS overall portion of the Teacher Keys Effectiveness System
(TKES) formative evaluation.
H03: For veteran level teachers (five or more years), there is no statistically significant
relationship between teachers’ motivation and engagement, as measured by the MES-W (Martin,
2012), and the results on the TAPS overall Score portion of the Teacher Keys Effectiveness
System (TKES) formative evaluation.
H04: While controlling for the overall score on the TAPS portion of the TKES, there is
no statistically significant difference in the level of motivation and engagement, as measured by
the MES-W (Martin, 2012), between induction level teachers (first four years) and veteran level
teachers (five or more years).

78
Alternate Hypotheses
H11: There is a statistically significant difference in the level of motivation and
engagement, as measured by the MES-W (Martin, 2012), between induction level teachers (first
four years) and veteran level teachers (five or more years).
H12: For induction level teachers (first four years), there is a statistically significant
relationship between teachers’ motivation and engagement, as measured by the MES-W (Martin,
2012), and the results on the TAPS overall score portion of the Teacher Keys Effectiveness
System (TKES) formative evaluation.
H13: For veteran level teachers (five or more years), there is a statistically significant
relationship between teachers’ motivation and engagement, as measured by the MES-W (Martin,
2012), and the results on the TAPS overall score portion of the Teacher Keys Effectiveness
System (TKES) formative evaluation.
H14: While controlling for the overall score on the TAPS portion of the TKES, there is a
statistically significant difference in the level of motivation and engagement, as measured by the
MES-W (Martin, 2012), between induction level teachers (first four years) and veteran level
teachers (five or more years).
Descriptive Statistics The participants for this research study were 161 teachers employed with four school
districts in rural northeast Georgia. The majority of respondents were kindergarten through fifth-
grade teachers (57.12%), female (82%), who taught math (23.0%), English/Language Arts
(29.2%) or reading (19.9%), and veteran teachers (78.3%) with five or more years of experience
(see Tables 5 through 9 and Figures 1 through 3).

79
Table 5 displays the frequency analysis for the participants, outlining the percentage of
teachers for each grade span, including elementary teachers (kindergarten through fifth grade);
middle school teachers (sixth through eighth grades); and high school teachers (ninth through
twelfth grades).
Table 5 Frequency Analysis-Grade Levels Frequency Percent Cumulative Percent Valid K - 5 92 57.1 57.1
6 - 8 20 12.4 69.6
9 - 12 49 30.4 100.0
Total 161 100.0
The majority of teachers responding were elementary teachers. Nearly six of ten
respondents (57.1%) taught in elementary school and another three of ten teachers (30.4%)
worked within a high school.
The frequency analysis by gender is represented in Table 6. Female teachers dominated
the field of education for the region of northeast Georgia.
Table 6 Frequency Analysis-Gender Frequency Percent Cumulative Percent
Valid Male 29 18.0 18.0
Female 132 82.0 100.0
Total 161 100.0

80
For the respondent sample, over eight of every 10 teachers (82%) were female. The participants in the research study taught a variety of subject areas. Data are
displayed in Table 7 and Figure 1, which is the frequency analysis by subject taught.
Table 7 Frequency Analysis-Subject Taught
Frequency Percent Cumulative Percent
Valid Math 37 23.0 23.0
ELA 47 29.2 52.2
Science 15 9.3 61.5
Social Studies 12 7.5 68.9
CTAE 11 6.8 75.8
Fine Arts 2 1.2 77.0
Health/PE 5 3.1 80.1
Reading 32 19.9 100.0
Total 161 100.0 100.0
Table 7 and Figure 1 indicate that the greatest percentages of teachers that responded
either taught math (23.0%), English/Language Arts (29.2%) or reading (19.9%). About one in
10 teachers (9.3%) taught science.

81
Figure 1
Subjects Taught Table 8 Frequency Analysis- Years of Experience
Frequency Percent Cumulative Percent
Valid 1 - 4 35 21.7 21.7
5 or more 126 78.3 100.0
Total 161 100.0
Participants were asked to voluntarily submit their years of teaching experience and their
age range. Data are displayed in Tables 8 and 9, respectively. Four teachers did not volunteer
their age ranges. Nearly eight of every 10 teachers responding were considered veteran teachers.
About three-fourths of the teachers were aged 40 years or older.

82
Table 9 Frequency Analysis-Age (voluntary information)
Frequency Percent Valid Percent Cumulative
Percent Valid 20 - 24 3 1.9 1.9 1.9
25 - 28 10 6.2 6.4 8.3
29 - 35 13 8.1 8.3 16.6
36 - 40 15 9.3 9.6 26.1
41 - 45 42 26.1 26.8 52.9
46 + 74 46.0 47.1 100.0
Total 157 97.5 100.0
Missing System 4 2.5
Total 161 100.0
Table 10 lists the descriptive statistics for the respondents’ scores on the MES-W
(Martin, 2012), which is a 44-item self-reporting motivation and engagement survey. The MES-
W scores ranged from a minimum of 9 to a maximum of 73 out of a possible total of 100. The
distribution of the MES-W scores was skewed to the left (skewness = -3.23), although the mean
(M=59.1, SD=8.9) and median (Md=60.2) were close in value. From Figure 2, the negative
skewness is supported by the histogram’s display of the MES-W distribution’s long tail to the
left.

83
Table10
Descriptive Statistics – MES-W Score N Valid 161
Missing 0 Mean 59.08
Median 60.18
Std. Deviation 8.889
Variance 79.017
Skewness -3.232
Kurtosis 14.638
Range 64
Minimum 9
Maximum 73
Figure 2
Histogram of MES Score

84
The observed and measurable portion of the TKES was the Teacher Assessment on
Performance Standards (TAPS). For the teacher respondents, a TAPS summative assessment
score ranged from 12 to 30. There was about a one-point difference between the mean (M =
21.1, SD = 2.6) and median values (Md = 20.0). The TAPS overall scores were slightly skewed
(Skewness = 1.1) to the right (see Table 11 and Figure 3).
Table11 Descriptive Statistics - TAPS Overall Score
N Valid 161
Missing 0 Mean 21.11
Median 20.00
Std. Deviation 2.627
Variance 6.900
Skewness 1.109
Kurtosis 3.689
Range 18
Minimum 12
Maximum 30

85
Figure 3
Histogram- TAPS OVERALL Score
Tables 12 through 14 provided group means for the MES-W and TAPS overall scores
based on teaching experience, teaching position, and subject taught. Induction (first four years)
teachers (M=60.0, SD=4.5) had a higher MES-W score than veteran teachers (M=58.8, SD=9.8).
High school teachers had the highest MES-W scores (M = 60.3, SD = 5.5), followed by
kindergarten teachers (M=58.9, SD=9.0), and middle school teachers (M = 56.9, SD = 13.8).
MES-W scores for female teachers (M = 59.2, SD=8.4) were greater than those for their male
counterparts (M = 58.5, SD = 10.9).
Unlike the MES-W scores, the teachers’ TAPS overall scores for induction teachers (M =
20.5, SD = 1.9) were less than those scores for the veteran teachers (M = 21.3, SD = 2.8).
TAPS overall scores were greatest for kindergarten teachers (M = 21.5, SD = 2.9). The

86
descriptive statistics for TAPS overall scores were very similar for male (M = 21.2, SD = 3.0)
and female teachers (M = 21.1, SD = 2.6).
Table 12 displays the group descriptive statistics for both the MES-W Score (Martin,
2012) and the TAPS overall score by years of teaching experience (TKES, 2013). The two
groups displayed are induction level (one to four years of experience) and the veteran level (five
or more years of experience).
Table 12 Group Descriptive Statistics: MES-W Score & TAPS Overall Score by Years of Experience Years of experience Statistics MES-W Score TAPS Overall Score
1 - 4 Mean 60.02 20.54
Std. Deviation 4.528 1.868
Median 60.18 20.00
N 35 35
5 or more Mean 58.82 21.27
Std. Deviation 9.760 2.787
Median 60.33 20.00
N 126 126
Total Mean 59.08 21.11
Std. Deviation 8.889 2.627
Median 60.18 20.00
N 161 161
Table 13 provides the group descriptive statistics for the MES-W Score (Martin, 2012)
and the TAPS overall score by teaching position (grade bands) for the respondents.

87
Table 13 Group Descriptive Statistics: MES-W Score & TAPS Overall Score by Teaching Position
Teaching Position MES-W Score TAPS Overall Score
K - 5 Mean 58.90 21.48
Std. Deviation 9.010 2.850
Median 60.18 20.00
N 92 92
6 - 8 Mean 56.86 19.60
Std. Deviation 13.837 2.437
Median 60.03 20.00
N 20 20
9 - 12 Mean 60.34 21.04
Std. Deviation 5.473 2.010
Median 61.37 20.00
N 49 49
Total Mean 59.08 21.11
Std. Deviation 8.889 2.627
Median 60.18 20.00
N 161 161
Table 14 depicted the group statistics for the MES-W Score (Martin, 2012) and the
TAPS overall score by the subjects taught for the participants.

88
Table 14
Group Descriptive Statistics: MES-W Score & TAPS Overall Score by Subject Taught
Subject Taught MES-W Score TAPS Overall Score
Math Mean 58.70 21.03
Std. Deviation 9.545 2.692
Median 60.33 20.00
N 37 37
ELA Mean 59.03 21.45
Std. Deviation 6.968 2.812
Median 59.58 21.00
N 47 47
Science Mean 58.41 20.80
Std. Deviation 12.636 2.396
Median 62.71 20.00
N 15 15
Social Studies Mean 60.88 20.25
Std. Deviation 6.100 2.179
Median 61.89 20.00
N 12 12
CTAE Mean 59.15 20.55
Std. Deviation 7.675 1.440
Median 59.58 20.00
N 11 11
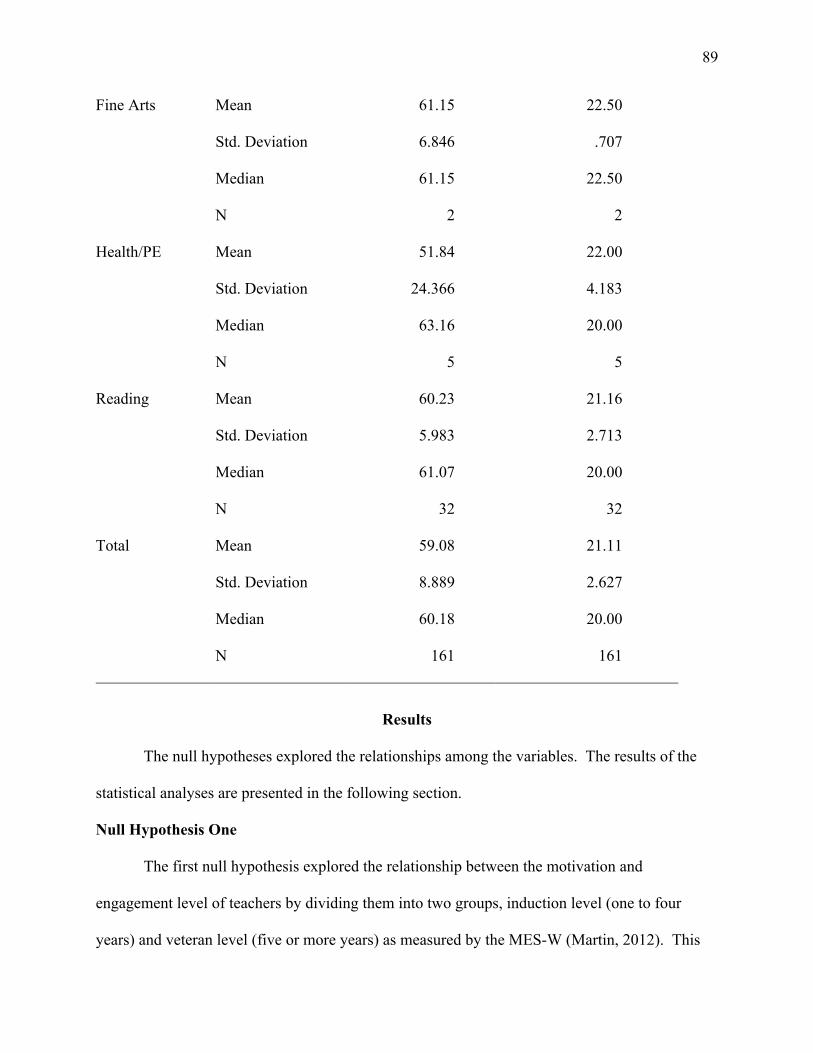
89
Fine Arts Mean 61.15 22.50
Std. Deviation 6.846 .707
Median 61.15 22.50
N 2 2
Health/PE Mean 51.84 22.00
Std. Deviation 24.366 4.183
Median 63.16 20.00
N 5 5
Reading Mean 60.23 21.16
Std. Deviation 5.983 2.713
Median 61.07 20.00
N 32 32
Total Mean 59.08 21.11
Std. Deviation 8.889 2.627
Median 60.18 20.00
N 161 161
Results
The null hypotheses explored the relationships among the variables. The results of the
statistical analyses are presented in the following section.
Null Hypothesis One
The first null hypothesis explored the relationship between the motivation and
engagement level of teachers by dividing them into two groups, induction level (one to four
years) and veteran level (five or more years) as measured by the MES-W (Martin, 2012). This

90
research question related the main criterion variable of motivation and engagement as measured
by the MES-W score and the number of years of experience for the induction level (one to four
years) teachers and veteran level teachers (five or more years).
Research Question 1: Is there a statistically significant difference in the level of
motivation and engagement, as measured by the MES-W (Martin, 2012), between induction
level teachers (first four years) and veteran level teachers (five or more years)?
H01: There is no statistically significant difference in the level of motivation and
engagement, as measured by the MES-W (Martin, 2012), between induction level teachers (first
four years) and veteran level teachers (five or more years).
H11: There is a statistically significant difference in the level of motivation and
engagement, as measured by the MES-W (Martin, 2012), between induction level teachers (first
four years) and veteran level teachers (five or more years).
The inferential test to measure whether there was a significant difference between two
groups (teachers with one to four years of experience and those with five or more years) was the
independent samples t-test. There were three assumptions to be met prior to conducting an
independent samples t-test. The first assumption was that the variables were normally
distributed. As shown in Table 15, normality was tested using a Kolmogorov-Smirnov test (N ≥
50). Both the TAPS overall score [K-S (161) = 0.229, p < 0.01] and the MES-W score [K-S
(161) = 0.216, p < 0.01] were not normally distributed. Therefore, an independent samples t-test
could not be conducted and a Mann-Whitney U test was conducted for testing the null hypothesis
(Gall, Gall, & Borg, 2007; Warner, 2012). In addition, the other two assumptions, homogeneity
of variance and equal means, did not need to be tested since the normality assumption failed.

91
The boxplots (see Figures 6 and 7) revealed numerous outliers for both TAPS overall scores and
MES-W scores.
Table 15 Tests of Normality for TAPS Overall Score and MES-W Score
Kolmogorov-Smirnova
Statistic df Sig.
TAPS Overall Score 0.229 161 0.000
MES-W Score 0.216 161 0.000
a. Lilliefors Significance Correction
Figure 4
MES-W Scores

92
Figure 5
The error bar plot was used prior to the Mann-Whitney U test as a preliminary
determination of whether there was a difference in the means and variances between the two
teacher experience groups. The x-axis represents the two groups from the independent variable
(years of experience) and the y-axis represents the mean value of the dependent variable (MES-
W Score). The closer in value the means the more likely the assumption of equal means will
prove true when conducting the test of differences (Gall, Gall, & Borg, 2007; Warner, 2012).
The more similar the vertical distance between the horizontal bars for each group, the more
likely homogeneity of variance holds true (Warner, 2012). From the error bar plot in Figure 6, it
appears that the MES-W score means were not different. It also appears that the variance in the
induction teacher (1 to 4 years) group was not different from that of the veteran teachers’ group.

93
Figure 6
Error Bar Plot for TAPS Overall Scores by Years of Experience
Table 16 shows summary descriptive statistics for the level of the dependent variable for
each group in the Mann Whitney U test results.
Table 16
Years of experience N Mean Std.
Deviation Std. Error
Mean MES-W
Score
1 – 4 35 60.02 4.528 0.765
5 or more 126 58.82 9.760 0.869
Total 161 59.08 8.889 0.701

94
The results of the Mann-Whitney U test, shown in Tables 17 and 18, display differences
in the ranked positions of scores in the two teachers’ years of teaching experience groups. The
results of the Mann Whitney U test showed no statistically significant difference in the mean
rank MES-W scores between teachers with 1-4 years of experience (mean rank = 79.8) and
teachers with 5 or more years in the profession (mean rank = 81.3). The null hypothesis was
accepted [U (161) =2164.5, p = 0.868]. The unequal group sizes may account for no significant
difference.
Table 17 Mean and Sum of Ranks Years of experience N Mean Rank Sum of Ranks
MES-W
Score
1 - 4 35 79.84 2794.50
5 or more 126 81.32 10246.50
Total 161
Table 18 Mann Whitney U Test Statisticsa
MES-W Score
Mann-Whitney U 2164.500
Wilcoxon W 2794.500
Z -0.166
Asymp. Sig. (2-tailed) 0.868
a. Grouping Variable: Years of experience Null Hypothesis Two
Research Question 2: For induction level teachers (first four years), is there a statistically
significant relationship between teachers’ motivation and engagement, as measured by the MES-

95
W (Martin, 2012), and the results on the TAPS overall score portion of the Teacher Keys
Effectiveness System (TKES) formative evaluation?
H02: For induction level teachers (first four years), there is no statistically significant
relationship between teachers’ motivation and engagement, as measured by the MES-W (Martin,
2012), and the results on the TAPS overall score portion of the Teacher Keys Effectiveness
System (TKES) formative evaluation.
H12: For induction level teachers (first four years), there is a statistically significant
relationship between teachers’ motivation and engagement, as measured by the MES-W (Martin,
2012), and the results on the TAPS overall score portion of the Teacher Keys Effectiveness
System (TKES) formative evaluation.
To test the hypotheses related to Research Question 2, a Pearson’s product-moment
correlation coefficient (see Table 19) was performed between TAPS overall scores (TKES,
2013) and the MES-W scores controlling for only induction level teachers (1-4 years of
experience). The scatterplot in Figure 7 demonstrated significant scattering of points in that the
points did not follow a linear pattern. Therefore, it appeared there was no relationship between
the variables. From the table and scatterplot, the null hypothesis was accepted. For induction
level teachers (1-4 years), there was no statistically significant relationship between teachers’
motivation and engagement, as measured by the MES-W (Martin, 2012), and the results on the
TAPS overall score portion of the Teacher Keys Effectiveness System (TKES) formative
evaluation [r (35) < 0.01, p = 0.99].

96
Table 19 Pearson’s r Correlation – Induction Teachers Only (<5 years of experience) TAPS Overall Score
MES-W Score Pearson Correlation 0.000
Sig. (2-tailed) 0.999
N 35
Figure 7
Scatterplot of MES-W Scores by TAP Scores- Induction Teachers Only
It is probable that the low number of cases (n = 35) may account for the lack of
correlation between TAPS overall scores and MES-W scores for induction teachers. Therefore,
a Spearman’s rho correlation was conducted (see Table 20).
Table 20 Spearman rho Correlation Between TAPS Overall Scores and MES-S Scores MES-W Score
Spearman's rho TAPS Overall Rating Correlation Coefficient -0.182
Sig. (2-tailed) 0.295
N 35

97
Based on the Spearman’s rho correlation in Table 20, once again, the null hypothesis was
accepted and there was no statistically significant relationship between teachers’ motivation and
engagement (MES-W) and their TAPS scores [ρ (35) = -0.182, p = 0.295]. To verify that no
component of TAPS was correlated to MES-W scores for induction teachers, a Spearman’s rho
correlation analysis was conducted. As seen in Table 21, there was no statistically significant
relationship between any components of TAPS Overall Score and the induction teachers’ MES-
W scores.
Table 21 Spearman rho Correlation between Components of TAPS and MES Scores—Induction Teachers MES-W Score
Spearman's rho (ρ) Professional Knowledge Correlation Coefficient 0.096
Sig. (2-tailed) 0.585
Instructional Planning Correlation Coefficient -0.025
Sig. (2-tailed) 0.884
Instructional Strategies Correlation Coefficient -0.017
Sig. (2-tailed) 0.923
Differentiated Instruction Correlation Coefficient 0.019
Sig. (2-tailed) 0.912
Assessment Strategies Correlation Coefficient 0.220
Sig. (2-tailed) 0.205
Assessment Uses Correlation Coefficient -0.140
Sig. (2-tailed) 0.421
Positive Learning Environment Correlation Coefficient -0.016

98
Sig. (2-tailed) 0.928
Academically Challenging
Environment
Correlation Coefficient 0.088
Sig. (2-tailed) 0.617
Professionalism Correlation Coefficient 0.180
Sig. (2-tailed) 0.300
Communication Correlation Coefficient 0.289
Sig. (2-tailed) 0.092
*Correlation is significant at the 0.05 level (2-tailed). n = 35
Null Hypothesis 3
Research Question 3: For veteran level teachers (five or more years), is there a
statistically significant relationship between teachers’ motivation and engagement, as measured
by the MES-W (Martin, 2012), and the results on the TAPS overall score portion of the Teacher
Keys Effectiveness System (TKES) formative evaluation?
H03: For veteran level teachers (five or more years), there is no statistically significant
relationship between teachers’ motivation and engagement, as measured by the MES-W (Martin,
2012), and the results on the TAPS overall Score portion of the Teacher Keys Effectiveness
System (TKES) formative evaluation.
H13: For veteran level teachers (five or more years), there is a statistically significant
relationship between teachers’ motivation and engagement, as measured by the MES-W (Martin,
2012), and the results on the TAPS overall score portion of the Teacher Keys Effectiveness
System (TKES) formative evaluation.
To test the hypotheses related to Research Question 3, a Pearson’s r correlation, as shown
in Table 22 and Table 23, was performed between TAPS overall scores and the MES-W scores

99
for only veteran teachers (5 or more years of experience). The scatterplot in Figure 10 displayed
no relationship between the variables and showed a lack of linear relationship between these two
variables. From the table and scatterplot, the null hypothesis was accepted [r (126) =0.141, p =
0.116]. For veteran teachers, there was no statistically significant relationship between teachers’
motivation and engagement, as measured by the MES-W scores (M = 58.8, SD = 9.8) and the
TAPS overall scores (M = 21.3, SD = 2.8).
Table 22 Descriptive Statistics—Veteran Teachers Only (≥ 5 years of experience)
Mean Std. Deviation N TAPS Overall Score
21.27 2.787 126 MES-W Score
58.82 9.760 126
Table 23 Pearson’s r Correlation Between TAPS Overall Scores and MES-W Scores– Veteran Teachers Only
MES-W Score TAPS Overall Score Pearson Correlation
0.141 Sig. (2-tailed)
0.116 n
126

100
Figure 8
MES-W Scores by TAP Scores- Veteran Teachers Only
Null Hypothesis 4
Research Question 4: While controlling for the overall score on the TAPS portion of the
TKES, is there a statistically significant difference in the level of motivation and engagement
level, as measured by the MES-W (Martin, 2012), between induction level teachers (first four
years) and veteran level teachers (five or more years)?
H04: While controlling for the overall score on the TAPS portion of the TKES, there is no
statistically significant difference in the level of motivation and engagement, as measured by the
MES-W (Martin, 2012), between induction level teachers (first four years) and veteran level
teachers (five or more years).
H14: While controlling for the overall score on the TAPS portion of the TKES, there is a
statistically significant difference in the level of motivation and engagement, as measured by the
MES-W (Martin, 2012), between induction level teachers (first four years) and veteran level
teachers (five or more years).

101
The inferential test required for Research Question 4 was a One-Way Analysis of
Covariance (ANCOVA). First, the ANCOVA includes a regression of the independent variable
(i.e., the covariate) on the dependent variable. The residuals (the unexplained variance in the
regression model) are then subjected to an ANOVA. This means that the ANCOVA tests
whether the independent variable still influences the dependent variable after the influence of the
covariate(s) has been removed. The ANCOVA examines the unexplained variance and attempts
to explain some of it with the covariate(s) and it increases the power of the ANOVA by
explaining more variability in the model (Gall, et al., 2007).
Before conducting an ANCOVA, the homogeneity-of-regression (slope) assumption
should first be tested (Rovai et al., 2013). The test evaluated the interaction between the
covariate-score on the TAPS portion of the TKES and the factor (independent variable-induction
level teachers/ veteran level teachers) in the prediction of the dependent variable-level of
motivation and engagement. A significant interaction between the covariate and the factor
would suggest that the differences on the dependent variable among groups vary as a function of
the covariate. If the interaction was significant (the results from an ANCOVA were not
meaningful), an ANCOVA should not be conducted. The interaction source was labeled
Interaction-Yrs by TAPS. The results in Table 24 indicate the interaction was not statistically
significant [F (1,157) = 0.327, p = 0.568]. Based on this finding, the researcher continued with
the ANCOVA analysis.
Table 24 Tests of Homogeneity-of- Regression (Slope) Assumption for MES Score
Source
Type III Sum of
Squares df
Mean
Square F Sig.

102
Corrected Model 274.843 3 91.614 1.163 0.326
Intercept 2893.822 1 2893.822 36.735 0.000
Years of experience 33.649 1 33.649 0.427 0.514
TAPS Overall Score 25.634 1 25.634 0.325 0.569
Interaction-Yrs by TAPS 25.731 1 25.731 0.327 0.568
Error 12367.819 157 78.776
Total 574654.406 161
Corrected Total 12642.662 160
Table 25 displays the descriptive statistics for the dependent variable, the MES-W Score,
which divided the participants into two groups, induction level teachers (1 – 4 years of
experience) and veteran level teachers (5 or more years of experience).
Table 25 Descriptive Statistics- Dependent Variable: MES-W Score
From Table 26, the assumption of homogeneity of variance for the one-way ANCOVA
was rejected [F (1, 159) = 4.238, p = 0.041]. The covariate score on the TAPS portion of the
TKES was included in the analysis to control for the differences on the independent variable
induction level teachers/veteran level teachers. The primary purpose of the test of the covariate
was that it evaluated the relationship between the covariate and the dependent variable,
controlling for the factor (i.e., for any particular group).
Years Experience Mean Std. Deviation N
1 - 4 60.02 4.528 35
5 or more 58.82 9.760 126
Total 59.08 8.889 161

103
Table 26
Levene's Test of Equality of Error Variancesa - Dependent Variable: MES Score
F df1 df2 Sig.
4.238 1 159 0.041
Tests null hypothesis that error variance of dependent variable is equal across groups. a. Design: Intercept + Yrs Experience + TAPS + Yrs Experience * TAPS
The statistical analysis, displayed in Table 27, indicates that the relationship was not
statistically significant [F (1, 157) = 0.325, p = 0.569]. Additionally, what this showed is that
there was not a significant effect between the covariate and the dependent variable, and the
covariate score on the TAPS was not linearly related to the dependent variable MES-W Score.
From the effect size value, the covariate Teachers’ TAPS Scores accounted for only 0.2% (partial
η2 = 0.002 effect) of the variance in the MES Score, controlling for Years of experience-
Induction/Veteran.
The results from Table 28 can be interpreted as follows. The group source (labeled Years
of experience) evaluated the null hypothesis that the population-adjusted means of the
independent variable were equal. The results of the analysis indicate that this hypothesis was
accepted [F (1, 157) = 0.427, p = 0.514].
Table 27
Tests of Between-Subjects Effects- Dependent Variable: MES-W Score
Source
Type III
Sum of
Squares df
Mean
Square F Sig.
Partial
Eta
Squared
Noncent.
Parameter
Observed
Powerb
Corrected Model 274.843a 3 91.614 1.163 0.326 0.022 3.489 0.309

104
Intercept 2893.822 1 2893.822 36.735 0.000 0.190 36.735 1.000
Years of experience 33.649 1 33.649 0.427 0.514 0.003 0.427 0.100
TAPS Overall
Rating 25.634 1 25.634 0.325 0.569 0.002 0.325 0.088
Interaction-Yrs by
TAPS 25.731 1 25.731 0.327 0.568 0.002 0.327 0.088
Error 12367.819 157 78.776
Total 574654.406 161
Corrected Total 12642.662 160
a. R Squared = .022 (Adjusted R Squared = .003) b. Computed using alpha = .05
The overall ANCOVA model was not statistically significant. The null hypothesis for
research question four was accepted [F(3, 157) = 1.163, p=0.326]. The test assessed the
differences among the adjusted means (MES-W score) for the two groups (induction level with
one to four years of experience and veteran with five or more years of experience), which are
reported in the Estimated Marginal Means (see Tables 28, 29, and Figure 9) for the Induction
group (M=60.02) and for the Veteran Teachers’ group (M=58.75).
Table 28 Marginal Means - Dependent Variable: MES-W Score
Mean Std. Error
95% Confidence Interval
Lower Bound Upper Bound
59.381a 0.879 57.644 61.118
a. Covariates appearing in the model are evaluated at the following values: TAPS Overall Score = 21.11.

105
Table 29 Estimates -Dependent Variable: MES Score Years of
experience Mean Std. Error
95% Confidence Interval
Lower Bound Upper Bound
1 - 4 60.017a 1.570 56.916 63.119
5 or more 58.745a 0.792 57.181 60.309
a. Covariates appearing in the model are evaluated at the following values: TAPS Overall Score = 21.11. Figure 9
Estimated Marginal Means MES Scores Table 30 displays the null hypotheses and the results of the statistical analyses for each. Table 30 Summary of Tests of the Null Hypotheses
Null Hypotheses Statement Results H01 There is no statistically significant difference in the
level of motivation and engagement, as measured by the MES-W (Martin, 2012), between induction
Accepted

106
level teachers (first four years) and veteran level teachers (five or more years).
H02 For induction level teachers (first four years), there is no statistically significant relationship between teachers’ motivation and engagement, as measured by the MES-W (Martin, 2012), and the results on the TAPS portion of the Teacher Keys Effectiveness System (TKES) formative evaluation.
Accepted
H03 For veteran level teachers (five or more years), there is no statistically significant relationship between teachers’ motivation and engagement, as measured by the MES-W (Martin, 2012), and the results on the TAPS portion of the Teacher Keys Effectiveness System (TKES) formative evaluation.
Accepted
H04 Controlling for the score on the TAPS portion of the TKES, there is no statistically significant difference in the level of motivation and engagement, as measured by the MES-W (Martin, 2012), between induction level teachers (first four years) and veteran level teachers (five or more years).
Accepted
The analyses provided in Chapter Four tested the hypotheses for the four research
questions to accept or reject the null hypotheses. Chapter Five compares and evaluates the
findings in Chapter Four to those results drawn by scholars, as reported in Chapter Two. In
addition, the last chapter presents limitations of the study, implications for professional practice,
and recommendations for future study and research.

107
CHAPTER FIVE: DISCUSSION, CONCLUSIONS, AND RECOMMENDATIONS
Discussion
In Chapter 5, the research problem of this correlational study and findings from the
investigation are discussed. The subheadings of this chapter include: the research problem,
summary of the findings as they relate to the literature review found in Chapter 2, discussion of
the results from Chapter 4, implications, limitations, and recommendations for future research
related to the topic.
Research Problem
Teacher burnout and attrition is a national phenomenon (NCTAF, 2015; Williams,
2015). The problem with this growing trend is that the quality of the workforce affects teacher
effectiveness (Williams, 2015). Teachers report that there are a variety of reasons why they
are leaving the profession, predominantly teacher evaluation systems and mandated
assessments in which student growth determines the teacher’s effectiveness score (NCTAF,
2015). The main purpose of this correlational study was to test the Self-Determination Theory
(Deci & Ryan, 2000) as it related the motivation and engagement of induction (first four
years) level teachers to the motivation and engagement of veteran (five or more years) level
teachers as measured by the MES-W to predict the level of proficiency on the Teacher Keys
Effectiveness System (TKES, 2013) evaluation system of induction teachers’ and veteran
teachers’ classrooms in northeast Georgia.
The MES-W survey is a 44-item self-report survey used to assess the motivation and
engagement level of the participants. The MES-W was distributed to teachers in four school
districts. There were 161 participants who completed the MES-W survey. The induction level
consisted of 35 participants who had one to four years of experience and the veteran level
108
consisted of 126 participants with more than five years of experience. Additionally, the data
were correlated to determine if the triangulation of data (TKES overall scores and years
teaching experience) provided a predictive relationship to motivation and engagement as
measured by the MES-W.
The Self-Determination Theory (Ryan & Deci, 2000) was a good fit for the theoretical
framework for the study because it examined motivation and engagement in relation to
improved intrinsic motivation, which are the key elements of the SDT (Ryan & Deci, 2000).
The Motivation Engagement Scale (MES-W, Martin, 2012) survey measured the motivation
and engagement level of the participants. The mean score on the MES-W for the 161
participants was M = 59.38. The Teacher Assessment on the Performance Standards (TAPS)
portion of the Teacher Keys Effectiveness System (TKES) consisted of 10 performance
standards rated by a trained and credentialed evaluator. Each standard received a score
ranging from Level I (Not Evident), Level II (Needs Development), Level III (Proficient), and
Level IV (Exemplary). Corresponding numerical scores were applied to the ratings to yield a
TAPS overall score. The collective data provided a good match to the various aspects of the
Self-Determination Theory (Ryan & Deci, 2010) by examining personality in relation to
motivation and engagement and relying on choice and sense of freedom in decision-making to
improve intrinsic motivation.
Summary of the Findings
The summary of the findings from the research student follows each research question in
this section.
Research Question One
Is there a statistically significant difference in the level of motivation and engagement,

109
as measured by the MES-W, between induction level teachers (first four years) and veteran
level teachers (five or more years)?
The first research question the researcher examined was whether there was a statistically
significant difference between the motivation and engagement of induction (first four years)
and veteran (five or more years) as measured by the Motivation and Engagement Scale (MES-
W, Martin, 2012). Teachers were asked to self-report on an online survey, in which the
researcher asked pertinent demographic data (years of experience) in order to divide the MES-
W into the two groups (induction and veteran). The correlational design was a good fit for
this research because the two groups could not be randomized.
Data were analyzed using an inferential test to determine if there was a significance
difference between the two groups. The independent samples t-test could not be used, because
the assumption tests of normal distribution using a Kolmogorov-Smirnov test (n ≥ 50)
indicated the TKES and the MES-W were not normally distributed (Gall, Gall & Borg, 2007).
Therefore, a Mann-Whitney U test was conducted to test the first null hypothesis (see Table 15
and Figures 6 and 7). MES-W scores for female teachers (M=59.2, SD=8.4) were greater than
those for their male counterparts. High school teachers had the highest MES-W scores,
followed by kindergarten teachers, and then middle school teachers. These data yielded
different results than a previous study conducted by Martin (2006), which indicated that
elementary teachers displayed higher motivation and engagement ratings on the MES-W than
secondary level teachers. Martin’s (2006) study also indicated that teachers’ confidence in the
subject matter increased motivation and engagement.
According to the information gathered in a thorough review of the literature, there were
three broad areas related to motivation and engagement: autonomy, competency, and

110
relatedness (Ainley, 2004; Demir, 2011; Towndrow, et al., 2008; Ryan & Deci, 2000;
Zimmerman, 1990). The MES-W measured a variety of traits of motivation and engagement,
such as persistence, self-belief, and control. Self-belief, as defined by Martin (2012), is related
to self-efficacy, a term most often used in the literature. These measures were consistent with
the review of literature, which identified the traits and dispositions associated with high levels
of motivation and engagement. Ainley (2004) suggested that the cognitive connections of
self-belief and control provide the impetus for motivation and engagement. The data collected
were consistent with the research of Liem and Martin (2012), which indicated a strong
relationship between self-efficacy and success.
Induction level teachers (1- 4 years of experience) scored at a higher mean score
(M=60.0, SD=4.5) than veteran (5 or more years) teachers (M=58.8, SD=9.8). These data
further corroborated the previous research, which determined that teacher attrition was
affected by disengagement of teachers (Bae, et al., 2013; Birchinall, 2013; Hadjioannou &
Hutchinson, 2014; Sherab, 2013; Soong, 2012). Teacher attrition rates indicated that many
teachers leave the profession after four years (NCTAF, 2015; Williams, 2015). Demir (2011)
cited that disengagement was a chief cause of teacher attrition. The data showed that there
were no statistically significant differences in the scores for the two groups of teachers.
These data were not consistent with other studies of teacher motivation and
engagement as they relate to teacher attrition (Demir, 2011; Jesus & Lens, 2005; Sargent &
Hannum, 2005). In fact, previous data showed that teachers who displayed higher levels of
motivation and engagement had a deeper task commitment regardless of years teaching in the
classroom (Gentry et al., 2011).
The results of the Mann Whitney U test showed no statistically significant difference in

111
the mean rank MES scores between teachers with less than five years of experience (mean
rank = 79.8) and teachers with five or more years in the profession (mean rank = 81.3). The
null hypothesis was accepted. However, it should be noted that the unequal group sizes might
have accounted for no significant difference.
Research Question Two
For induction level teachers (first four years), is there a statistically significant
relationship between teachers’ motivation and engagement, as measured by the MES-W (Martin,
2012), and the results on the TAPS overall score of the Teacher Keys Effectiveness System
(TKES) formative evaluation?
The second research question called for the investigation of the relationship between
induction (first four years) level teachers’ motivation and engagement levels as measured by
the MES-Wand the overall score on the TAPS portion of the TKES (2013). The Teacher
Keys Effectiveness System provided a numerical score based on the ratings on the summative
evaluation. The 10 standards for the TKES ranged from instructional planning to
professionalism and communication. The lowest overall score among the induction level (first
four years) teachers (n = 35) was 12. This rating placed the teacher in Level II (Needs
Development).
The lowest score on the MES-W for the induction level (first four years) teachers was
41. Findings derived from the statistical analyses of the TKES overall scores and the MES-W
Score were consistent with findings of Ainley (2004), Demir (2011), Dufour, et al. (2010), and
Zepke and Leach (2010), whose research centered on the impact of the cognitive investment in
learning. Teachers who are more cognitively engaged in a professional learning community
exhibited strong, positive relationships with their peers (Dufour et al., 2010; Durksen &

112
Klassen, 2012; Hermansen & Nerland, 2014; Lunenburg, 2010). Additionally, research
indicated that cognitive engagement created collaborative and active learning among teachers
(Dufour et al., 2010; Durksen & Klassen, 2012; Hermansen & Nerland, 2014; Zepke & Leach,
2010).
While induction level teachers had lower scores on the TKES summative evaluation
compared to the veteran level teachers the difference was not statistically significant. This
score is also reflected in the state of Georgia overall scores for 2014-2015 (Georgia
Department of Education, 2014). Induction level teachers face significant challenges as new
teachers. In fact, according to The National Commission on Teaching and America’s Future
(NCTAF, 2015), almost half of new teachers will leave the profession within the first five
years.
These data were not consistent with the review of the literature, particularly research
targeting teachers who provided better management of the classroom and were found to be
more engaged and operated more efficiently to improve student academic engagement (Chait,
2009; Martin, 2009; Stronge, 2007). Teacher education programs and professional learning do
not always provide teachers with the foundational skills and knowledge to manage the
classroom environment (Archambault, Pagan, & Fitzpatrick, 2012; Demir, 2011; Gentry,
Steenbergen-Hu, & Choi, 2011; Song, et al, 2014). There is limited exposure to professional
learning communities for induction level teachers (Dufour et al., 2010; Durksen & Klassen,
2012; Hermansen & Nerland, 2014; Lunenburg, 2010). Evidence from classroom
observations through the TKES research indicated that a positive learning environment is
conducive to engagement. Induction level teachers often struggle with creating a positive
learning environment, as the skills necessary to do so are often experiential in nature (Dufour

113
et al., 2010; Durksen & Klassen, 2012; Hermansen & Nerland, 2014; Lunenburg, 2010).
Based on the Spearman’s rho correlation (see Table 20), the null hypothesis failed to be
rejected, as for induction level teachers (first four years), there was no statistically significant
relationship between teachers’ motivation and engagement as measured by the MES-W survey
(Martin, 2012) and their TAPS overall scores.
The TAPS overall scores resulted in a summative scoring range to determine the level
of proficiency. Table 32 provides clarification of the range of scores for the proficiency
ratings as discussed in the instrumentation section and the literature review. Teachers with an
overall score of ≤ 16 would be considered as needing development or ineffective (TKES,
2013).
Table 32
TAPS Summative Cut Scores (TKES, 2013)
Final Rating Level Descriptor TAPS Summative Cut Scores
Level I Ineffective 0 - 6
Level II Needs Development 7 – 16
Level III Proficient 17 – 26
Level IV Exemplary 27 - 30
Research Question Three
For veteran level teachers (five or more years), is there a statistically significant
relationship between teachers’ motivation and engagement, as measured by the MES-W, and the
results on the TAPS overall score portion of the Teacher Keys Effectiveness System (TKES)
formative evaluation?

114
The third research question investigated the relationship between veteran teachers’ (five
or more years of experience) level of motivation and engagement as measured by the MES-
Wand the TAPS overall Scores on the TKES (2013). Previous research (Bryk, 2009; Chait,
2010; Eppley, 2009; Fullan, 2010; Katz, Assor, & Kanat-Maymon, 2008; Martin 2009; Miles
& Frank, 2008; Pintrich & Schunk, 2002; Shannon, 2009; Whitcomb & Rose, 2008; Wilson,
2009) indicated that at the five-year mark, a large number of teachers leave the profession.
For veteran teachers, there was no statistically significant relationship between teachers’
motivation and engagement, as measured by the MES-W scores and the TKES overall scores.
Controlling for only veteran teachers, the Spearman rho correlation (r) was significant but
weak between professional knowledge and MES-W scores. Previous research, which
supported this analysis, indicated that motivation and engagement were increased through self-
directed learning (Demir, 2011; Liem & Martin, 2011; Martin & Hau, 2010; Song et al.,
2014). Motivated and engaged veteran teachers sought to improve pedagogy through higher
education and professional learning (Martin & Hau, 2010; Song, et al., 2014). Additionally,
according to previous research, teachers who self-perceived high ability levels in instructional
strategies or classroom management also reported higher levels of motivation and engagement
(Ahmed, 2011; Cardelle-Elawar & Sanz de Acedo Lizarragam, 2010; Kuter, Frenzel, Nagy,
Baumert, & Pekrun, 2011; Yilmaz, 2011). There was no statistically significant relationship
between the motivation and engagement levels of veteran teachers as measured by the MES-W
and the overall score on the TAPS portion of the TKES. Therefore, the null hypothesis (H03)
was accepted.

115
Research Question Four
While controlling for the overall score on the TAPS portion of the TKES, is there a
statistically significant difference in the level of motivation and engagement level, as measured
by the MES-W (Martin, 2012), between induction level teachers (first four years) and veteran
level teachers (five or more years)?
The fourth research question investigated the relationship between the motivation and
engagement levels of induction (first four years) level teachers and veteran (five or more years)
level teachers as measured by the MES-W while controlling for the predictor variables of the
overall score on the TAPS portion of the TKES (2013). While the data from the TKES for
veteran teachers did have a slightly higher mean score, there was no statistically significant
difference to indicate that the years of experience explained the variances in scores.
According to previous research, job satisfaction is greatly affected by teacher motivation
and engagement (Demir, 2011; Jesus & Lens, 2005; Sargent & Hannum, 2005). In fact, several
research studies indicated that teachers who display task commitment and critical thinking skills
are more motivated and engaged despite the number of years of teaching experience in the
classroom. These data were consistent with the current research study.
Additionally, research indicates that teachers who have high levels of self-efficacy
display higher levels of motivation and engagement (Demir, 2011; Liem & Martin, 2011; Martin
& Hau, 2010; Song, Kim, Chai, & Bae, 2014). The findings in the current research study were
not consistent with the review of the literature. Veteran teachers showed no significant
difference in motivation and engagement levels than induction teachers, despite the fact that
veteran teachers had opportunities to improve their own pedagogy through graduate degrees or
116
high quality professional learning (Demir, 2011; Liem & Martin, 2011; Martin & Hau, 2010;
Song, Kim, Chai, & Bae, 2014).
To further dispute previous research investigated through the review of literature, there
was no statistically significant relationship between the effectiveness of veteran level or
induction level teachers, according to the data collected on the TKES overall score (Akey, 2006;
Bryk, 2009; Chait, 2010; Cho, Xu, & Rhodes, 2010; Demir, 2011; Eppley, 2009; Fullan, 2010;
Katz, Assor, & Kanat-Maymon, 2008; Martin, 2009; Miles & Frank, 2008; Pintrich & Schunk,
2002; Shannon, 2009; Whitcomb & Rose, 2008; Wilson, 2009). Conversely, Kroth (2007)
postulated that beginning teachers lacked the proper preparation and skills to be highly effective
within the first few years. Predominantly, research from the National Commission on Teaching
and America’s Future (NCTAF, 2015) indicates that teachers leave the profession due to the
pressure of current evaluation systems. Since the TKES has only currently been implemented
across the state of Georgia, there is little empirical research to substantiate or refute its effect on
teacher attrition.
Discussion of the Results
This research study provided a plethora of information about motivation and engagement,
particularly in regards to the review of previous literature. The theoretical framework for this
study was the Self-Determination Theory (SDT), which postulates that human beings are
autonomy-oriented. The underlying premise of SDT is the volitional behaviors found in human
beings: the need for autonomy, competence, and relatedness (Darity, 2008; Deci & Ryan, 2000).
The major conclusion of this study indicated that there is no statistically significant difference
between the motivation and engagement as measured by the MES-W for induction level teachers
(1 - 4 years of experience) and the veteran level teachers (5 or more years). The statistical
117
analyses yielded several findings that corroborated previous research. Conversely, various
aspects of the research findings were not consistent with previous research.
Findings from the literature review revealed a gap in the literature concerning teacher
experience levels and teacher attrition, which suggested that teachers are leaving the profession
prematurely (Bryk, 2009; Chait, 2010; Eppley, 2009; Fullan, 2010; Katz, Assor, & Kanat-
Maymon, 2008; Martin, 2009; Miles & Frank, 2008; Pintrich & Schunk, 2002; Shannon, 2009;
Whitcomb & Rose, 2008; Wilson, 2009). Additionally, teacher attrition is costly to the states
and nation (Akey, 2006; Cho, Xu, & Rhodes, 2010; Demir, 2011). With a retention rate of only
74%, teachers leave the profession at an alarming rate. The motivation and engagement levels of
teachers were measured to determine if this is a mitigating factor in teachers leaving the
profession. The results from the current research could not substantiate that the level of
motivation and engagement impact teacher effectiveness of either induction or veteran teachers.
However, the TKES has only been implemented throughout the state of Georgia for one full
school term. There was little empirical research to indicate that the overall score on the TKES
provided a true measure of teacher effectiveness.
Interestingly enough, external rewards, which traditionally are used by school leaders to
improve the motivation and engagement level of teachers, do not work (Demir, 2011; Deci,
Koestner, & Ryan, 2001; Pink, 2009; Redding & Walberg, 2012). In the same vein, reward and
punishment have not been shown to have long-term effects on improving motivation and
engagement (Pink, 2009; Redding and Walberg, 2012).
Traditional evaluation systems for teachers tended to be linear in nature yielding a
“satisfactory” or “unsatisfactory” rating that provided very little in terms of growth, engagement,
improvement, or professional development. The Teacher Keys Effectiveness System (TKES,

118
2013) provides a tool to evaluate teacher effectiveness; however, there was a limiting factor of
the new implementation during the 2014-2015 school year for all school districts (GDOE, 2015).
With almost 150,000 teachers employed in the state of Georgia, the task of implementing and
supporting a new evaluation system provided a challenge to the administrators and district
leaders (GDOE, 2015).
The data collected from the MES-W survey and the TKES also provided information
about teachers’ motivation and engagement levels in light of the newly implemented evaluation
system in the school districts and state. The main purpose of the research study was to determine
if the motivation and engagement of teachers as measured by the MES-W was correlated to a
teacher’s experience level and the overall scores on the TKES. Although the data collected did
not ultimately show a significant relationship among the three variables, it did provide insight
into teacher motivation and engagement and connected to previous empirical research literature
(Archambault, Pagan, & Fitzpatrick, 2012; Bae, et al., 2013; Birchinall, 2013; Demir, 2011;
Gentry, Steenbergen-Hu, & Choi, 2011; Hadjioannou & Hutchinson, 2014; Sherab, 2013; Song,
et al., 2014; Soong, 2012;). For example, the TKES has only been utilized to measure teacher
effectiveness statewide for one year. The 10 performance standards are rigorous and
challenging, yet most of the research study participants scored at the proficient (Level III) level.
The administrators who conducted the TKES evaluations were also at the novice level in using
the new instruments. Statewide, the data collected for the first year of implementation indicated
that 98% of the teachers scored at Level III (proficient). As administrators become more
experienced, there may be more variance in the TKES overall scores. The MES-W yielded data
about the motivation and engagement levels of the participants; however, the data could be used
to develop professional learning that targets improving teacher effectiveness. Additionally, a

119
thorough review of the literature provided research into teacher effectiveness, motivation, and
engagement that could be included in professional learning for teachers and administrators.
Implications
The implications for this research study allowed further discussion about the role
motivation and engagement play in the effectiveness of teachers. Induction level (first four
years) teachers enter the profession with limited experience as an educational professional
(Baron, 2006; Brown & Adler, 2008; Collins & Halverson, 2009; Liberman & Pointer, 2010). In
fact, the gap in the literature revealed the need to conduct further research about motivation and
engagement, particularly to examine the effects on self-efficacy, relational learning, and
autonomy (Ainley, 2004; Demir, 2011; Towndrow, et al., 2008; Zimmerman, 1990).
In light of the new evaluation system in Georgia, the research study data could prove to
have positive implications for the continued implementation of the TKES (2013). Through a
commitment from the Georgia Legislature and Georgia Department of Education and a very
large Federal grant (Race to the Top), the Teacher Keys Effectiveness System evaluation system
was developed. The TKES is an evaluation system that guides administrators through a series of
performance-based assessments to improve teacher effectiveness. The TKES was designed to
measure the Teacher Assessment on Performance Standards (TAPS) through four walk-through
observations and two formative assessment evaluations. These six points of contact yielded an
overall summative assessment score. The first full implementation of the TKES was completed
during the 2014-2015 school year. Therefore, the data collected through this research study
could have implications on the continued implementation of the TKES. The statewide scores for
the TKES fell within the same range as the sample population (N = 161), with a median overall
score of 21.11. One mitigating factor for the TKES overall score is the fidelity in the

120
implementation, as it would affect the overall scores for the TAPS. A by-product of the TKES
implementation could be a concern over the fidelity of the scoring. Administrators and teachers
experienced unprecedented change with the implementation of the new evaluation system. A
motivated and engaged workforce would be a positive influence on the TKES overall scores.
The MES-W (Martin, 2012), a validated instrument, was specifically chosen to provide
data concerning teachers’ own perceptions about their levels of motivation and engagement.
Additionally, the MES-W was easily accessible and distributed to the participants in an ethical
and confidential way. Although the MES-W has been validated and widely used in Australia,
New Zealand, Europe, and Asia, it has not been widely used in the United States. The
implication is that the MES-W could provide school administrators with the data to improve the
motivation and engagement level of teachers within the state.
Limitations
As in most research studies, the potential for the limitations to affect the data collection
and analyses existed. In fact, Warner (2013) presented a limitation of the correlational design,
which was that no causal inferences should be made, which could be a threat to internal validity.
In other words, the researcher should not make assumptions about causality since it cannot be
determined in a correlational quantitative research study. The correlational design is limited to
making only predictions or possible significant relationships. Therefore, the research data could
not determine that the predictor variables of the TKES overall scores nor the teachers’
experience levels caused higher levels of motivation and engagement as measured by the MES-
W (Martin, 2012).
Additionally Gall, Gall, and Borg (2007) determined that the sample size in a research
study may not translate to the entire population. Of the initial participants (N = 161) on the

121
MES-W (Martin, 2012), only about 21.7% were induction level (first four years of teaching).
According to data supplied by the Georgia Department of Education (GDOE, 2015) and the
Georgia Partnership for Excellence in Education (GPEE, 2015), the attrition rate in Georgia is
about 74%. This meant that about 26% of the teachers in Georgia in a given school year would
be at the induction level. Further investigation into this particular limitation could possibly be
explained by the economy over the past eight years. The four school districts targeted in the
study are small and rural. The austerity reductions placed on the districts could have presented a
hiring freeze, thus limiting the number of induction level teachers (first four years). This
limitation should be investigated in a future study to determine if, in fact, the economy and
austerity reductions influenced the low number of induction level participants. There was also a
slight threat to external validity because the sample groups (induction level n = 35; veteran level
n = 126) were not randomized. The threat was mitigated since the MES-W was distributed to all
teachers in the four school districts (N = 1023) and teachers elected whether or not to participate.
Sixty-two participants had to be eliminated from further study because there were not
corresponding TKES overall scores for the participants. The convenience sample (N = 161) was
not randomized; however, the limitation was mitigated due to the self-selection process (Rovai,
et al., 2013).
An additional threat to external validity is the application of the research results to the
generalized population (Gall, et al., 2007; Rovai, et al., 2013). Although the induction level
teachers (n = 35) were a small sample population and the veteran level teachers (n = 126) were a
larger sample, the findings may not be generalized to the entire population. However, according
to the National Center for Educational Statistics, nationally, 11.9% of teachers have four or less

122
years of teaching experience. The percentage of the induction level teachers (n = 35) for this
study was 21.7%, much higher than the national average (NCES, 2014).
Since the MES-W was a self-reported survey, the researcher provided clear instructions
to mitigate the limitation of confusion or misunderstanding in completing the survey online
(Gall, et al., 2007; Rovai, et al., 2013). The regression and correlational design of the research
study could have provided a limitation in that no causal inferences among the variables can be
determined (Warner, 2013). The research design provided for making assumptions about the
predictive nature of the predictor variables, but these are not conclusive of causation (Gall, et al.,
2007; Rovai, et al., 2013). The convenience group utilized for the sample population had the
potential to cause a limitation in the results; however, the researcher utilized a third party
statistician to collect the data results and redact any identifying information prior to the
researcher receiving the data set. This not only protected the anonymity of the participants but
also provided a level of privacy for the school districts involved. School district personnel
(superintendents and human resources coordinators) not only provided the Regional Educational
Service Agency (RESA) statistician with the TKES data file, they also distributed the MES-W to
the faculty members. This also helped control for any potential bias from the researcher since
there was in actuality no contact from the researcher to the participants (Warner, 2013).
Recommendations for Future Research
As with any research study, opportunities for further research emerge as the study
unfolds. One such opportunity could be a replication of the study targeting specific content areas
in relation to other content areas. One such study could be determining if there is a statistically
significant relationship between the motivation and engagement level as measured by the MES-
W score and specific content area teachers (math, science, English language arts, social studies,

123
CTAE, or special education). Additionally, using the current data collected, correlations among
the four school districts to use the data on motivation and engagement as measured by the MES-
W to predict culture or climate relationships could provide valuable information on school
improvement of climate ratings. Moderating factors such as gender or race could provide an
interesting research study, using those factors to determine any statistical significant
relationships. There would need to be additional data collected since the current study did not
gather information concerning race and there were very few male participants. A longitudinal or
perhaps a qualitative research study where the researchers interviewed participants to identify
trends, such as in a case study, would also prove very interesting.
Future research will provide additional empirical data and opportunities to continue to
discover ways to improve teaching and learning through improving motivation and engagement
of teachers. Motivation and engagement are not only quantitative measures (Martin, 2010). The
intensity of interactions and the quality of engagement tasks greatly influence job satisfaction,
task persistence, and commitment (Akey, 2006; Demir, 2011; Garcia-Reid et al., 2005; Mercer &
DeRosier, 2010). Therefore, continued research into how to capitalize on the motivation and
engagement levels of teachers to improve teacher quality and lessen teacher attrition would
benefit not only K-12 education but ultimately would increase teacher effectiveness (Akey,
2006; Bryk, 2009; Chait, 2010; Cho, Xu, & Rhodes, 2010; Demir, 2011; Eppley, 2009; Fullan,
2010; Katz, Assor, & Kanat-Maymon, 2008; Martin, 2009; Miles & Frank, 2008; Pintrich &
Schunk, 2002; Shannon, 2009; Whitcomb & Rose, 2008; Wilson, 2009).
Upon further examination of the data for both null hypotheses (H02) and (H03), there
was no danger of a Type I error for the third null hypothesis (H03). Continued research would
benefit the study to enlist a larger sample size (n = 35) for the induction level (first four years)

124
teachers in order to provide a more accurate interpretation of the second null hypothesis (H02).
Additionally, Martin (2010) has developed a variety of motivation and engagement
surveys to target specific student populations (junior high, high school, and college). It would
be interesting to conduct a qualitative research study to determine if the motivation and
engagement levels of teachers, as measured by the MES-W correlated with the motivation and
engagement levels of their students.
There is a variety of future research opportunities connected with the research data
gathered for this study and current literature concerning motivation and engagement, which
could provide valuable empirical data for teacher effectiveness. As teachers and
administrators become more familiar with the new evaluation system (TKES, 2013) and
particularly as the implementation will eventually provide a value-added score, or a Teacher
Effectiveness Measure (TEM, TKES, 2013), it is likely that motivation and engagement could
be affected. An operationalized measure, such as the MES-W could be an invaluable tool for
administrators and teachers. Delving into the culture piece paired with the continued
implications of the new teacher evaluation system (TKES, 2013) could redefine teacher
effectiveness in the state of Georgia.

125
REFERENCES
Ahmad, I. (2011). Effect of teacher efficacy beliefs on motivation. Journal of Behavioural
Sciences, 21(2), 35-46. Retrieved from
http://search.proquest.com/docview/923787254?accountid=12085
Ainley, M. (2004). What do we know about student motivation and engagement? Australian
Association for Research in Education. Retrieved from
www.aare.edu.au/04pap/ain04760.pdf
Akey, T. M. (2006). School context, student attitudes and behavior, and academic achievement:
An exploratory analysis. New York, NY: MDRC. Retrieved from
http://www.mdrc.org/publications/419/full.pdf
Adelman, H., & Taylor, L. (2011). School engagement, disengagement, learning supports, &
school climate. Los Angeles: Center for Mental Health in Schools.
Ames, C. (1990). Motivation: What teachers need to know. Teachers College Record, 91(3),
409-410. doi: 0161-4681/90/9103/409
Appleton, J. J., Christenson, S. L., & Furlong, M. J. (2008). Student engagement with school:
Critical conceptual and methodological issue of the construct. Psychology in the Schools,
45, 369–386.
Archambault, I., Pagani, L., & Fitzpatrick, C. (2012). Transactional associations between
classroom engagement and relations with teachers from first through fourth
grade. Learning and Instruction, 23, 1-9.
Ary, D., Jacobs, L. C., Razavieh, A., & Sorensen, C. (2006). Introduction to research in
education (7th ed.). Belmont, CA: Thomson Wadsworth.

126
Bae, S., Song, J., Park, S., & Kim, H. (2013). Influential factors for teachers’ creativity: Mutual
impacts of leadership, work engagement, and knowledge creation practices. Performance
Improvement Quarterly, 26(3), 33-58. Retrieved from wileyonlinelibrary.com
Balfanz, R., Herzog, L., & MacIver, D. J. (2007). Preventing student disengagement and keeping
students on the graduation path in urban middle-grades schools: Early identification and
effective interventions. Educational Psychologist, 42(4), 223-235.
Bernaus, M., & Gardner, R. (2008). Teacher motivation strategies, student perceptions, student
motivation and English achievement. The Modern Language Journal, 92(3), 387-401.
Berti, C., Molinari, L., & Speltini, G. (2010). Classroom justice and psychological engagement:
Students' and teachers' representations. Social Psychological Education, 13, 541-556. doi:
10.1007/s11218-010-9128-9
Birchinall, L. (2013). Case study of trainee teachers’ responses to the impact on engagement and
motivation in learning through a model of cross-curricular context-based learning:
‘Keeping fit and healthy’. Curriculum Journal, 24(1), 27-49.
Brante, G. (2008). Multitasking and synchronous work: Complexities in teacher work. Teaching
and Teacher Education, 25, 430-436. doi: 10.1016/j.tate.2008.09.015
Brown, J. S., & Adler, R. P. (2008). Minds on fire: Open education, the long tail, and learning
2.0. Educause Review, January/February, 17–32.
Bryson, C., & Hand, L. (2007). The role of engagement in inspiring teaching and learning,
Innovations in Education and Teaching International 44(4): 349–362.
Bryk, A. (2009). Support a science of performance improvement. Phi Delta Kappan, 90(08),
597-600.

127
Cardelle-Elawar, M., Sanz de Acedo Lizarraga, M., &, (2010). Looking at teacher identity
through self-regulation. Psicothema, 22(2), 293-298.
Caufield, J. (2007). What motivates students to provide feedback to teachers about teaching and
learning? An expectancy theory perspective. International Journal for the Scholarship of
Teaching and Learning, 1(1), 1-19. doi: 1931-4744
Chait, R. (2009). Center for American Progress, Ensuring effective teachers for all
students: Six state strategies for attracting and retaining effective teachers in high-
poverty and high-minority schools. Washington, DC: American Progress.
Chait, R., & Miller, R. (2010). Treating different teachers differently. Center for American
Progress, 1-19.
Cho, S., Xu, Y., & Rhodes, J. A. (2010). Examining English language learners' motivation and
engagement in reading: A qualitative study. Reading Matrix: An International Online
Journal, 10(2), 205-221. Retrieved from
http://search.ebscohost.com.ezproxy.liberty.edu:2048
/login.aspx?direct=true&db=ehh&AN=55293184&site=ehost-live&scope=site
Cohen, J. (1992). A power primer. Psychological Bulletin, 112, 155-159.
Collins, A., & Halverson, R. (2009). Rethinking education in the age of technology: The digital
revolution and schooling in America. New York, NY: Teachers College Press.
Conley, A. M., & Karabenick, S. A. (2006, March). Construct validity issues in the measurement
of motivation to learn. Presentation delivered at the biennial meeting of the Society for
Research on Adolescence Math and Science Partnership - Motivation Assessment
Program (MSP-MAP), San Francisco, CA.

128
Corrigan, M. W., & Chapman, P. E. (2008). Trust in teachers: A motivating element to learning.
Radical Pedagogy, 1-8. doi: 1524-6345
Darity, W. A. (2008). Self-determination theory. International Encyclopedia of the Social
Sciences, 7(2), 407-408
Darling-Hammond, L. (1997). Doing what matters most: Investing in quality teaching. New
York, NY: National Commission on Teaching & America's Future.
Demir, K. (2011). Teachers' intrinsic and extrinsic motivation as predictors of student
engagement. e-Journal of New World Sciences Academy, 6(2), 1397-1409.
Deci, E. L., Koestner, R., & Ryan, R. M. (2001). Extrinsic rewards and intrinsic motivation in
education: Reconsidered once again. Review of Educational Research, 71(1), 1-27.
DuFour, R., DuFour, R., Eaker, R., & Many, T. (2006). Learning by doing: A handbook for
professional learning communities at work. Bloomington, IN: Solution Tree.
Dunn, K. E., & Rakes, G. C. (2011). Teaching teachers: An investigation of beliefs in teacher
education students. Learning Environment Resources, 14, 39-58. doi: 10.1007/s10984-
011-9083-1
Durksen, T., & Klassen, R. (2012). Pre-service teachers' weekly commitment and engagement
during a final training placement: A longitudinal mixed methods study. Educational &
Child Psychology, 29(4), 32-46.
Eccles, J., & Wigfield, A. (2002). Motivational beliefs, values, and goals. Annual Review of
Psychology, 53, 109-132.
Eppley, K. (2009). Rural schools and the highly qualified teacher provision of No Child Left
Behind: A critical policy analysis. Journal of Research in Rural Education, 24(4), 1-
11.

129
Eyal, O., & Roth, G. (2010). Principals' leadership and teachers' motivation: Self-determination
theory analysis. Journal of Educational Administration, 49(3), 256-275.
Fullan, M. (2010). Motion leadership. Thousand Oaks, CA: Corwin Press.
Gall, M. D., Gall, J., P., & Borg, W. R. (2007). Educational research (8th ed.). Boston,
MA: Allyn and Bacon.
Garcia-Reid, P., Reid, R., & Peterson, N. A. (2005). School engagement among Latino youth in
an urban middle school context: Valuing the role of social support. Education and Urban
Society, 37(3), 257–275.
Gentry, M., Steenbergen-Hu, S., & Choi, B. (2011). Student-identified exemplary teachers:
Insights from talented teachers. Gifted Child Quarterly, 55(2), 111-125. doi:
10.1177/0016986210397830
Georgia Department of Education. (2013). Teacher keys evaluation system (TKES).
Georgia Department of Education. (2015). Teacher equity and effectiveness.
Georgia Professional Standards Commission. (2006). Interim status report: The Georgia
educator workforce 2006. Division for Educator Workforce Recruitment, Research and
Development. Retrieved from http://www.gapsc.com/Workforce/2006_Report/2006
Gewertz, C. (2006). High school dropouts say lack of motivation top reason to quit. Education
Week, 25(26), 1.
Green, J., Martin, A. J., & Marsh, H. W. (2007). Motivation and engagement in English,
mathematics, and science high school subjects: Towards an understanding of
multidimensional domain specificity. Science Direct: Learning and Individual
Differences, 17, 269-279. doi: 10.1016/j.lindif.2006.12.003

130
Green, J., Nelson, G., Martin, A., & Marsh, H. (2006). The causal ordering of self-concept and
academic motivation and its effect on academic achievement. International Educational
Journal, 7(4), 534-546.
Hadjioannou, X., & Hutchinson, M. (2014). Fostering awareness through transmediation:
Preparing pre-service teachers for critical engagement with multicultural literature.
International Journal of Multicultural Education, 16(1), 1-20.
Hardré, P. L., & Sullivan, D. W. (2009). Motivating adolescents: High school teachers'
perceptions and classroom practices. Teacher Development, 13(1), 1-16. doi:
10.1080/13664530902858469
Harris, L. (2010). Secondary teachers' conceptions of student engagement: Engagement in
learning or in schooling. Teacher and Teacher Education, 27, 376-386.
Hart, S., Stewart, K., & Jimerson, S. (2011). The student engagement in schools questionnaire
(SESQ) and the teacher engagement report form-new (TERF-N): Examining the
preliminary evidence. Contemporary School Psychology, 15, 67-79.
Hattie, J. A. C. (2009). Visible learning: A synthesis of meta-analyses relating to achievement.
New York, NY: Routledge.
Hermansen, H., & Nerland, M. (2014). Reworking practice through an AfL project: An analysis
of teachers’ collaborative engagement with new assessment guidelines. British
Educational Research Journal, 40(1), 187-206.
Hockings C., Cooke S., Yamashita H., McGinty, S., & Bowl, M. (2008). Switched off? A study
of disengagement among computing students at two universities. Research Papers in
Education 23(2): 191–201.
Hoigaard, R., Giske, R., & Sundsli, K. (2012). Newly qualified teachers’ work engagement and

131
teacher efficacy influences on job satisfaction, burnout, and the intention to quit.
European Journal of Teacher Education, 35(3), 347-357.
Holt, J. H. (2012). The relationship between beginning teachers' engagement with induction
program components and student achievement. (Doctoral dissertation, Western
Carolina University). Retrieved from
http://search.proquest.com/docview/924797292?accountid=12085. (924797292)
Howell, D. C. (2011). Fundamental statistics for the behavioral sciences. (7th ed.). Belmont, CA:
Centage Learning.
Hsu, L. (2010). The impact of perceived teachers' nonverbal immediacy on students' motivation
for learning English. Asian EFL Journal, 12(4), 1-17.
Hu, S., Kuh, D., & Li, S. (2008). The effects of engagement in inquiry-oriented activities on
student learning and personal development. Innovations in Higher Education, 33, 71-81.
doi: 10.1007/s10755-008-9066z
Hufton, N. R., Elliott, J. G., & Illushin, L. (2002). Educational motivation and engagement:
Qualitative accounts from three countries. British Educational Research Journal, 28(2),
265-289.
Jang, H. (2008). Supporting students' motivation, engagement and learning during an
uninteresting activity. Journal of Educational Psychology, 100(4), 798-811. doi:
10.1037/a0012841
Jesus, S. N. & Lens, W. (2005). An integrated model for the study of teacher motivation. Applied
Psychology: An International Review, 54(1), 119-134.
Johnson, L. (2008). Relationship of instructional methods to student engagement in two public
high schools. American Secondary Education, 36(2), 69-87.

132
Kabilan, M., & Kamaruddin, F. (2010). Engaging learners' comprehension, interest, and
motivation to learn literature using the reader's theatre. English Teaching: Practice and
Critique, 9(3), 132-159.
Katz, I., Assor, A., & Kanat-Maymon, Y. (2008). A projective assessment of autonomous
motivation in children: Correlational and experimental evidence. Motivation Emotion, 32,
109-119. doi: 10.1007/s11031-008-9086-0
Kearsley, G., & Shneiderman, B. (1999). Engagement theory: A framework for technology-
based teaching and learning. Retrieved from
http://home.sprynet.com/~gkearsley/engage.htm
Klassen, R. M., Perry, N. E., & Frenzel, A. C. (2012). Teachers' relatedness with students: An
underemphasized component of teachers' basic psychological needs. Journal of
Educational Psychology, 104(1), 150-165. doi: 10.1037/a0026253
Klem, A. M., & Connell, J. P. (2004). Relationships matter: Linking teacher support to student
engagement and achievement. The Journal of School Health, 74(7), 262-73. Retrieved
from http://search.proquest.com/docview/215675398?accountid=12085
Kriesel, W. Cooperative Extension Service, Georgia County Guide. (2012). Georgia statistic
system. Retrieved from: http://www.georgiastats.uga.edu/guide.html
Kroth, M. (2007). Maslow-move aside! A heuristical motivation model for leaders in career and
technical education. Journal of Industrial Teacher Education, 44(2), 5-36.
Kubanyiova, M. (2006). Developing a motivational teaching practice in EFL teachers in
Slovakia: Challenges of promoting teacher change in elf contexts. TESL-EJ, 10(2), 1-17.
Kuh, G. D. (2007). What student engagement data tell us about college readiness. AACU Peer
Review, Winter (2007), 4-8.

133
Kunter, M., Frenzel, A., Nagy, G., Baumert, J., & Pekrun, R. (2011). Teacher enthusiasm:
Dimensionality and context specificity. Contemporary Educational Psychology, 36, 289-
301.
Kurz, B., & Knight, S. L. (2003). An exploration of the relationship among teacher efficacy,
collective teacher efficacy, and goal consensus. Learning Environment Research, 7, 111-
128.
Leim, G., & Martin, A. J. (2011). The motivation and engagement scale: Theoretical framework,
psychometric properties, and applied yields. Australian Psychologist, 47, 3-13. doi:
10.1111/j.1742-9544.2011.00049
Lewandowski, K. (2005). A study of the relationship of teachers’ self-efficacy and the impact of
leadership and professional development (Doctoral dissertation). Retrieved from
http://digitalcommons.liberty.edu.
Lieberman, A., & Pointer-Mace, D. (2010). Making practice public: Teacher learning in the 21st
century. Journal of Teacher Education 6(1): 77-88.
Lunenburg, F. (2010). Creating a professional learning community. National Forum of
Educational Administration and Supervision Journal, 27(4), 1-7.
Mansfield, C. F., & Volet, S. E. (2010). Developing beliefs about classroom motivation:
Journeys of preservice teachers. Teacher and Teacher Education, 26, 1404-1415.
Marinak, B., & Gambrell, L. (2008). Intrinsic motivation and rewards: What sustains young
children's engagement with text? Research and Instruction, 47(1), 9-26.
Martin, A. J. (2005). Exploring the effects of a youth enrichment program on academic
motivation and engagement. Social Psychology of Education, 8, 179-206. doi:
10.1007/s11218-004-6487-0

134
Martin, A. J. (2006). The relationship between teachers' perceptions of student motivation and
engagement and teachers' enjoyment of and confidence in teaching. Asia-Pacific Journal
of Teacher Education, 34(1), 73-93.
Martin, A. J. (2009). Motivation and engagement across the academic life span: A
developmental construct validity study of elementary school, high school and
university/college students. Educational and Psychological Measurement, 69(5), 794-
824. doi: 10.1177/0013164409332214
Martin, A. J. (2009). Motivation and engagement in the workplace: Examining a
multidimensional framework from a measurement and evaluation perspective.
Measurement and Evaluation in Counseling and Development, 41, 223-243.
Martin, A. J. (2012). The motivation and engagement scale (12th ed.). Sydney, Australia:
Lifelong Achievement Group.
Martin, A. J., & Hau, K. (2010). Achievement motivation among Chinese and Australian school
students: Assessing differences of kind and differences of degree. International Journal
of Testing, 10, 274-294.
Mearns, K., Meyer, J., & Bharadwaj, A. (2007). Student engagement in human biology practical
sessions. Refereed paper presented at the Teaching and Learning Forum, Curtin
University of Technology: New Zealand, January.
Medley, N., Little, S., & Akin-Little, A. (2007). Comparing individual behavior plans from
schools with and without school wide positive behavior support: a preliminary
study. Journal of Behavioral Education, 17(1), 93-110. doi: 10.1007/s10864-007-9053-y

135
Mercer, S. H., & DeRosier, M. E. (2010). A prospective investigation of teacher preference and
children's perceptions of the student-teacher relationship. Psychology in the Schools,
47(2), 184-192. doi: 10.1002/pits.20463
Miles, K. & Frank, S. (2008). The strategic school: Making the most of people, time, and
money. Thousands Oaks, CA: Corwin Press.
National Center for Education Statistics. (2014). Schools and Staffing Survey (SASS), Public
School Teacher Data File.Washington, DC: U.S. Department of Education.
National Commission on Teaching and America’s Future. (2015). The cost of teacher turnover
study and cost calculator. Retrieved from http://nctaf.org/teacher-turnover-cost-
calculator/the-cost-of-teacher-turnover-study-and-cost-calculator/
O'Keefe, J. (2000). Research on teacher recruitment and retention. Catholic Education 3(4),
533-539.
Parkin, H. J., Hepplestone, S., Holden, G., Irwin, B., & Thorpe, L. (2012). A role for technology
in enhancing students' engagement with feedback. Assessment and Evaluation in Higher
Education, 37(8), 963-973.
Patrick, H., Ryan, A., Kaplan, A. (2007). Early adolescents’ perceptions of the social
environment, motivational beliefs, and engagement. Journal of Educational Psychology,
99(1), 83-98. doi: 10.1037/0022-0663.99.1.83
Pink, D. (2009). Drive: The surprising truth about what motivates us. New York, NY: Riverhead
Books by Penguin Publishing.

136
Pintrich, P. R. (2000). An achievement goal theory perspective on issues of motivation
terminology, theory, and research. Contemporary Educational Psychology, 25, 92-104.
doi: 10.1006/ceps.1999.1017
Pintrich, P. R., & Schunk, D. H. (2002). Motivation in education: Theory, research, and
Applications (2nd ed.). Columbus, OH: Merrill-Prentice Hall.
Pugh, K., Linnenbrink-Garcia, L., Koskey, K., Stewart, V., & Manzey, C. (2009). Motivation,
learning, and transformative experience: A study of deep engagement in science. Wiley
Interscience, 1-29. doi: 10.1002/sce.20344
Ravitch, D. (2003). U.S. Department of Education, White House Conference on Preparing
Tomorrow's Teachers. A brief history of teacher professionalism. Washington, DC:
Government Printing Office.
Redding, S., & Walberg, H. J. (2012). U.S. Dept. of Education, Academic Development
Institute. Promoting learning in rural schools. Lincoln, NE: Center on Innovation and
Improvement.
Rigby, C. S., Deci, E. L., Patrick, B. C., & Ryan, R. M. (1992). Beyond the intrinsic-extrinsic
dichotomy: Self-determination in motivation and learning. Motivation and Emotion, 16(3),
165-185.
Rovai, A. P., Baker, J. D., & Ponton, M. K. (2013). Social science research design and statistics:
A practitioner's guide to research methods and SPSS analysis. Chesapeake, VA:
Waterpress.
Ryan, A., & Patrick, H. (2001). The classroom social environment and changes in adolescents’
motivation and engagement during middle school. American Educational Research
Journal, 38(2), 437-460. doi:10.3102/00028312038002437

137
Ryan, R. M., & Deci, E. L. (2000). Self-determination theory and the facilitation of intrinsic
motivation, social development, and well being. American Psychologist, 55(1), 68-78. doi:
10.1037110003-066X.55.1.68Sargent, T., & Hannum, E. (2005). Keeping teachers happy:
Job satisfaction among primary school teachers in rural northwest China. Comparative
Education Review, 49(2), 173-204.
Shannon, P. (2007). Reading against democracy: The broken promises of reading instruction.
Portsmouth, NH: Heinemann.
Sherab, K. (2013). Strategies for encouraging behavioural and cognitive engagement of pre-
service student-teachers in Bhutan: An action research case study. Educational Action
Research, 21(2), 164-184.
Skaalvik, E. M., & Skaalvik, S. (2010). Teacher self-efficacy and teacher burnout: A study of
relations. Teaching and Teacher Education, 26, 1059-1069.
Song, J., Kim, W., Chai, D., & Bae, S. (2014). The impact of an innovative school climate on
teachers’ knowledge creation activities in Korean schools: The mediating role of teachers’
knowledge sharing and work engagement. Journal of Educational Policy, 11(2), 179-203.
Retrieved from http://eng.kedi.re.kr
Soong, H. (2013). Why volunteer? The complexities of international pre-service teachers’
intercultural adjustment experiences through community service engagement. Asia-Pacific
Journal of Teacher Education, 41(1), 69-83.
Split, J. L., Koomen, H. M. Y., & Thijs, J. T. (2011). Teacher wellbeing: The importance of
teacher-student relationships. Educational Psychology Review, 23, 457-477. doi:
10.1007/s10648-011-9170-y

138
Strom, P., Strom, R., & Wing, C. (2009). Adolescent learning and the internet: Implications for
school leadership and student engagement in learning. NASSP Bulletin, 93(2), 111-121.
Tabachnick, B. G., & Fidell, L. S. (2007). Using multivariate statistics (5th ed.). Boston,
MA: Allyn and Bacon.
Towndrow, P. A., Koh, C., & Hock Soon, T. (2008). Motivation and practice for the classroom.
Rotterdam, The Netherlands: Sense Publishers.
Trilling, B. (2010). Leading learning in our times. Principal, 89(3), 8-12.
Vallerand, R. J., Fortier, M. S., & Guay, F. (1997). Self-determination and persistence in a real-
life setting: Toward a motivational model of high school dropout. Journal of Personality
and Social Psychology, 72, 1161–1176.
Vallerand, R. J., & Ratelle, C. F. (2002). Intrinsic and extrinsic motivation: A hierarchical
model. In E. L. Deci & R. M. Ryan (Eds.), Handbook of self-determination research (pp.
37-64). Rochester, NY: University of Rochester Press.
Vygotsky, L. (1978). Mind and society: The development of higher mental processes.
Cambridge, MA: Harvard University Press.
Walker, C. O., & Greene, B. A. (2009). The relations between student motivational beliefs and
cognitive engagement in high school. The Journal of Educational Research, 102(6), 463-
471.
Warner, R. M. (2013). Applied statistics: From bivariate through multivariate techniques (2nd
ed.). Los Angeles, CA: Sage.
Whitcomb, J. A. & Rose, T. (2008). Teacher quality: What does research tell us? The
Alliance for Quality Teaching, 1(1), 5-35.
Wilson, S. (2009). National Academy of Education, Teacher Quality. Education policy white

139
paper: Teacher quality. Washington, DC: National Academy of Education.
Williams, C. (2015). Combating teacher burnout. The Education Digest, 77(7), 39-41.
Wong, H. K. (2001). There is only one way to improve student achievement. Retrieved from
www.k12atlas.com/.../6/3/.../student_achievement__harry_wong.pdf
Yilmaz, C. (2011). Teachers' perceptions of self-efficacy, English proficiency, and instructional
strategies. Social Behavior and Personality, 39(1), 91-100. doi: I0.2224/sbp.2011.39.I.91
Zhang, X., & Bartol, K. M. (2010). Linking empowering leadership and employee creativity:
The influence of psychological empowerment, intrinsic motivation and creative process
engagement. Academy of Management Journal, 53(1), 107-128.
Zepke, N., & Leach, L. (2005). Integration and adaptation: Approaches to the student retention
and achievement puzzle. Active Learning in Higher Education 6(1), 46-59.
Zimmerman, B. J. (1990). Self-regulated learning and academic achievement: An overview.
Educational Psychologist, 25(1), 3-17.

140
APPENDIX A
Motivation and Engagement Scale: Work (MES-W)
Andrew J. Martin PhD
Welcome to the Motivation and Engagement Scale - Work (MES-W). Thank you for
your participation and attention to this survey. Your responses are anonymous and will not be
used in any way except for research (a dissertation study).
This survey is to examine your motivation and engagement in the workplace. There are no right
or wrong answers. Your responses need to reflect what you really think about yourself. There are
some questions that are very similar to each other. This is not a trick, it is just the type of survey
questions to determine how you think about yourself.
Demographic information is collected for statistical purposes only. Please provide the following:
Certificate #
Teaching Position:
o K-5
o 6-8
o 9-12
o Other (Please Specify):
Subject(s) Taught:
o Math
o ELA
o Science
o Social Studies
o CTAE
o Fine Arts
o Health/PE
o Reading
o Other: _______________

Number of years you have taught:
o 1 – 3
o 4 or more
Gender:
o Male
o Female
Age: (voluntary information)
o 20 – 24
o 25 – 28
o 29 – 35
o 36 – 40
o 41 – 45
o 46
Sample Items - Motivation and Engagement Scale – Work (MES-W)
Andrew J. Martin PhD
Disagree Strongly
Disagree Disagree Somewhat
Neither Agree or Disagree
Agree Somewhat
Agree Agree Strongly
1 2 3 4 5 6 7 Please choose one number for each statement:
*The MES-W, used with permission from Lifelong Achievement Group, is not available for
reproduction.
©2012 Lifelong Achievement Group

Georgia Department of Education – TAPS Performance Standards and Rubrics
Performance Standard 1: Professional Knowledge: The teacher demonstrates an understanding of the curriculum, subject content, pedagogical knowledge, and the needs of students by providing relevant learning
Level IV In addition to meeting the requirements
for Level III
Level III Level II is the expected level
of performance
Level II Level I
The teacher continually demonstrates extensive content and pedagogical knowledge, enriches the curriculum, and guides others in enriching the curriculum. (Teachers rated as Level IV continually seek ways to serve as role models or teacher leaders.)
The teacher consistently demonstrates an understanding of the curriculum, subject content, pedagogical knowledge, and the needs of students by providing relevant learning experiences.
The teacher inconsistently demonstrates understanding of curriculum, subject content, pedagogical knowledge, and student needs, or lacks fluidity in using the knowledge in practice.
The teacher inadequately demonstrates understanding of curriculum, subject content, pedagogical knowledge and student needs, or does not use the knowledge in practice.
Performance Standard 2: Instructional Planning: The teacher plans using state and local school district curricula and standards, effective strategies, resources, and data to address the differentiated needs of all students.
Level IV In addition to meeting the requirements
for Level III
Level III Level II is the expected level
of performance
Level II Level I
The teacher continually seeks and uses multiple data and real world resources to plan differentiated instruction to meet the individual student needs and interests in order to promote student accountability and engagement. (Teachers rated as Level IV continually seek ways to serve as role models or teacher leaders.)
The teacher consistently plans using state and local school district curricula and standards, effective strategies, resources, and data to address the differentiated needs of all students.
The teacher inconsistently uses state and local school district curricula and standards, or inconsistently uses effective strategies, resources, or data in planning to meet the needs of all students.
The teacher does not plan, or plans without adequately using state and local school district curricula and standards, or without using effective strategies, resources, or data to meet the needs of all students.
Performance Standard 3: Instructional Strategies: The teacher promotes student learning by using research-based instructional strategies relevant to the content to engage students in active learning and to facilitate the students' acquisition of key knowledge and skills.
Level IV In addition to meeting the requirements
for Level III
Level III Level II is the expected level
of performance
Level II Level I
The teacher continually facilitates students' engagement in metacognitive learning, higher -order thinking skills, and application of learning in current and relevant ways. (Teachers rated as Level IV continually seek ways to serve as role models or teacher leaders.)
The teacher consistently promotes student learning by using research based instructional strategies relevant to the content to engage students in active learning, and to facilitate the students' acquisition of key skills.
The teacher inconsistently uses research-based instructional strategies. The strategies used are sometimes not appropriate for the content area or for engaging students in active learning or for the acquisition of key skills.
The teacher does not use research-based instructional strategies, nor are the instructional strategies relevant to the content area. The strategies do not engage students in active learning or acquisition of key skills.
Performance Standard 4: Differentiated Instruction: The teacher challenges and supports each student's learning by providing appropriate content and developing skills which address individual learning differences.
Level IV In addition to meeting the requirements
for Level III
Level III Level II is the expected level
of performance
Level II Level I
The teacher continually facilitates each student's opportunities to learn by engaging him/her in critical and creative thinking and challenging activities tailored to address individual learning needs and interests. (Teachers rated as Level IV continually seek ways to serve as role models or teacher leaders.)
The teacher consistently challenges and supports each student's learning by providing appropriate content and developing skills which address individual learning differences.
The teacher inconsistently challenges students by providing appropriate content or by developing skills, which address individual learning differences.
The teacher does not challenge students by providing appropriate content or by developing skills, which address individual learning differences.
Performance Standard 5: Assessment Strategies: The teacher systematically chooses a variety of diagnostic, formative, and summative assessment strategies and instruments that are valid and appropriate for the content and student population.
Level IV In addition to meeting the requirements
for Level III
Level III Level II is the expected level
of performance
Level II Level I
The teacher continually demonstrates expertise and leads others to determine and develop a variety of strategies and
instruments that are valid and appropriate for the content and student population and guides students to monitor and reflect on their own academic progress. (Teachers
rated as Level IV continually seek ways to serve as role models or teacher leaders.)
The teacher systematically and consistently chooses a
variety of diagnostic, formative, and summative assessment strategies and instruments that are valid
and appropriate for the content and student
population.
The teacher inconsistently chooses a variety of
diagnostic, formative, and summative assessment
strategies or the instruments are sometimes not appropriate
for the content or student population.
The teacher chooses an inadequate variety of
diagnostic, formative, and summative assessment
strategies or the instruments are not appropriate for the
content or student population.
Georgia Department of Education• July 1, 2013 • Page 1 of 2
All Rights Reserved
APPENDIX B

Georgia Department of Education – TAPS Performance Standards and Rubrics
Performance Standard 6: Assessment Uses: The teacher systematically gathers, analyzes, and uses relevant data to measure student progress, to inform instructional content and delivery methods, and to provide timely and constructive feedback to both students and parents.
Level IV In addition to meeting the requirements
for Level III
Level III Level II is the expected level
of performance
Level II Level I
The teacher continually demonstrates expertise in using data to measure student progress and leads others in the effective use of data to inform instructional decisions. (Teachers rated as Level IV continually seek ways to serve as role models or teacher leaders.)
The teacher systematically and consistently gathers, analyzes, and uses relevant data to measure student progress, to inform instructional content and delivery methods, and to provide timely and constructive feedback to both students and parents.
The teacher inconsistently gathers, analyzes, or uses relevant data to measure student progress, inconsistently uses data to inform instructional content and delivery methods, or inconsistently provides timely or constructive feedback.
The teacher does not gather, analyze, or use relevant data to measure student progress, to inform instructional content and delivery methods, or to provide feedback in a constructive or timely manner.
Performance Standard 7: Positive Learning Environment: The teacher provides a well managed, safe, and orderly environment that is conducive to learning and encourages respect for all.
Level IV In addition to meeting the requirements
for Level III
Level III Level II is the expected level
of performance
Level II Level I
The teacher continually engages students in a collaborative and self-directed learning environment where students are encouraged to take risks and ownership of their own learning behavior. (Teachers rated as Level IV continually seek ways to serve as role models or teacher leaders.)
The teacher consistently provides a well-managed, safe, and orderly environment that is conducive to learning and encourages respect for all.
The teacher inconsistently-provides a well-managed, safe, and orderly environment that is conducive to learning and encourages respect for all.
The teacher inadequately addresses student behavior, displays a negative attitude toward students, ignores safety standards, or does not otherwise provide an orderly environment that is conducive to learning or encourages respect for all.
Performance Standard 8: Academically Challenging Environment: The teacher creates a student-centered, academic environment in which teaching and learning occur at high levels and students are self-directed learners.
Level IV In addition to meeting the requirements
for Level III
Level III Level II is the expected level
of performance
Level II Level I
The teacher continually creates an academic learning environment where students are encouraged to set challenging learning goals and tackle challenging materials. (Teachers rated as Level IV continually seek ways to serve as role models or teacher leaders.)
The teacher consistently creates a student-centered, academic environment in which teaching and learning occur at high levels and students are self-directed learners.
The teacher inconsistently provides a student-centered, academic environment in which teaching and learning occur at high levels or where students are self-directed learners.
The teacher does not provide a student-centered, academic environment in which teaching and learning occur at high levels, or where students are self-directed learners.
Performance Standard 9: Professionalism: The teacher exhibits a commitment to professional ethics and the school’s mission, participates in professional growth opportunities to support student learning, and contributes to the profession.
Level IV In addition to meeting the requirements
for Level III
Level III Level II is the expected level
of performance
Level II Level I
The teacher continually engages in a high level of professional growth and application of skills and contributes to the development of others and the well-being of the school and community. (Teachers rated as Level IV continually seek ways to serve as role models or teacher leaders.)
The teacher consistently exhibits a commitment to professional ethics and the school's mission, participates in professional growth opportunities to support student learning, and contributes to the profession.
The teacher inconsistently supports the school's mission or seldom participates in professional growth opportunities.
The teacher inconsistently supports the school's mission or seldom participates in professional growth opportunities.
Performance Standard 10: Communication: The teacher communicates effectively with students, parents or guardians, district and school personnel, and other stakeholders n ways that enhance student learning.
Level IV In addition to meeting the requirements
for Level III
Level III Level II is the expected level
of performance
Level II Level I
The teacher continually uses communication techniques in a variety of situations to proactively inform, network, and collaborate with stakeholders to enhance student learning. (Teachers rated as Level IV continually seek ways to serve as role models or teacher leaders.)
The teacher communicates effectively and consistently with students, parents or guardians, district and school personnel, and other stakeholders in ways that enhance student learning.
The teacher inconsistently communicates with students, parents or guardians, district and school personnel, or other stakeholders or communicates in ways that only partially enhance student learning.
The teacher inadequately communicates with students, parents or guardians, district and school personnel, or other stakeholders by poorly acknowledging concerns, responding to inquiries, or encouraging involvement.
Georgia Department of Education• July 1, 2013 • Page 2 of 2
All Rights Reserved

APPENDIX C
Dear Superintendent:
I am completing a doctoral dissertation at Liberty University entitled "A Correlational Study of the
Motivation and Engagement in Teachers: Experience and Effectiveness." I am seeking permission to survey
teachers in the Pioneer RESA district. In addition, I will need access to the competency rating on the Teacher
Keys Effectiveness System (TKES) summative assessment rating for each teacher who participates in the
research study. Staff from Pioneer RESA will aid in acquiring the data to protect the identity of the
participants. No identifying information of the teachers, schools, or school systems will be utilized or
disseminated in the study. The survey will be the Motivation and Engagement Scale, created by Andrew J.
Martin, a research professor at the University of Sydney in Australia. It will be administered online, with a
numeric identifying system rather than names that will be correlated to the TKES summative assessment
rating. I believe this data will provide important insight into the motivation and engagement level of teachers
at the induction level (first four years) and veteran teachers (more than four years) in our region and predict
outcomes on the TKES. This data could prove powerful as we study why some teachers are leaving the
profession after four years. Attached you will find a brief description of the dissertation proposal and the
research questions.
The requested permission extends to any future revisions and editions of my dissertation, including non-
exclusive world rights in all languages, and to the prospective publication of my dissertation by ProQuest
through Liberty University. ProQuest may produce and sell copies of my dissertation on demand and may
make my dissertation available for free Internet download at my request.
Your signing of this letter will also confirm that you give permission for me to obtain assent and consent to
participate from your principals, teachers and parents. If these arrangements meet with your approval, please
sign this letter below. Thank you very much for your time and consideration.
Sincerely,
Cynthia A. Phillips
PERMISSION GRANTED FOR THE USE REQUESTED ABOVE:
________________________________ ______________________________________
Superintendent’s Signature School System
Date: ____________________

The Liberty University InstitutionalReview Board has approvedthis document for use from
7/15/15 to --Protocol # 2242.071515
APPENDIX D
IRB APPROVED STAMPED INFORMED CONSENT FORM
A Correlational Study of the Motivation and Engagement in Teachers: Experience
and Effectiveness
Cynthia A. Phillips Liberty University School of
Education
You are invited to be in a research study to determine if there is a relationship between
teacher motivation and engagement, years teaching experience, and the TAPS score on
the Teacher Keys Effectiveness System. You were selected as a possible participant
because you teach in a school in northeast Georgia. I ask that you read this form and ask
any questions you may have before agreeing to be in the study.
Cynthia A. Phillips, a doctoral candidate in the School of Education at Liberty University,
is conducting this study.
Background Information:
The main purpose of this study is to determine if the motivation and engagement
level of the teachers, as measured by the Motivation Engagement Scale (MES-W, 2012),
in a school directly correlate to the experience levels based on the Self-Determination
Theory (Ryan & Deci, 2000). The MES-W (2012) surveys will be divided into two
groups. The induction level consists of those with less than four years of experience, and
the veteran level consists of teachers with more than four years of experience.
Additionally, the two groups will be correlated to the TAPS score on the Teacher Keys
Effectiveness System (TKES, 2013) to determine if the triangulation of data can predict
whether motivation and engagement levels can predict teacher attrition.
The variables of interest, motivation, and engagement will be generally defined as
“the general desire or willingness of someone to do something; stimulus, incentive, or

drive” (Akey, 2006; Demir, 2004; Deci, Koestner & Ryan, 2001; Kearsley &
Shneiderman, 1999; Kurtz & Knight, 2003; Martin 2007; Ryan & Deci, 2000; Zhang &
Bartol, 2010).
Procedures:
If you agree to be in this study, I would ask you to do the following things:
1. Complete the Motivation Engagement Scale (MES-W, 2012), which consists of 44
items. The survey should take about 30 minutes to complete. Your responses on the
MES-W (2012) are confidential. The researcher will not receive any identifying
information.
2. Included in the MES-W (2012), you will be asked to report your years of
experience teaching. This data will be used to separate the participants into two
groups:
a. Induction level – 1 to 4 years teaching experience
b. Veteran level – 5 or more years teaching experience
3. Your school district will share your TAPS score on the Teacher Keys Effectiveness
System (TKES, 2013). Your name will be removed so that the data are confidential. A
statistician at Pioneer RESA will be responsible for removing all identifying information
prior to the principal researcher receiving the data.
Risks and Benefits of being in the Study:
The risks involved in this study are minimal and no more than the participants would face
in everyday life.
Although there are no personal benefits, the benefits to participation will enable the
principal researcher to discover if there is a correlation between the variables of interest
(motivation and engagement, years of experience, and the TAPS score on the TKES
(2013).

Compensation:
You will receive no financial or other compensation.
Confidentiality:
The records of this study will be kept private. In any sort of report I might publish, I will not
include any information that will make it possible to identify a subject. Research records will be
stored securely and only the researcher will have access to the records.
Your name will be removed so that the data are confidential. A statistician at Pioneer RESA
will be responsible for removing all identifying information prior to the principal researcher
receiving the data. The data files collected for the research project will be stored on a
password protected computer and kept for a minimum of three years. After that time period,
all data will be securely deleted.
Voluntary Nature of the Study:
Participation in this study is voluntary. Your decision whether or not to participate will not
affect your current or future relations with Liberty University. If you decide to participate, you
are free to not answer any question or withdraw at any time without affecting those
relationships.
Contacts and Questions:
The researcher conducting this study is Cynthia A. Phillips. You may ask any questions you
have now. If you have questions later, you are encouraged to contact her at XXX-XXX-
XXXX, [email protected]. You may also contact the research’s faculty advisor, Dr.
Linda Holcomb, at [email protected]
If you have any questions or concerns regarding this study and would like to talk to someone
other than the researcher, you are encouraged to contact the Institutional Review Board, 1971

University Blvd, Suite 1837, Lynchburg, VA 24515 or email at [email protected].
Please notify the researcher if you would like a copy of this information to keep for your
records.
Statement of Consent:
I have read and understood the above information. I have asked questions and have received
answers. I consent to participate in the study.
(NOTE: DO NOT AGREE TO PARTICIPATE UNLESS IRB APPROVAL INFORMATION
WITH CURRENT DATES HAS BEEN ADDED TO THIS DOCUMENT.)
Click on the survey link to take the survey:
https://www.surveymonkey.com/r/KBXN92K

APPENDIX E
IRB Approval Letter


