
This work is licensed under a Creative Commons Attribution-NonCommercial 3.0 Unported License
Newcastle University ePrints - eprint.ncl.ac.uk
Small A, Hicks C, McGovern T, Scurry T, Whipp M. A balanced scorecard for
evaluating the performance of motor dealerships. In: 23rd International
Conference on Production Research. 2015, Manila, Philippines.
Copyright:
© The authors, 2015
Date deposited:
22/03/2016

The 23rd International Conference on Production Research
A balanced scorecard for evaluating the performance of
motor dealerships
Adrian Small, Chris Hicks*, Tom McGovern, Tracy Scurry and Melissa Whipp
Newcastle University Business School, Newcastle University, 5 Barrack Road, Newcastle upon Tyne, NE1 4SE,UK.
Abstract
The focus of Lean Production in the automotive sector has been on upstream manufacturing with limited
consideration of downstream service activities. The automotive manufacturers’ national sales companies manage
the sale of new cars through franchising agreements with automotive distributors. A typical dealership will have
multiple value streams besides just the sale of new cars. In order to maintain operational efficiency and
effectiveness performance monitoring needs to be routinely undertaken. The traditional balanced scorecard (BSC)
is one approach a franchisee could adapt. The BSC incorporates four perspectives, which include: financial,
customer, internal processes, and innovation and learning. The approach aims to achieve a balance between short
and long-term objectives and between hard objective measures and softer subjective measures. This paper outlines
the development of a balanced scorecard for an automotive distributor (dealership) that operates multiple
franchises implementing a Lean Transformational change programme that will include Lean evaluation measures.
Keywords: Balanced Scorecard; Franchising; Lean Evaluation; Lean; Motor Dealerships; Performance Evalaution; Value Steams
1. Introduction
The automotive industry comprises: component supply, assembly and distribution. The component
supply and assembly processes are manufacturing operations, whereas distribution activity embodies
characteristics associated with a service model. The industry makes a major contribution to the UK
economy; in 2012, it employed 495,793 people in 1,782 companies. Automotive manufacturing has
historically been at the forefront of initiatives that have sought to increase efficiency and reduce costs.
Lean production historically arose within automotive manufacturing at companies such as Toyota and
Nissan [1].
Lean Production is an evolution of the Toyota Production System (TPS) [2]. It provides an approach
to increase the efficiency and effectiveness of operations through balancing production, minimising
variation, eliminating waste and minimising inventory through using what is needed only when it is
needed (Just-in-Time) [3]. Lean has been widely adapted and disseminated to other manufacturing and
service sectors [4, 5]. In the automotive industry, the focus has been on the upstream part of the supply
chain (component suppliers and automotive assembly) with relatively little consideration, by academics
or practitioners, of the downstream service activities (automotive distribution, sales and servicing)
making this area of research very important [6]. The purchasing power of the automotive assemblers,
positioned in the middle of the supply chain, enables them to force suppliers to accommodate their
idiosyncratic requirements [7]. Likewise, franchise contracts with dealers substantially constrain
franchisees’ decision-making rights and provide the manufacturers with significant enforcement powers
including monitoring, termination and monetary incentives [8]. Franchisees, therefore, need to manage
their sales and servicing functions more effectively.
The creation of Lean dealerships is now an important research area [9] as well as evaluating the
impact that Lean is having on operations. Their performance may be measured in several ways, for
example using financial, customer service and customer retention data. The balanced scorecard
developed by Kaplan and Norton [10-15] provides a holistic view by combining the different aspects of
performance together. This paper addresses the research question “how can a balanced scorecard be

developed for evaluating the performance of motor dealerships”? There is a plethora of materials
relating to performance evaluation and the development of balanced scorecards (BSC). It is important
to synthesise this with the literature that investigates the evaluation of Lean. The objective is to develop
a BSC tool that can be used to evaluate performance within a large, multi-franchise motor dealership
group that is undertaking a transformational change programme based on the application of Lean
philosophies and tools. Section 2 investigates automotive franchising and supplier development.
Section 3 considers Lean and its application in the service sector. Research relating to the balanced
scorecard is then reviewed. Section 5 presents the research strategy and research methods. The
development of a balanced scorecard for motor dealerships is then outlined. Finally, the conclusions
and suggestions for future research are presented in section 7.
2. Automotive franchising and supplier development
2.1 Automotive franchising
The national sales companies for each automotive manufacturer are responsible for managing the
sale of new vehicles through clearly defined franchising agreements with dealerships [16]. This
requires dealers to take responsibility for managing the ‘brand’ of the manufacturer. The manufacturer
stipulates the contractual terms and procedures for monitoring and evaluating the franchisee [17]. The
manufacturers exert considerable power as they specify performance criteria and impose penalties for
underperformance [16, 18]. Manufacturers provide support to franchisees through advertising;
specialist training in executive, sales and mechanic functions; incentive programs for sales and vehicle
repair and maintenance; equipment and specialist tooling; warranty plans and service manuals [19].
Lusch [19] identified that manufacturers tightly controlled franchisees and could apply a range of
sanctions including: slowing down the delivery of new vehicles, distributing vehicles unevenly,
slowing warranty payments, increasing bureaucracy and threatening contract termination. In
comparison, the manufacturers devote considerable time and effort to support up-stream suppliers
through supplier development programmes [20].
2.2 Supplier development
Supplier development is a process to disseminate internal capabilities across boundaries [20]. For
example, automotive manufacturers may assist suppliers through the provision of training in
continuous improvement activities [21]. These activities help develop suppliers’ core competencies,
which increases quality and reduces lead times, which is beneficial for the automotive manufacturer.
The manufactures manage distribution through holding companies, which decouples the motor
dealerships from expertise that resides in the manufacturing operations. Continuous improvement is a
core element of Lean. Hines and Holweg [22] identified that the key objectives of manufacturing
improvement activities were to increase quality, reduce cost and reduce lead-times. However, in other
sectors, such as motor distribution, improvement activities may address a broader range of tangible and
intangible factors. Identifying how ‘best practice’ approaches can lead to improvements in performance
is therefore important.
3. Lean
There is a voluminous literature on the Toyota Production System (TPS) and Lean which originated
in automotive manufacturing [for example, 1, 2, 23-25]. Due to the limited resources available in Japan
and the increasing competition for automobiles, Toyota developed a manufacturing system based upon
the principles of Just-in-Time, Kanban and the respect for employees that allowed them to undertake
problem solving activities in order to improve the TPS itself [22]. Sohal [26] stated that Lean
production requires changes to be implemented throughout an organisation – not just the operational
environment. This holistic perspective is sometimes overlooked as the focus is often on ‘quick-wins’
and immediate payback [20, 27]. In the quest for short-term success, less focus is placed on how
improvements or ‘quick-wins’ can be measured operationally [28].
The overall objectives of Lean are to maximise value, minimise waste, balance production levels,
minimise variation and achieve continuous improvement [22, 28-30]. Other benefits of Lean include

stock reduction, increased quality, greater productivity and shorter lead-times [31]. Lean may be
viewed from two perspectives: philosophical, in terms of its goals; or as the application of tools and
techniques [28]. The second perspective, in which Lean tools and techniques that have been applied to
improve processes, has received the most attention in the literature [28, 32-34]. Western organisations
have primarily concentrated on applying such tools through shop floor improvement activities and
often neglected the cultural change that Lean requires [22, 26].
The effective implementation of Lean requires a detailed understanding of value streams and
sources of variability. There are three types of waste: ‘muda’ (those thing that add cost, but do not add
value); ‘mura’ (variation or irregularity that causes ‘muda’) and ‘muri’ (overburden, when employees
or resources are pushed beyond their capacity) [35]. Coping with variability is a key part of Lean [22].
For example, identifying one form of variability within the manufacturing system may help eliminate
waste - but unless an organisation can identify all sources of variability and eliminate them in tandem,
the benefits of Lean will be restricted [28]. Organisations need to manage variability in order to create
more capacity through better asset utilisation [22]. Identifying value streams and mapping them is a
useful start in understanding value-adding and non-value adding activities within an organisation’s
operations. Value stream maps also uncover where variability might be impacting upon the
manufacturing ‘system’. The notion of value, however, can sometimes be mistaken for cost reduction
[22].
Research has presented the idea that Lean is the best available operational system and can be
implemented in any company [31]. In contrast to this view, service providers have distinctly different
characteristics to manufacturers in terms of intangibility of the service provided (often in the presence
of the customer), perishability and high labour costs calling into question the applicability of Lean to
the service sector [30].
3.1 Lean services
Services are inherently perishable and cannot be held in an inventory, which can makes scheduling
staff problematical. However, eliminating waste can free up employees’ capacity to better meet
customer demands [36]. There has been a growing emphasis on the application of Lean in the service
sector [37-40], particular public services. For example, Erridge and Murray [37] reported on the
implementation of Lean on a local government’s procurement processes at Belfast City Council. The
study identified that an internal champion was needed to make the approach a success, as well as
transferring the concept of value adding activities from a pure manufacturing perspective [37]. Hines
and Martins [41] explored the use of Lean in the Portuguese and Welsh court services and concluded
that Lean could be applied to the legal sector. One finding was that the language used was important
and that it needed to be tailored to the context [41]. Scorsone [42] conducted research on Lean at the
City Government in Grand Rapids, Michigan, USA, which faced reduced budgets and a declining
workforce. A key finding was that the value streams that ran through the government office were
confused and needed to be addressed [42].
Radnor and Walley [43] investigated eight public sector organisations (as well as three pilot sites) in
Scotland that had embarked on a Lean programme. The research identified that Lean had been adapted
at a number of different levels from full implementation (where sustainability was more likely),
through to a lighter touch (where the focus was primarily on the application of the tools and producing
‘quick-wins’). The report concluded that the application of Lean to these particular cases was
successful overall. However, the key barriers identified were: the culture of public services; not being
customer focused; silo working; a lack of clear strategic direction; and a lack of understanding on the
effect of ‘variation’, ‘systems thinking’ and ‘flow’ [43]. A number of these points were emphasised in
a special issue of Public Money & Management published in February 2008. The papers argued the
significance of Lean to the public sector and outlined how Lean thinking could meet the challenge of
providing public services in the public sector. These articles demonstrated that aspects of Lean could
be transferred to the service sector. However, this transfer required more tailoring to the local context.
Radnor and Bucci [44] evaluated a Lean programme undertaken in Her Majesty’s Court Services
(HMCS). The research focused on the administrative functions of the service and waste elimination
throughout the value streams to free up additional capacity. It was concluded that leadership and the

development of an enthusiastic team were critical factors [44]. Despite the application of Lean in many
different service contexts, limited attention has been paid to the service element of the automotive
sector, which is the customer facing part of the supply chain [45].
Kiff [9] investigated Lean within the automotive supply chain and focused on Lean at the
dealership level. He identified that significant stock and waste were caused by the systems and
procedures that linked dealerships with the automotive manufacturers’ national sales companies. In
order to overcome this issue, a better management of the sales and servicing functions was proposed
that would ultimately reduce wasteful activities and at the same time increase customer satisfaction [9].
Value stream mapping was proposed as one Lean tool that could help. Mapping processes at the
dealership level could allow non-value adding and wasteful activities to be identified [9]. Continuous
improvement initiatives such as Lean can be enhanced by effective and meaningful measurement [46].
Bititci et al. [47, p.46] defined the performance management process as “the process by which the
company manages its performance in line with its corporate and functional strategies and objectives.
The objective of this process is to provide a proactive closed loop control system, where the corporate
and functional strategies are deployed to all business processes, activities, tasks and personnel, and
feedback is obtained through the performance measurement system to enable appropriate management
decisions”. The balanced scorecard with appropriate measures and metrics is a tool that can be used for
integrated performance management. In 2005, Kaplan [48] argued that manufacturing and service
organisations have been successfully using the balanced scorecard to create and execute effective
strategies for over a decade.
4. The Balanced Scorecard
The Balanced Scorecard (BSC) is a performance measurement system (PMS) [49] and has been
designed to take into account four perspectives: financial, customer, internal business processes, and
learning and growth [12, 15, 48]. A balanced scorecard presents decision makers within an organisation
a “balanced picture” of the current performance along with metrics associated with future performance
[12]. To summarise, the BSC joins together an organisation’s vision and strategy in order to create
achievable objectives and suitable measures that include hard objective measures as well as softer
subjective measures [14, 15, 49-51]. The BSC helps tackle operational issues through measuring the
current performance, as well as identifying “how” that performance was achieved [46]. It is important,
therefore, that the most suitable measures can be incorporated into a BSC [50]. The aim of the BSC is
to focus on only a limited number of critical measures [12, 15, 52]. Through adopting such a focussed
approach, the performance evaluation will allow an organisation to communicate the strategy and
direction of the company to employees, customers and other key stakeholders [46].
The BSC requires different perspectives to be included when identifying appropriate measures [52,
53]. This is useful especially when trying to evaluate Lean. Financial measures are a key source of
information, but they provide information on past performance and can provide a misrepresentation of
future outcomes [12, 15, 48, 52]. One criticism of the BSC is that it requires managers to work with
multiple measures at once [12, 51]. Some managers focus on financial measures as they are more
readily understood by everyone within the organisation [12, 14]. Kaplan and Norton [12] identified that
many organisations use three themes associated with financial measures to achieve their objectives:
cost reduction, productivity improvement and asset utilisation. These financial measures worked as part
of the industrial mass production era [15], but they may not be sophisticated enough to evaluate the
application of Lean in the service sector. For example, financial performance measures may not
directly record improvements in customer satisfaction, cycle time, or demonstrate new value creating
processes, that could be a direct consequence of applying Lean [15].
One approach would be to rely on other softer measures. These are the customer aspect of the BSC.
The problem is that non-financial measures such as customer service, customer satisfaction and
employee involvement can be prone to the same problems as financial measures [12]. They provide
information on previous performance, which may not be directly linked to strategic objectives. They

may not be useful in determining which strategic direction an organisation should take [15, 49].
Outcome measures alone will not help identify how improvements will be achieved. Conversely,
performance drivers (such as defect rates or cycle times) may enable the business unit to achieve short-
term operational improvements, but without outcome measures they will fail to reveal whether the
operational improvements translate into enhanced financial performance. It is necessary to have an
appropriate mix of outcome measures and performance drivers [12]. Kaplan and Norton [12]
concluded that value can vary across industries but identified three value attributes relating to:
product/service; customer relationships; and image and reputation should be included on a BSC.
If Lean is viewed as a socio-technical system incorporating technical components (for example, the
application of 5S, visual management, root cause analysis etc.) as well as supportive practices (for
example, an appropriate reward system, employee empowerment, commitment etc.), an appropriate
balance between cause and effect and the technical and the supportive elements needs to be managed
[30]. Performance measures within a BSC could be created that incorporate the elements reflecting the
technical and supportive aspects of Lean, as long as they are objective and reliable [53]. This would
allow an organisation to understand the effect that Lean has on its overall performance. Managers
could be presented with a BSC that evaluated Lean operational measures (performance drivers) which
would be linked with financial performance information (outcome measures) [10, 15].
The fourth BSC perspective focusses upon learning and growth. The learning and growth section
helps identify the structure an organisation should adopt to cultivate long-term growth [12]. Internal
skills and other capabilities need to be aligned to the strategic direction set out by the senior
management team [54]. This can be achieved by focusing on three core elements: people, systems and
organisational procedures [12]. This allows gaps to be identified between the existing and required
skills, which can be addressed through staff training [54]. However, Albertsen and Lueg [49] argued
that performance measurement systems (PMS) such as the BSC can only really have an impact on
performance if it is aligned with actors’ intrinsic and extrinsic incentives. Kaplan and Norton [14]
stated that it can be a risk to link rewards directly to BSC metrics as it assumes that the right measures
are initially incorporated into the BSC. In practice, the refinement of a BSC is iterative. It also assumes
that the measures are valid and reliable. This issue could be addressed through the learning and growth
perspective of the BSC, which aims to promote the development of a shared vision, as well as
providing strategic feedback to help achieve organisational learning [14, 51, 55, 56].
A BSC aims to help organisations improve current processes [12, 14]. However, a good BSC will
also identify new processes that an organisation needs to be good at in order to meet financial and
customer objectives [15]. These measures need to take into account the cause-and-effect relationships
in order to determine the lead and lag metrics [15]. The BSC, therefore, is a collection of up to twenty-
five measures that incorporate financial and non-financial measures that taken holistically depict an
organisational strategy and communicate short and long-term objectives in a balanced way [10, 15, 50].
This is important because Hadid et al. [30] argued that rigorous research needs to be conducted that
examines the impact of Lean on service and in particular its impact on performance. Identifying
appropriate measures to populate the BSC then becomes important [52].
5. Research strategy
The primary research strategy adopted for this work was action research with a large motor
dealership that operates multiple franchises (as the case under investigation) as part of a Knowledge
Transfer Partnership (KTP) [57].
5.1 Action Research
Theory development is an important activity in organisational research [58]. A case study can help
with theory development as it can address the ‘what’ and ‘how’ questions but also ask the ‘why’
questions that other research strategies cannot [59, 60]. Case studies have been argued to be one of the
most useful ways to making valid contributions to the operations management knowledge base [61,
62]. This is because case studies are often deployed for investigating unfamiliar conditions [63].

To get a greater understanding of how a BSC could be developed, applied and used Action Research
would be beneficial. Coughlan and Coghlan [64] considered that operations management researchers
need a strategy to answer research questions that surveys and case studies could not answer. Action
research can be summarised to incorporate “research in action, rather than research about action;
participative; concurrent with action; a sequence of events and an approach to problem solving” [64
p.222]. It would be impractical to develop and test a BSC unless the research was situated within the
context of an organisation. Action Research was deemed the most appropriate research strategy to
accomplish this.
5.2 Research Methods
Case studies involving action research are not restricted to adopting one particular research method
so can incorporate more qualitative data (for example, interviews, documentary collection),
quantitative data (for example, financial records, questionnaires), or a mixture of both [58, 65]. It is
important to document in great detail the ‘operations’ of the phenomena under investigation [66]. This
could include for example, drawing on archival data [58], and standard operating procedures. Archival
data provides a good context and background to an organisation under investigation as the data
collected will have been produced for a specific organisational purpose [66]. Participant observation
was used in order to examine what participants did, and how they worked. Vinten [67] supported
making observations at regular intervals to build up a better picture of the activity being undertaken.
To achieve this, observations were recorded in a diary by a member of the research team [68] and were
used as part of the analysis. The observations were recorded each day and re-written afterwards as a
form of reflection. Along with previous academic literature, archival data, documentary data and
observations were collected as the first phase of this research, which allowed the development of a
balanced scorecard for evaluating the performance of motor dealerships.
6. The development of a balanced scorecard for motor dealerships
The following sections demonstrate the development of the balanced scorecard. The BSC is one part
of a much larger transformational change programme. As part of this programme, four pilot sites
(different franchises ran by the motor dealership) were selected. The franchises made up different
manufacturer models, markets and characteristics.
The project began with an internal and external review of existing practices. This stage of the
project helped the research team and company specify the value of their business operations to their
franchisors and customers. The next stage of the project assessed the Company’s readiness for change.
At this stage of the project, a review and evaluation of existing processes and structures within the
dealership was undertaken. Methods such as process and value stream mapping as well as service blue
printing was undertaken. The approach focused on the competiveness and efficiency of service, repairs
and back-office functions. An evaluation of employees’ ‘readiness for change’ was also undertaken.
The remainder of this section displays examples of the types of value stream maps and process
models developed. Secondly, an overview of the key performance indicators (KPIs) and Lean
evaluation literatures was evaluated to determine the most suitable metrics to be included on the
Balanced Scorecard. Finally, through a synthesis of these two approaches, the Balanced Scorecard was
developed.
6.1 Process mapping and value streams
Mapping the value streams was a two-stage process. Firstly, the pilot site was observed and primary
data were collected by the research team through shadowing and questioning employees, note taking,
diary entries, photographs, A3 sheets (a standard report used for plan-do-check-act problem solving) as
well as interactive sessions on problems and challenges. Secondary data included job descriptions,

manuals, job cards, manufacture’s standards (specifying process steps and benchmark times), facility
layout drawings, typical schedules and working patterns. Secondly, the data were analysed to gain an
understanding of the operational and cultural context. The research team facilitated the application of
Lean tools including 7 wastes, spaghetti diagrams, 5 whys, process mapping (see Fig. 1) and Value
Stream Mapping. The company staff and management team then identified priorities for continuous
improvement and future actions.
Fig. 1. An example of a process map
Fig. 2. Technician movements
Action
Action Action
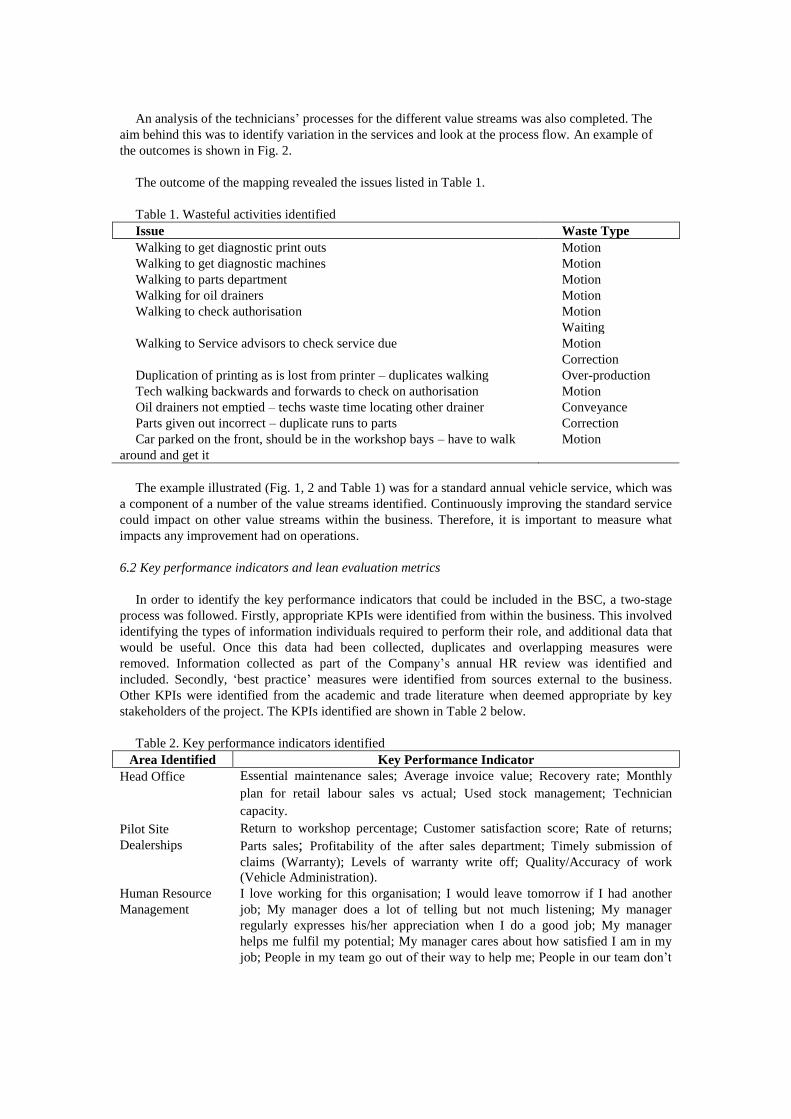
An analysis of the technicians’ processes for the different value streams was also completed. The
aim behind this was to identify variation in the services and look at the process flow. An example of
the outcomes is shown in Fig. 2.
The outcome of the mapping revealed the issues listed in Table 1.
Table 1. Wasteful activities identified
Issue Waste Type
Walking to get diagnostic print outs Motion
Walking to get diagnostic machines Motion
Walking to parts department Motion
Walking for oil drainers Motion
Walking to check authorisation Motion
Waiting
Walking to Service advisors to check service due Motion
Correction
Duplication of printing as is lost from printer – duplicates walking Over-production
Tech walking backwards and forwards to check on authorisation Motion
Oil drainers not emptied – techs waste time locating other drainer Conveyance
Parts given out incorrect – duplicate runs to parts
Car parked on the front, should be in the workshop bays – have to walk
around and get it
Correction
Motion
The example illustrated (Fig. 1, 2 and Table 1) was for a standard annual vehicle service, which was
a component of a number of the value streams identified. Continuously improving the standard service
could impact on other value streams within the business. Therefore, it is important to measure what
impacts any improvement had on operations.
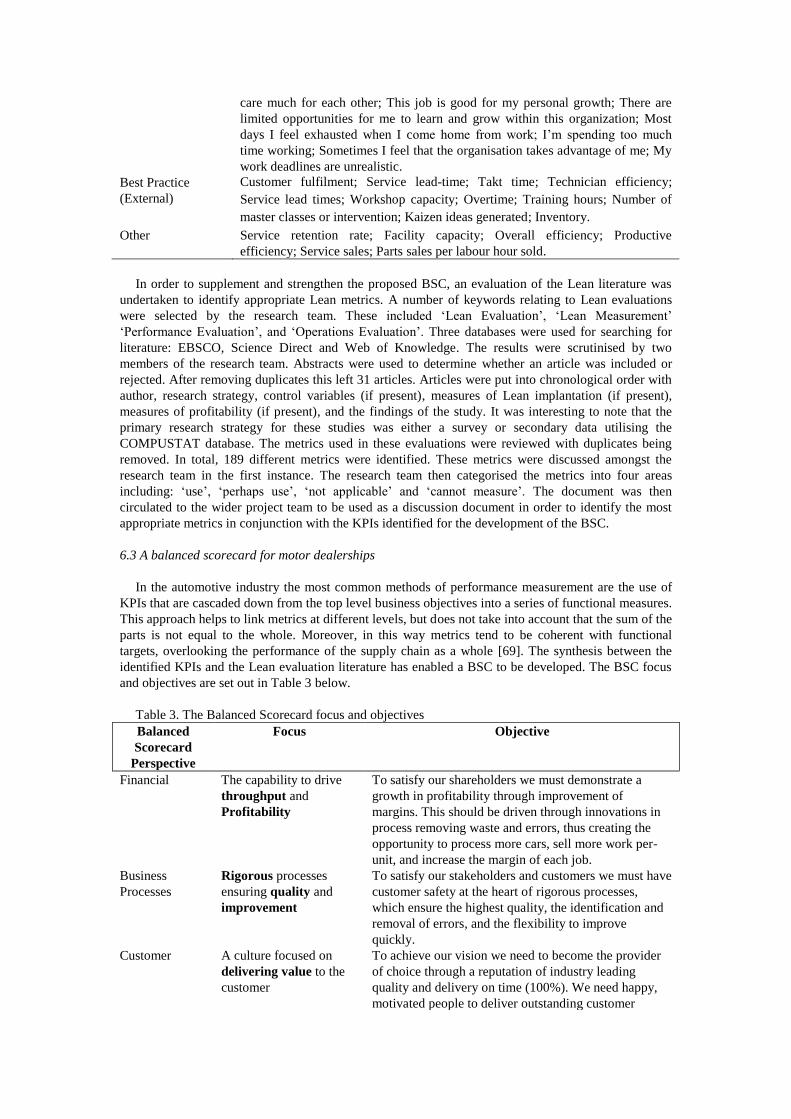
6.2 Key performance indicators and lean evaluation metrics
In order to identify the key performance indicators that could be included in the BSC, a two-stage
process was followed. Firstly, appropriate KPIs were identified from within the business. This involved
identifying the types of information individuals required to perform their role, and additional data that
would be useful. Once this data had been collected, duplicates and overlapping measures were
removed. Information collected as part of the Company’s annual HR review was identified and
included. Secondly, ‘best practice’ measures were identified from sources external to the business.
Other KPIs were identified from the academic and trade literature when deemed appropriate by key
stakeholders of the project. The KPIs identified are shown in Table 2 below.
Table 2. Key performance indicators identified
Area Identified Key Performance Indicator
Head Office Essential maintenance sales; Average invoice value; Recovery rate; Monthly
plan for retail labour sales vs actual; Used stock management; Technician
capacity.
Pilot Site
Dealerships
Return to workshop percentage; Customer satisfaction score; Rate of returns;
Parts sales; Profitability of the after sales department; Timely submission of
claims (Warranty); Levels of warranty write off; Quality/Accuracy of work
(Vehicle Administration).
Human Resource
Management
I love working for this organisation; I would leave tomorrow if I had another
job; My manager does a lot of telling but not much listening; My manager
regularly expresses his/her appreciation when I do a good job; My manager
helps me fulfil my potential; My manager cares about how satisfied I am in my
job; People in my team go out of their way to help me; People in our team don’t
care much for each other; This job is good for my personal growth; There are
limited opportunities for me to learn and grow within this organization; Most
days I feel exhausted when I come home from work; I’m spending too much
time working; Sometimes I feel that the organisation takes advantage of me; My
work deadlines are unrealistic.
Best Practice
(External)
Customer fulfilment; Service lead-time; Takt time; Technician efficiency;
Service lead times; Workshop capacity; Overtime; Training hours; Number of
master classes or intervention; Kaizen ideas generated; Inventory.
Other Service retention rate; Facility capacity; Overall efficiency; Productive
efficiency; Service sales; Parts sales per labour hour sold.
In order to supplement and strengthen the proposed BSC, an evaluation of the Lean literature was
undertaken to identify appropriate Lean metrics. A number of keywords relating to Lean evaluations
were selected by the research team. These included ‘Lean Evaluation’, ‘Lean Measurement’
‘Performance Evaluation’, and ‘Operations Evaluation’. Three databases were used for searching for
literature: EBSCO, Science Direct and Web of Knowledge. The results were scrutinised by two
members of the research team. Abstracts were used to determine whether an article was included or
rejected. After removing duplicates this left 31 articles. Articles were put into chronological order with
author, research strategy, control variables (if present), measures of Lean implantation (if present),
measures of profitability (if present), and the findings of the study. It was interesting to note that the
primary research strategy for these studies was either a survey or secondary data utilising the
COMPUSTAT database. The metrics used in these evaluations were reviewed with duplicates being
removed. In total, 189 different metrics were identified. These metrics were discussed amongst the
research team in the first instance. The research team then categorised the metrics into four areas
including: ‘use’, ‘perhaps use’, ‘not applicable’ and ‘cannot measure’. The document was then
circulated to the wider project team to be used as a discussion document in order to identify the most
appropriate metrics in conjunction with the KPIs identified for the development of the BSC.
6.3 A balanced scorecard for motor dealerships
In the automotive industry the most common methods of performance measurement are the use of
KPIs that are cascaded down from the top level business objectives into a series of functional measures.
This approach helps to link metrics at different levels, but does not take into account that the sum of the
parts is not equal to the whole. Moreover, in this way metrics tend to be coherent with functional
targets, overlooking the performance of the supply chain as a whole [69]. The synthesis between the
identified KPIs and the Lean evaluation literature has enabled a BSC to be developed. The BSC focus
and objectives are set out in Table 3 below.
Table 3. The Balanced Scorecard focus and objectives
Balanced
Scorecard
Perspective
Focus Objective
Financial The capability to drive
throughput and
Profitability
To satisfy our shareholders we must demonstrate a
growth in profitability through improvement of
margins. This should be driven through innovations in
process removing waste and errors, thus creating the
opportunity to process more cars, sell more work per-
unit, and increase the margin of each job.
Business
Processes
Rigorous processes
ensuring quality and
improvement
To satisfy our stakeholders and customers we must have
customer safety at the heart of rigorous processes,
which ensure the highest quality, the identification and
removal of errors, and the flexibility to improve
quickly.
Customer A culture focused on
delivering value to the
customer
To achieve our vision we need to become the provider
of choice through a reputation of industry leading
quality and delivery on time (100%). We need happy,
motivated people to deliver outstanding customer

service and to deliver the best value for money, while
continually innovating to always improve our service.
Learning and
Growth
Staff and manager
capability to create
improvements
To satisfy our stakeholders and customers our people
must be highly skilled, informed about the businesses
current affairs and empowered to make the right choice.
They must understand why we need continuous
improvement, be competent to implement it and have
their ideas encouraged. Our managers must have the
capability to lead change and inspire improvement
through their actions.
Based on Table 3, the metrics were identified to provide a rounded view of the dealerships’
performance. An example of the financial objectives of the BSC is shown in Fig. 3.
Fig. 3. Financial objectives of the balanced scorecard
The coloured boxes in Fig. 3 identify where continuous improvement events can be applied to in
order to improve performance. The financial aspect of the working BSC can be seen in Fig.4 below.
The green metrics depicts where data currently exists within the business and can be collected
immediately (building on the discussion document created). The orange metrics demonstrate data that
will begin to be collected in the immediate future. Finally, the red metrics identifies where new
measures will need to be created in order to collect the appropriate data.
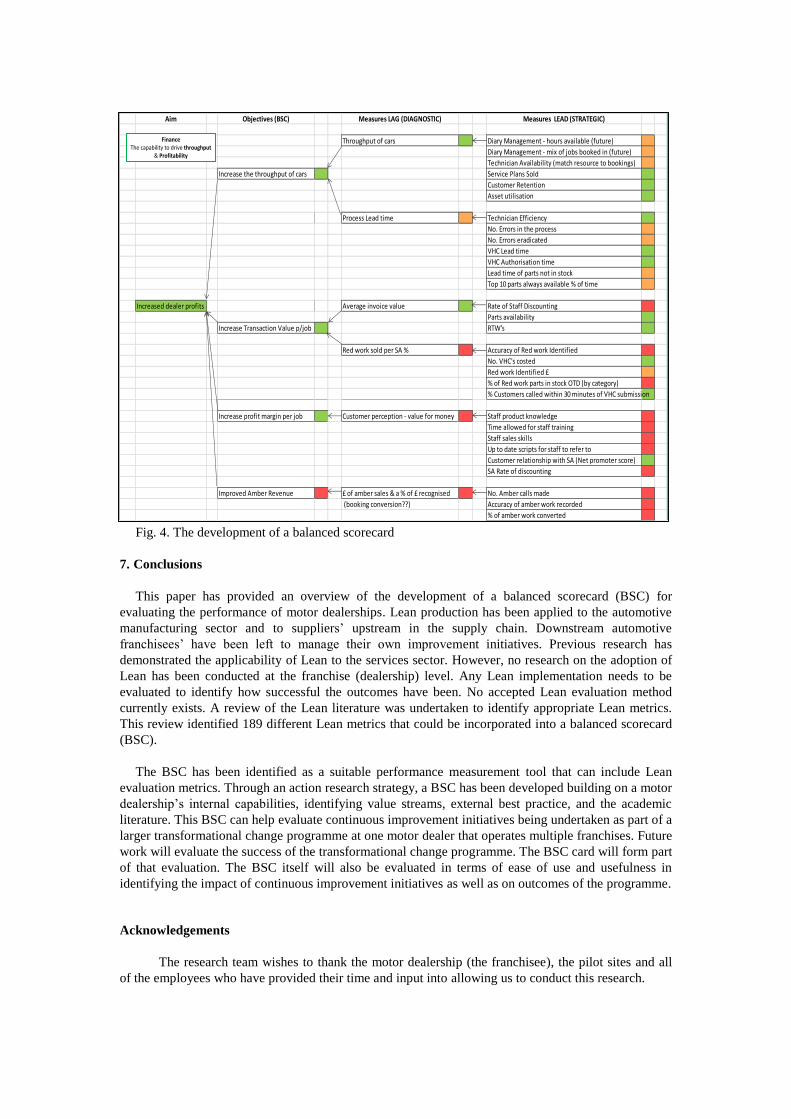
Fig. 4. The development of a balanced scorecard
7. Conclusions
This paper has provided an overview of the development of a balanced scorecard (BSC) for
evaluating the performance of motor dealerships. Lean production has been applied to the automotive
manufacturing sector and to suppliers’ upstream in the supply chain. Downstream automotive
franchisees’ have been left to manage their own improvement initiatives. Previous research has
demonstrated the applicability of Lean to the services sector. However, no research on the adoption of
Lean has been conducted at the franchise (dealership) level. Any Lean implementation needs to be
evaluated to identify how successful the outcomes have been. No accepted Lean evaluation method
currently exists. A review of the Lean literature was undertaken to identify appropriate Lean metrics.
This review identified 189 different Lean metrics that could be incorporated into a balanced scorecard
(BSC).
The BSC has been identified as a suitable performance measurement tool that can include Lean
evaluation metrics. Through an action research strategy, a BSC has been developed building on a motor
dealership’s internal capabilities, identifying value streams, external best practice, and the academic
literature. This BSC can help evaluate continuous improvement initiatives being undertaken as part of a
larger transformational change programme at one motor dealer that operates multiple franchises. Future
work will evaluate the success of the transformational change programme. The BSC card will form part
of that evaluation. The BSC itself will also be evaluated in terms of ease of use and usefulness in
identifying the impact of continuous improvement initiatives as well as on outcomes of the programme.
Acknowledgements
The research team wishes to thank the motor dealership (the franchisee), the pilot sites and all
of the employees who have provided their time and input into allowing us to conduct this research.
Aim Objectives (BSC) Measures LAG (DIAGNOSTIC) Measures LEAD (STRATEGIC)
Throughput of cars Diary Management - hours available (future)
Diary Management - mix of jobs booked in (future)
Technician Availability (match resource to bookings)
Increase the throughput of cars Service Plans Sold
Customer Retention
Asset utilisation
Process Lead time Technician Efficiency
No. Errors in the process
No. Errors eradicated
VHC Lead time
VHC Authorisation time
Lead time of parts not in stock
Top 10 parts always available % of time
Increased dealer profits Average invoice value Rate of Staff Discounting
Parts availability
Increase Transaction Value p/job RTW's
Red work sold per SA % Accuracy of Red work Identified
No. VHC's costed
Red work Identified £
% of Red work parts in stock OTD (by category)
% Customers called within 30 minutes of VHC submission
Increase profit margin per job Customer perception - value for money Staff product knowledge
Time allowed for staff training
Staff sales skills
Up to date scripts for staff to refer to
Customer relationship with SA (Net promoter score)
SA Rate of discounting
Improved Amber Revenue £ of amber sales & a % of £ recognised No. Amber calls made
(booking conversion??) Accuracy of amber work recorded
% of amber work converted
FinanceThe capability to drive throughput
& Profitability

References
[1] Krafcik, J.F., 1988, Triumph of the Lean Production System, Sloan Management Review,
30(1), 41-52.
[2] Ohno, T., 1982, How the Toyota Production System Was Created, Japanese Economic
Studies, 10(4), 83-101.
[3] Womack, J.P. and D.T. Jones, Lean Thinking: banish waste and create wealth in your
corporation1996, New York: Simon & Schuster. 350.
[4] Suárez-Barraza, M.F., T. Smith, and S.M. Dahlgaard-Park, 2012, Lean service: A literature
analysis and classification, Total Quality Management and Business Excellence, 23(3-4),
359-380.
[5] Bhamu, J. and K.S. Sangwan, 2014, Lean manufacturing: Literature review and research
issues, International Journal of Operations and Production Management, 34(7), 876-940.
[6] Hicks, C., T. Scurry, T. McGovern, A. Small, and M. Whipp. 2014, The case for
transformational change in the automotive distribution industry, in 28th Australian and New
Zealand Academy of Management Conference, Reshaping Management for Impact, Sydney.
[7] Sturgeon, T.J., O. Memedovic, J. Van Biesebroeck, and G. Gereffi, 2009, Globalisation of the
automotive industry: main features and trends, International Journal of Technological
Learning, Innovation and Development, 2(1), 7-24.
[8] Arruñada, B., L. Garicano, and L. Vázquez, 2001, Contractual allocation of decision rights
and incentives: The case of automobile distribution, Journal of Law, Economics, and
Organization, 17(1), 257-284.
[9] Kiff, J., S. , 2000, The Lean Dealership – A Vision for the Future: “from hunting to farming”,
Marketing Intelligence & Planning, 18(3), 112-126.
[10] Kaplan, R.S. and D.P. Norton, 2001, Transforming the Balanced Scorecard from Performance
Measurement to Strategic Management: Part I, Accounting Horizons, 15(1), 87-104.
[11] Kaplan, R.S. and D.P. Norton, 2001, Transforming the Balanced Scorecard from Performance
Measurement to Strategic Management: Part II, Accounting Horizons, 15(2), 147-160.
[12] Kaplan, R.S. and D.P. Norton, 1996, Linking the Balanced Scorecard to Strategy, California
Management Review, 39(1), 53-79.
[13] Kaplan, R.S. and D.P. Norton, 1996, Using the Balanced Scorecard as a Strategic
Management System, Harvard Business Review, 74(1), 75-85.
[14] Kaplan, R.S. and D.P. Norton, 2007, Using the Balanced Scorecard as a Strategic
Management System, Harvard Business Review, 85(7/8), 150-161.
[15] Kaplan, R.S. and D.R. Norton, 2005, The Balanced Scorecard: Measures That Drive
Performance, Harvard Business Review, 83(7/8), 172-180.
[16] Davey-Rafer, M.R., 1998, Training and Power in Franchise Systems: The Example of the UK
Automotive Industry, Journal of European Industrial Training, 22(9), 367-374.
[17] Kashyap, V., K.D. Antia, and G.L. Frazier, 2012, Contracts, extracontractual incentives, and
ex post behavior in franchise channel relationships, Journal of Marketing Research, 49(2),
260-276.
[18] Kessler, F., 1957, Automobile Dealer Franchises: Vertical Integration by Contract, Yale Law
Journal, 1135-1190.

[19] Lusch, R.F., 1976, Sources of Power: Their Impact on Intrachannel Conflict, Journal of
Marketing Research, 13(4), 382-390.
[20] Sako, M., 2004, Supplier development at Honda, Nissan and Toyota: comparative case studies
of organizational capability enhancement, Industrial and Corporate Change, 13(2), 281-308.
[21] Dyer, J.H. and K. Nobeoka, 2000, Creating and managing a high-performance knowledge-
sharing network: The Toyota case, Strategic Management Journal, 21(3), 345.
[22] Hines, P., M. Holweg, and N. Rich, 2004, Learning to evolve: A review of contemporary lean
thinking, International Journal of Operations and Production Management, 24(10), 994-1011.
[23] Lander, E. and J.K. Liker, 2007, The Toyota Production System and art: making highly
customized and creative products the Toyota way., International Journal of Production
Research 45(16), 3681-3698.
[24] Monden, Y., Toyota Production System: A Practical Approach to Production Management.
1983: Industrial Engineers and Management Press, Norcross, GA.
[25] Spear, S. and H.K. Bowen, 1999, Decoding the DNA of the Toyota Production System,
Harvard Business Review, 77(5), 97-106.
[26] Sohal, A.S., 1996, Developing a Lean Production Organization: An Australian Case Study,
International Journal of Operations & Production Management, 16(2), 91-102.
[27] Schaffer, R.H. and H.A. Thomson, 1992, Successful Change Programs Begin with Results,
Harvard Business Review, 70(1), 80-89.
[28] Shah, R. and P.T. Ward, 2007, Defining and developing measures of lean production, Journal
of Operations Management, 25(4), 785-805.
[29] Womack, J.J., DT., Lean thinking. Banish waste and create wealth in your corporation.
second ed2003: Free press. 396.
[30] Hadid, W. and S. Afshin Mansouri, 2014, The Lean-Performance Relationship in Services: A
Theoretical Model, International Journal of Operations & Production Management, 34(6),
750-785.
[31] Bonavia, T. and J.A. Marin, 2006, An empirical study of lean production in the ceramic tile
industry in Spain, International Journal of Operations and Production Management, 26(5),
505-531.
[32] Hines, P. and N. Rich, 1997, The seven value stream mapping tools, International Journal of
Operations & Production Management, 17(1), 46.
[33] Pavnaskar, S.J., J.K. Gershenson, and A.B. Jambekar, 2003, Classification scheme for lean
manufacturing tools, International Journal of Production Research, 41(13), 3075–3090.
[34] Bicheno, J., The New Lean Toolbox: Towards Fast, Flexible Flow. 3rd ed2004, Buckingham:
PICSIE Books.
[35] Hampson, I., 1999, Lean production and the Toyota Production System - Or, the case of the
forgotten production concepts, Economic and Industrial Democracy, 20(3), 369-391.
[36] Bowen, D., E. and W. Youngdahl, E., 1998, “Lean” Service: In Defense of a Production‐
Line Approach, International Journal of Service Industry Management, 9(3), 207-225.
[37] Erridge, A. and J.G. Murray, 1998, Lean Supply: A Strategy for Best Value in Local
Government Procurement?, Public Policy and Administration, 13(2), 70-85.
[38] Hines, P. and S. Lethbridge, 2008, New development: Creating a Lean university, Public
Money & Management, 28(1), 53-56.

[39] McQuade, D., 2008, New Development: Leading Lean Action to Transform Housing
Services, Public Money & Management, 28(1), 57-60.
[40] Suarez Barraza, M.F., T. Smith, and S.M. Dahlgaard-Park, 2009, Lean-Kaizen Public Service:
An Empirical Approach in Spanish Local Governments, The TQM Journal, 21(2), 143-167.
[41] Hines, P., A.L. Martins, and J. Beale, 2008, Testing the boundaries of Lean thinking:
Observations from the legal public sector, Public Money & Management, 28(1), 35-40.
[42] Scorsone, E.A., 2008, New Development: What are the Challenges in Transferring Lean
Thinking to Government?, Public Money & Management, 28(1), 61-64.
[43] Radnor, Z., P. Walley, A. Stephens, and G. Bucci, Evaluation of the Lean Approach to
Business Management and its use in the Public Sector, 2006, Scottish Executive Social
Research.
[44] Radnor, Z. and G. Bucci, Evaluation of the Lean Programme in HMCS, 2010: London. p. 108.
[45] Reichhart, A. and M. Holweg, 2007, Lean Distribution: Concepts, Cntributions, Conflicts,
International Journal of Production Research, 45(16), 3699-3722.
[46] Kagioglou, M., R. Cooper, and G. Aouad, 2001, Performance Management in Construction: A
Conceptual Framework, Construction Management & Economics, 19(1), 85-95.
[47] Bititci, U.S., A.S. Carrie, and L. McDevitt, 1997, Integrated performance measurement
systems: an audit and development guide, The TQM Magazine, 9(1), 46-53.
[48] Kaplan, R., S. , 2005, How the Balanced Scorecard Complements the McKinsey 7‐S Model,
Strategy & Leadership, 33(3), 41-46.
[49] Albertsen, A.O. and R. Lueg, 2014, The Balanced Scorecard’s Missing Link to Compensation,
Journal of Accounting & Organizational Change, 10(4), 431-465.
[50] Radnor, Z. and B. Lovell, 2003, Defining, Justifying and Implementing the Balanced
Scorecard in the National Health Service, International Journal of Medical Marketing, 3(3),
174.
[51] Norreklit, H., 2000, The Balance on the Balanced Scorecard a Critical Analysis of Some of its
Assumptions, Management Accounting Research, 11(1), 65-88.
[52] Lawrie, G. and I. Cobbold, 2004, Third‐Generation Balanced Scorecard: Evolution of an
Effective Strategic Control Tool, International Journal of Productivity and Performance
Management, 53(7), 611-623.
[53] Doolen, T., M. Traxler, and K. McBride, 2006, Using Scorecards for Supplier Performance
Improvement: Case Application in a Lean Manufacturing Organization, Engineering
Management Journal, 18(2), 26-34.
[54] Mooraj, S., D. Oyon, and D. Hostettler, 1999, The Balanced Scorecard: A Necessary Good or
an Unnecessary Evil?, European Management Journal, 17(5), 481-491.
[55] Argyris, C. and D.A. Schön, Organizational Learning : A Theory of Action Perspective1978,
Reading, Mass.: Addison-Wesley Pub. Co. vii, 344.
[56] Senge, P.M., The Fifth Discipline : The Art and Practice of the Learning Organization. 1st
ed1990, New York: Doubleday/Currency. viii, 424 p.
[57] Innovate UK, Knowledge Transfer Partnerships (KTP). 2015 17/03/15]; Available from:
https://connect.innovateuk.org/web/ktp.
[58] Eisenhardt, K., 1989, Building theories from case study research, Academy of management
Review, 14(4), 532-550.
[59] Meredith, J., 1998, Building Operations Management Theory through Case and Field
Research, Journal of Operations Management, 16(4), 441-454.
[60] Meredith, J.R., A. Raturi, K. Amoako-Gyampah, and B. Kaplan, 1989, Alternative Research
Paradigms in Operations, Journal of Operations Management, 8(4), 297-326.
[61] Stuart, I., D. McCutcheon, R. Handfield, R. McLachlin, and D. Samson, 2002, Effective Case
Research in Operations Management: A Process Perspective, Journal of Operations
Management, 20(5), 419-433.
[62] Wacker, J.G., 1998, A Definition of Theory: Research Guidelines for Different Theory-
Building Research Methods in Operations Management, Journal of Operations Management,
16(4), 361-385.
[63] McCutcheon, D.M. and J.R. Meredith, 1993, Conducting Case Study Research in Operations
Management, Journal of Operations Management, 11(11), 239-256.
[64] Coughlan, P. and D. Coghlan, 2002, Action Research for Operations Management,
International Journal of Operations & Production Management, 22(2), 220-240.
[65] Yin, R.K., 1981, The Case Study Crisis: Some Answers, Administrative Science Quarterly,
26, 58-65.
[66] Flynn, B.B., S. Sakakibara, R.G. Schroeder, K.A. Bates, and E.J. Flynn, 1990, Empirical
Research Methods in Operations Management, Journal of Operations Management, 9(2), 250-
284.
[67] Vinten, G., 1994, Participant Observation: A Model for Organizational Investigation?, Journal
of Managerial Psychology, 9(2), 30-38.
[68] Zuber‐Skerritt, O., 2002, A Model for Designing Action Learning and Action Research
Programs, The Learning Organization, 9(4), 143-149.
[69] Gaiardelli, P., N. Saccani, and L. Songini, 2007, Performance Measurement of the After-Sales
Service Network—Evidence from the Automotive Industry, Computers in Industry, 58(7),
698-708.


