
S
4th edition
The Center for Science in the Public Interest (CSPI), founded in 1971, is a non-‐profit health-‐advocacy organization. CSPI conducts innovative research and advocacy
programs in the area of nutrition, food safety, and alcoholic beverages and provides consumers with current information about their own health and well-‐being. CSPI is supported by the subscribers to its Nutrition Action Healthletter and by foundation grants. This report was written by Michael F. Jacobson, Ph.D., President of CSPI, and updated by Angela Amico, M.P.H., Project Coordinator, with research by Health Promotion Policy interns Kate Kiernan and Ellen Mei and editing by Jim O’Hara,
Director, Health Promotion Policy.
Copyright © 2016 by Center for Science in the Public Interest
First edition: August 2005 Second edition: December 2008 Third edition: August 2013 Fourth edition: April 2016
Center for Science in the Public Interest Nonprofit publisher of Nutrition Action Healthletter 1220 L Street, NW, Suite 300 • Washington, DC 20005
Tel: (202) 332-‐9110 • Fax: (202) 265-‐4954 e-‐mail: [email protected] • Internet: www.cspinet.org
Table of Contents Sodium Levels in Processed Foods ............................................................................................................... 3
Brand Variations ................................................................................................................................................... 4
Changes from 2005 to 2015 ............................................................................................................................ 5
Recommendations ............................................................................................................................................... 8
Packaged Foods .................................................................................................................................................. 10
Baked Goods .................................................................................................................................................... 10
Dairy Products ............................................................................................................................................... 14
Frozen Foods .................................................................................................................................................. 18
Meats .................................................................................................................................................................. 20
Prepared Foods .............................................................................................................................................. 25
Salad Dressings .............................................................................................................................................. 25
Sauces ................................................................................................................................................................. 27
Snack Foods ..................................................................................................................................................... 30
Soups .................................................................................................................................................................. 32
Restaurant Foods .............................................................................................................................................. 37
Breakfast Foods ............................................................................................................................................. 37
Breadsticks ...................................................................................................................................................... 38
Chicken, Fried ................................................................................................................................................. 38
French Fries ..................................................................................................................................................... 39
Pizza .................................................................................................................................................................... 39
Salads ................................................................................................................................................................. 40
Sandwiches ...................................................................................................................................................... 40
Soup .................................................................................................................................................................... 42

Sodium Content of Foods ● 3
Salt—sodium chloride—is one of the deadliest ingredients in the U.S. food supply. While a small amount is safe and necessary for health, the amount of salt in the typical American diet—about a teaspoon and a half a day—is a major cause of high blood pressure, or hypertension.1,2 Currently, upwards of 70 million—more than one in four—Americans suffer from that condition, which increases the risk of heart disease and stroke.3 Together coronary heart disease and stroke kill about 500,000 people annually in the United States.4
An additional one in three Americans has prehypertension, meaning elevated blood pressure that is not yet in the hypertensive range.5 Non-‐Hispanic black adults have the highest prevalence of hypertension in the United States (42.1%) compared to non-‐Hispanic white, Asian,
1 World Action on Salt & Health. Salt and Blood pressure. http://www.worldactiononsalt.com/salthealth/factsheets/bloodpressure/index.html 2 Centers for Disease Control and Prevention. Most Americans Should Consume Less Sodium. 2016. Accessed 2/2016 http://www.cdc.gov/salt 3 Centers for Disease Control and Prevention. High Blood Pressure. 2015. http://www.cdc.gov/bloodpressure/ 4 Centers for Disease Control and Prevention, National Center for Health Statistics. Underlying Cause of Death 1999–2013 on CDC WONDER Online Database, released 2015. Data are from the Multiple Cause of Death Files, 1999–2013, as compiled from data provided by the 578 vital statistics jurisdictions through the Vital Statistics Cooperative Program. 5 Ibid. Centers for Disease Control and Prevention, High Blood Pressure, 2015.
and Hispanic adults (28%, 24.7%, and 26%, respectively).6
A recent study estimated the benefits that would result from reducing sodium consumption, both immediately and gradually. Immediately reducing average sodium consumption levels from the current average of almost 3,500 mg per day to between 2,200 mg to 1,500 mg per day—about a teaspoon or less—would save about 700,000 to 1.2 million lives over 10 years. A more-‐achievable, gradual 40 percent reduction in consumption over 10 years would save 280,000 to 500,000 lives.7 Another study estimated that a reduction of 1,200 mg of sodium per day would save 44,000 to 92,000 lives and $10 billion to $24 billion in health-‐care costs annually.8 A state-‐by-‐state analysis of the data demonstrated that this level of sodium reduction would save four states alone—California, Texas, Florida, and New York—more than $1 billion each annually in health care costs.9
6 Centers for Disease Control and Prevention, Hypertension Among Adults in the United States: National Health and Nutrition Examination Survey, 2011–2012. National Center for Health Statistics Data Brief. 2013;133. http://www.cdc.gov/nchs/data/databriefs/db133.htm 7 Coxson PG, Cook NR, Joffres M. Mortality Benefits from US population-‐wide reduction in sodium consumption. Hypertension. 2013;61:564–570. 8 Bibbins-‐Domingo, K., et al. Projected effect of dietary salt reductions on future cardiovascular disease. N Engl J Med. 2010; 362(7), 590-‐9. 9 Center for Science in the Public Interest. Reducing Sodium: a look at state savings in health
Sodium Levels in Processed Foods
Sodium Content of Foods ● 4
When they think about salt, most people think of the salt shaker on their kitchen table. But the salt shaker supplies only a small percentage of a person’s daily intake. Processed and restaurant foods account for more than three-‐quarters of all sodium, according to a 1991 study.10 The same study estimated that naturally occurring sodium (especially in dairy foods) accounts for about 12 percent of our intake, and sodium from salt added in cooking or at the table adds another 11 percent.
The 2015–2020 edition of the Dietary Guidelines for Americans, which is published jointly by the U.S. Department of Health and Human Services (DHHS) and U.S. Department of Agriculture (USDA), emphasizes the importance of consuming less sodium. It states in its key recommendations:
Consume less than 2,300 milligrams (mg) per day of sodium.11
In Chapter 1, A Closer Look Inside Healthy Eating Patterns, the Guidelines further states:
Adults with prehypertension and hypertension would particularly benefit from blood pressure lowering. For these individuals,
care costs. 2015. http://cspinet.org/new/pdf/Sodium%20Report%20Final%205%2020%2015.pdf 10 Mattes RD, Donnelly D. Relative contributions of dietary sodium sources. J Am Coll Nutr. 1991;10:383–93. 11 U.S. Departments of Health and Human Services and Agriculture. 2015–2020 Dietary Guidelines for Americans. 2015; 8. http://health.gov/dietaryguidelines/2015/guidelines/
further reduction to 1,500 mg per day can result in even greater blood pressure reduction.
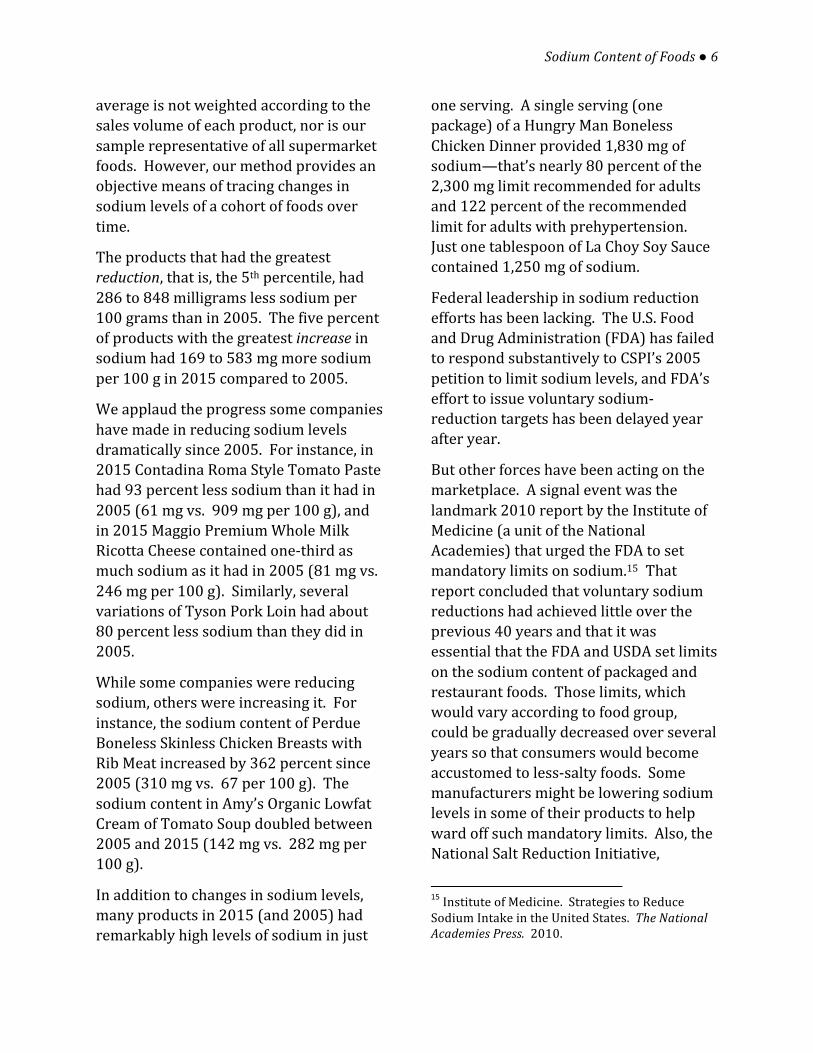
Brand Variations Since 2005, CSPI has monitored a “market basket” of processed and restaurant foods to determine how industry efforts at sodium reduction are working. Judging from differences in the sodium content of different brands of the same foods, many companies should be able to reduce sodium. This report compares different brands of similar products (efforts were made to compare similar sizes, shapes, and flavors of products). All the products were sold in large chain supermarkets or chain restaurants and did not include foods marketed specifically as low-‐sodium or sodium-‐free. This report compares the amount of sodium measured in milligrams (mg) per 100-‐gram (g) quantities of foods so as to adjust for different serving sizes. All the data were obtained from food labels, company websites, or company representatives (by telephone).
We found that most categories showed wide variations in sodium content among brands. Some brands had 50 percent, 100 percent, or even more sodium than a competing brand. For instance, Heinz Organic Ketchup had 46 percent more sodium than Annie’s Organic Ketchup (1,118 mg vs. 765 mg per 100 g), and Hunts Diced Tomatoes had 60 percent more sodium than Del Monte Diced Tomatoes (165 mg vs. 103 mg per 100 g). Arby’s Curly French Fries had more than four times as much sodium as McDonald’s

Sodium Content of Foods ● 5
French Fries (735 mg vs. 171 mg per 100 g).
In some cases, though, different brands had identical or almost identical levels of sodium. For instance, among four Monterey Jack cheeses, there was only a six percent difference between the brands that contained the least and the most sodium. It is possible that the manufacturers were all at the low end of sodium use—or that bigger efforts would be need to lower sodium.
The one time when higher levels of sodium in foods might be acceptable is when salt and other sodium-‐containing ingredients are used to prevent the growth of dangerous bacteria. But even in those foods, sodium levels may vary considerably. For example, Hormel Original Bacon contained 38 percent more sodium than Oscar Mayer Center Cut Bacon (2,222 mg vs. 1,615 mg per 100 g). And Smithfield Naturally Hickory Smoked Bacon had 80 percent more sodium than Safeway Select Naturally Smoked Thick Sliced Bacon (1,895 mg vs. 1,056 mg per 100 g).
The wide variation in sodium levels among brands in a given category indicates that many companies could lower the sodium content of their products sharply without jeopardizing consumer acceptance. In many cases, if companies gradually lowered sodium levels, consumers would become accustomed to less salty foods. In a small, but interesting, experiment in Australia, researchers found that people could barely, if at all, detect when the sodium content of bread—a major source of sodium—was reduced by 25 percent over
six weeks.12 And many people who go on low-‐sodium diets to lower their blood pressure say that they get used to the unsalted foods rather quickly and enjoy the taste of the foods, as opposed to the salt.13
Changes from 2005 to 2015 Once again in 2015, as it has since the first edition in 1980, the Dietary Guidelines for Americans recommended that Americans reduce their intake of sodium. Have industry efforts to reduce sodium been consistent and in keeping with the Guidelines’ advice? To answer that question, CSPI compared the sodium content of its “market basket” of 451 products (379 packaged food products and 72 restaurant food items) in 2015 with the sodium content of those products in 2005. Of the 451 products monitored, sodium decreased in 248 (55%), increased in 135 (30%), and did not change in 68 (15%). Companies increased the sodium in 30 products by 30 percent or more, and decreased sodium by that amount in 41 products.14
On average, the products had only about four percent less sodium in 2015 than in 2005, with an average decrease of 41 milligrams per 100 grams of product. It is important to note that that
12 Girgis S, Neal B, Prescott J, et al. A one-‐quarter reduction in the salt content of bread can be made without detection. Eur J Clin Nutr. 2003;57:616–20. 13 Rodgers A, Neal B. Less salt does not necessarily mean less taste. Lancet. 1999;353:1332. 14 Caveats: Some companies might simply have corrected errors in their 2005 data, and these figures, by design, ignore any lower-‐ (or higher-‐) sodium products introduced since 2005.
Sodium Content of Foods ● 6
average is not weighted according to the sales volume of each product, nor is our sample representative of all supermarket foods. However, our method provides an objective means of tracing changes in sodium levels of a cohort of foods over time.
The products that had the greatest reduction, that is, the 5th percentile, had 286 to 848 milligrams less sodium per 100 grams than in 2005. The five percent of products with the greatest increase in sodium had 169 to 583 mg more sodium per 100 g in 2015 compared to 2005.
We applaud the progress some companies have made in reducing sodium levels dramatically since 2005. For instance, in 2015 Contadina Roma Style Tomato Paste had 93 percent less sodium than it had in 2005 (61 mg vs. 909 mg per 100 g), and in 2015 Maggio Premium Whole Milk Ricotta Cheese contained one-‐third as much sodium as it had in 2005 (81 mg vs. 246 mg per 100 g). Similarly, several variations of Tyson Pork Loin had about 80 percent less sodium than they did in 2005.
While some companies were reducing sodium, others were increasing it. For instance, the sodium content of Perdue Boneless Skinless Chicken Breasts with Rib Meat increased by 362 percent since 2005 (310 mg vs. 67 per 100 g). The sodium content in Amy’s Organic Lowfat Cream of Tomato Soup doubled between 2005 and 2015 (142 mg vs. 282 mg per 100 g).
In addition to changes in sodium levels, many products in 2015 (and 2005) had remarkably high levels of sodium in just
one serving. A single serving (one package) of a Hungry Man Boneless Chicken Dinner provided 1,830 mg of sodium—that’s nearly 80 percent of the 2,300 mg limit recommended for adults and 122 percent of the recommended limit for adults with prehypertension. Just one tablespoon of La Choy Soy Sauce contained 1,250 mg of sodium.
Federal leadership in sodium reduction efforts has been lacking. The U.S. Food and Drug Administration (FDA) has failed to respond substantively to CSPI’s 2005 petition to limit sodium levels, and FDA’s effort to issue voluntary sodium-‐reduction targets has been delayed year after year.
But other forces have been acting on the marketplace. A signal event was the landmark 2010 report by the Institute of Medicine (a unit of the National Academies) that urged the FDA to set mandatory limits on sodium.15 That report concluded that voluntary sodium reductions had achieved little over the previous 40 years and that it was essential that the FDA and USDA set limits on the sodium content of packaged and restaurant foods. Those limits, which would vary according to food group, could be gradually decreased over several years so that consumers would become accustomed to less-‐salty foods. Some manufacturers might be lowering sodium levels in some of their products to help ward off such mandatory limits. Also, the National Salt Reduction Initiative,
15 Institute of Medicine. Strategies to Reduce Sodium Intake in the United States. The National Academies Press. 2010.
Sodium Content of Foods ● 7
spearheaded by the New York City Department of Health and Mental Hygiene (DOHMH), set voluntary targets (following the example of the British government) for companies to meet.
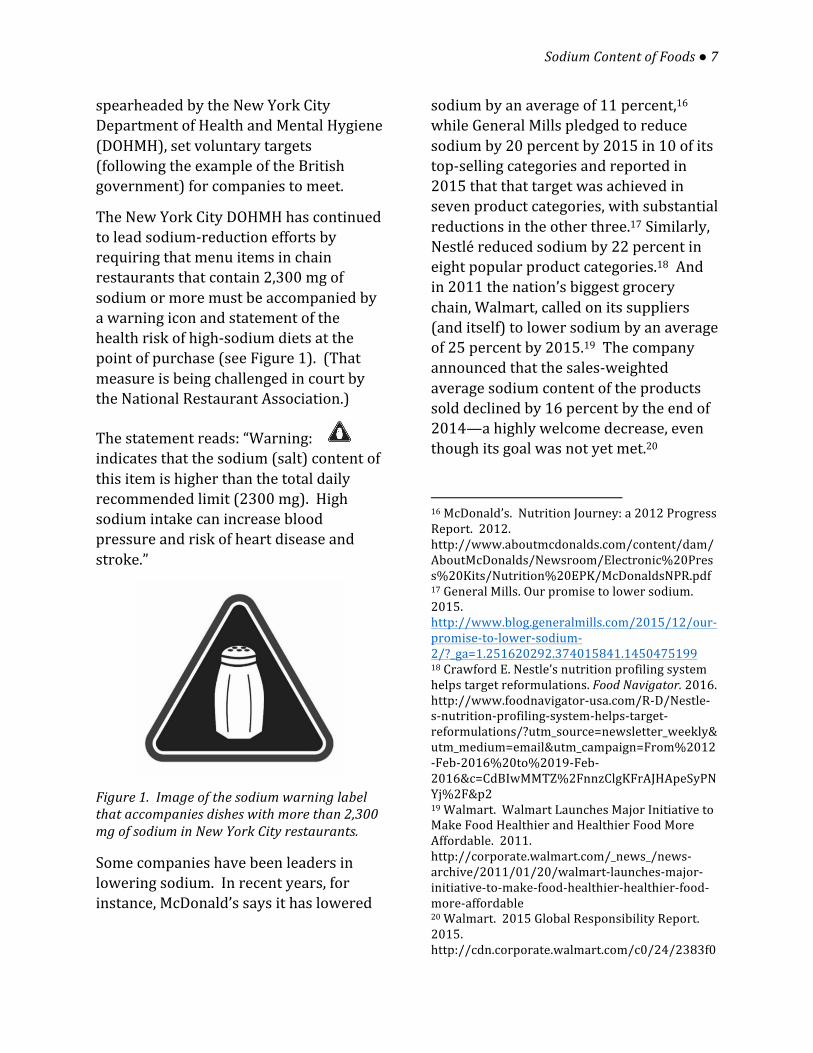
The New York City DOHMH has continued to lead sodium-‐reduction efforts by requiring that menu items in chain restaurants that contain 2,300 mg of sodium or more must be accompanied by a warning icon and statement of the health risk of high-‐sodium diets at the point of purchase (see Figure 1). (That measure is being challenged in court by the National Restaurant Association.)
The statement reads: “Warning: indicates that the sodium (salt) content of this item is higher than the total daily recommended limit (2300 mg). High sodium intake can increase blood pressure and risk of heart disease and stroke.”
Figure 1. Image of the sodium warning label that accompanies dishes with more than 2,300 mg of sodium in New York City restaurants.
Some companies have been leaders in lowering sodium. In recent years, for instance, McDonald’s says it has lowered
sodium by an average of 11 percent,16 while General Mills pledged to reduce sodium by 20 percent by 2015 in 10 of its top-‐selling categories and reported in 2015 that that target was achieved in seven product categories, with substantial reductions in the other three.17 Similarly, Nestlé reduced sodium by 22 percent in eight popular product categories.18 And in 2011 the nation’s biggest grocery chain, Walmart, called on its suppliers (and itself) to lower sodium by an average of 25 percent by 2015.19 The company announced that the sales-‐weighted average sodium content of the products sold declined by 16 percent by the end of 2014—a highly welcome decrease, even though its goal was not yet met.20
16 McDonald’s. Nutrition Journey: a 2012 Progress Report. 2012. http://www.aboutmcdonalds.com/content/dam/AboutMcDonalds/Newsroom/Electronic%20Press%20Kits/Nutrition%20EPK/McDonaldsNPR.pdf 17 General Mills. Our promise to lower sodium. 2015. http://www.blog.generalmills.com/2015/12/our-‐promise-‐to-‐lower-‐sodium-‐2/?_ga=1.251620292.374015841.1450475199 18 Crawford E. Nestle’s nutrition profiling system helps target reformulations. Food Navigator. 2016. http://www.foodnavigator-‐usa.com/R-‐D/Nestle-‐s-‐nutrition-‐profiling-‐system-‐helps-‐target-‐reformulations/?utm_source=newsletter_weekly&utm_medium=email&utm_campaign=From%2012-‐Feb-‐2016%20to%2019-‐Feb-‐2016&c=CdBIwMMTZ%2FnnzClgKFrAJHApeSyPNYj%2F&p2 19 Walmart. Walmart Launches Major Initiative to Make Food Healthier and Healthier Food More Affordable. 2011. http://corporate.walmart.com/_news_/news-‐archive/2011/01/20/walmart-‐launches-‐major-‐initiative-‐to-‐make-‐food-‐healthier-‐healthier-‐food-‐more-‐affordable 20 Walmart. 2015 Global Responsibility Report. 2015. http://cdn.corporate.walmart.com/c0/24/2383f0
Sodium Content of Foods ● 8
Notwithstanding such progress, manufacturers and restaurants still have to remove a great deal of sodium from thousands of their products in order for Americans to reach the 2,300-‐mg level recommended in the 2015 Dietary Guidelines. We doubt that further—and needed—major reductions in sodium will be achieved without government intervention, as recommended by the 2010 IOM report.21
Recommendations Lowering sodium is one of the most important dietary changes that Americans need to make—and there is responsibility in many quarters. Consumers need to read labels carefully and choose lower-‐sodium products—especially fresh fruits, vegetables, and other foods that are naturally low in sodium—for the sake of their own health. Restaurants and food processors need to lower the sodium content of their foods, for the sake of their customers’ health. And governments—federal, state, and local—need to develop programs and adopt regulations that would decrease the sodium content of the food supply, for the sake of the public’s health. The federal (or state/local) government should also consider the following measures:
• The most effective way to reduce sodium would be for the FDA and USDA (which regulates foods that contain meat or poultry) to set mandatory sodium limits for categories of processed foods and restaurant
674d27823dcf7083e6fbc6/2015-‐global-‐responsibility-‐report.pdf 21 Ibid. Institute of Medicine, 2010.
foods. The limits could be based on the levels in the lowest-‐sodium foods, or on the median sodium content, in each category. Companies would be given several years to comply. Judging from the wide variation in sodium levels in competing brands of the same products, many companies could reduce levels significantly and easily, while other companies might already be using the least amount of sodium possible. Once companies were in compliance, the limits would be reduced further until Americans were consuming safe levels of sodium.
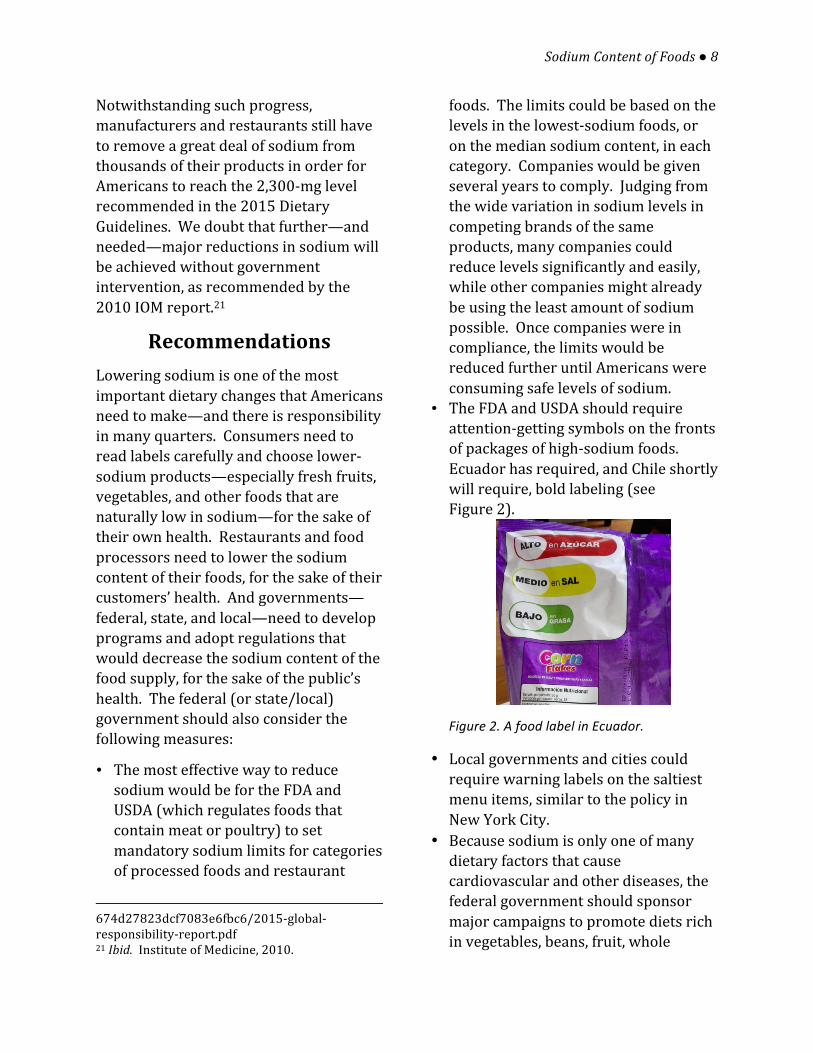
• The FDA and USDA should require attention-‐getting symbols on the fronts of packages of high-‐sodium foods. Ecuador has required, and Chile shortly will require, bold labeling (see Figure 2).
Figure 2. A food label in Ecuador.
• Local governments and cities could require warning labels on the saltiest menu items, similar to the policy in New York City.
• Because sodium is only one of many dietary factors that cause cardiovascular and other diseases, the federal government should sponsor major campaigns to promote diets rich in vegetables, beans, fruit, whole
Sodium Content of Foods ● 9
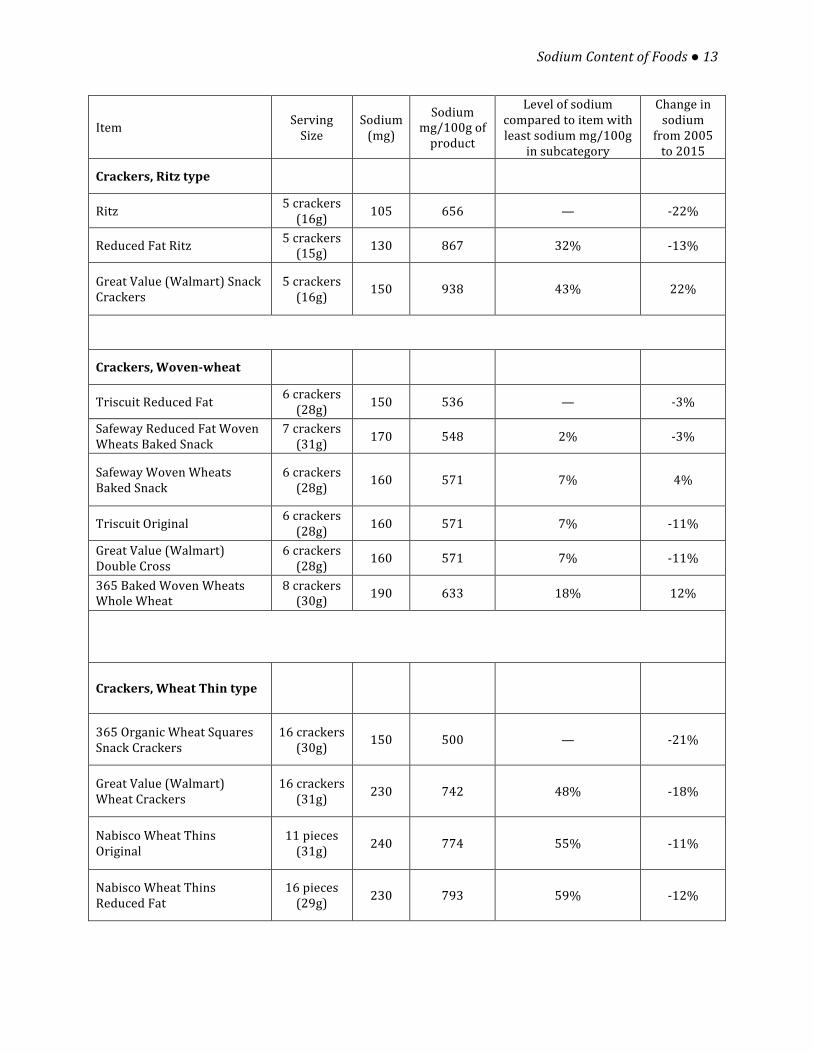
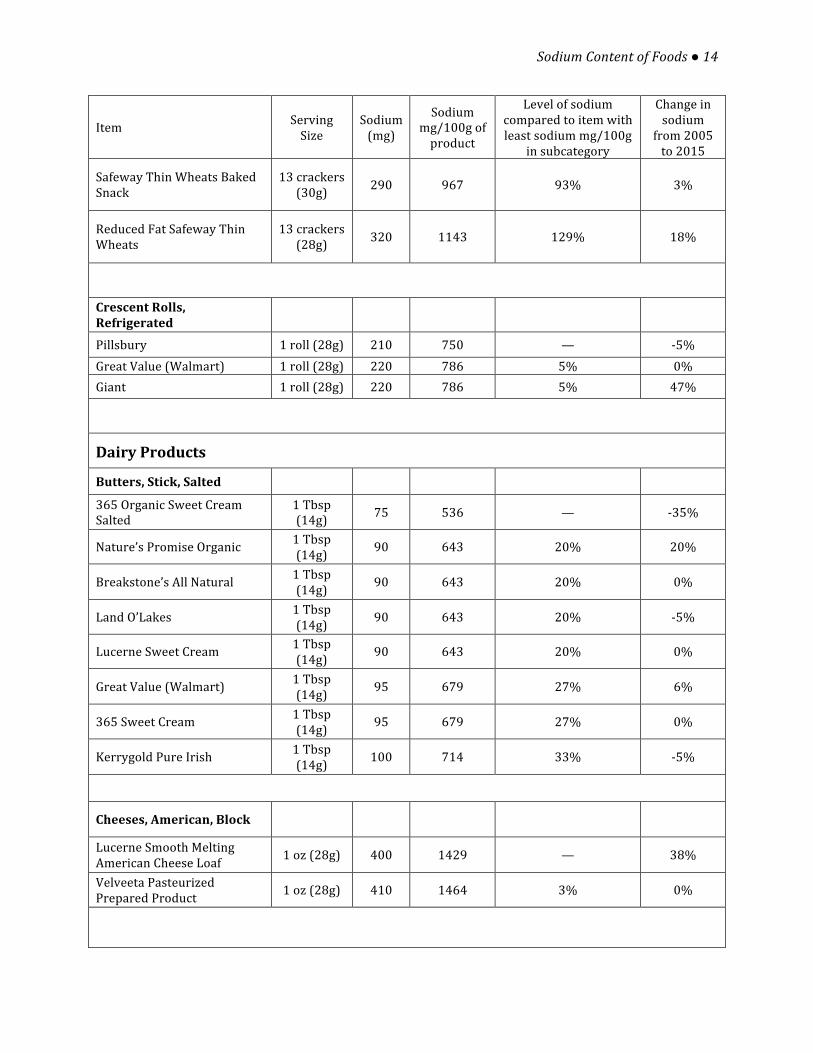
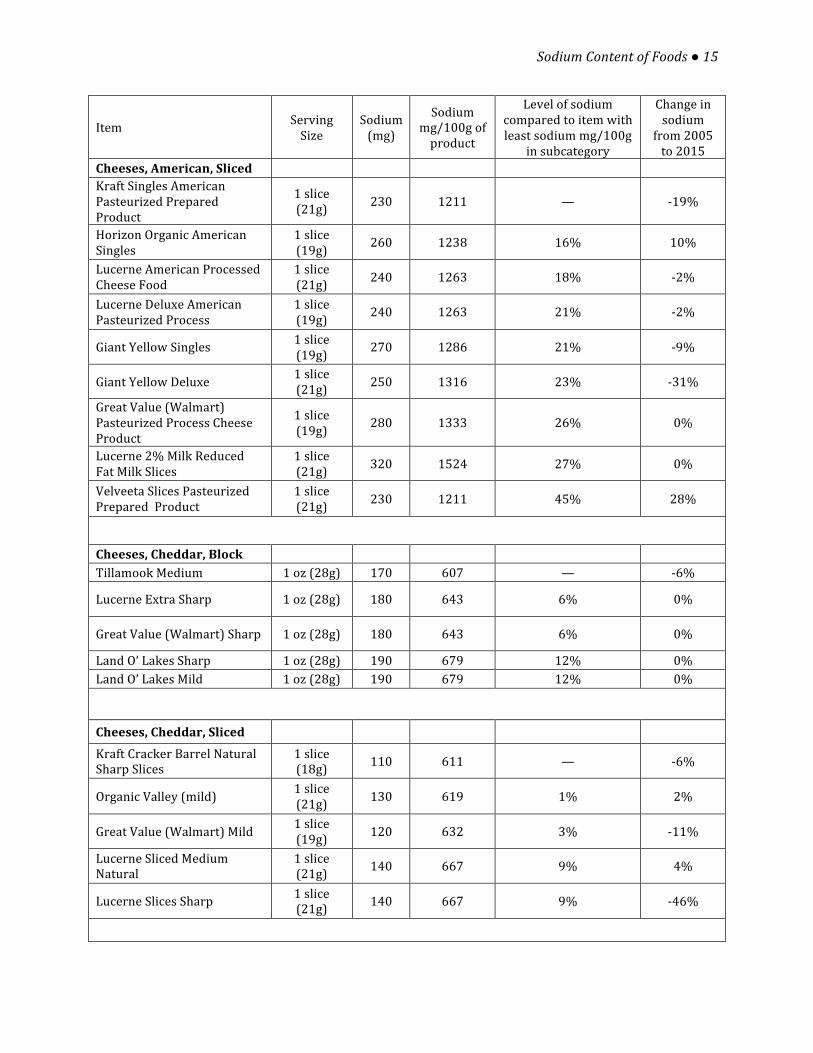
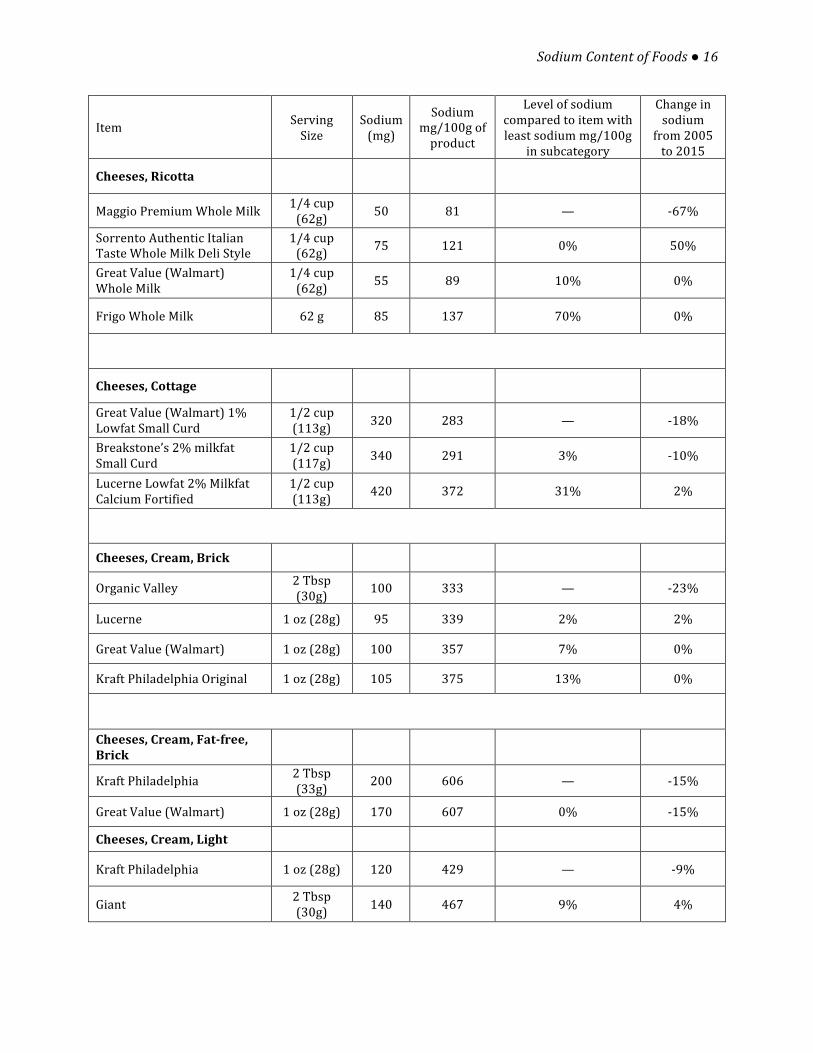
Notes about the Table
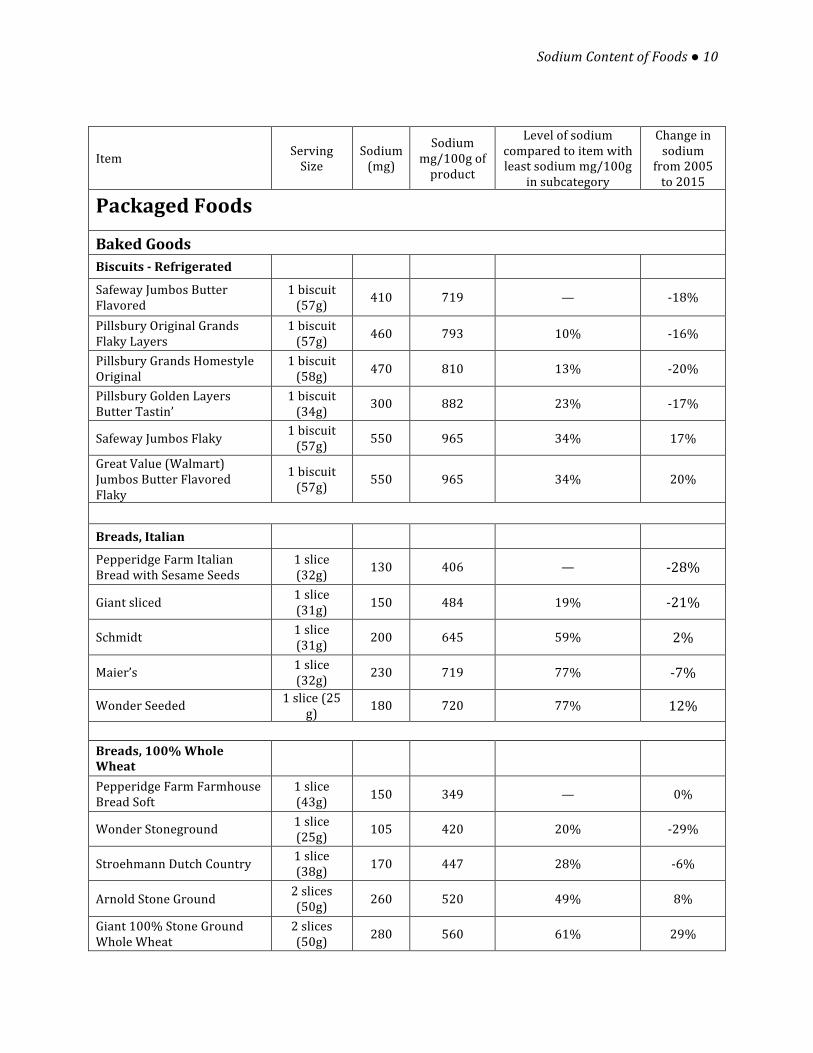
The Table on the following pages compares (a) the sodium content of various brands of the same type of food and (b) the change in sodium content (in terms of milligrams per 100 grams) between 2005 (2007 for Walmart products) and 2015. Most products listed were identified in 2005 as a convenience sample; the sample is not statistically representative of all foods in grocery stores or restaurants. Further details about the study are described in a paper by M.F. Jacobson, S. Havas, and R. McCarter in JAMA Internal Medicine May 2013, 173(14):1285–91). Some numbers and averages shown in this report and that paper might differ slightly because of corrections and the different statistical methods that were used.
The data were gathered primarily from food labels; when products could not be found in stores, CSPI called the manufacturers. Information about restaurant foods was obtained from companies’ websites. In a few cases, manufacturers informed CSPI that the names, but not the products themselves, were changed since 2005. The sodium content of several Giant Foods (a large mid-‐Atlantic supermarket chain owned by Ahold) products varies depending on package size because of rounding and other factors. In categories where some brands listed the weight (grams) and others listed the volume (milliliters), we assumed that one milliliter weighed one gram.
In some cases, the apparent changes between 2005 and 2011 might not be real because companies might have reanalyzed their products or corrected errors. Finally, CSPI regrets any errors it might have made in compiling these data and invites companies to send any corrections to [email protected].
grains, nuts, and seafood, along with lean meat and poultry and fat-‐free or low-‐fat dairy products.
Sodium Content of Foods ● 10
Item Serving Size
Sodium (mg)
Sodium mg/100g of product
Level of sodium compared to item with least sodium mg/100g
in subcategory
Change in sodium
from 2005 to 2015
Packaged Foods
Baked Goods Biscuits -‐ Refrigerated
Safeway Jumbos Butter Flavored
1 biscuit (57g) 410 719 — -‐18%
Pillsbury Original Grands Flaky Layers
1 biscuit (57g) 460 793 10% -‐16%
Pillsbury Grands Homestyle Original
1 biscuit (58g) 470 810 13% -‐20%
Pillsbury Golden Layers Butter Tastin’
1 biscuit (34g) 300 882 23% -‐17%
Safeway Jumbos Flaky 1 biscuit (57g) 550 965 34% 17%
Great Value (Walmart) Jumbos Butter Flavored Flaky
1 biscuit (57g) 550 965 34% 20%
Breads, Italian
Pepperidge Farm Italian Bread with Sesame Seeds
1 slice (32g) 130 406 — -‐28%
Giant sliced 1 slice (31g) 150 484 19% -‐21%
Schmidt 1 slice (31g) 200 645 59% 2%
Maier’s 1 slice (32g) 230 719 77% -‐7%
Wonder Seeded 1 slice (25 g) 180 720 77% 12%
Breads, 100% Whole Wheat
Pepperidge Farm Farmhouse Bread Soft
1 slice (43g) 150 349 — 0%
Wonder Stoneground 1 slice (25g) 105 420 20% -‐29%
Stroehmann Dutch Country 1 slice (38g) 170 447 28% -‐6%
Arnold Stone Ground 2 slices (50g) 260 520 49% 8%
Giant 100% Stone Ground Whole Wheat
2 slices (50g) 280 560 61% 29%

Sodium Content of Foods ● 11
Item Serving Size
Sodium (mg)
Sodium mg/100g of product
Level of sodium compared to item with least sodium mg/100g
in subcategory
Change in sodium
from 2005 to 2015
Great Value (Walmart) 100% Whole Wheat Bread
1 slice (25g) 140 560 61% 12%
Schmidt Old Tyme 1 slice (25g) 150 600 72% 20%
Breads, White
Vermont Bread Company Soft All Natural
1 slice (34g) 115 338 — 0%
OvenJoy Enriched 2 slices (47g) 220 468 38% 1%
Sunbeam Sandwich 1 slice (26g) 125 481 42% -‐7%
Pepperidge Farm Family Size 2 slices (53g) 270 509 51% -‐13%
Great Value (Walmart) White Bread
1 slice (29g) 160 552 63% 10%
Pepperidge Farm Farmhouse Bread Hearty
1 slice (43g) 240 558 65% -‐14%
Arnold Brick Oven Premium 1 slice (33g) 190 576 70% 6%
Buns, Hamburger
Whole Foods Organic 1 bun (64g) 250 391 — 27%
Pepperidge Farm 1 bun (51g) 210 412 5% -‐20%
Pepperidge Farm Sandwich Buns with Sesame Seeds 1 bun (53g) 220 415 6% -‐13%
Great Value (Walmart) Enriched 1 bun (43g) 210 488 25% -‐9%
Wonder 1 bun (43g) 220 512 31% 0%
Giant Enriched 1 bun (43g) 220 512 31% -‐21%
Buns, Hot Dog
Pepperidge Farm 1 bun (50g) 210 420 — -‐22%
Wonder 1 bun (43g) 220 512 22% 0%

Sodium Content of Foods ● 12
Item Serving Size
Sodium (mg)
Sodium mg/100g of product
Level of sodium compared to item with least sodium mg/100g
in subcategory
Change in sodium
from 2005 to 2015
Great Value (Walmart) Enriched 1 bun (43g) 230 535 27% 0%
Potato Breads
Martin’s Famous Dutch Taste Sandwich
1 slice (32g) 115 359 — -‐4%
Stroehmann Dutch Country Potato Bread
1 slice (35g) 160 457 27% 0%
Potato Rolls
Martins Famous Dutch Taste Potato Sandwich Rolls 1 roll (53g) 180 340 — -‐10%
Martins Potato Party Rolls 3 rolls (53g) 190 358 6% 0%
Stroehmann Dutch Country Hot Dog Potato Rolls 1 roll (53g) 260 491 44% -‐4%
Schmidt’s Potato Rolls 1 roll (53g) 280 528 56% 47%
Crackers, Cheez-‐It type
Sunshine Cheez-‐Its Baked Snack
27 crackers (30g) 230 767 — -‐8%
Great Value (Walmart) Cheddar Cheese Baked Snack Crackers
28 crackers (30g) 230 767 0% -‐38%
365 Organic Cheese Cracker 27 crackers (30g) 270 900 17% -‐7%
Late July Cheddar Cheese Bite-‐Size
30 crackers (28g) 310 1107 44% 1%
Safeway Cheese Crackers 27 crackers (30g) 380 1267 65% 52%
Sodium Content of Foods ● 13
Item Serving Size
Sodium (mg)
Sodium mg/100g of product
Level of sodium compared to item with least sodium mg/100g
in subcategory
Change in sodium
from 2005 to 2015
Crackers, Ritz type
Ritz 5 crackers (16g) 105 656 — -‐22%
Reduced Fat Ritz 5 crackers (15g) 130 867 32% -‐13%
Great Value (Walmart) Snack Crackers
5 crackers (16g) 150 938 43% 22%
Crackers, Woven-‐wheat
Triscuit Reduced Fat 6 crackers (28g) 150 536 — -‐3%
Safeway Reduced Fat Woven Wheats Baked Snack
7 crackers (31g) 170 548 2% -‐3%
Safeway Woven Wheats Baked Snack
6 crackers (28g) 160 571 7% 4%
Triscuit Original 6 crackers (28g) 160 571 7% -‐11%
Great Value (Walmart) Double Cross
6 crackers (28g) 160 571 7% -‐11%
365 Baked Woven Wheats Whole Wheat
8 crackers (30g) 190 633 18% 12%
Crackers, Wheat Thin type
365 Organic Wheat Squares Snack Crackers
16 crackers (30g) 150 500 — -‐21%
Great Value (Walmart) Wheat Crackers
16 crackers (31g) 230 742 48% -‐18%
Nabisco Wheat Thins Original
11 pieces (31g) 240 774 55% -‐11%
Nabisco Wheat Thins Reduced Fat
16 pieces (29g) 230 793 59% -‐12%
Sodium Content of Foods ● 14
Item Serving Size
Sodium (mg)
Sodium mg/100g of product
Level of sodium compared to item with least sodium mg/100g
in subcategory
Change in sodium
from 2005 to 2015
Safeway Thin Wheats Baked Snack
13 crackers (30g) 290 967 93% 3%
Reduced Fat Safeway Thin Wheats
13 crackers (28g) 320 1143 129% 18%
Crescent Rolls, Refrigerated
Pillsbury 1 roll (28g) 210 750 — -‐5% Great Value (Walmart) 1 roll (28g) 220 786 5% 0% Giant 1 roll (28g) 220 786 5% 47%
Dairy Products
Butters, Stick, Salted
365 Organic Sweet Cream Salted
1 Tbsp (14g) 75 536 — -‐35%
Nature’s Promise Organic 1 Tbsp (14g) 90 643 20% 20%
Breakstone’s All Natural 1 Tbsp (14g) 90 643 20% 0%
Land O’Lakes 1 Tbsp (14g) 90 643 20% -‐5%
Lucerne Sweet Cream 1 Tbsp (14g) 90 643 20% 0%
Great Value (Walmart) 1 Tbsp (14g) 95 679 27% 6%
365 Sweet Cream 1 Tbsp (14g) 95 679 27% 0%
Kerrygold Pure Irish 1 Tbsp (14g) 100 714 33% -‐5%
Cheeses, American, Block
Lucerne Smooth Melting American Cheese Loaf 1 oz (28g) 400 1429 — 38%
Velveeta Pasteurized Prepared Product 1 oz (28g) 410 1464 3% 0%
Sodium Content of Foods ● 15
Item Serving Size
Sodium (mg)
Sodium mg/100g of product
Level of sodium compared to item with least sodium mg/100g
in subcategory
Change in sodium
from 2005 to 2015
Cheeses, American, Sliced Kraft Singles American Pasteurized Prepared Product
1 slice (21g) 230 1211 — -‐19%
Horizon Organic American Singles
1 slice (19g) 260 1238 16% 10%
Lucerne American Processed Cheese Food
1 slice (21g) 240 1263 18% -‐2%
Lucerne Deluxe American Pasteurized Process
1 slice (19g) 240 1263 21% -‐2%
Giant Yellow Singles 1 slice (19g) 270 1286 21% -‐9%
Giant Yellow Deluxe 1 slice (21g) 250 1316 23% -‐31%
Great Value (Walmart) Pasteurized Process Cheese Product
1 slice (19g) 280 1333 26% 0%
Lucerne 2% Milk Reduced Fat Milk Slices
1 slice (21g) 320 1524 27% 0%
Velveeta Slices Pasteurized Prepared Product
1 slice (21g) 230 1211 45% 28%
Cheeses, Cheddar, Block Tillamook Medium 1 oz (28g) 170 607 — -‐6%
Lucerne Extra Sharp 1 oz (28g) 180 643 6% 0%
Great Value (Walmart) Sharp 1 oz (28g) 180 643 6% 0%
Land O’ Lakes Sharp 1 oz (28g) 190 679 12% 0% Land O’ Lakes Mild 1 oz (28g) 190 679 12% 0%
Cheeses, Cheddar, Sliced Kraft Cracker Barrel Natural Sharp Slices
1 slice (18g) 110 611 — -‐6%
Organic Valley (mild) 1 slice (21g) 130 619 1% 2%
Great Value (Walmart) Mild 1 slice (19g) 120 632 3% -‐11%
Lucerne Sliced Medium Natural
1 slice (21g) 140 667 9% 4%
Lucerne Slices Sharp 1 slice (21g) 140 667 9% -‐46%
Sodium Content of Foods ● 16
Item Serving Size
Sodium (mg)
Sodium mg/100g of product
Level of sodium compared to item with least sodium mg/100g
in subcategory
Change in sodium
from 2005 to 2015
Cheeses, Ricotta
Maggio Premium Whole Milk 1/4 cup (62g) 50 81 — -‐67%
Sorrento Authentic Italian Taste Whole Milk Deli Style
1/4 cup (62g) 75 121 0% 50%
Great Value (Walmart) Whole Milk
1/4 cup (62g) 55 89 10% 0%
Frigo Whole Milk 62 g 85 137 70% 0%
Cheeses, Cottage
Great Value (Walmart) 1% Lowfat Small Curd
1/2 cup (113g) 320 283 — -‐18%
Breakstone’s 2% milkfat Small Curd
1/2 cup (117g) 340 291 3% -‐10%
Lucerne Lowfat 2% Milkfat Calcium Fortified
1/2 cup (113g) 420 372 31% 2%
Cheeses, Cream, Brick
Organic Valley 2 Tbsp (30g) 100 333 — -‐23%
Lucerne 1 oz (28g) 95 339 2% 2%
Great Value (Walmart) 1 oz (28g) 100 357 7% 0%
Kraft Philadelphia Original 1 oz (28g) 105 375 13% 0%
Cheeses, Cream, Fat-‐free, Brick
Kraft Philadelphia 2 Tbsp (33g) 200 606 — -‐15%
Great Value (Walmart) 1 oz (28g) 170 607 0% -‐15%
Cheeses, Cream, Light
Kraft Philadelphia 1 oz (28g) 120 429 — -‐9%
Giant 2 Tbsp (30g) 140 467 9% 4%
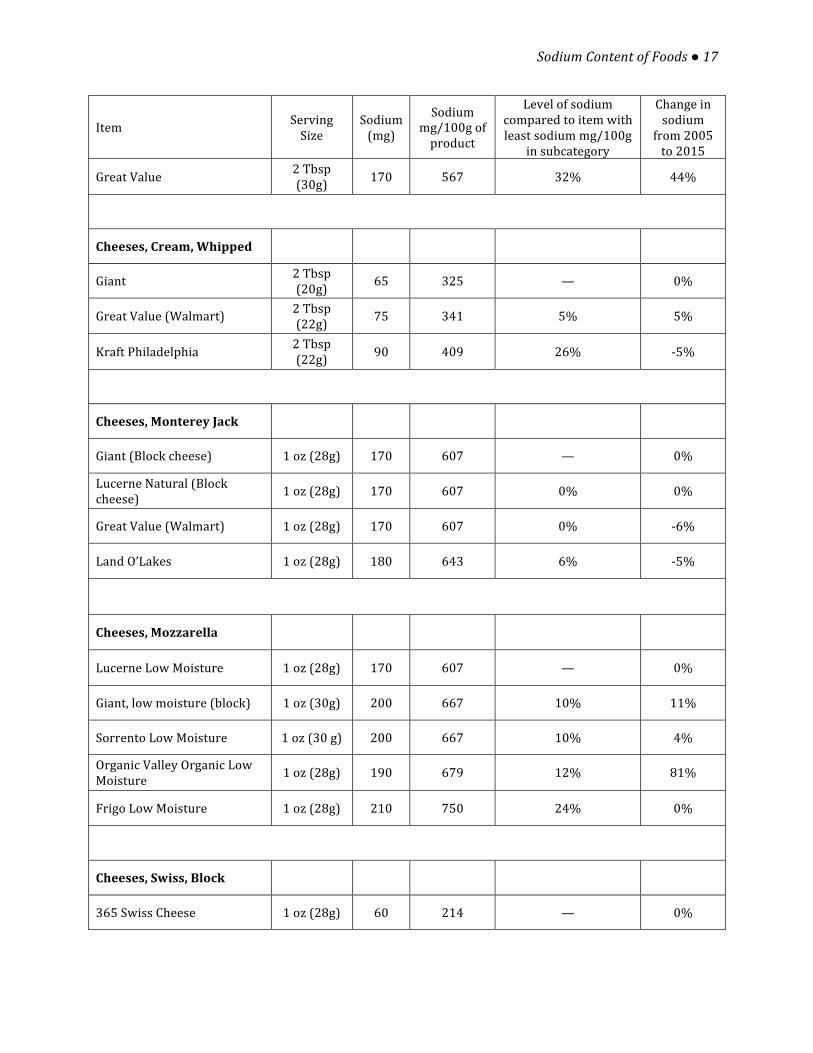
Sodium Content of Foods ● 17
Item Serving Size
Sodium (mg)
Sodium mg/100g of product
Level of sodium compared to item with least sodium mg/100g
in subcategory
Change in sodium
from 2005 to 2015
Great Value 2 Tbsp (30g) 170 567 32% 44%
Cheeses, Cream, Whipped
Giant 2 Tbsp (20g) 65 325 — 0%
Great Value (Walmart) 2 Tbsp (22g) 75 341 5% 5%
Kraft Philadelphia 2 Tbsp (22g) 90 409 26% -‐5%
Cheeses, Monterey Jack
Giant (Block cheese) 1 oz (28g) 170 607 — 0%
Lucerne Natural (Block cheese) 1 oz (28g) 170 607 0% 0%
Great Value (Walmart) 1 oz (28g) 170 607 0% -‐6%
Land O’Lakes 1 oz (28g) 180 643 6% -‐5%
Cheeses, Mozzarella
Lucerne Low Moisture 1 oz (28g) 170 607 — 0%
Giant, low moisture (block) 1 oz (30g) 200 667 10% 11%
Sorrento Low Moisture 1 oz (30 g) 200 667 10% 4%
Organic Valley Organic Low Moisture 1 oz (28g) 190 679 12% 81%
Frigo Low Moisture 1 oz (28g) 210 750 24% 0%
Cheeses, Swiss, Block
365 Swiss Cheese 1 oz (28g) 60 214 — 0%

Sodium Content of Foods ● 18
Item Serving Size
Sodium (mg)
Sodium mg/100g of product
Level of sodium compared to item with least sodium mg/100g
in subcategory
Change in sodium
from 2005 to 2015
Giant 1 oz (28g) 60 214 0% -‐54%
Great Value (Walmart) 1 oz (28g) 60 214 0% -‐54%
Cheeses, Swiss, Sliced
Great Value (Walmart) 1 slice (18g) 40 222 — -‐52%
Lucerne Sliced Natural 1 slice (21g) 50 238 7% 0%
Frozen Foods
Chicken, Fried, Dinners
Banquet Select Recipes (with mashed Potatoes and Corn)
1 meal (286g) 950 332 — -‐6%
Hungry Man Boneless (with Mashed Potatoes, Corn & a Brownie)
1 package (406g) 1830 451 36% -‐5%
Macaroni and Cheese
Stouffer’s Lean Cuisine 1 meal (283g) 560 198 — -‐14%
Weight Watchers Smart Ones 1 package (255g) 750 294 49% 4%
Banquet Meal 1 meal (227g) 760 335 69% -‐24%
Chicken, Nuggets
Banquet Chicken Breast 6 nuggets (85g) 440 518 — -‐6%
Great Value (Walmart) 5 nuggets (84g) 500 595 15% -‐23%
Chicken, Tenders
Banquet Chicken Breast Strips
2 strips (85g) 450 529 — -‐6%
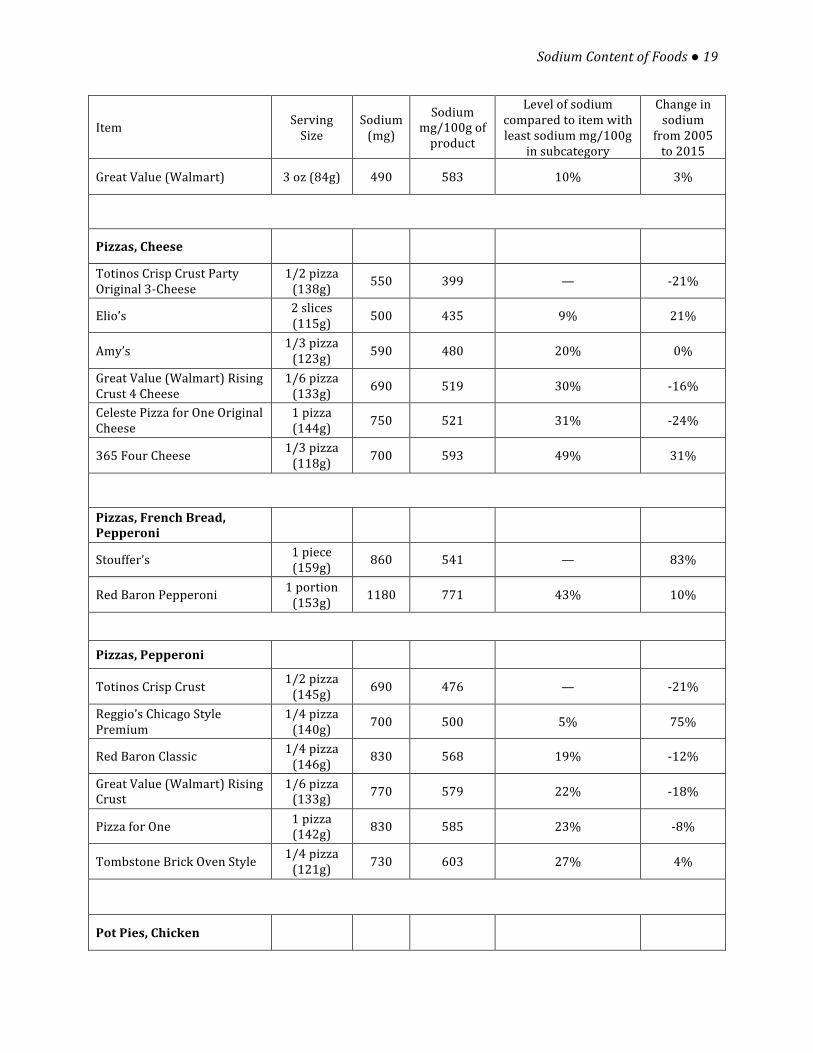
Sodium Content of Foods ● 19
Item Serving Size
Sodium (mg)
Sodium mg/100g of product
Level of sodium compared to item with least sodium mg/100g
in subcategory
Change in sodium
from 2005 to 2015
Great Value (Walmart) 3 oz (84g) 490 583 10% 3%
Pizzas, Cheese
Totinos Crisp Crust Party Original 3-‐Cheese
1/2 pizza (138g) 550 399 — -‐21%
Elio’s 2 slices (115g) 500 435 9% 21%
Amy’s 1/3 pizza (123g) 590 480 20% 0%
Great Value (Walmart) Rising Crust 4 Cheese
1/6 pizza (133g) 690 519 30% -‐16%
Celeste Pizza for One Original Cheese
1 pizza (144g) 750 521 31% -‐24%
365 Four Cheese 1/3 pizza (118g) 700 593 49% 31%
Pizzas, French Bread, Pepperoni
Stouffer’s 1 piece (159g) 860 541 — 83%
Red Baron Pepperoni 1 portion (153g) 1180 771 43% 10%
Pizzas, Pepperoni
Totinos Crisp Crust 1/2 pizza (145g) 690 476 — -‐21%
Reggio’s Chicago Style Premium
1/4 pizza (140g) 700 500 5% 75%
Red Baron Classic 1/4 pizza (146g) 830 568 19% -‐12%
Great Value (Walmart) Rising Crust
1/6 pizza (133g) 770 579 22% -‐18%
Pizza for One 1 pizza (142g) 830 585 23% -‐8%
Tombstone Brick Oven Style 1/4 pizza (121g) 730 603 27% 4%
Pot Pies, Chicken

Sodium Content of Foods ● 20
Item Serving Size
Sodium (mg)
Sodium mg/100g of product
Level of sodium compared to item with least sodium mg/100g
in subcategory
Change in sodium
from 2005 to 2015
Stouffer’s 1 cup (235g) 810 345 — -‐17%
Marie Callender’s 1 pie (283g) 990 350 1% -‐4%
Banquet 1 pie (198g) 780 394 14% -‐18%
Potatoes, Puffed
356 Tater Puffs 3 oz (84g) 330 393 — 39%
Ore-‐Ida Tater Tots 9 pieces (86g) 440 512 30% 5%
Taquitos, Chicken
Delimex Chicken 3 taquitos (85g) 340 400 —
17%
Meats
Bacons
Oscar Mayer Center Cut 2 slices, cooked (13g)
210 1615 — -‐28%
Oscar Mayer Hearty Thick Cut
2 slices, cooked (14g)
260 1857 15% -‐11%
Gwaltney Thick Sliced Virginia Cured
1 slice, fried (12g) 250 2083 29% 39%
Hormel Original 2 slices, pan fried (18g)
400 2222 38% 1%
Bacons, Smoked

Sodium Content of Foods ● 21
Item Serving Size
Sodium (mg)
Sodium mg/100g of product
Level of sodium compared to item with least sodium mg/100g
in subcategory
Change in sodium
from 2005 to 2015
Safeway Select Naturally Smoked Thick Sliced
2 slices, cooked (18g)
190 1056 — -‐26%
Jamestown Brand Hardwood Sliced 15 g 270 1800 71% -‐24%
Jimmy Dean Hickory Fully Cooked
4 slices (17g) 310 1824 73% 9%
Great Value (Walmart) Smoked
2 slices, fried (17g) 310 1824 73% -‐15%
Oscar Mayer Naturally Hardwood
2 slices, cooked (19g)
350 1842 75% -‐11%
Gwaltney Hardwood Smoked Premium Sliced
2 slices, fried (14g) 260 1857 76% 20%
Smithfield Naturally Hickory Smoked Center Cut
3 slices, cooked (15g)
280 1867 77% 3%
Smithfield Naturally Hickory Smoked
2 slices, cooked (19g)
360 1895 80% 2%
Bacons, Turkey
Oscar Mayer Smoked Cured 1 slice (15g) 140 933 — -‐27%
Butterball Thin & Crispy 2 slices (18g) 180 1000 7% -‐25%
Chickens, Fresh or Frozen
Perdue Chicken Split Breasts 4 oz raw (112g) 70 63 — 20%
Perdue Oven Stuffer Fresh Whole Roaster Breast with Ribs and Back
4 oz raw (112g) 75 67 7% 40%
Perdue Whole Chicken 4 oz raw (112g) 80 71 14% -‐29%
Perdue Drumsticks 4 oz raw (112g) 95 85 36% -‐21%
Super G Boneless Skinless Thighs
4 oz raw (112g) 120 107 71% 20%
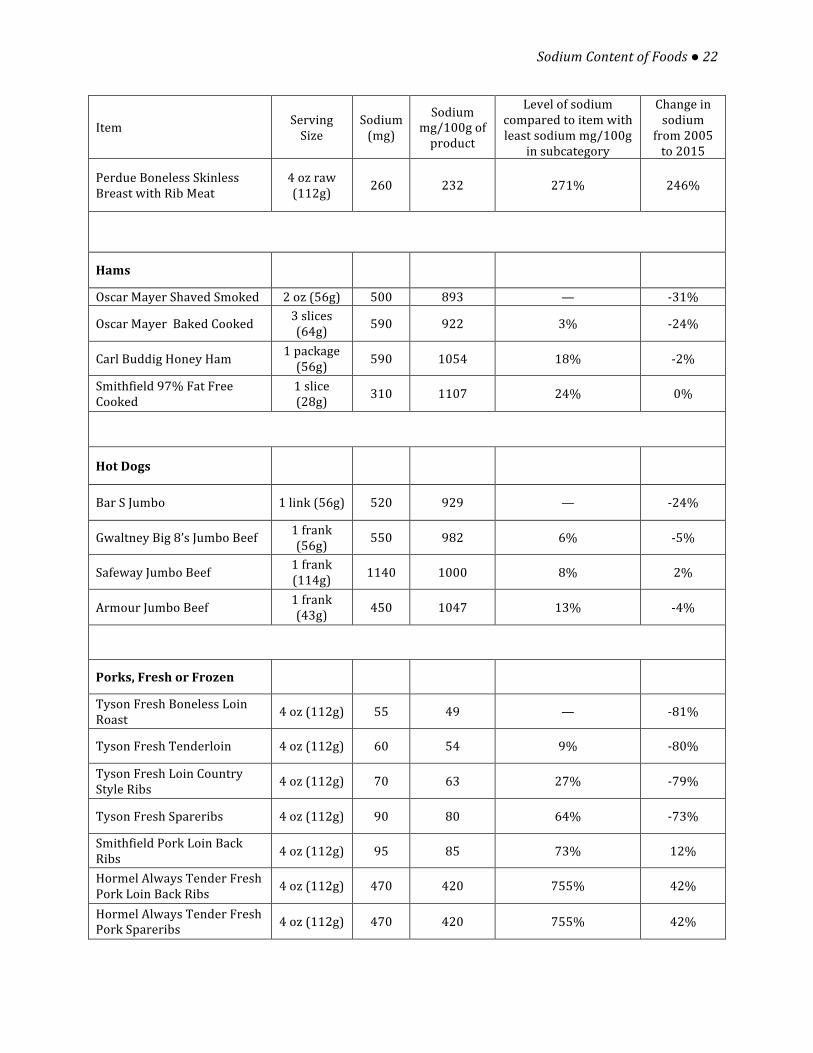
Sodium Content of Foods ● 22
Item Serving Size
Sodium (mg)
Sodium mg/100g of product
Level of sodium compared to item with least sodium mg/100g
in subcategory
Change in sodium
from 2005 to 2015
Perdue Boneless Skinless Breast with Rib Meat
4 oz raw (112g) 260 232 271% 246%
Hams
Oscar Mayer Shaved Smoked 2 oz (56g) 500 893 — -‐31%
Oscar Mayer Baked Cooked 3 slices (64g) 590 922 3% -‐24%
Carl Buddig Honey Ham 1 package (56g) 590 1054 18% -‐2%
Smithfield 97% Fat Free Cooked
1 slice (28g) 310 1107 24% 0%
Hot Dogs
Bar S Jumbo 1 link (56g) 520 929 — -‐24%
Gwaltney Big 8’s Jumbo Beef 1 frank (56g) 550 982 6% -‐5%
Safeway Jumbo Beef 1 frank (114g) 1140 1000 8% 2%
Armour Jumbo Beef 1 frank (43g) 450 1047 13% -‐4%
Porks, Fresh or Frozen
Tyson Fresh Boneless Loin Roast 4 oz (112g) 55 49 — -‐81%
Tyson Fresh Tenderloin 4 oz (112g) 60 54 9% -‐80%
Tyson Fresh Loin Country Style Ribs 4 oz (112g) 70 63 27% -‐79%
Tyson Fresh Spareribs 4 oz (112g) 90 80 64% -‐73%
Smithfield Pork Loin Back Ribs 4 oz (112g) 95 85 73% 12%
Hormel Always Tender Fresh Pork Loin Back Ribs 4 oz (112g) 470 420 755% 42%
Hormel Always Tender Fresh Pork Spareribs 4 oz (112g) 470 420 755% 42%
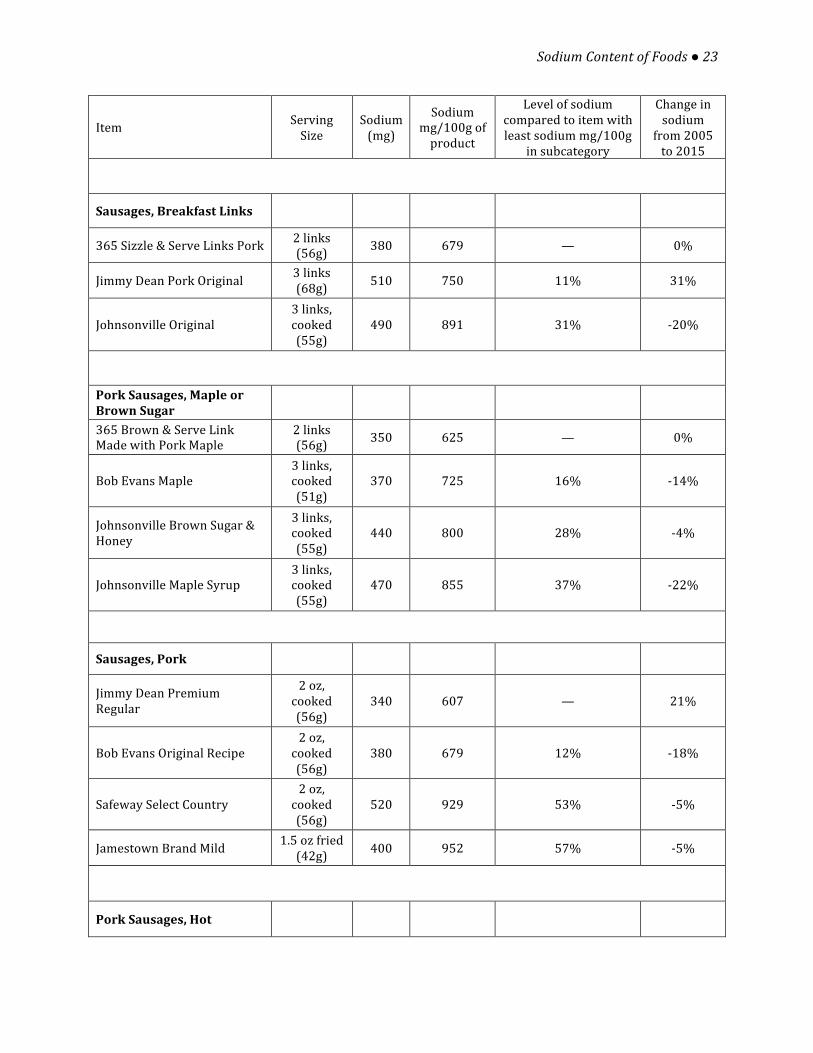
Sodium Content of Foods ● 23
Item Serving Size
Sodium (mg)
Sodium mg/100g of product
Level of sodium compared to item with least sodium mg/100g
in subcategory
Change in sodium
from 2005 to 2015
Sausages, Breakfast Links
365 Sizzle & Serve Links Pork 2 links (56g) 380 679 — 0%
Jimmy Dean Pork Original 3 links (68g) 510 750 11% 31%
Johnsonville Original 3 links, cooked (55g)
490 891 31% -‐20%
Pork Sausages, Maple or Brown Sugar
365 Brown & Serve Link Made with Pork Maple
2 links (56g) 350 625 — 0%
Bob Evans Maple 3 links, cooked (51g)
370 725 16% -‐14%
Johnsonville Brown Sugar & Honey
3 links, cooked (55g)
440 800 28% -‐4%
Johnsonville Maple Syrup 3 links, cooked (55g)
470 855 37% -‐22%
Sausages, Pork
Jimmy Dean Premium Regular
2 oz, cooked (56g)
340 607 — 21%
Bob Evans Original Recipe 2 oz, cooked (56g)
380 679 12% -‐18%
Safeway Select Country 2 oz, cooked (56g)
520 929 53% -‐5%
Jamestown Brand Mild 1.5 oz fried (42g) 400 952 57% -‐5%
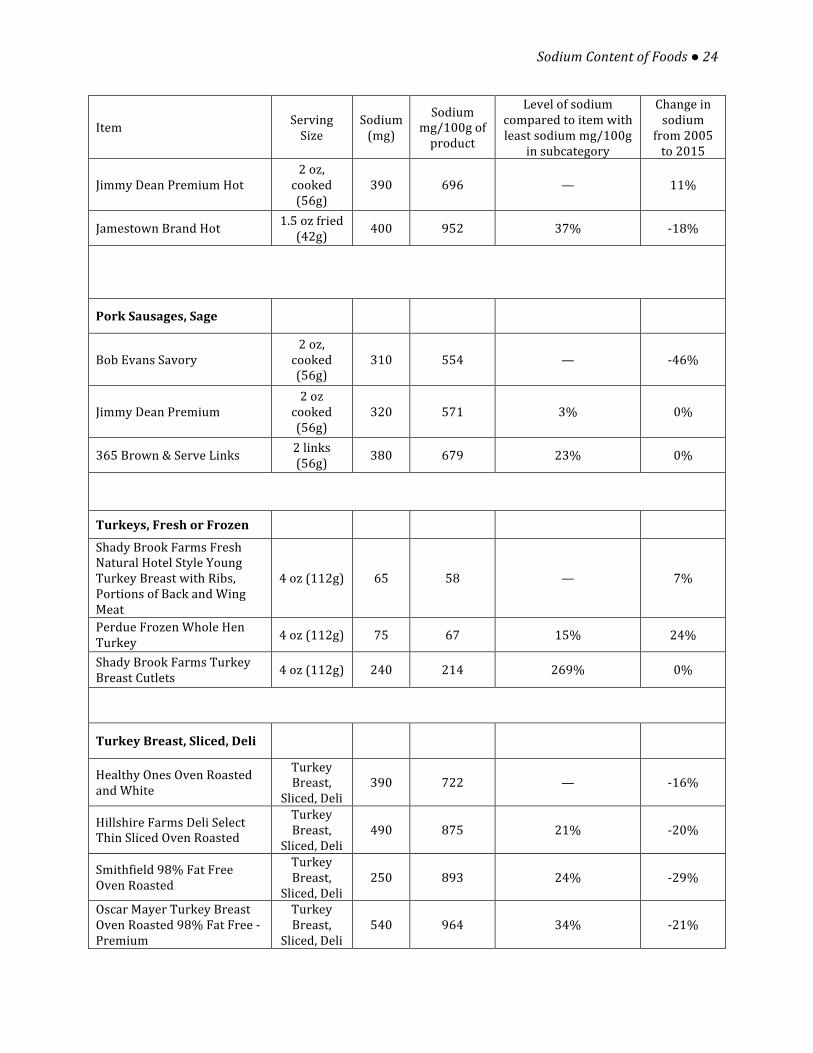
Pork Sausages, Hot
Sodium Content of Foods ● 24
Item Serving Size
Sodium (mg)
Sodium mg/100g of product
Level of sodium compared to item with least sodium mg/100g
in subcategory
Change in sodium
from 2005 to 2015
Jimmy Dean Premium Hot 2 oz, cooked (56g)
390 696 — 11%
Jamestown Brand Hot 1.5 oz fried (42g) 400 952 37% -‐18%
Pork Sausages, Sage
Bob Evans Savory 2 oz, cooked (56g)
310 554 — -‐46%
Jimmy Dean Premium 2 oz
cooked (56g)
320 571 3% 0%
365 Brown & Serve Links 2 links (56g) 380 679 23% 0%
Turkeys, Fresh or Frozen
Shady Brook Farms Fresh Natural Hotel Style Young Turkey Breast with Ribs, Portions of Back and Wing Meat
4 oz (112g) 65 58 — 7%
Perdue Frozen Whole Hen Turkey 4 oz (112g) 75 67 15% 24%
Shady Brook Farms Turkey Breast Cutlets 4 oz (112g) 240 214 269% 0%
Turkey Breast, Sliced, Deli
Healthy Ones Oven Roasted and White
Turkey Breast,
Sliced, Deli 390 722 — -‐16%
Hillshire Farms Deli Select Thin Sliced Oven Roasted
Turkey Breast,
Sliced, Deli 490 875 21% -‐20%
Smithfield 98% Fat Free Oven Roasted
Turkey Breast,
Sliced, Deli 250 893 24% -‐29%
Oscar Mayer Turkey Breast Oven Roasted 98% Fat Free -‐ Premium
Turkey Breast,
Sliced, Deli 540 964 34% -‐21%

Sodium Content of Foods ● 25
Item Serving Size
Sodium (mg)
Sodium mg/100g of product
Level of sodium compared to item with least sodium mg/100g
in subcategory
Change in sodium
from 2005 to 2015
Oscar Mayer Oven Roasted Turkey Breast,
Sliced, Deli 540 964 34% -‐20%
Butterball Smoked Thick Sliced 98% Fat Free
Turkey Breast,
Sliced, Deli 550 982 36% 10%
Carl Buddig Oven Roasted Thin Sliced Lean
Turkey Breast,
Sliced, Deli 600 1071 48% 0%
Carl Buddig Honey Turkey Turkey Breast,
Sliced, Deli 600 1071 48% -‐21%
Prepared Foods
Macaroni and Cheese
Giant Dinner 1/3 box, 2.5 oz (70g)
440 629 — -‐17%
Nature’s Promise Macaroni and Cheese Organic
2.5 oz, 1 cup (71g) 540 761 21% -‐5%
Kraft Dinner The Cheesiest 1/6 box, 1 cup (70g) 570 814 30% -‐5%
Great Value (Walmart) Premium Macaroni and Cheese
3.5 oz, 1/4 box (99g) 850 859 37% -‐2%
Breakfast Cereals
Barbara’s Honey Nut O’s 3/4 cup (30g) 80 267 — 7%
General Mills Frosted Cheerios
3/4 cup (27g) 150 556 108% -‐18%
Salad Dressings Salad Dressings, Blue Cheese
Kraft Roka Brand Blue Cheese Salad Dressing
2 Tbsp (30g) 250 833 — -‐17%
Wishbone Light 2 Tbsp (30g) 280 933 12% -‐10%
Ken’s Steakhouse Lite Chunky Blue Cheese Dressing
2 Tbsp (31g) 370 1194 43% 5%
Sodium Content of Foods ● 26
Item Serving Size
Sodium (mg)
Sodium mg/100g of product
Level of sodium compared to item with least sodium mg/100g
in subcategory
Change in sodium
from 2005 to 2015
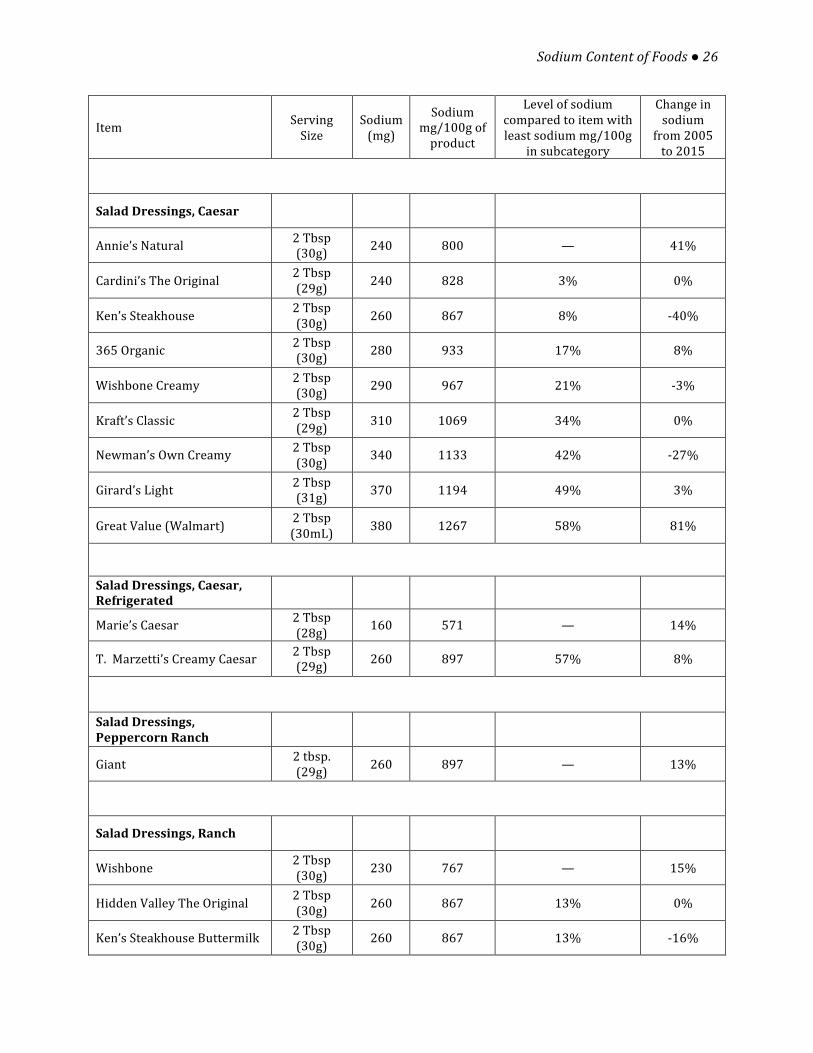
Salad Dressings, Caesar
Annie’s Natural 2 Tbsp (30g) 240 800 — 41%
Cardini’s The Original 2 Tbsp (29g) 240 828 3% 0%
Ken’s Steakhouse 2 Tbsp (30g) 260 867 8% -‐40%
365 Organic 2 Tbsp (30g) 280 933 17% 8%
Wishbone Creamy 2 Tbsp (30g) 290 967 21% -‐3%
Kraft’s Classic 2 Tbsp (29g) 310 1069 34% 0%
Newman’s Own Creamy 2 Tbsp (30g) 340 1133 42% -‐27%
Girard’s Light 2 Tbsp (31g) 370 1194 49% 3%
Great Value (Walmart) 2 Tbsp (30mL) 380 1267 58% 81%
Salad Dressings, Caesar, Refrigerated
Marie’s Caesar 2 Tbsp (28g) 160 571 — 14%
T. Marzetti’s Creamy Caesar 2 Tbsp (29g) 260 897 57% 8%
Salad Dressings, Peppercorn Ranch
Giant 2 tbsp. (29g) 260 897 — 13%
Salad Dressings, Ranch
Wishbone 2 Tbsp (30g) 230 767 — 15%
Hidden Valley The Original 2 Tbsp (30g) 260 867 13% 0%
Ken’s Steakhouse Buttermilk 2 Tbsp (30g) 260 867 13% -‐16%

Sodium Content of Foods ● 27
Item Serving Size
Sodium (mg)
Sodium mg/100g of product
Level of sodium compared to item with least sodium mg/100g
in subcategory
Change in sodium
from 2005 to 2015
Hidden Valley Light Topping & Dressing
2 Tbsp (30g) 260 867 13% -‐7%
Kraft 2 Tbsp (29g) 260 897 17% -‐13%
Great Value (Walmart) Buttermilk
2 Tbsp (30mL) 290 967 26% -‐24%
Giant 2 Tbsp (29g) 300 1034 35% 43%
Salad Dressings, Thousand-‐Island
Kraft Fat Free 2 Tbsp (37g) 260 703 — -‐11%
Giant 2 Tbsp (31g) 300 968 38% 16%
Ken’s Steakhouse 2 Tbsp (30g) 300 1000 42% 0%
Great Value (Walmart) 2 Tbsp (30mL) 300 1000 42% -‐6%
Sauces
BBQ Sauces, Original
KC Masterpiece Premium 2 Tbsp (36g) 240 667 — 0%
Kraft 2 Tbsp (35g) 270 771 16% -‐38%
Bull’s-‐Eye 2 Tbsp (36g) 280 778 17% -‐15%
Squeezable Sweet Baby Ray’s Award Winning
2 Tbsp (37g) 290 784 18% -‐3%
Giant 2 Tbsp (37g) 300 811 22% -‐25%
Great Value (Walmart) 2 Tbsp (36g) 440 1222 83% 12%
Original Open Pit 2 Tbsp (34g) 510 1500 125% 33%
BBQ Sauces, Honey

Sodium Content of Foods ● 28
Item Serving Size
Sodium (mg)
Sodium mg/100g of product
Level of sodium compared to item with least sodium mg/100g
in subcategory
Change in sodium
from 2005 to 2015
Squeezable Sweet Baby Ray’s Award Winning
2 Tbsp (37g) 300 811 — 0%
Giant 2 Tbsp (37g) 300 811 0% -‐9%
Kraft 2 Tbsp (37g) 350 946 17% -‐5%
Great Value (Walmart) 2 Tbsp (36g) 360 1000 23% 13%
Ketchups
Annie’s Organic 1 Tbsp (17g) 130 765 — -‐13%
365 1 Tbsp (17g) 160 941 23% 0%
Heinz 1 Tbsp (17g) 160 941 23% -‐16%
Great Value (Walmart) 1 Tbsp (17g) 160 941 23% -‐16%
Heinz Organic 1 Tbsp (17g) 190 1118 46% 0%
Salsas, Medium
Drew’s All Natural 2 Tbsp (28g) 90 321 — -‐10%
Muir Glen Organic 2 Tbsp (31g) 100 323 0% -‐26%
Chi Chi’s Fiesta Thick & Chunky
2 Tbsp (30g) 150 500 56% 0%
Whole Foods 2 Tbsp (30g) 150 500 56% -‐20%
Safeway Southwest 2 Tbsp (28g) 150 536 67% 0%
Old El Paso Thick N’ Chunky 2 Tbsp (30g) 200 667 107% -‐13%
Tostitos 2 Tbsp (33g) 250 758 136% -‐4%
Herdez Salsa Casera 2 Tbsp (31g) 240 774 141% -‐11%
Salsas, Mild

Sodium Content of Foods ● 29
Item Serving Size
Sodium (mg)
Sodium mg/100g of product
Level of sodium compared to item with least sodium mg/100g
in subcategory
Change in sodium
from 2005 to 2015
Muir Glen Organic 2 Tbsp (31g) 100 323 — -‐26%
Chi Chi’s Fiesta Thick & Chunky
2 Tbsp (30g) 150 500 55% 0%
Whole Foods 2 Tbsp (30g) 150 500 55% -‐20%
Safeway Southwest Salsa Mild
2 Tbsp (28g) 150 536 66% 0%
Old El Paso Thick N’ Chunky 2 Tbsp (30g) 200 667 107% -‐13%
Tostitos 2 Tbsp (33g) 250 758 135% -‐4%
Pace Chunky 2 Tbsp (30g) 230 767 138% -‐4%
Great Value Thick & Chunky 2 Tbsp (31g) 240 774 140% 0%
Sauces, Spaghetti
Walnut Acres Organic Marinara & Herbs
1/2 cup (125g) 330 264 — 0%
Bertolli Marinara with Burgundy Wine
1/2 cup (126g) 400 317 20% -‐25%
Barilla Marinara Tomato & Basil
1/2 cup (125g) 410 328 24% -‐18%
365 Marinara 1/2 cup (118g) 400 339 28% -‐20%
Classico Traditional Favorites Tomato & Basil
1/2 cup (125g) 430 344 30% 39%
Giant Traditional 1/2 cup (124g) 440 355 34% -‐39%
Francesco Rinaldi Original Traditional
1/2 cup (124g) 450 363 37% -‐30%
Newman’s Own Marinara 1/2 cup (125g) 460 368 39% -‐10%
Great Value (Walmart) Traditional
1/2 cup (125g) 470 376 42% -‐4%
365 Organic 1/2 cup (118g) 450 381 44% 77%
Ragu Old World Style Traditional
1/2 cup (125g) 480 384 45% -‐38%
Amy’s Organic Family Marinara Pasta Sauce
1/2 cup (125g) 590 472 79% 0%
Sodium Content of Foods ● 30
Item Serving Size
Sodium (mg)
Sodium mg/100g of product
Level of sodium compared to item with least sodium mg/100g
in subcategory
Change in sodium
from 2005 to 2015
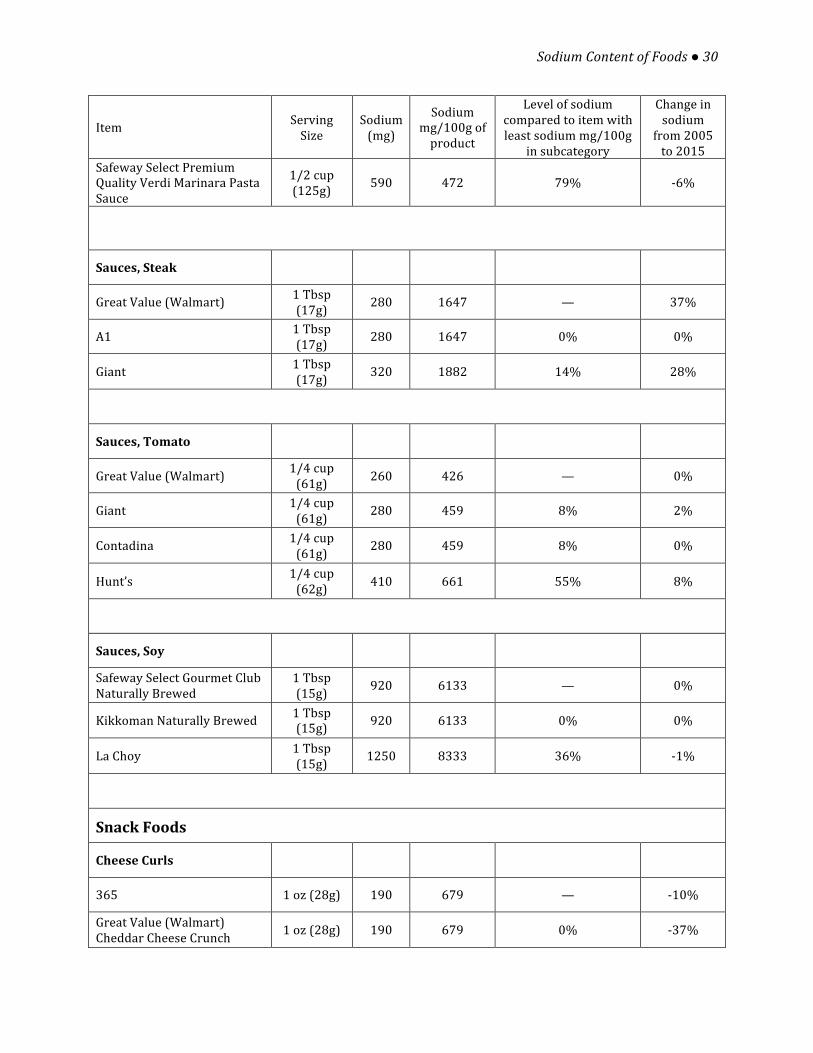
Safeway Select Premium Quality Verdi Marinara Pasta Sauce
1/2 cup (125g) 590 472 79% -‐6%
Sauces, Steak
Great Value (Walmart) 1 Tbsp (17g) 280 1647 — 37%
A1 1 Tbsp (17g) 280 1647 0% 0%
Giant 1 Tbsp (17g) 320 1882 14% 28%
Sauces, Tomato
Great Value (Walmart) 1/4 cup (61g) 260 426 — 0%
Giant 1/4 cup (61g) 280 459 8% 2%
Contadina 1/4 cup (61g) 280 459 8% 0%
Hunt’s 1/4 cup (62g) 410 661 55% 8%
Sauces, Soy
Safeway Select Gourmet Club Naturally Brewed
1 Tbsp (15g) 920 6133 — 0%
Kikkoman Naturally Brewed 1 Tbsp (15g) 920 6133 0% 0%
La Choy 1 Tbsp (15g) 1250 8333 36% -‐1%
Snack Foods
Cheese Curls
365 1 oz (28g) 190 679 — -‐10%
Great Value (Walmart) Cheddar Cheese Crunch 1 oz (28g) 190 679 0% -‐37%

Sodium Content of Foods ● 31
Item Serving Size
Sodium (mg)
Sodium mg/100g of product
Level of sodium compared to item with least sodium mg/100g
in subcategory
Change in sodium
from 2005 to 2015
Barbara’s Bakery Cheese Puffed Bakes
1/2 cup (28g) 200 714 5% 5%
Crunchitos Extra Cheddar Baked 1 oz (28g) 200 714 5% -‐26%
Cheetos Crunchy 21 pieces (28g) 250 893 32% -‐14%
Utz 14 curls, 1 oz (28g) 260 929 37% 0%
Bachman 20 curls (28g) 260 929 37% -‐27%
Michael Season’s Ultimate White Cheddar Cheese Puffs
1 1/2 cup (28g) 270 964 42% 0%
Potato Chips and Crisps
Utz Kettle Classics Regular 1 oz, 20 chips (28g) 120 429 — 26%
Grandma Utz’s Handcooked 20 chips, 1 oz (28 g) 120 429 0% 1%
Kettle Chips, Baked with Sea Salt
20 chips, 1 oz (28g) 125 446 4% -‐22%
Great Value (Walmart) Original
1 oz, 24 chips (28g) 135 482 13% -‐16%
Lay’s Wavy Original 11 chips, 1 oz (28g) 140 500 17% -‐22%
Pringles Original (crisps) 16 crisps, 1 oz (28g) 150 536 25% -‐12%
Ruffles Original 12 chips, 1 oz (28g) 160 571 33% 0%
Lay’s Classic 15 chips, 1 oz (28g) 170 607 42% -‐6%
Potato Chips, Lightly Salted
Kettle Chips Natural Gourmet with Sea Salt
13 chips (28g) 115 411 — 5%
Sodium Content of Foods ● 32
Item Serving Size
Sodium (mg)
Sodium mg/100g of product
Level of sodium compared to item with least sodium mg/100g
in subcategory
Change in sodium
from 2005 to 2015
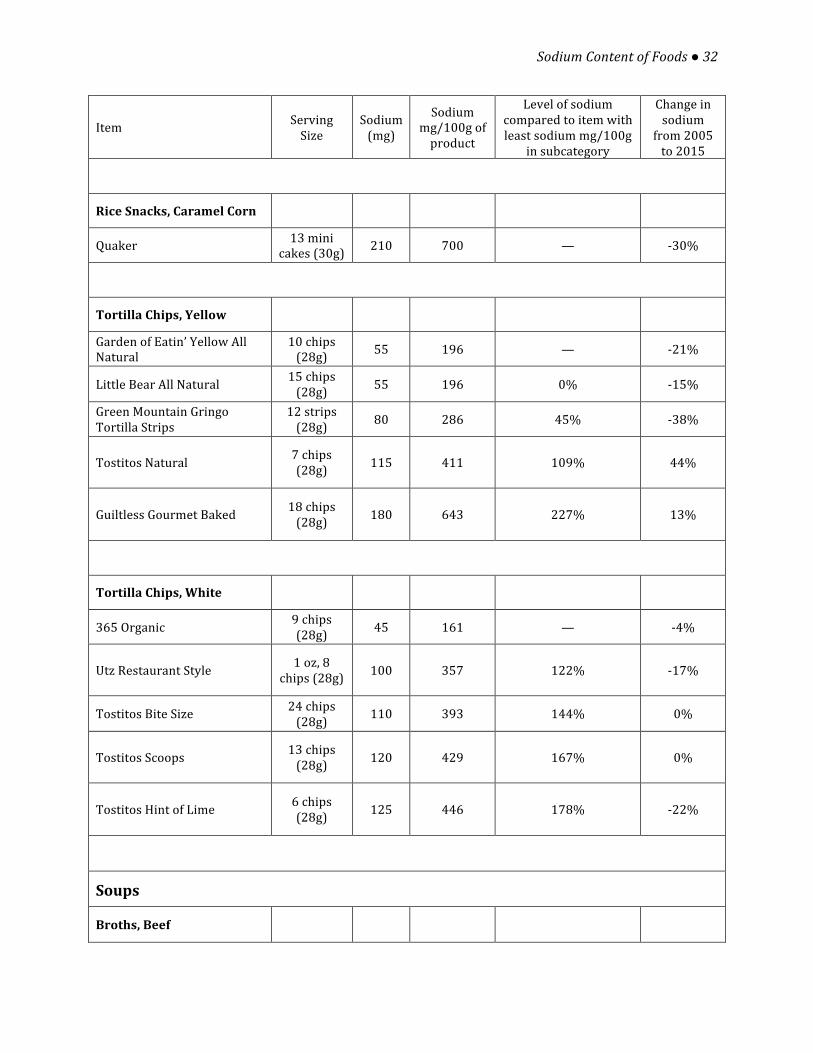
Rice Snacks, Caramel Corn
Quaker 13 mini cakes (30g) 210 700 — -‐30%
Tortilla Chips, Yellow
Garden of Eatin’ Yellow All Natural
10 chips (28g) 55 196 — -‐21%
Little Bear All Natural 15 chips (28g) 55 196 0% -‐15%
Green Mountain Gringo Tortilla Strips
12 strips (28g) 80 286 45% -‐38%
Tostitos Natural 7 chips (28g) 115 411 109% 44%
Guiltless Gourmet Baked 18 chips (28g) 180 643 227% 13%
Tortilla Chips, White
365 Organic 9 chips (28g) 45 161 — -‐4%
Utz Restaurant Style 1 oz, 8 chips (28g) 100 357 122% -‐17%
Tostitos Bite Size 24 chips (28g) 110 393 144% 0%
Tostitos Scoops 13 chips (28g) 120 429 167% 0%
Tostitos Hint of Lime 6 chips (28g) 125 446 178% -‐22%
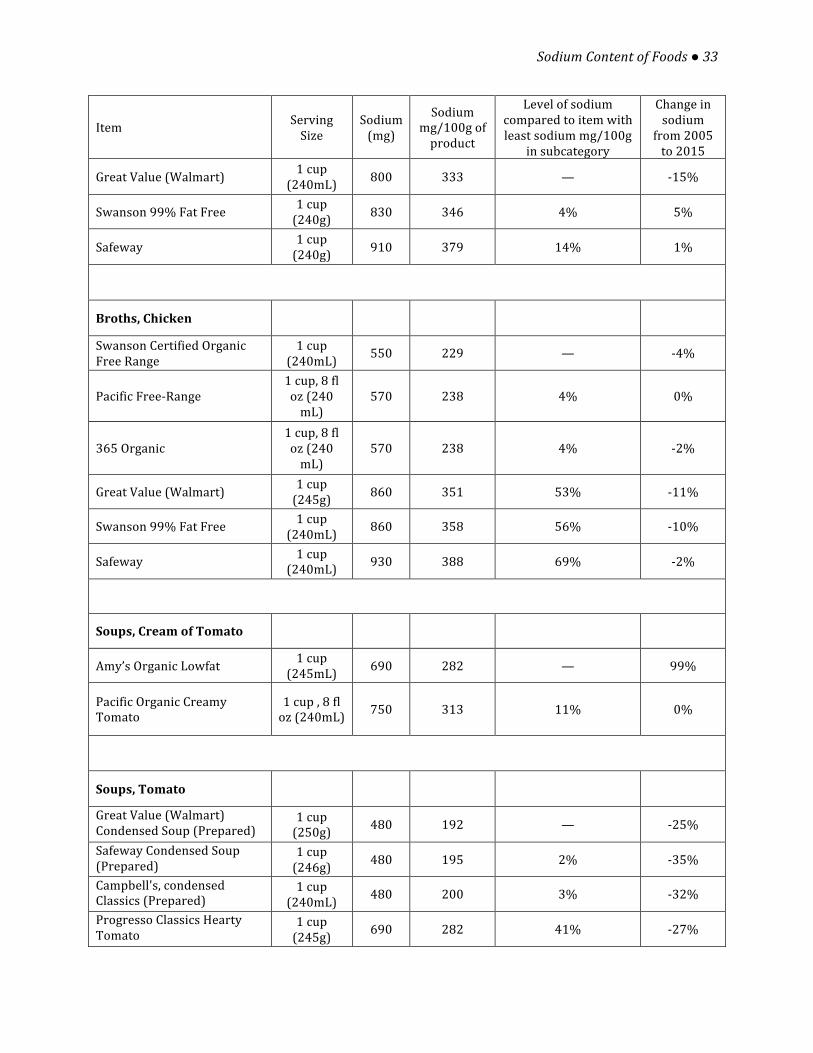
Soups
Broths, Beef
Sodium Content of Foods ● 33
Item Serving Size
Sodium (mg)
Sodium mg/100g of product
Level of sodium compared to item with least sodium mg/100g
in subcategory
Change in sodium
from 2005 to 2015
Great Value (Walmart) 1 cup (240mL) 800 333 — -‐15%
Swanson 99% Fat Free 1 cup (240g) 830 346 4% 5%
Safeway 1 cup (240g) 910 379 14% 1%
Broths, Chicken
Swanson Certified Organic Free Range
1 cup (240mL) 550 229 — -‐4%
Pacific Free-‐Range 1 cup, 8 fl oz (240 mL)
570 238 4% 0%
365 Organic 1 cup, 8 fl oz (240 mL)
570 238 4% -‐2%
Great Value (Walmart) 1 cup (245g) 860 351 53% -‐11%
Swanson 99% Fat Free 1 cup (240mL) 860 358 56% -‐10%
Safeway 1 cup (240mL) 930 388 69% -‐2%
Soups, Cream of Tomato
Amy’s Organic Lowfat 1 cup (245mL) 690 282 — 99%
Pacific Organic Creamy Tomato
1 cup , 8 fl oz (240mL) 750 313 11% 0%
Soups, Tomato
Great Value (Walmart) Condensed Soup (Prepared)
1 cup (250g) 480 192 — -‐25%
Safeway Condensed Soup (Prepared)
1 cup (246g) 480 195 2% -‐35%
Campbell's, condensed Classics (Prepared)
1 cup (240mL) 480 200 3% -‐32%
Progresso Classics Hearty Tomato
1 cup (245g) 690 282 41% -‐27%

Sodium Content of Foods ● 34
Item Serving Size
Sodium (mg)
Sodium mg/100g of product
Level of sodium compared to item with least sodium mg/100g
in subcategory
Change in sodium
from 2005 to 2015
Soups, Vegetable
Campbell’s, condensed Classics Vegetable, with Beef Stock (Prepared)
1 cup (240mL) 410 171 — -‐54%
Campbell’s, condensed Classics Vegetarian Vegetable (Prepared)
1 cup (240mL) 650 271 59% 35%
Great Value (Walmart) Vegetable Condensed Soup with Vegetable Stock
1 cup (246mL) 740 301 76% 0%
Canned Vegetables
Baked Beans
B&M Original 1/2 cup (131g) 390 298 — 3%
Great Value (Walmart) 1/2 cup (130g) 520 400 34% 6%
Bush’s Best Original 1/2 cup (130g) 550 423 42% 0%
Baked Beans, Vegetarian
B&M 1/2 cup (131g) 380 290 — 11%
Bush’s Best Vegetarian 1/2 cup (130g) 550 423 46% 0%
Tomatoes, Diced
Del Monte 1/2 cup (126g) 130 103 — -‐48%
Furmanos 1/2 cup (116g) 125 108 104% -‐49%
Great Value (Walmart) 1/2 cup (121g) 180 149 144% -‐18%
Contadina Roma Style 1/2 cup (122g) 200 164 159% 0%

Sodium Content of Foods ● 35
Item Serving Size
Sodium (mg)
Sodium mg/100g of product
Level of sodium compared to item with least sodium mg/100g
in subcategory
Change in sodium
from 2005 to 2015
Hunts Petite Diced 1/2 cup (121g) 200 165 160% -‐39%
Hunts Diced, Original 1/2 cup (121g) 200 165 160% -‐47%
Tomatoes, Crushed
Hunts 1/2 cup (121g) 210 174 — -‐40%
Great Value (Walmart) 1/4 cup (61g) 140 230 32% 47%
Contadina Roma Style (1/4 cup (61g) 150 246 42% 0%
Tomatoes, Paste
Great Value (Walmart) 2 Tbsp (33g) 20 61 — 0%
Contadina Roma Style 2 Tbsp (33g) 20 61 0% -‐93%
Hunts 2 Tbsp (33g) 20 61 0% -‐78%
Tomatoes, Whole & Peeled
Delallo 1/2 cup (121g) 170 140 — -‐23%
Giant 1/2 cup (121g) 180 149 6% -‐28%
Hunts 1/2 cup (121g) 180 149 6% -‐5%
Great Value (Walmart) Whole in Juice
1/2 cup (121g) 180 149 6% -‐18%
Muir Glen Organic 1/2 cup (122g) 190 156 11% -‐27%
Tuna fish, White Albacore, Canned, Packed in Water
Crown Prince Natural Solid 1/4 cup (56g) 105 188 — 0%

Sodium Content of Foods ● 36
Item Serving Size
Sodium (mg)
Sodium mg/100g of product
Level of sodium compared to item with least sodium mg/100g
in subcategory
Change in sodium
from 2005 to 2015
365 Solid 2 oz (54g) 105 194 4% -‐27%
Bumble Bee Solid 2 oz, 1/4 cup (56g) 140 250 33% -‐44%
Great Value (Walmart) 2 oz, 1/4 cup (56g) 200 357 90% -‐20%
Spaghetti-‐O’s
Great Value (Walmart) Spaghetti Rings
1 cup (252g) 600 238 — -‐37%
Campbell’s SpaghettiOs 1 cup (252g) 600 238 0% -‐29%
Giant Spaghetti Rings 1 cup (252g) 600 238 0% -‐44%

Sodium Content of Foods ● 37
Item Serving Size Sodium (mg)
Sodium mg/100g of Product
Level of sodium compared to item with least sodium mg/100g
in subcategory
Change in Sodium from 2005 to 2015
Restaurant Foods
Breakfast Foods Egg, Bacon, and Cheese Biscuit
McDonald’s 1 sandwich (147g) 1260 857 — -‐1%
Hardee’s 1 sandwich (149g) 1350 906 6% 16%
Egg and Cheese on a Bagel
Au Bon Pain 1 sandwich (211g) 670 318 — -‐4%
Einstein Brothers Plain, Egg with Cheese
1 sandwich (226g) 970 429 35% 10%
Egg and Cheese on a Croissant
Burger King Croissanwich with Egg & Cheese
1 sandwich (121g) 610 512 — -‐21%
Sausage, Breakfast
McDonald's Patty 1 patty (44g) 300 682 — 1%
Sausage Biscuits, Breakfast
McDonald’s 1 sandwich (117g) 1000 855 — 3%
Hardee’s 1 sandwich (126g) 1150 913 7% 5%
Arby’s 1 sandwich (144g) 1450 1007 18% -‐9%
Sausage and Egg Biscuits, Breakfast
McDonald’s 1 sandwich (164g) 1080 659 — 6%
Sodium Content of Foods ● 38
Item Serving Size Sodium (mg)
Sodium mg/100g of Product
Level of sodium compared to item with least sodium mg/100g
in subcategory
Change in Sodium from 2005 to 2015
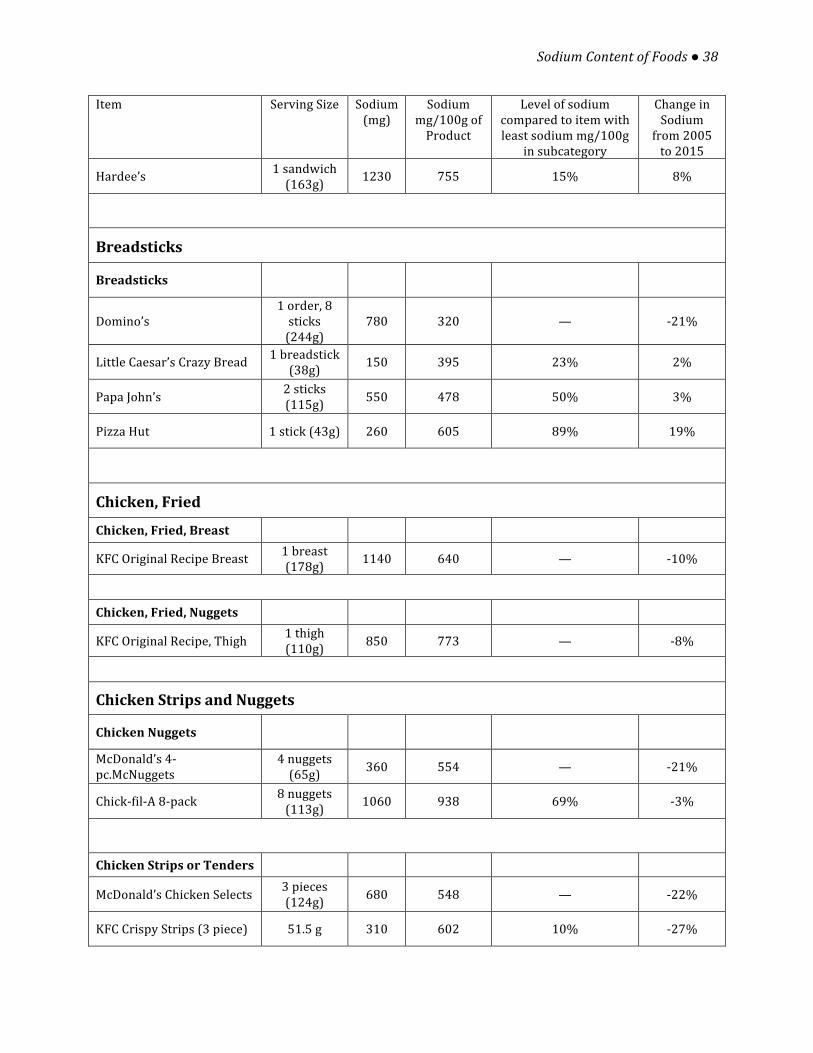
Hardee’s 1 sandwich (163g) 1230 755 15% 8%
Breadsticks
Breadsticks
Domino’s 1 order, 8 sticks (244g)
780 320 — -‐21%
Little Caesar’s Crazy Bread 1 breadstick (38g) 150 395 23% 2%
Papa John’s 2 sticks (115g) 550 478 50% 3%
Pizza Hut 1 stick (43g) 260 605 89% 19%
Chicken, Fried
Chicken, Fried, Breast
KFC Original Recipe Breast 1 breast (178g) 1140 640 — -‐10%
Chicken, Fried, Nuggets
KFC Original Recipe, Thigh 1 thigh (110g) 850 773 — -‐8%
Chicken Strips and Nuggets
Chicken Nuggets
McDonald’s 4-‐pc.McNuggets
4 nuggets (65g) 360 554 — -‐21%
Chick-‐fil-‐A 8-‐pack 8 nuggets (113g) 1060 938 69% -‐3%
Chicken Strips or Tenders
McDonald’s Chicken Selects 3 pieces (124g) 680 548 — -‐22%
KFC Crispy Strips (3 piece) 51.5 g 310 602 10% -‐27%
Sodium Content of Foods ● 39
Item Serving Size Sodium (mg)
Sodium mg/100g of Product
Level of sodium compared to item with least sodium mg/100g
in subcategory
Change in Sodium from 2005 to 2015
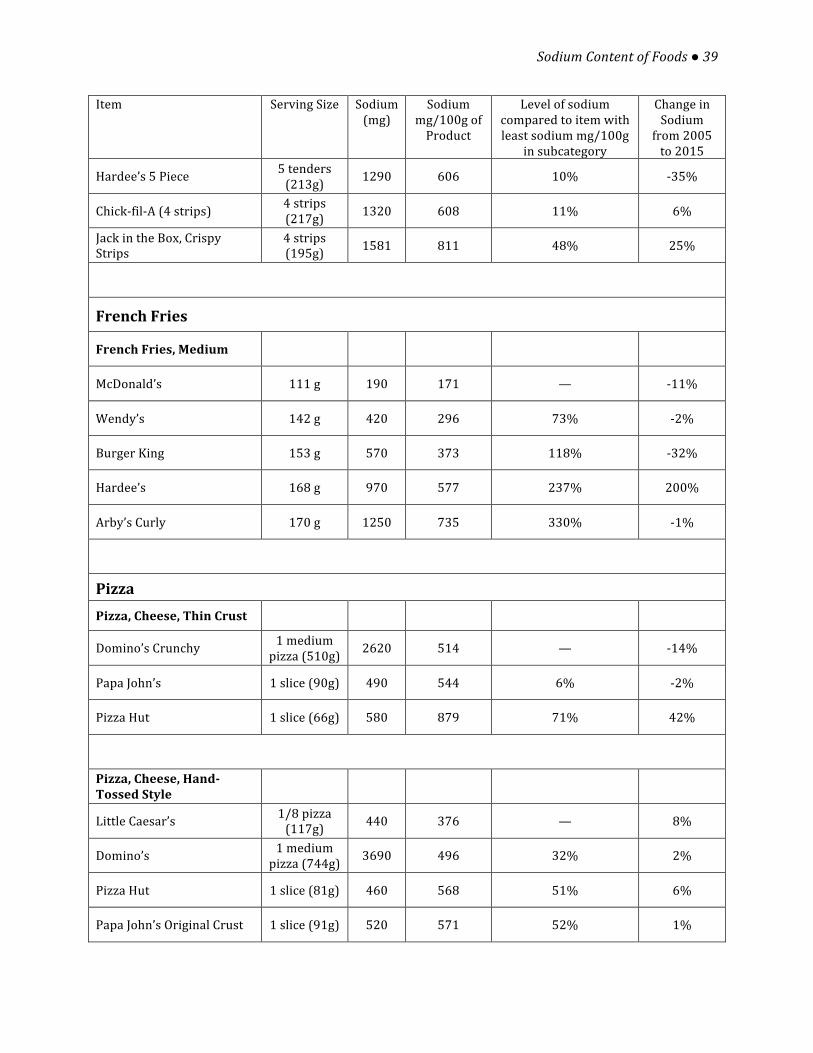
Hardee’s 5 Piece 5 tenders (213g) 1290 606 10% -‐35%
Chick-‐fil-‐A (4 strips) 4 strips (217g) 1320 608 11% 6%
Jack in the Box, Crispy Strips
4 strips (195g) 1581 811 48% 25%
French Fries
French Fries, Medium
McDonald’s 111 g 190 171 — -‐11%
Wendy’s 142 g 420 296 73% -‐2%
Burger King 153 g 570 373 118% -‐32%
Hardee’s 168 g 970 577 237% 200%
Arby’s Curly 170 g 1250 735 330% -‐1%
Pizza Pizza, Cheese, Thin Crust
Domino’s Crunchy 1 medium pizza (510g) 2620 514 — -‐14%
Papa John’s 1 slice (90g) 490 544 6% -‐2%
Pizza Hut 1 slice (66g) 580 879 71% 42%
Pizza, Cheese, Hand-‐Tossed Style
Little Caesar’s 1/8 pizza (117g) 440 376 — 8%
Domino’s 1 medium pizza (744g) 3690 496 32% 2%
Pizza Hut 1 slice (81g) 460 568 51% 6%
Papa John’s Original Crust 1 slice (91g) 520 571 52% 1%
Sodium Content of Foods ● 40
Item Serving Size Sodium (mg)
Sodium mg/100g of Product
Level of sodium compared to item with least sodium mg/100g
in subcategory
Change in Sodium from 2005 to 2015
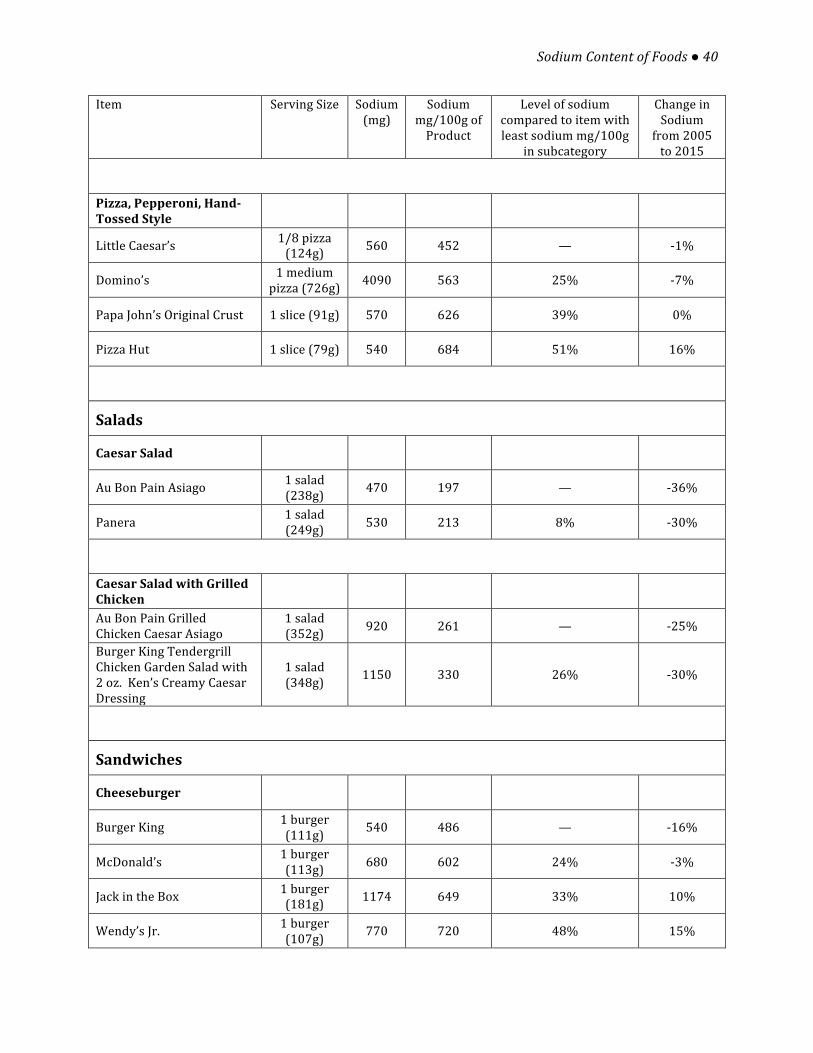
Pizza, Pepperoni, Hand-‐Tossed Style
Little Caesar’s 1/8 pizza (124g) 560 452 — -‐1%
Domino’s 1 medium pizza (726g) 4090 563 25% -‐7%
Papa John’s Original Crust 1 slice (91g) 570 626 39% 0%
Pizza Hut 1 slice (79g) 540 684 51% 16%
Salads
Caesar Salad
Au Bon Pain Asiago 1 salad (238g) 470 197 — -‐36%
Panera 1 salad (249g) 530 213 8% -‐30%
Caesar Salad with Grilled Chicken
Au Bon Pain Grilled Chicken Caesar Asiago
1 salad (352g) 920 261 — -‐25%
Burger King Tendergrill Chicken Garden Salad with 2 oz. Ken’s Creamy Caesar Dressing
1 salad (348g) 1150 330 26% -‐30%
Sandwiches
Cheeseburger
Burger King 1 burger (111g) 540 486 — -‐16%
McDonald’s 1 burger (113g) 680 602 24% -‐3%
Jack in the Box 1 burger (181g) 1174 649 33% 10%
Wendy’s Jr. 1 burger (107g) 770 720 48% 15%

Sodium Content of Foods ● 41
Item Serving Size Sodium (mg)
Sodium mg/100g of Product
Level of sodium compared to item with least sodium mg/100g
in subcategory
Change in Sodium from 2005 to 2015
Cheeseburger, Large
Original Burger King Whopper with Cheese Sandwich
1 burger (312g) 1260 404 — -‐12%
McDonald’s Quarter Pounder with Cheese
1 burger (206g) 1110 539 33% -‐7%
Jack in the Box Jumbo Jack with Cheese
1 burger (241g) 1317 546 35% 28%
Grilled Chicken Sandwich
McDonald’s Premium Grilled Chicken Classic Sandwich
1 sandwich (200g) 820 410 — -‐14%
Wendy’s Ultimate Chicken Grill Sandwich
1 sandwich (223g) 980 439 7% -‐10%
Burger King Original Sandwich
1 sandwich (218g) 1170 537 31% -‐14%
Hamburger
Burger King 1 burger (100g) 460 460 — 1%
McDonald’s 1 burger (99g) 490 495 8% -‐2%
Wendy’s Jr. 1 burger (96g) 580 604 31% 18%
Hamburger, Medium
Burger King Whopper 1 burger (290g) 910 314 — -‐10%
McDonald’s Quarter Pounder
1 burger (177g) 710 401 28% -‐6%
Hamburger, Large
McDonald’s Big ‘n Tasty 1 burger (217g) 790 364 — -‐12%
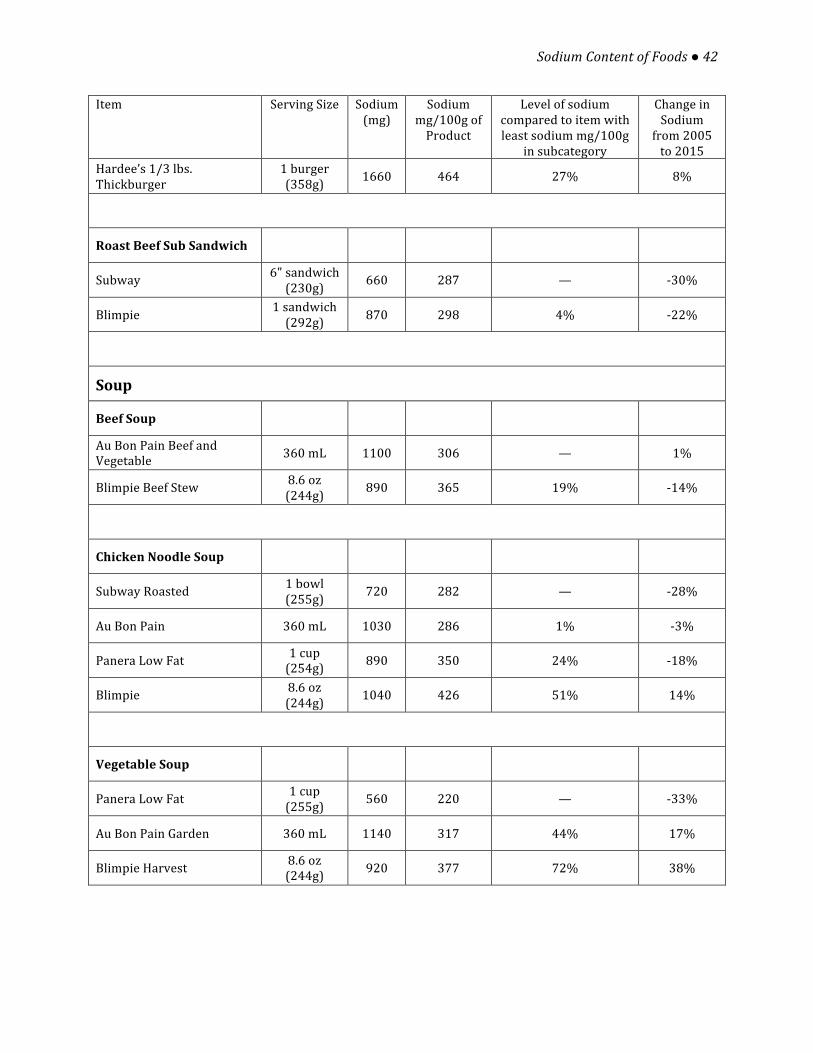
Sodium Content of Foods ● 42
Item Serving Size Sodium (mg)
Sodium mg/100g of Product
Level of sodium compared to item with least sodium mg/100g
in subcategory
Change in Sodium from 2005 to 2015
Hardee’s 1/3 lbs. Thickburger
1 burger (358g) 1660 464 27% 8%
Roast Beef Sub Sandwich
Subway 6" sandwich (230g) 660 287 — -‐30%
Blimpie 1 sandwich (292g) 870 298 4% -‐22%
Soup
Beef Soup
Au Bon Pain Beef and Vegetable 360 mL 1100 306 — 1%
Blimpie Beef Stew 8.6 oz (244g) 890 365 19% -‐14%
Chicken Noodle Soup
Subway Roasted 1 bowl (255g) 720 282 — -‐28%
Au Bon Pain 360 mL 1030 286 1% -‐3%
Panera Low Fat 1 cup (254g) 890 350 24% -‐18%
Blimpie 8.6 oz (244g) 1040 426 51% 14%
Vegetable Soup
Panera Low Fat 1 cup (255g) 560 220 — -‐33%
Au Bon Pain Garden 360 mL 1140 317 44% 17%
Blimpie Harvest 8.6 oz (244g) 920 377 72% 38%


