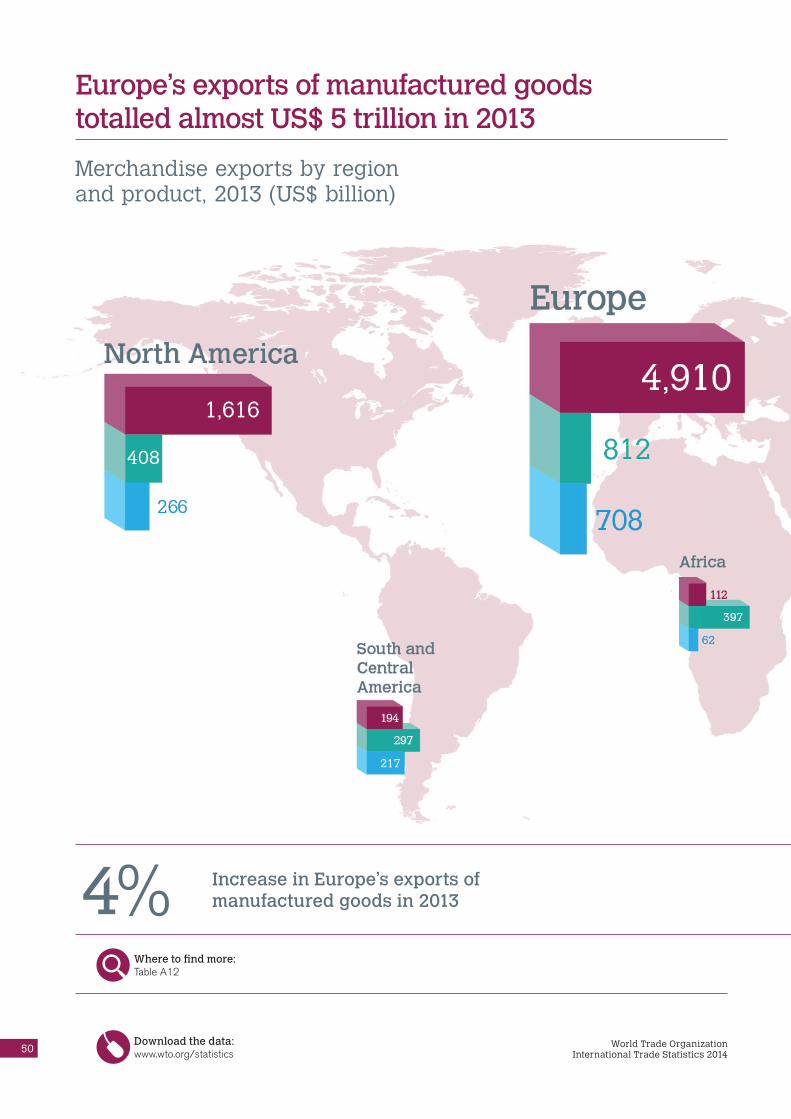
Europe’s exports of manufactured goods totalled almost US$ 5 trillion in 2013
Where to find more:Table A12
Increase in Europe’s exports of manufactured goods in 20134%
Merchandise exports by region and product, 2013 (US$ billion)
50 World Trade OrganizationInternational Trade Statistics 2014
Download the data:www.wto.org/statistics

Europe’s exports of manufactured goods were on the rise again in 2013, increasing by 4 per cent following last year’s decline and reaching almost the nominal value of 2011. Asia’s exports grew by 3 per cent. Its share in world exports of manufactured goods now stands at 39 per cent, compared with Europe’s share of 41 per cent.
Exports of fuels and mining products from Africa declined by 9 per cent in 2013. In the Commonwealth of Independent States (CIS), these exports fell by 5 per cent and in the Middle East by 1 per cent. This was mostly due to lower prices for minerals and energy.
Europe’s exports of agricultural products increased by 8 per cent in 2013. Africa’s exports grew by 5 per cent and Asia’s by 3 per cent.
Asia’s share in world exports of manufactured goods in 201339%
Manufactured goods
Fuels and mining products
Agricultural products
All figures are in US$ billion
51World Trade OrganizationInternational Trade Statistics 2014
Download the data:www.wto.org/statistics
II ME
RC
HA
ND
ISE
TRA
DE

Exports of fuels and mining products record minimal growth World exports of agricultural products and manufactured goods expanded by
3 per cent in volume terms in 2013, compared with a 2 per cent increase in 2012.
Exports of fuels and mining products grew by only 0.3 per cent in 2013, reflecting a stable demand against a backdrop of falling prices.
Where to find more:Table A1
0.3%Increase in export
volume of fuels and mining products in 2013
3% Increase in export
volume of agricultural products in 2013
Volume of world merchandise exports by product group, 2000–13
52 World Trade OrganizationInternational Trade Statistics 2014
Download the data:www.wto.org/statistics

World exports of integrated circuits
and electronic components in 2013
US$ 537 bn
Metals and fuels take a decreasing share in world exports Exports of iron and steel declined by 6 per cent in 2013. Exports of non-ferrous
metals fell by 5 per cent and fuel exports declined by 3 per cent. This was mostly due to lower prices.
components, which increased by 11 per cent in value terms, followed by clothing (9 per cent) and textiles (8 per cent). The share of manufactured products in world exports increased to 65 per cent in 2013, from 64 per cent the previous year.
8 per cent of total world exports
Where to find more:Table II.1
World merchandise exports by product group, 2013
-1% Percentage point decrease in the share of fuels in
world merchandise exports in 2013
53World Trade OrganizationInternational Trade Statistics 2014
Download the data:www.wto.org/statistics
II ME
RC
HA
ND
ISE
TRA
DE

Exports of agricultural products on the rise again World exports of agricultural products increased by almost 6 per cent to
US$ 1,745 billion in 2013 following stagnation in 2012. The growth rate is three times higher than the world average for all goods (2 per cent in 2013). Exports of food increased more markedly (6 per cent) than exports of non-food agricultural products (3 per cent). Prices of food and agricultural raw materials remained fairly stable compared with the previous year.
The top six exporters of agricultural products saw growth in 2013, with India showing the greatest increase (11 per cent).
Where to find more:Tables II.14 and II.15
Major exporters of agricultural products, 2013
11%Increase in India’s
exports of agricultural products in 2013
US exports of food in 2013
US$ 142 bn
54 World Trade OrganizationInternational Trade Statistics 2014
Download the data:www.wto.org/statistics

30% Share of EU in world fuel imports in 2013
China’s imports of mining products
in 2013
US$ 229 bn
US imports of fuels and mining products continue to decline EU imports of fuels and mining products decreased by 4 per cent to
US$ 1.2 trillion in 2013 but the EU still remains the world’s top importer. China remains the second-largest importer (US$ 544 billion). The import value declined for all the top importers, excluding China (+2 per cent) and India (+0.5 per cent). This is partly related to falling energy prices. The export prices of crude petro-leum decreased by 3 per cent in 2013. Imports also decreased in the United States, declining by 10 per cent in 2013. This was due in particular to increasing domestic production.
China became the largest importer of non-fuel mining products in 2013 (US$ 229 billion), recording growth of 4 per cent.
Where to find more:Table II.24
Major importers of fuels and mining products, 2013
55World Trade OrganizationInternational Trade Statistics 2014
Download the data:www.wto.org/statistics
II ME
RC
HA
ND
ISE
TRA
DE

-8%
8
14% Increase of Korean
exports of office and telecom
equipment in 2013
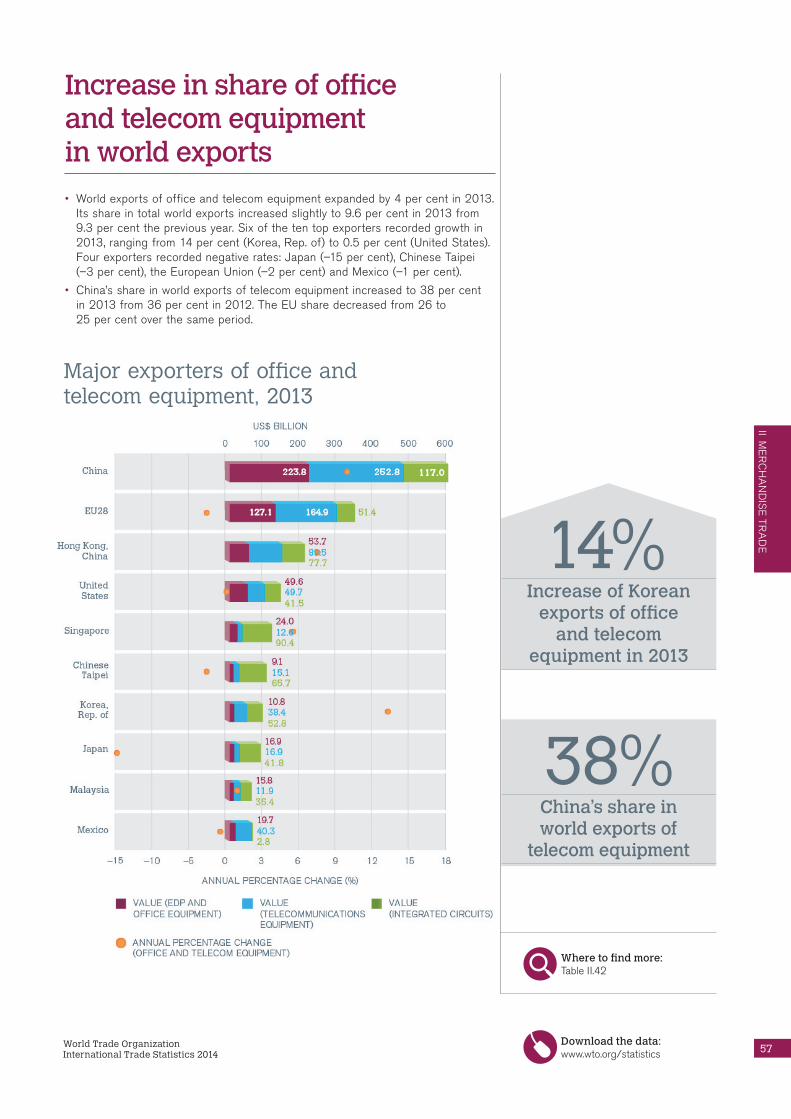
Increase in share of office and telecom equipment in world exports World exports of office and telecom equipment expanded by 4 per cent in 2013.
Its share in total world exports increased slightly to 9.6 per cent in 2013 from 9.3 per cent the previous year. Six of the ten top exporters recorded growth in 2013, ranging from 14 per cent (Korea, Rep. of) to 0.5 per cent (United States). Four exporters recorded negative rates: Japan (–15 per cent), Chinese Taipei (–3 per cent), the European Union (–2 per cent) and Mexico (–1 per cent).
China’s share in world exports of telecom equipment increased to 38 per cent in 2013 from 36 per cent in 2012. The EU share decreased from 26 to 25 per cent over the same period.
Where to find more:Table II.42
Major exporters of office and telecom equipment, 2013
38%China’s share in world exports of
telecom equipment
57World Trade OrganizationInternational Trade Statistics 2014
Download the data:www.wto.org/statistics
II ME
RC
HA
ND
ISE
TRA
DE

World exports of textiles and
clothing in 2013
US$ 766 bn
Exports of textiles and clothing surpass average growth World exports of textiles and clothing rose by 8 per cent in 2013–four times
higher than the average growth for world exports (2 per cent). The top ten exporters all recorded positive growth. The highest growth was seen by India, with 23 per cent, and the lowest was recorded by the Republic of Korea, with 2 per cent. The top exporters remain in the same positions, with the exception of Viet Nam which overtook the United States in 2013 as the sixth-largest exporter of textiles and clothing.
world exports of clothing and 35 per cent in textiles in 2013.
38 per cent of world imports in 2013 followed by the United States with 19 per cent of world imports.
Where to find more:Tables II.54 and II.58
Major exporters of textiles and clothing, 2013
23% Increase in India’s
exports of textiles and clothing in 2013
58 World Trade OrganizationInternational Trade Statistics 2014
Download the data:www.wto.org/statistics


