Download - 3Q10 Results Conference Call

3Q10 Results3Q10 ResultsConference CallConference Call
Economic-Financial Office and Investor Relations OfficeEconomic-Financial Office and Investor Relations Office
November/10November/10

This presentation may contain forward-looking statements referring to SABESP’s business outlook. operating and financial results estimates. and growth prospects. These are only projections. and as such. they are exclusively based on SABESP’s management expectation in relation to the future of business and its continuous access to capital to finance the Company’s business plan. These forward-looking statements largely depend on changes in market conditions. governmental rules. industry performance and the Brazilian economy. amongst other factors. in addition to risks exhibited in disclosure documents filed by SABESP. Therefore. they are subject to changes without prior notice.
NoticeNotice
2

3Q09 3Q10
468.5 493.6
335.9 355.5Sewage
Water
1H09 1H10
1,426.1 1,484.3
1,017.4 1,068.0
Total billed water and sewage volume, including wholesale (million m³)Total billed water and sewage volume, including wholesale (million m³)
Billed VolumeBilled Volume
3
5.6%
4.5%
5.8%
5.4%
5.0%
4.1%
699.5
720.9 732.0
731.3
742.6
3T09 4T09 1T10 2T10 3T10
Produced Water Volume
468.5
492.8
497.7
493.7
493.6
3T09 4T09 1T10 2T10 3T10
Billed Water Volume
26.5
26.0
25.7
25.8 26.0
3T09 4T09 1T10 2T10 3T10
Losses

Net Income
EBIT
EBITDA
Costsand Expenses
Net Operating Income
195.7
455.6
617.1
1173.4
1629.0
449.8
655.1
799.6
1180.4
1835.6
3T10 3T09
4
Financial HighlightsFinancial Highlights
Variation 3Q09 X 3Q10
0.6%
29.6%
43.8%
129.8%
12.7%

Payroll and Benefits
Supplies Treatment supplies
Services Electric power
General Expenses
Depreciation and
Amortization
Credit write-offs
Tax expenses
355
40 33
236
121146
162
72
9
348
36 32
221
132166
145
89
12
3Q09 3Q10
Costs and expenses in 3Q09: R$ 1,173.4
Costs and expenses in 3Q10: R$ 1,180.4
5
Costs and Expenses (R$ million)Costs and Expenses (R$ million)
% Net Revenue in 3Q09 21.8% 2.4% 2.1% 14.5% 7.5% 9.0% 9.9% 4.4% 0.6%
% Net Revenue in 3Q1019.0% 2.0% 1.7% 12.1% 7.2% 9.0% 7.9% 4.8% 0.6%
0,6%
(10,5%)
(1,8%)
(8,1%) (5,4%)
(6,4%)
9,0%13,9%
24,5%
23,9%

Net IncomeNet Income
Main variation of the items that affected net income (R$ million)Main variation of the items that affected net income (R$ million)Main variation of the items that affected net income (R$ million)Main variation of the items that affected net income (R$ million)
6
3Q09 3QT10 Var.
Net Income 3Q09: R$ 195.7 million
Net Op. Revenue 1,629.0 1,835.6 206.6
Costs and expenses (1,173.4) (1,180.4) 7.0
Other Rev. and Exp. 7.0 10.6 3.6
Net Financial (157.0) 21.7 178.7
Income Tax and Social Contr. (109.9) (237.6) (127.7)
Net Income 3Q10: R$ 449.9 million
3Q09 Net Income
Net Op. Rev. Costs and Expenses
Other Rev. andExpenses
Net Financial Income Tax and Social Contr.
3Q10Net Income
462.6
195.7
449.9
665.8
(109.9)(237.6)
103.8
206.6 7.0 3.6
178.7
(127.7)
60.5
(254.4)
4.5
(6.4)
(43.3)
Operating Result Income Tax and Social Contr. Exchange Var. Net Financial Monetary Var.
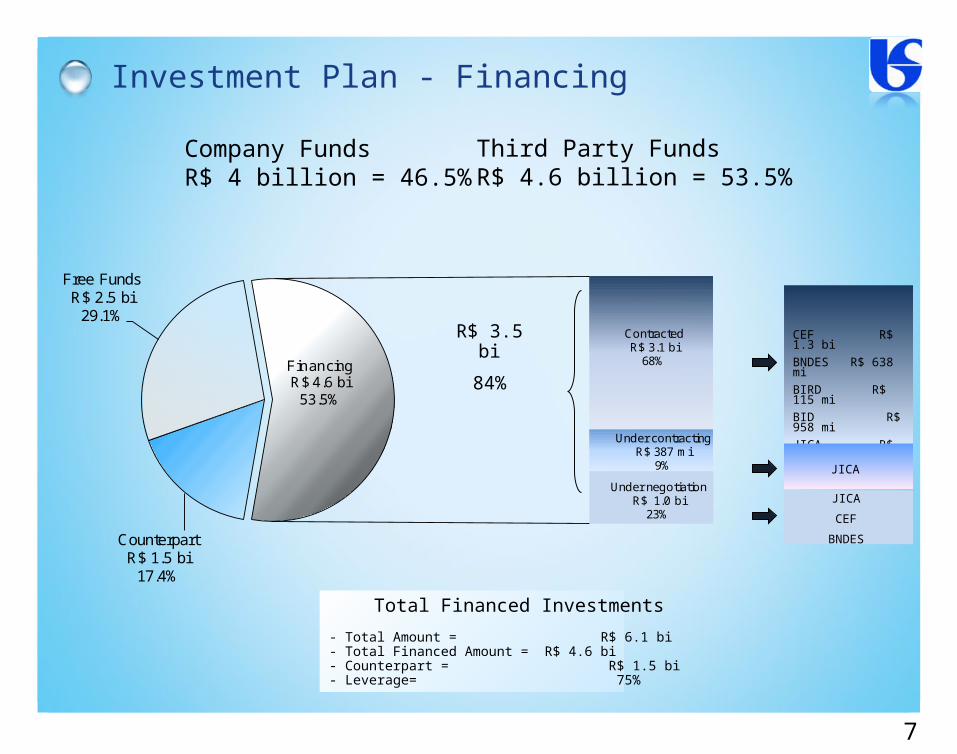
CounterpartR$ 1.5 bi
17.4%
Free FundsR$ 2.5 bi
29.1%ContractedR$ 3.1 bi
68%
Under contractingR$ 387 mi
9%
Under negotiationR$ 1.0 bi
23%
FinancingR$ 4.6 bi
53.5%
Investment Plan - Financing
Company FundsR$ 4 billion = 46.5%
Third Party FundsR$ 4.6 billion = 53.5%
CEF R$ 1.3 bi
BNDES R$ 638 mi
BIRD R$ 115 mi
BID R$ 958 mi
JICA R$ 80 mi
Total Financed Investments
- Total Amount = R$ 6.1 bi- Total Financed Amount = R$ 4.6 bi- Counterpart = R$ 1.5 bi- Leverage= 75%
R$ 3.5 bi
84%
7
JICA
JICA
CEF
BNDES
www.sabesp.com.br
IR Contacts
Mario Azevedo de Arruda Sampaio Angela Beatriz [email protected] [email protected](55 11) 3388-8664 (55 11) 3388-8793


