

• Higher Education Consultants
• Partner to launch non-credit certificates
• Marketing and Recruitment partner

Today’s agenda
• The Website Benchmarking Initiative
• Results and observations
• Next Steps

No lack of marketing metrics
Average time on site
Pages per visit
Unique visitors
How many visitors
do I get each day?
Should I be
getting more
visitors?

Should I be
getting more
traffic from
search engines?
How many visits do
I get from search
engines?

How many pages
does each visitor
view?
Do visitors leave
too quickly?

Race toward Results
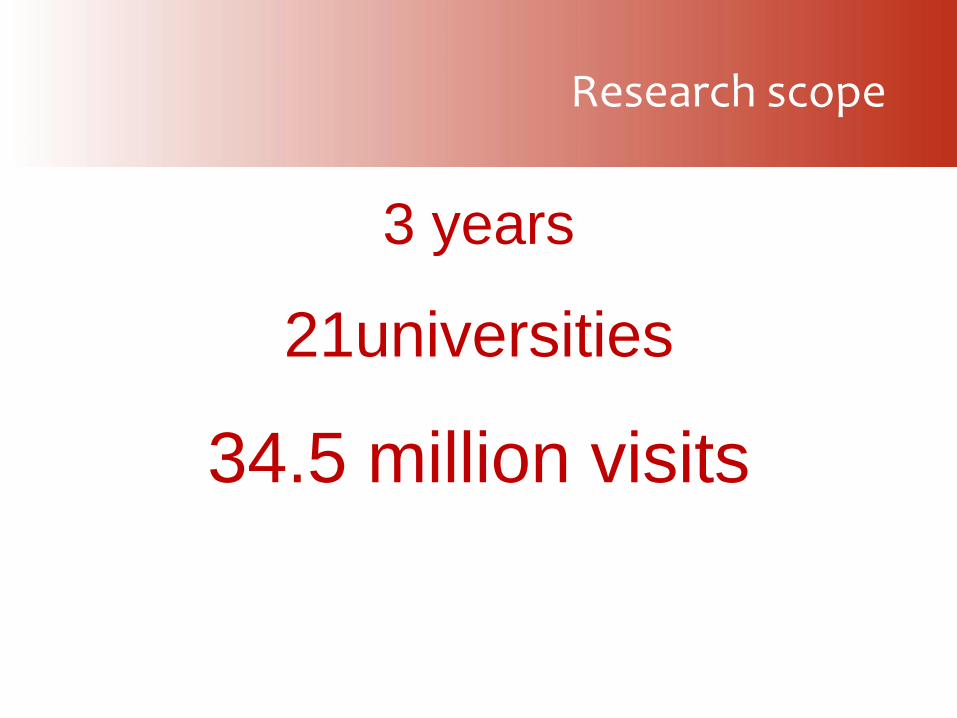
Research scope
3 years
21universities
34.5 million visits

Two areas of research
• Quarterly State of the Industry Trending Reports
• Visits, Visitors, Pageviews, Bounce rates, Traffic sources
• One-time Insights Reports
• Operating systems and browsers
• Mobile device traffic
• Search engine traffic
• Social media traffic
• Conversion rates

0K
15K
30K
45K
60K
Visits
2013
2012
2011
Visits increased each year

3.00
4.00
5.00
6.00
Pages per Visit
2013
2012
2011
Pages per visit decreased each year
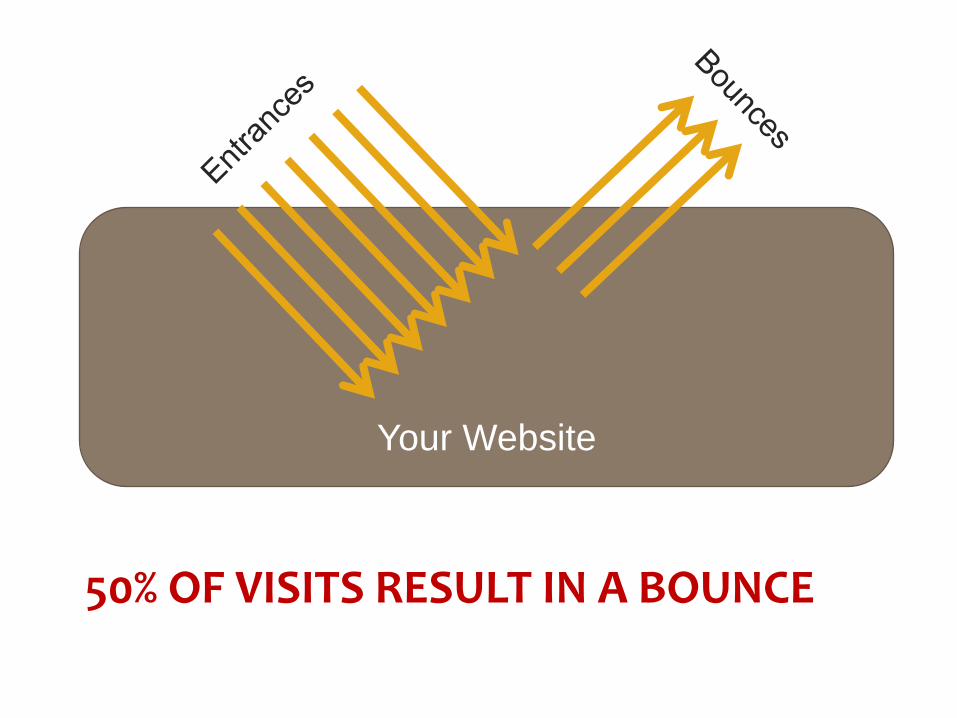
50% OF VISITS RESULT IN A BOUNCE
Your Website

20.0%
30.0%
40.0%
50.0%
60.0%
Bounce Rate
2013
2012
2011
Pages per visit decreased each year

2010 2011 2012 20132014
(projected)
Desktop 98% 95% 89% 82% 75%
Mobile 2% 5% 8% 12% 16%
Tablet 0% 0% 4% 6% 9%
Tablet Mobile
Desktop
0%
20%
40%
60%
80%
100%Mobile Device Usage

Sun Mon Tue Wed Thu Fri Sat
Visits by Day of Week

Sun Mon Tue Wed Thu Fri Sat
39%
40%
41%
42%
43%
44%
45%
46%
47%
Bounce Rate by Day of Week
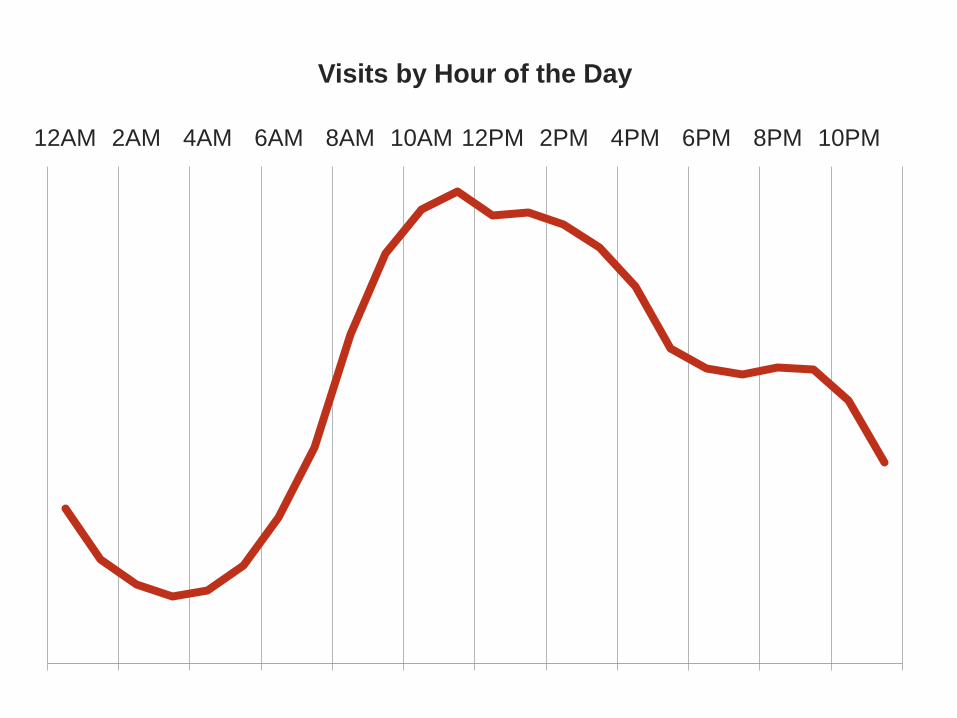
12AM 2AM 4AM 6AM 8AM 10AM 12PM 2PM 4PM 6PM 8PM 10PM
Visits by Hour of the Day

Google 90%
Bing 5%
Yahoo 5%
Actual Visits to CE sites
Google 67%
Bing 18%
Yahoo 11%
Ask 3%
AOL 1%
Market Share
Source: Oct 2013 comScore data

Organic Search visitors bounce less than average
Paid Search Visitors bounce more than average
Industry Average
0%
25%
50%
75%
100%
Organic Search Paid Search
Search engine bounce rates

91% OF SOCIAL MEDIA VISITS TO CE WEBSITES COME FROM FACEBOOK
X

Our paid advertising sample
Combined data from 8 clients with a total
spend of $430,000 generating 384 million
impressions and 220,000 clicks

Inquiries Conversion
Rate Cost per
Inquiry
Bing Paid Search 706 4.7% $57.80
Facebook 676 1.1% $107.47
Google Display 1094 1.4% $76.46
Google Paid Search 3291 6.5% $61.07
LinkedIn 744 6.0% $44.63
Total 6511 3.0% $66.24

• Questions
Questions??

Chart Your Own Success!
• Create your own
benchmark
• Year over year data
• Differentiate “type of
data”

Making the Comparison
• Examine trends
• Examine
percentages
• Identify anomalies

“The price of light is less
than the cost of darkness”
- Arthur Nielsen

Join the Initiative!

• Questions
Questions??


