2,500
3,000
3,500
4,000
4,500
5,000
5,500
6,000
2,500
3,000
3,500
4,000
4,500
5,000
5,500
6,000
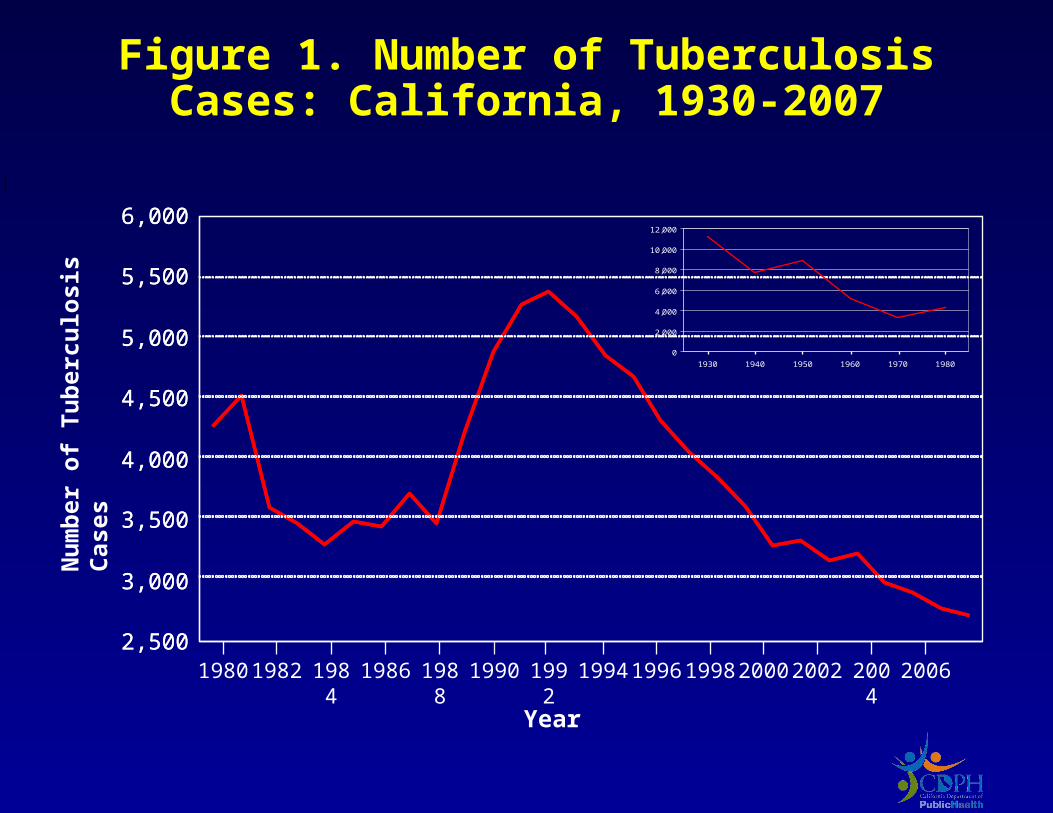
Figure 1. Number of Tuberculosis Cases: California, 1930-2007
Nu
mb
er o
f T
ub
ercu
losi
s C
ases
1980 19921982 1984 1986 1988 1996 1998 2000 2002 200419941990 2006
0
2,000
4,000
6,000
8,000
10,000
12,000
1930 1940 1950 1960 1970 1980
Year

Figure 2. Number of Tuberculosis Cases and Case Rates: California, 1998-2007
0
1,000
2,000
3,000
4,000
5,000
1998 1999 2000 2001 2002 2003 2004 2005 2006 2007
Year
0
5
10
15
20
Nu
mb
er o
f C
ases
Cas
e R
ate
per
100
,000
Number of CasesCase Rate per 100,000 Population

Figure 3. Tuberculosis Cases by Race/Ethnicity: California, 2007
Asian/Pacific Islander1,262 (46.3%)
Hispanic993 (36.4%)
Unknown10 (0.4%)
Black 217 (8.0%)
American Indian/Alaska Native
6 (0.2%)
White237 (8.7%)

Figure 4. Tuberculosis Case Rates by Race/Ethnicity: California, 1998-2007
0
5
10
15
20
25
30
35
40
45
1998 1999 2000 2001 2002 2003 2004 2005 2006 2007
Year
Cas
es p
er 1
00,0
00
Asian/Pacific Islander
Black
Hispanic
American Indian/Alaska Native
White

0
500
1,000
1,500
2,000
2,500
3,000
1998 1999 2000 2001 2002 2003 2004 2005 2006 2007
40
50
60
70
80
U.S.-born Foreign-born Percent Foreign-born
Figure 5. Tuberculosis Cases in Foreign-born and U.S.-born Persons: California, 1998-2007
Nu
mb
er o
f C
ases
Per
cen
t o
f C
ases
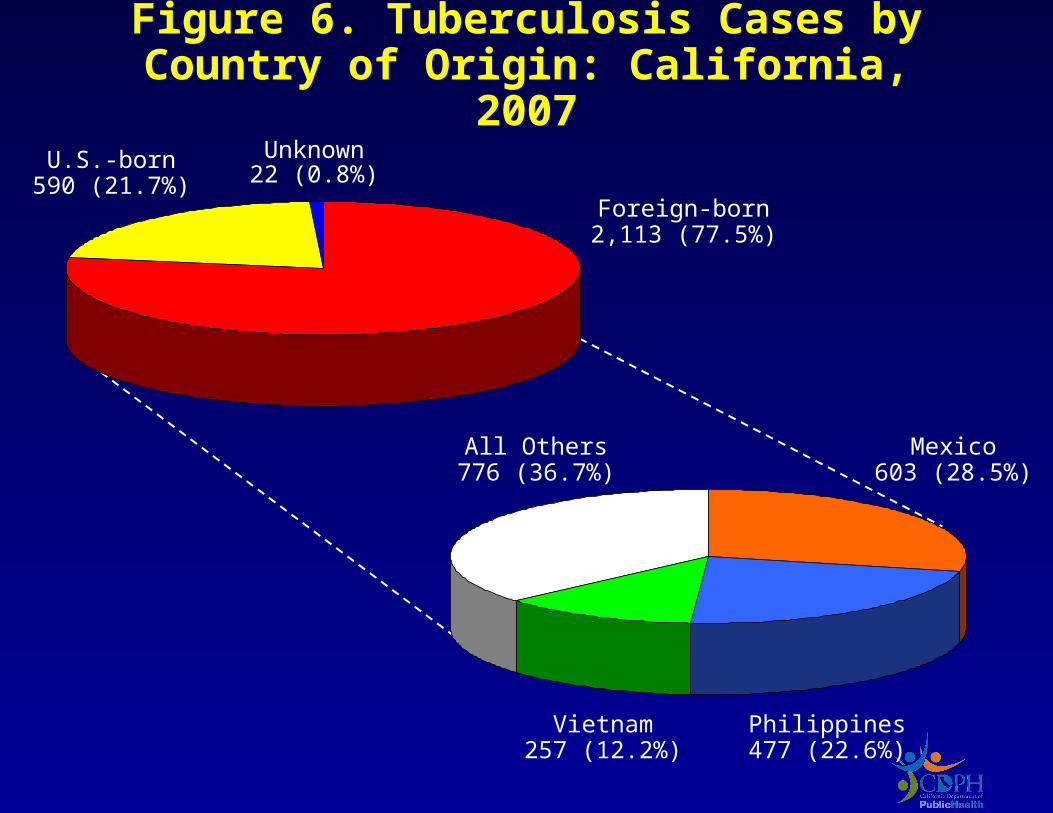
Figure 6. Tuberculosis Cases by Country of Origin: California, 2007
U.S.-born590 (21.7%)
Foreign-born2,113 (77.5%)
Unknown22 (0.8%)
Philippines477 (22.6%)
Mexico603 (28.5%)
All Others776 (36.7%)
Vietnam257 (12.2%)

Figure 7. Tuberculosis Cases in Persons 0-4 Years of Age: California, 1998-2007
0
20
40
60
80
100
120
140
160
180
1998 1999 2000 2001 2002 2003 2004 2005 2006 2007
Year
0
1
2
3
4
5
Nu
mb
er o
f C
ases
Per
cen
t o
f C
ases
Number of Cases Percent of Cases

Figure 8. Tuberculosis Cases by Verification Criteria: California, 2007
Provider Diagnosis201 (7.4%)
Positive Culture2,189 (80.3%)
Clinical Case326 (12.0%)
Positive Smear9 (0.3%)

Figure 9. Deaths in Persons with Tuberculosis: California, 1996-2005
0
100
200
300
400
500
1996 1997 1998 1999 2000 2001 2002 2003 2004 2005
Year
0
2
4
6
8
10
12
Per
cen
t o
f C
ases
Nu
mb
er o
f D
eath
s
Dead at Diagnosis
Died During Treatment Died Before Starting Treatment
Percent Dying with Tuberculosis

Figure 10. Tuberculosis Cases by AIDS Diagnosis*: California, 1995-2004
0
100
200
300
400
500
1995 1996 1997 1998 1999 2000 2001 2002 2003 2004
Year
0
2
4
6
8
10
Nu
mb
er o
f C
ases
wit
h A
IDS
Per
cen
t o
f C
ases
wit
h A
IDS
* Match found in AIDS Case Registry, California Office of AIDS.
Number of Tuberculosis Cases with AIDSPercent of Tuberculosis Cases with AIDS
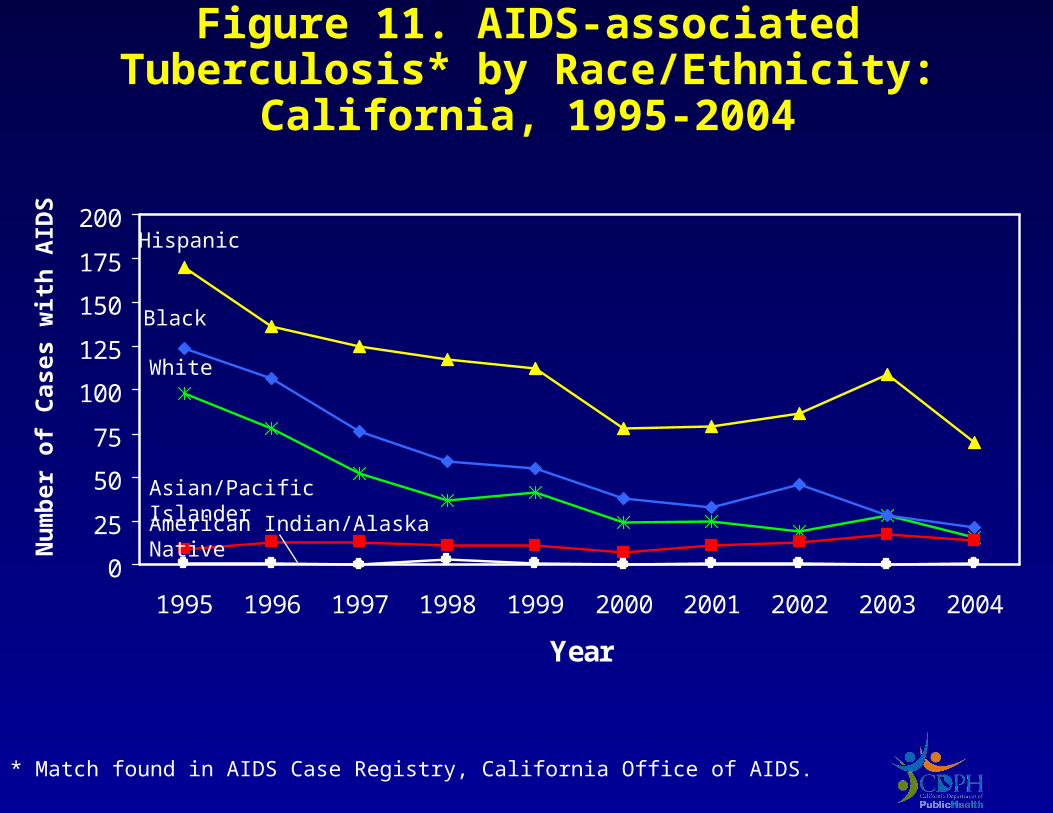
Figure 11. AIDS-associated Tuberculosis* by Race/Ethnicity: California, 1995-2004
0
25
50
75
100
125
150
175
200
1995 1996 1997 1998 1999 2000 2001 2002 2003 2004
Year
Nu
mb
er o
f C
ases
wit
h A
IDS
Hispanic
Black
White
Asian/Pacific Islander
American Indian/Alaska Native
* Match found in AIDS Case Registry, California Office of AIDS.
0
10
20
30
40
50
60
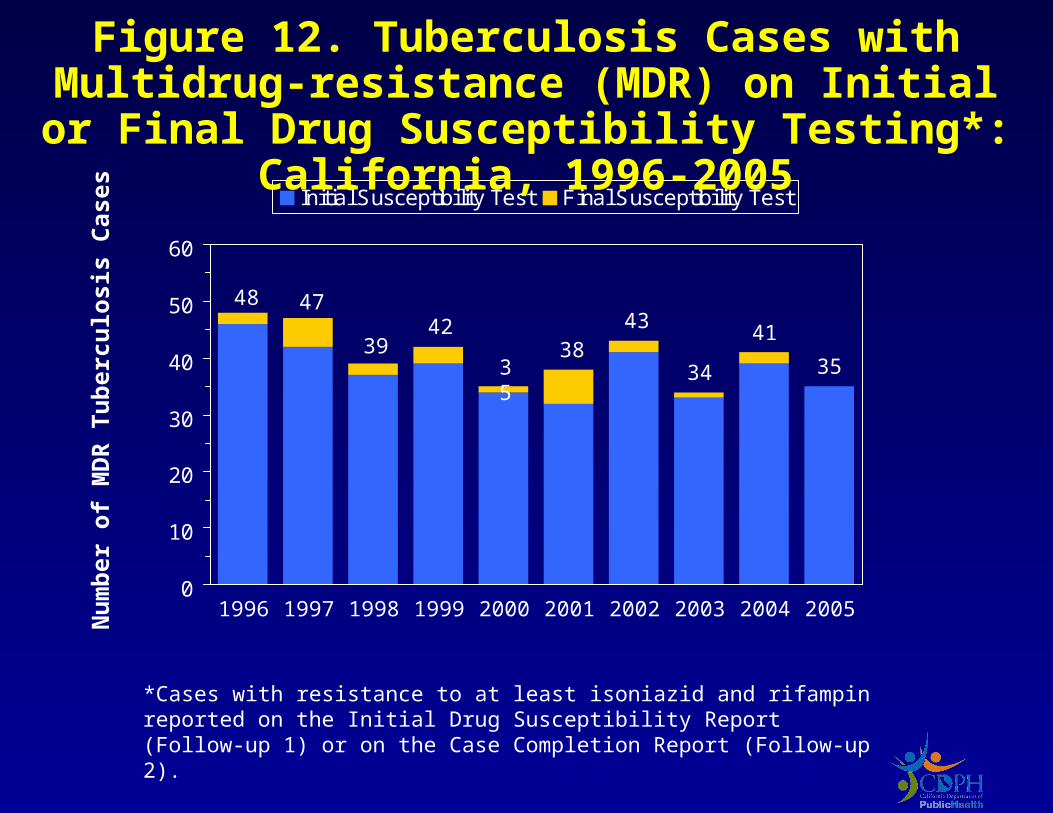
Initial Susceptibility Test Final Susceptibility Test
Figure 12. Tuberculosis Cases with Multidrug-resistance (MDR) on Initial or Final Drug
Susceptibility Testing*: California, 1996-2005N
um
ber
of
MD
R T
ub
ercu
losi
s C
ases
*Cases with resistance to at least isoniazid and rifampin reported on the Initial Drug Susceptibility Report (Follow-up 1) or on the Case Completion Report (Follow-up 2).
48 47
3942
35
3843
34
41
35
1996 1997 1998 1999 2000 2001 2002 2003 2004 2005
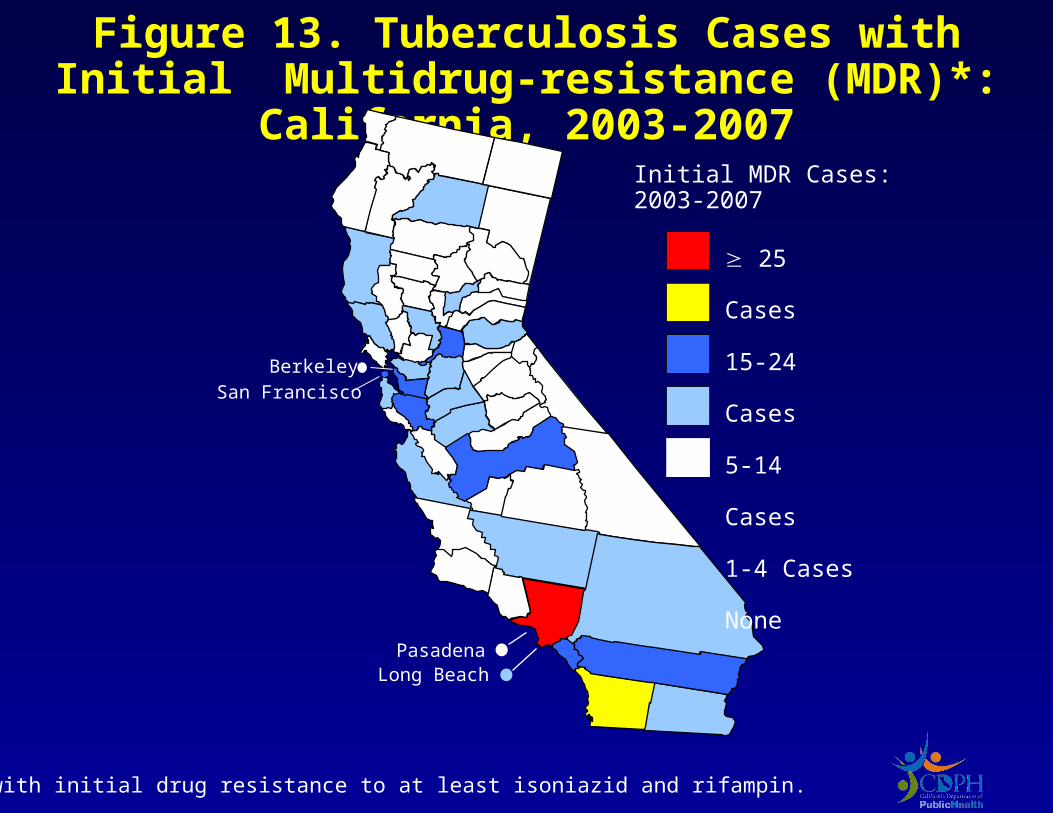
Figure 13. Tuberculosis Cases with Initial Multidrug-resistance (MDR)*: California, 2003-2007
*Cases with initial drug resistance to at least isoniazid and rifampin.
Long BeachPasadena
BerkeleySan Francisco
25 Cases
15-24 Cases
5-14 Cases
1-4 Cases
None
Initial MDR Cases:2003-2007
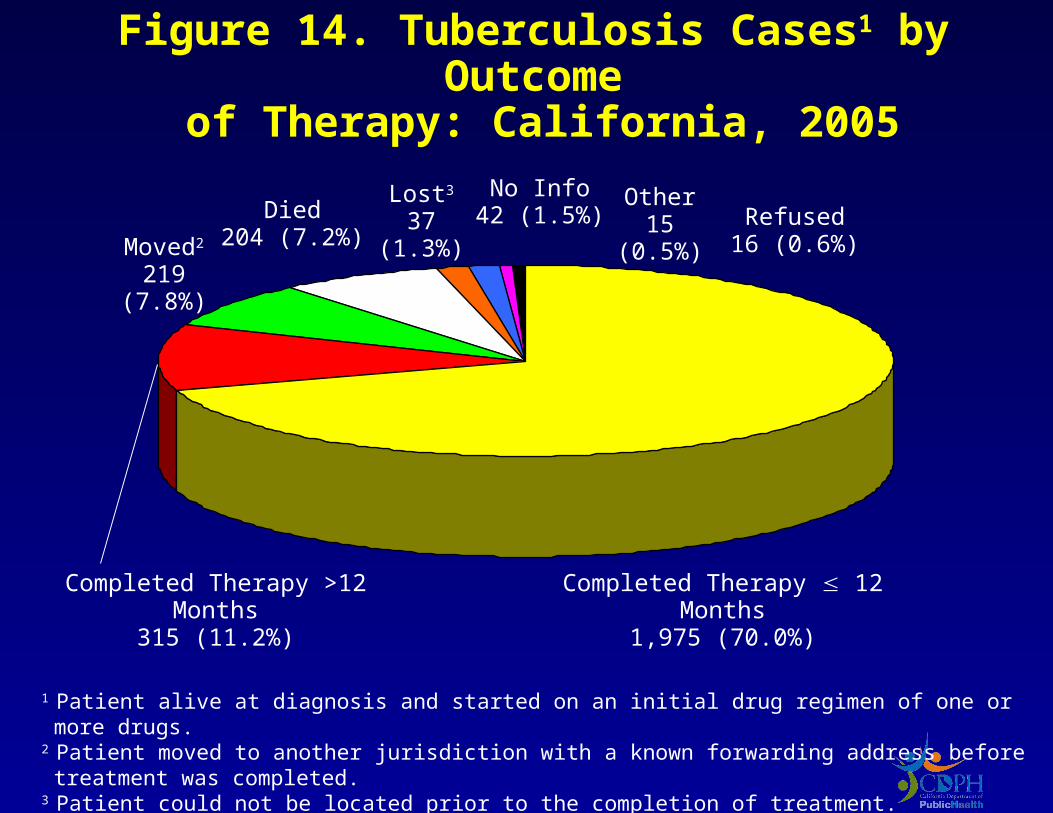
Figure 14. Tuberculosis Cases1 by Outcome of Therapy: California, 2005
Completed Therapy 12 Months1,975 (70.0%)
Completed Therapy >12 Months315 (11.2%)
Moved2
219 (7.8%)
Died204 (7.2%)
Lost3
37 (1.3%) Refused16 (0.6%)
Other15 (0.5%)
1 Patient alive at diagnosis and started on an initial drug regimen of one or more drugs.2 Patient moved to another jurisdiction with a known forwarding address before treatment was completed.3 Patient could not be located prior to the completion of treatment.
No Info42 (1.5%)

Figure 15. Outcome in Tuberculosis Cases for Whom One Year or Less of Treatment was
Indicated1: California, 2005
Completed Therapy 12 Months1,964 (71.8%)
Completed Therapy >12 Months274 (10.0%)
Moved2
207 (7.6%)
Died191 (7.0%)
Lost3
37 (1.4%)
Refused15 (0.5%)
Other15 (0.5%)
NoInformation 34 (1.2%)
1 Excludes cases with rifampin resistant disease, cases with meningeal disease, and cases less than 15 years of age with disseminated tuberculosis disease.2 Moved to another jurisdiction with a known forwarding address before treatment was completed.3 Patient could not be located prior to the completion of treatment.

Completed Therapy 12 Months11 (12.8%)
Completed Therapy >12 Months41 (47.7%)
Moved2
12 (14.0%)
Died13 (15.1%)
NoInformation 8 (9.3%)
1Includes cases with rifampin resistant disease, cases with meningeal disease, and cases less than 15 years of age with disseminated tuberculosis disease.
2 Patient moved to another jurisdiction with a known forwarding address before treatment was completed.3 Patient could not be located prior to the completion of treatment.
Refused1 (1.2%)
Figure 16. Outcome in Tuberculosis Cases for Whom Greater than One Year of
Treatment was Indicated1: California, 2005

Figure 17. Completion of Tuberculosis Therapy: California,1996-2005
0
20
40
60
80
100
1996 1997 1998 1999 2000 2001 2002 2003 2004 2005Per
cen
t o
f C
ases
Co
mp
leti
ng
Th
erap
y
CompletedCompleted in 1 year or less
Note: Excludes cases with rifampin resistant disease, cases with meningeal disease, cases less than 15 years of age with disseminated tuberculosis disease, and those that died during treatment.


