Download - 210 Diversity Index
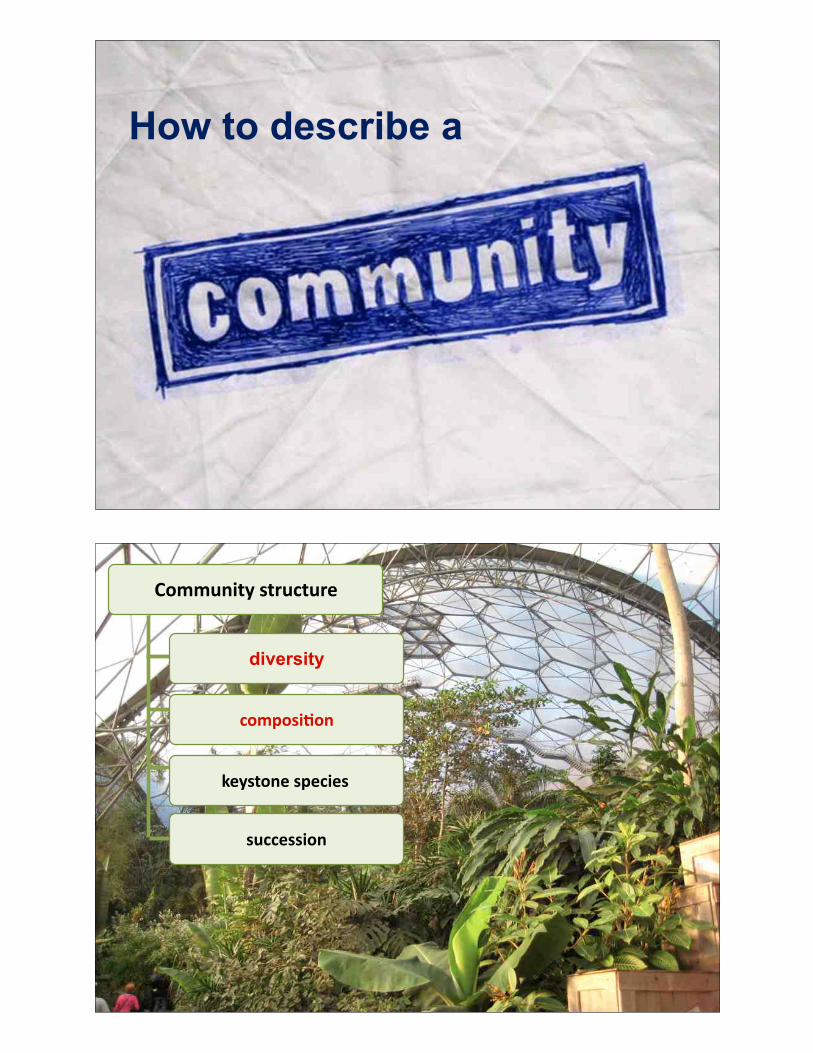
How to describe a
Community)structure
keystone)species
succession
composi0on
diversity

Species)diversity
more food resources
more)habitats
more)resilience
greater)diversity)=)greater)stability
Species)diversity
Species)richness
rela0ve)abundance
Total)number)of)different)species
propor0on)each)species)represents
Variety)of)organisms)that)make)up)the)community

Two)communi0es)can)have)the)same)species)richness)but)a)different)rela0ve)abundance

Basic)Methodology)Transect)SamplingLine)Intercept)Transect)Sampling:
•))Measure)length)of)“contact”)by)the)feature)of)interest)(intercept).
•))Compare)with)total)length)of)transect.
•))Results)are)usually)rela0ve)values)–)expressed)as)percentages.))e.)g.)%)shrub)cover
•))Transects)are)usually)straight)lines,)but)may)be)curved)or)circular.
Data)collec0on
Data)collec0on

Species)diversity:)SIMPSONS)INDEX
Mathema0cal)indices
2)random)samples)contain)same)taxon
diversity
Simpson)index
Low)#)=)0)=)all)taxa)equally)present
High)#)=)1)=)one)taxon)dominant
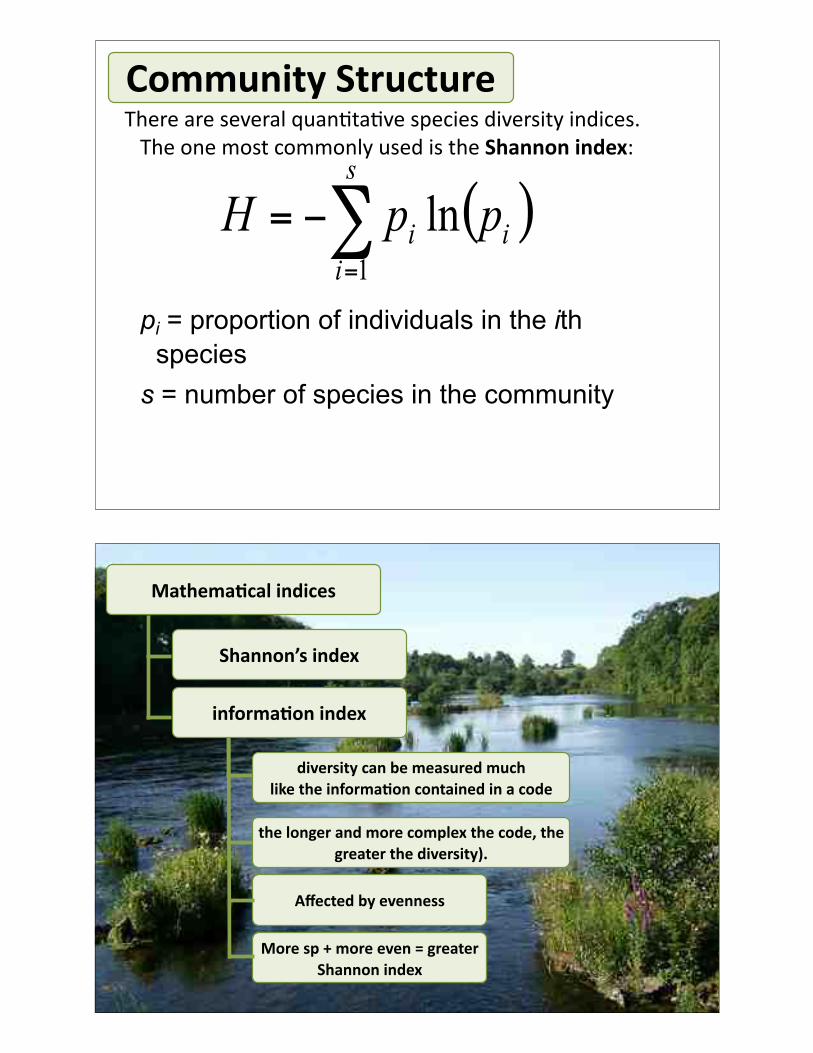
There%are%several%quan-ta-ve%species%diversity%indices.%The%one%most%commonly%used%is%the%Shannon)index:
pi = proportion of individuals in the ith species
s = number of species in the community
Community)Structure
Mathema0cal)indices
diversity)can)be)measured)muchlike)the)informa0on)contained)in)a)code)
informa0on)index
Shannon’s)index
the)longer)and)more)complex)the)code,)the)greater)the)diversity).
Affected)by)evenness
More)sp)+)more)even)=)greater)Shannon)index
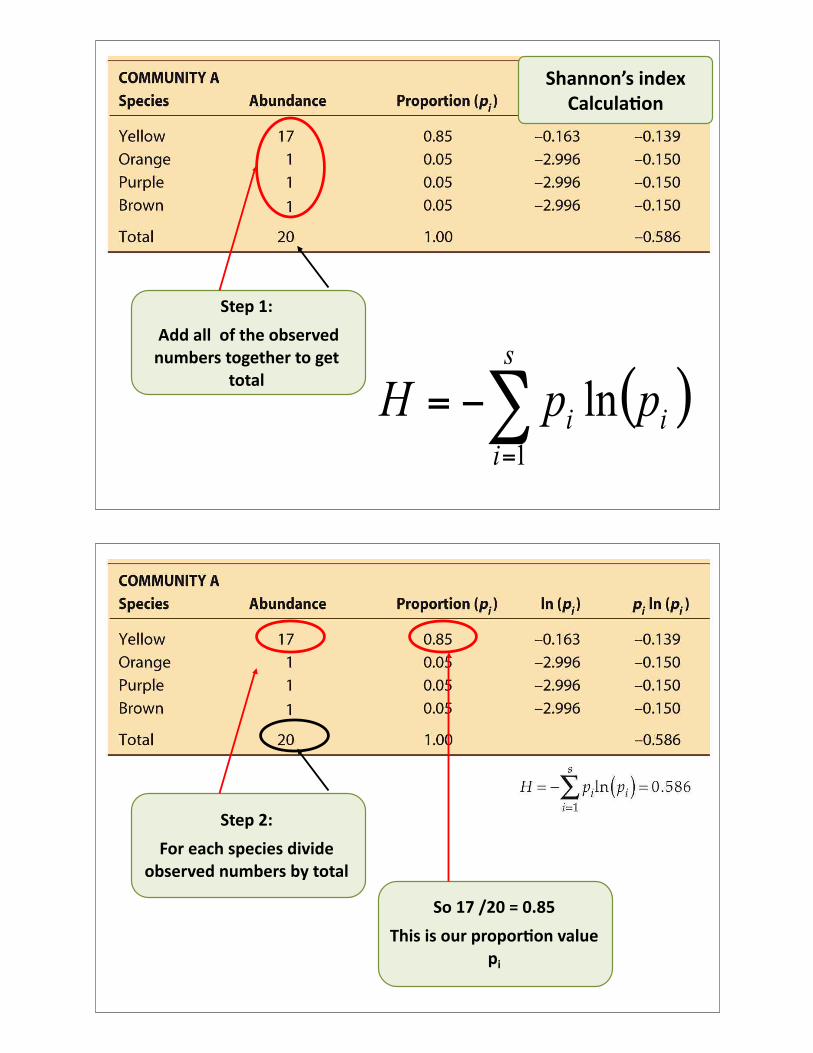
Step)1:
)Add)all))of)the)observed)numbers)together)to)get)
total
Shannon’s)index)Calcula0on
Step)2:
For)each)species)divide)observed)numbers)by)total)
So)17)/20)=)0.85
This)is)our)propor0on)value)pi

Step)3:
Take)the)natural)log)of)pi
Natural)log)of)0.85)=)d0.163
Step)4:
d0.163)mul0ply)by)pi
0.163)x)0.8)=)d0.139)
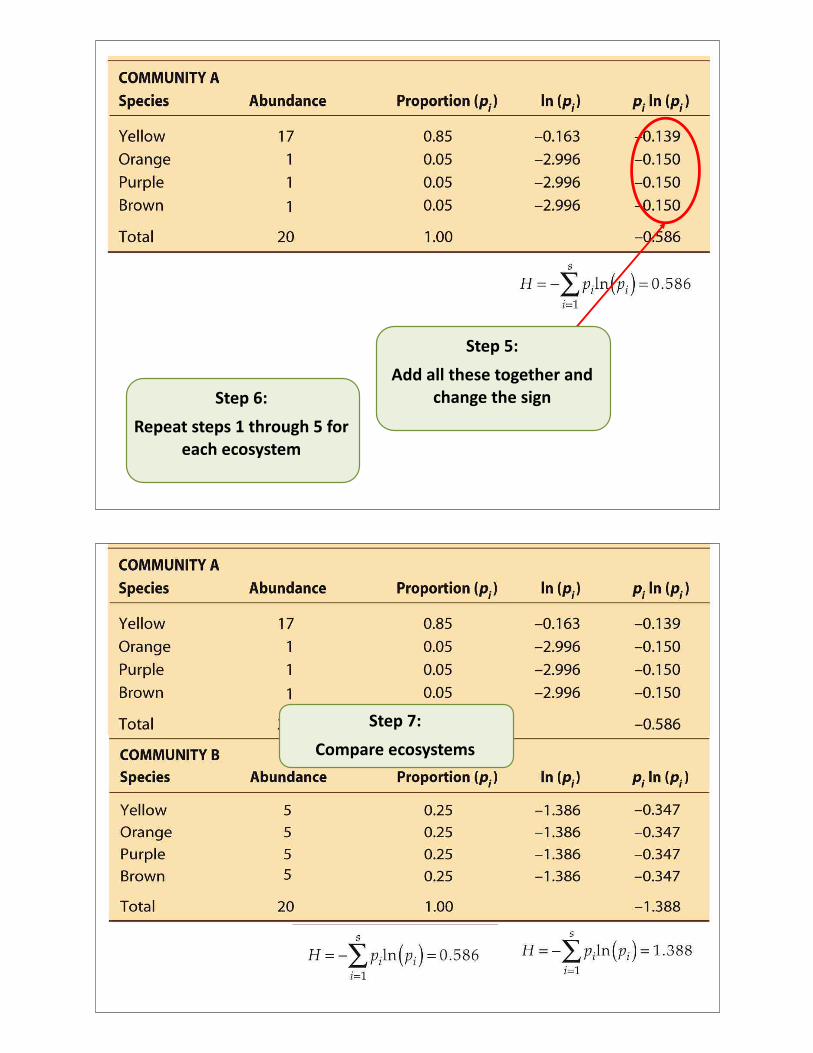
Step)5:
Add)all)these)together)and)change)the)signStep)6:
Repeat)steps)1)through)5)for)each)ecosystem
Step)7:
Compare)ecosystems

what)does)that)mean?
High)values)of)H)represent)more)diverse)communi0es
If)the)species)are)evenly)distributed)then)the)H)value)would)be)high
Values)of)the)Shannon's)diversity)index)for)real)communi0es)typically)fall)
between)1.5)and)3.5.
Pop)1 Pop)2
≨Pop)1 Pop)2
))))Are)Species)Common)or)Rare?

Highest)to)lowest
Step)1:
)Add)all))of)the)observed)numbers)together)to)get)
total
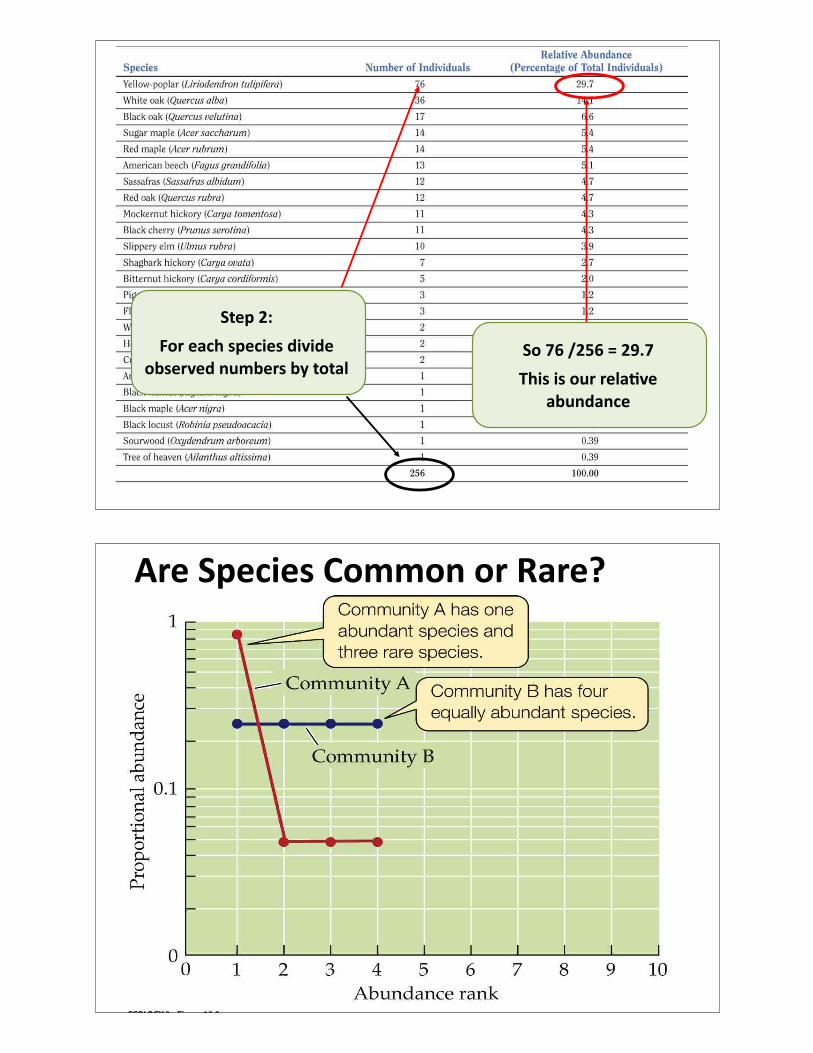
Step)2:
For)each)species)divide)observed)numbers)by)total)
So)76)/256)=)29.7
This)is)our)rela0ve)abundance
))))Are)Species)Common)or)Rare?

Rankdabundance)diagram
slower)slope)=))higher)evenness
longer)length)of)curve)=)higher)species)richness
Formal)Report
Ques0on:)is)there)a)difference)between)2)forest)remnants)on)UFV)campus
handout)on)drive
1)per)group)of)2
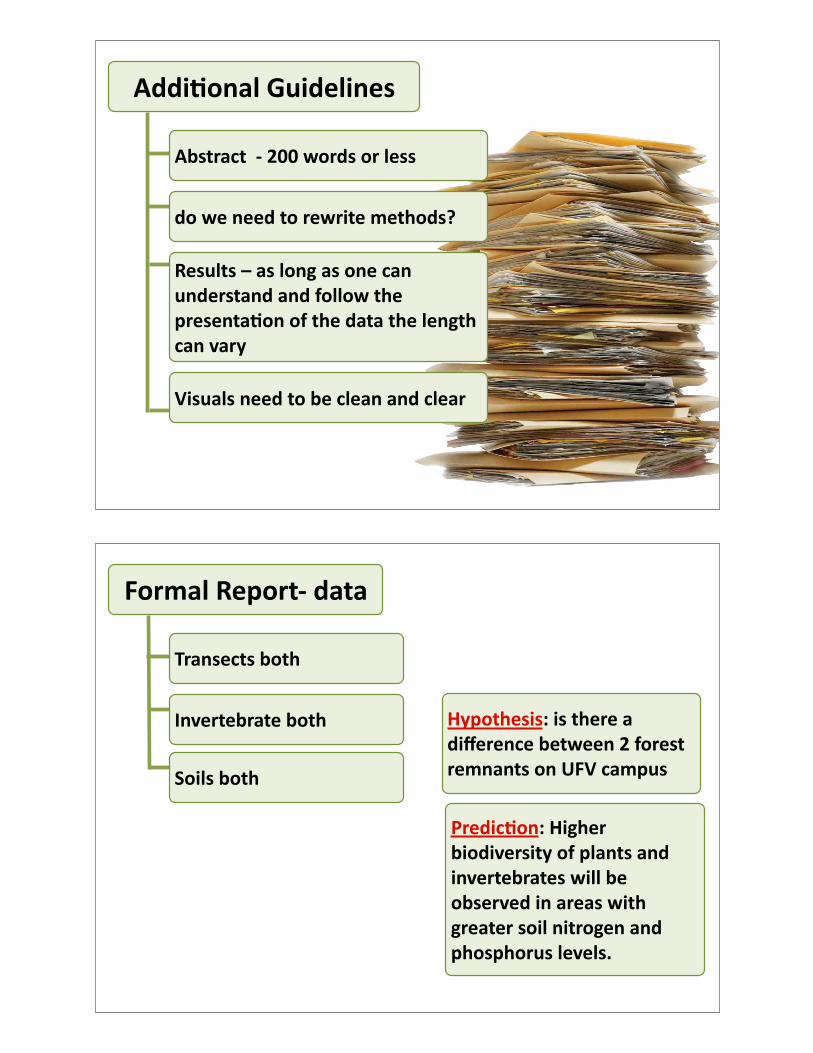
Addi0onal)Guidelines
Results)–)as)long)as)one)can)understand)and)follow)the)presenta0on)of)the)data)the)length)can)vary
do)we)need)to)rewrite)methods?
Abstract))d)200)words)or)less
Visuals)need)to)be)clean)and)clear
Formal)Reportd)data
Hypothesis:)is)there)a)difference)between)2)forest)remnants)on)UFV)campus
Invertebrate)both
Transects)both
Soils)both
Predic0on:)Higher)biodiversity)of)plants)and)invertebrates)will)be)observed)in)areas)with)greater)soil)nitrogen)and)phosphorus)levels.

Data)Analysis
Transects
Soils
Compare)species)richness,)frequency,)abundance,)etc.)from)table)in)lab)handout)compare)ShannondWeiner)Diversity)Index
Compare)species)richness,)abundance,)etc.)compare)ShannondWeiner)Diversity)Index
Compare)texture,)color)and)chemistry
Invertebrate
Forest)Transect)Data)AnalysisTake%your%vegeta-on%map%data%and%fill%in%table:
1%vegeta-on%maps%for%your%forest%(20%transect%points%of%1%m2%plots%per%50%m%transect%line)
Tables%from%5%other%lab%groups%will%be%posted%onDline
12
Species #)of)Individuals)per)50)m)transect)(ni)
Frequency Density)(d))per)20)m2
Rela0ve)Density
Rela0ve)Abundance)(%)of)total)individuals)
Rela0ve)Cover)–)omit)cover)all)together??
Red%Alder
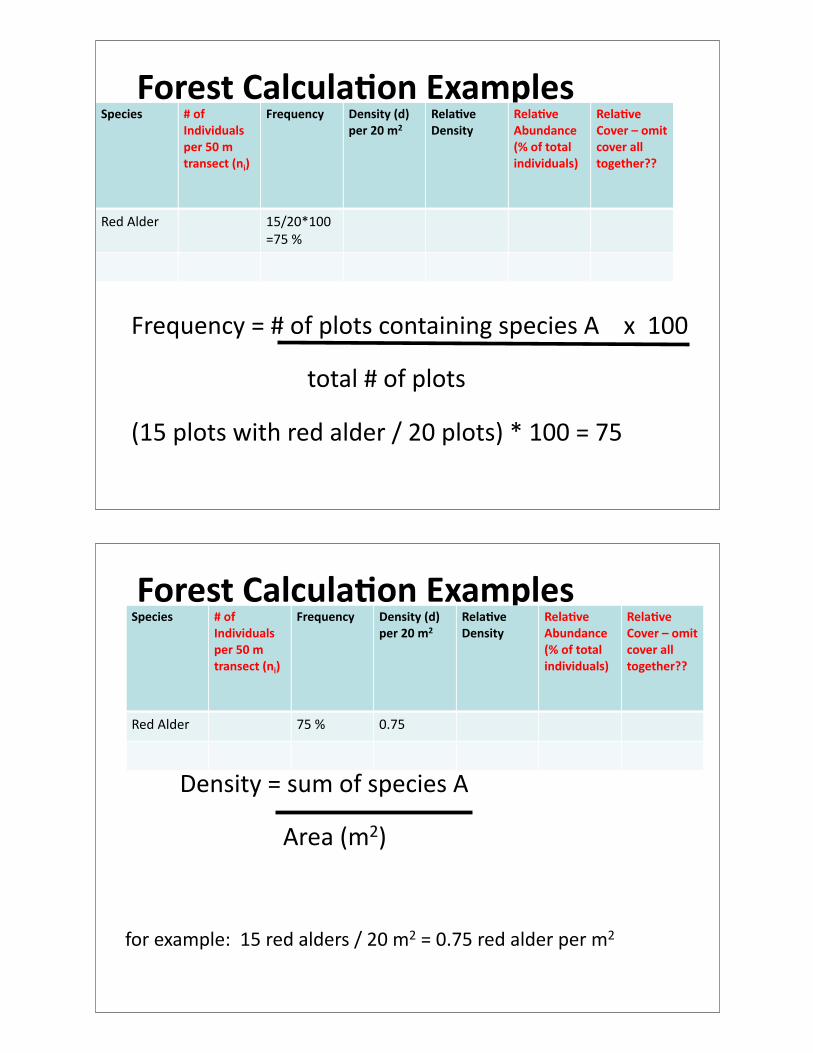
Forest)Calcula0on)Examples
Frequency%=%#%of%plots%containing%species%A%%%%x%%100
%%%%%%%%%%%%%%%%%%%%%%%%%%%%%total%#%of%plots%
(15%plots%with%red%alder%/%20%plots)%*%100%=%75
Species #)of)Individuals)per)50)m)transect)(ni)
Frequency Density)(d))per)20)m2
Rela0ve)Density
Rela0ve)Abundance)(%)of)total)individuals)
Rela0ve)Cover)–)omit)cover)all)together??
Red%Alder 15/20*100=75%%
Forest)Calcula0on)Examples
%%%%%%%%%Density%=%sum%of%species%A%
%%%%%%%%%%%%%%%%%%%%%%%%%%Area%(m2)
for%example:%%15%red%alders%/%20%m2%=%0.75%red%alder%per%m2
Species #)of)Individuals)per)50)m)transect)(ni)
Frequency Density)(d))per)20)m2
Rela0ve)Density
Rela0ve)Abundance)(%)of)total)individuals)
Rela0ve)Cover)–)omit)cover)all)together??
Red%Alder 75%% 0.75
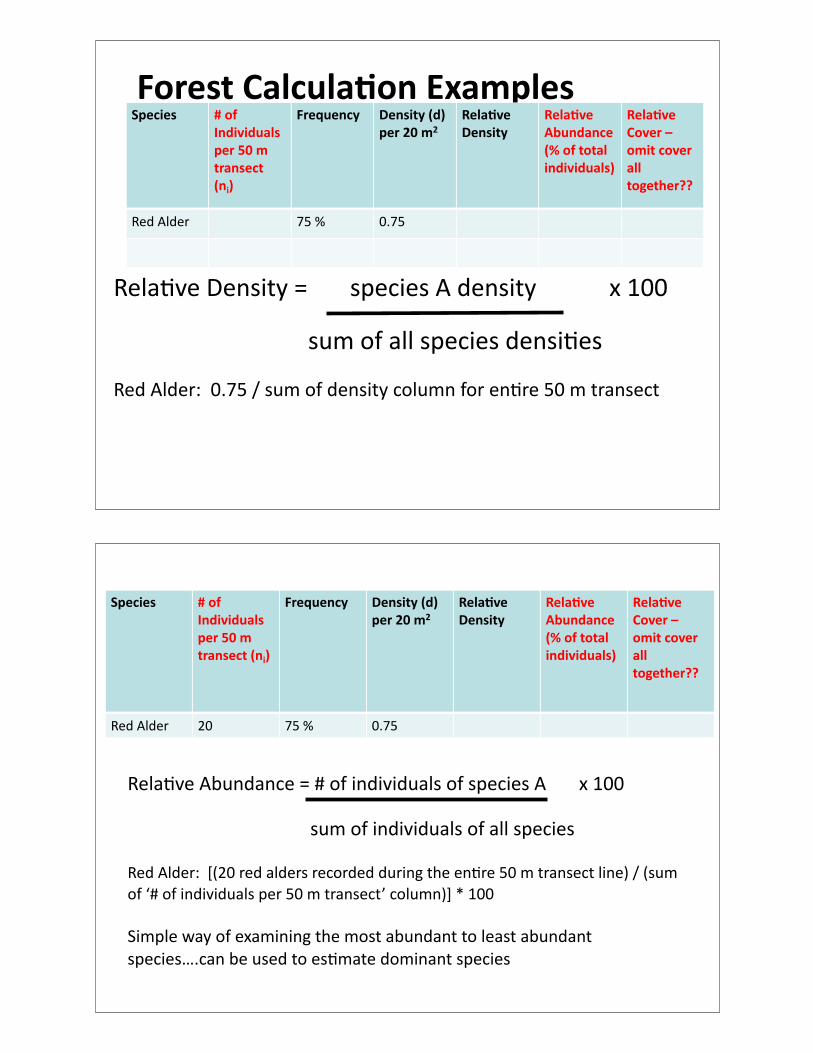
Forest)Calcula0on)Examples
Rela-ve%Density%=%%%%%%%species%A%density%%%%%%%%%%%%x%100
% % %%%%%%%%%%%%sum%of%all%species%densi-es
Red%Alder:%%0.75%/%sum%of%density%column%for%en-re%50%m%transect
Species #)of)Individuals)per)50)m)transect)(ni)
Frequency Density)(d))per)20)m2
Rela0ve)Density
Rela0ve)Abundance)(%)of)total)individuals)
Rela0ve)Cover)–)omit)cover)all)together??
Red%Alder 75%% 0.75
Rela-ve%Abundance%=%#%of%individuals%of%species%A%%%%%%%x%100
% % %%%%%%%%%%%%%sum%of%individuals%of%all%species
Red%Alder:%%[(20%red%alders%recorded%during%the%en-re%50%m%transect%line)%/%(sum%of%‘#%of%individuals%per%50%m%transect’%column)]%*%100
Simple'way'of'examining'the'most'abundant'to'least'abundant'species….can'be'used'to'es9mate'dominant'species
Species #)of)Individuals)per)50)m)transect)(ni)
Frequency Density)(d))per)20)m2
Rela0ve)Density
Rela0ve)Abundance)(%)of)total)individuals)
Rela0ve)Cover)–)omit)cover)all)together??
Red%Alder 20 75%% 0.75


