
����������������� ����������� �� ���� ������������������������������ ���!�"!
����������������� ������

Financial Statements 2012
KYOGLE COUNCIL
General Purpose Financial Statements for the financial year ended 30 June 2012
Contents
1. Statement by Councillors & Management
2. Primary Financial Statements:
- Income Statement- Statement of Comprehensive Income- Balance Sheet- Statement of Changes in Equity- Statement of Cash Flows
3. Notes to the Financial Statements
4. Independent Auditor's Reports:
- On the Financial Statements (Sect 417 [2])
- On the Conduct of the Audit (Sect 417 [3])
Overview
(i) These financial statements are General Purpose Financial Statements and cover the consolidated operations
for KYOGLE COUNCIL.
(ii) KYOGLE COUNCIL is a body politic of NSW, Australia - being constituted as a Local Government area
by proclamation and is duly empowered by the Local Government Act (LGA) 1993 of NSW.
Council's Statutory Charter is specified in Paragraph 8 of the LGA and includes;
carrying out activities and providing goods, services & facilities appropriate to the current & future
needs of the Local community and of the wider public
responsibility for administering regulatory requirements under the LGA and other applicable legislation, &
a role in the management, improvement and development of the resources of the local government area.
A description of the nature of Council's operations and its principal activities are provided in Note 2(b).
(iii) All figures presented in these financial statements are presented in Australian Currency.
(iv) These financial statements were authorised for issue by the Council on 30/10/12.
Council has the power to amend and reissue the financial statements.
Page
3
5
6
4
2
�
�
�
7
8
page 1

Financial Statements 2012
KYOGLE COUNCIL
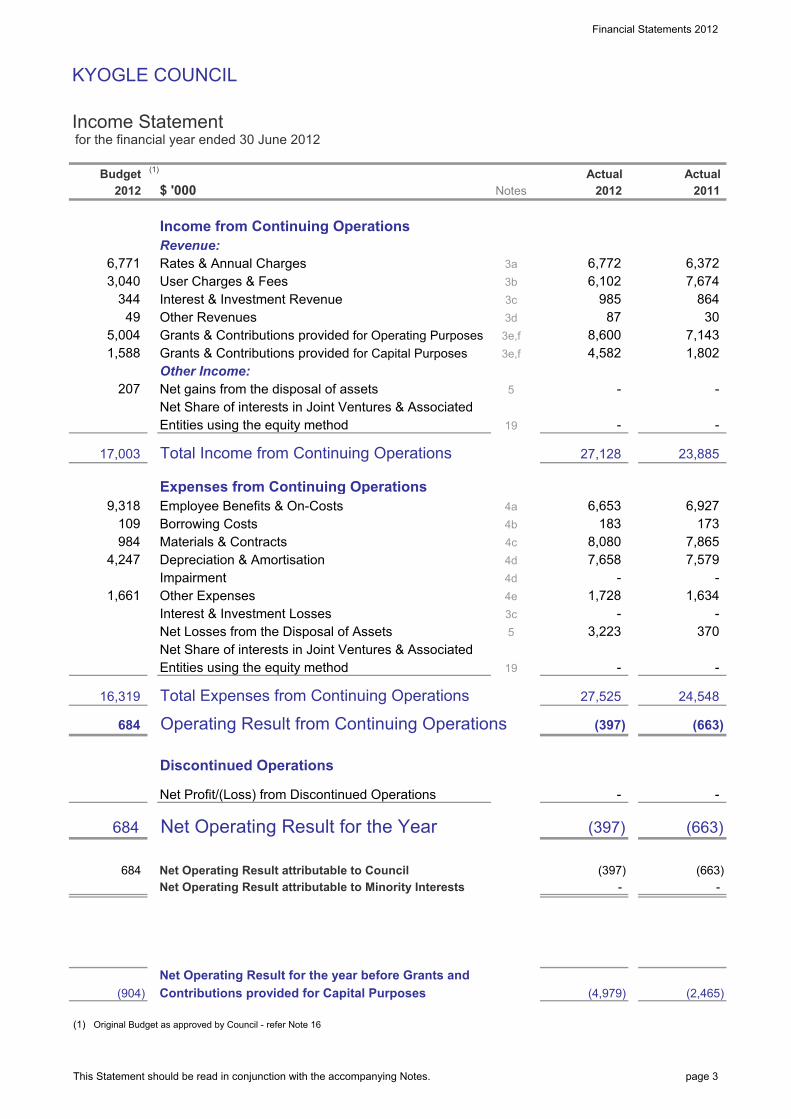
Income Statement for the financial year ended 30 June 2012
$ '000
Income from Continuing Operations
Revenue:
Rates & Annual Charges
User Charges & Fees
Interest & Investment Revenue
Other Revenues
Grants & Contributions provided for Operating Purposes
Grants & Contributions provided for Capital Purposes
Other Income:
Net gains from the disposal of assets
Net Share of interests in Joint Ventures & Associated
Entities using the equity method
Total Income from Continuing Operations
Expenses from Continuing Operations
Employee Benefits & On-Costs
Borrowing Costs
Materials & Contracts
Depreciation & Amortisation
Impairment
Other Expenses
Interest & Investment Losses
Net Losses from the Disposal of Assets
Net Share of interests in Joint Ventures & Associated
Entities using the equity method
Total Expenses from Continuing Operations
Operating Result from Continuing Operations
Discontinued Operations
Net Profit/(Loss) from Discontinued Operations
Net Operating Result for the Year
Net Operating Result attributable to Council
Net Operating Result attributable to Minority Interests
Net Operating Result for the year before Grants and
Contributions provided for Capital Purposes
Original Budget as approved by Council - refer Note 16
-
8,080
Actual
2012
183
4,582
-
(4,979)
-
Actual
2011
-
(2,465)
24,548
(663)
(663)
1,661
207
(1)
684
(904)
684
109
984
16,319
684
17,003
9,318
4,247
6,771
2012
344
1,588
3,040
49
5,004
3b
Notes
3a 6,772
6,102
6,372
7,674
3e,f
4d
5
4b
864
30
7,143
985
87
6,653
-
27,128
7,658
8,600
19
4a
3c
(397)
Budget(1)
-
-
4c
3d
3c
1,728
5
-
3,223
-
19
27,525
4d
3e,f 1,802
-
370
23,885
6,927
-
173
7,865
7,579
1,634
-
-
(663)
-
4e
(397)
(397)
This Statement should be read in conjunction with the accompanying Notes. page 3

Financial Statements 2012
KYOGLE COUNCIL
Statement of Comprehensive Income for the financial year ended 30 June 2012
$ '000
Net Operating Result for the year (as per Income statement)
Other Comprehensive Income
Gain (loss) on revaluation of I,PP&EGain (loss) on revaluation of available-for-sale investmentsGain (loss) on revaluation of other reservesRealised (gain) loss on available-for-sale investments recognised in P&LRealised (gain) loss from other reserves recognised in P&LImpairment (loss) reversal relating to I,PP&EOther Movements in Reserves - Recognition of Land Under Roads
Total Other Comprehensive Income for the year
Total Comprehensive Income for the Year
Total Comprehensive Income attributable to Council
Total Comprehensive Income attributable to Minority Interests
(397)
Actual
2012
13,777
13,777
14,440
-
Actual
3,391
2011
-
(663)
-
-
-
-
-
21,715
21,318
-
21,715
20b (ii)
20b (ii)
Notes
20b (ii)
20b (ii)
20b (ii)
20b (ii)
21,318
- 20b (ii)
-
11,049
-
-
This Statement should be read in conjunction with the accompanying Notes. page 4

Financial Statements 2012
KYOGLE COUNCIL
Balance Sheetas at 30 June 2012
$ '000
ASSETS
Current Assets
Cash & Cash Equivalents
Investments
Receivables
Inventories
Other
Non-current assets classified as "held for sale"
Total Current Assets
Non-Current Assets
Investments
Receivables
Infrastructure, Property, Plant & Equipment
Investments accounted for using the equity method
Investment Property
Intangible Assets
Other
Total Non-Current Assets
TOTAL ASSETS
LIABILITIES
Current Liabilities
Payables
Borrowings
Provisions
Total Current Liabilities
Non-Current Liabilities
Payables
Borrowings
Provisions
Total Non-Current Liabilities
TOTAL LIABILITIES
Net Assets
EQUITY
Retained Earnings
Revaluation Reserves
Council Equity Interest
Minority Equity Interest
Total Equity
6a
4,488
2012
-
1,210
2,348
125,978
2011
8
14
Actual
5,160
15,719
-
22,081
-
-
24,051
31
1,241
279,771
1,681
131
29
954
257,690
-
-
-
-
147,693
277,394
-
-
3,457
257,690
4,370
10 1,747
301,445
2,553
-
-
1,830
272,594
10
7,533
293,912
3,720
7,177
-
6b
8
7
Notes
256
18,571
-
736
Actual
9
-
19
8
7
277,394
248
20
293,912
272,594
146,616
272,594
123
146,219
3,163
10
-
293,912
6b
-
-
1,786
10
10
10
20
This Statement should be read in conjunction with the accompanying Notes. page 5

Financial Statements 2012
KYOGLE COUNCIL
Statement of Changes in Equity for the financial year ended 30 June 2012
$ '000
Opening Balance (as per Last Year's Audited Accounts)
a. Correction of Prior Period Errors
b. Changes in Accounting Policies (prior year effects)
Revised Opening Balance (as at 1/7/10)
c. Net Operating Result for the Year
d. Other Comprehensive Income
- Revaluations : IPP&E Asset Revaluation Rsve
Equity - Balance at end of the reporting period
$ '000
Opening Balance (as per Last Year's Audited Accounts)
a. Correction of Prior Period Errors
b. Changes in Accounting Policies (prior year effects)
Revised Opening Balance (as at 1/7/09)
c. Net Operating Result for the Year
d. Other Comprehensive Income
- Revaluations : IPP&E Asset Revaluation Rsve
- Land Under Roads Recognised
Equity - Balance at end of the reporting period
-
272,594
272,594
Total
147,693
-
(397)
293,912
-
-
272,594
-
Reserves
Interest
Total
-
Equity
21,715
146,616 125,978 - 272,594 272,594
125,978
11,049
(663)
Minority
-
258,817
293,912
Council
(397)
258,817
- -
-
Interest
-
-
-
-
Equity
258,817
-
-
(663)
11,049
Interest
-
272,594
(Refer 20b)
-
143,888
-
20b (ii)
Earnings
-
143,888
146,219
Notes
20b (i)
-
2011
3,391
-
114,929
114,929
(Refer 20b)
11,049
-
(663)
3,391
Retained
2012
20b (ii)
-
146,616
-
Reserves
Earnings
Minority
Notes
Retained
21,715
(397)
146,616
-
-
21,715
258,817
3,391
-
Interest
125,978
Council
-
This Statement should be read in conjunction with the accompanying Notes. page 6

Financial Statements 2012
KYOGLE COUNCIL
Statement of Cash Flows for the financial year ended 30 June 2012
$ '000
Cash Flows from Operating Activities
Receipts:
Rates & Annual Charges
User Charges & Fees
Investment & Interest Revenue Received
Grants & Contributions
Bonds, Deposits & Retention amounts received
Other
Payments:
Employee Benefits & On-Costs
Materials & Contracts
Borrowing Costs
Bonds, Deposits & Retention amounts refunded
Other
Net Cash provided (or used in) Operating Activities
Cash Flows from Investing Activities
Receipts:
Sale of Infrastructure, Property, Plant & Equipment
Payments:
Purchase of Infrastructure, Property, Plant & Equipment
Net Cash provided (or used in) Investing Activities
Cash Flows from Financing Activities
Receipts:
Proceeds from Borrowings & Advances
Payments:
Repayment of Borrowings & Advances
Net Cash Flow provided (used in) Financing Activities
Net Increase/(Decrease) in Cash & Cash Equivalents
plus: Cash & Cash Equivalents - beginning of year
Cash & Cash Equivalents - end of the year
Please refer to Note 11 for information on the following:
- Non Cash Financing & Investing Activities.
- Financing Arrangements.
- Net cash flow disclosures relating to any Discontinued Operations
(8,449)
(97) (97)
(7,492)
(6,566)
153
6,432
2012Notes 2011
Actual
(1,980)
(61)
11b
427
9,700 (2,348)
(7,000)
44 -
8,519 12,335
(4,963)
300
(31)
(4,732)
-
507
(5,470)
15,717
30
269
15,687 11a
(9,318)
49
Budget
6,771
6,592
2012
3,040
344
(109)
4,724 (1,661)
(984)
15,719
(27)
13,928
(27)
1,791
(6,819)
-
18,571 11a
(29)
(29)
15,719
2,852
608 506
-
6,550
973
8,037
870
Actual
6,327
6,223
(7,427) (5,238)
This Statement should be read in conjunction with the accompanying Notes. page 7
Financial Statements 2012
KYOGLE COUNCIL
Notes to the Financial Statements for the financial year ended 30 June 2012
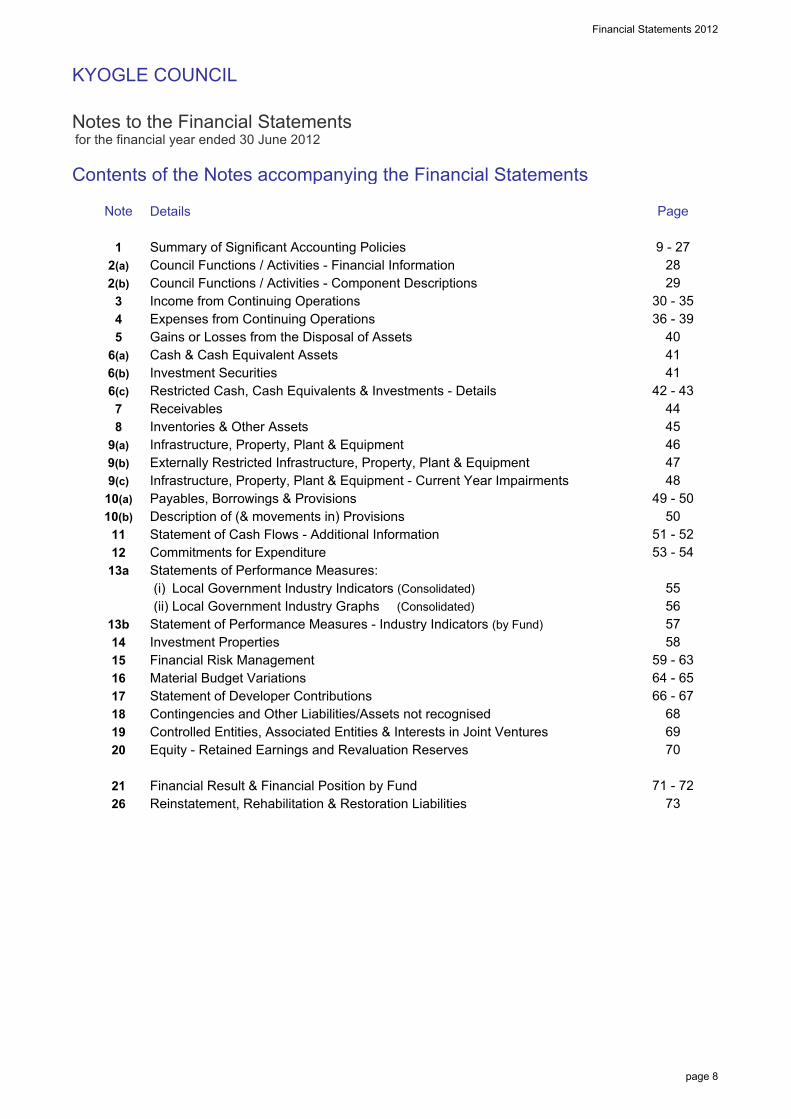
Contents of the Notes accompanying the Financial Statements
Details
Summary of Significant Accounting Policies
Council Functions / Activities - Financial Information
Council Functions / Activities - Component Descriptions
Income from Continuing Operations
Expenses from Continuing Operations
Gains or Losses from the Disposal of Assets
Cash & Cash Equivalent Assets
Investment Securities
Restricted Cash, Cash Equivalents & Investments - Details
Receivables
Inventories & Other Assets
Infrastructure, Property, Plant & Equipment
Externally Restricted Infrastructure, Property, Plant & Equipment
Infrastructure, Property, Plant & Equipment - Current Year Impairments
Payables, Borrowings & Provisions
Description of (& movements in) Provisions
Statement of Cash Flows - Additional Information
Commitments for Expenditure
Statements of Performance Measures:
(i) Local Government Industry Indicators (Consolidated)
(ii) Local Government Industry Graphs (Consolidated)
Statement of Performance Measures - Industry Indicators (by Fund)
Investment Properties
Financial Risk Management
Material Budget Variations
Statement of Developer Contributions
Contingencies and Other Liabilities/Assets not recognised
Controlled Entities, Associated Entities & Interests in Joint Ventures
Equity - Retained Earnings and Revaluation Reserves
Financial Result & Financial Position by Fund
Reinstatement, Rehabilitation & Restoration Liabilities
69
64 - 65
66 - 67
71 - 72
70
68
73
7
8
9(a)
9(b)
16
20
21
26
59 - 63
55
53 - 54
57
56
58
9(c)
11
4
13b
36 - 39
41
51 - 52
46
48
45
50
47
5
6(a)
49 - 50
14
10(a)
10(b)
17
18
12
13a
19
15
Page
1
44
40
41
42 - 43
9 - 27
28
29
30 - 35
2(a)
3
2(b)
6(b)
Note
6(c)
page 8

Financial Statements 2012_
Kyogle Council
Notes to the Financial Statementsfor the financial year ended 30 June 2012
Note 1. Summary of Significant Accounting Policies�
page 9
The principal accounting policies adopted by Council in the preparation of these consolidated financial statements are set out below in order to assist in its general understanding.
Under Australian Accounting Standards (AASB's), accounting policies are defined as those specific principles, bases, conventions, rules and practices applied by a reporting entity (in this case Council) in preparing and presenting its financial statements.
(a) Basis of preparation
(i) Background
These financial statements are general purpose financial statements which have been prepared in accordance with;
� Australian Accounting Standards and Interpretations issued by the Australian Accounting Standards Board,
� the Local Government Act (1993) & Regulation, and
� the Local Government Code of Accounting Practice and Financial Reporting.
For the purpose of preparing these financial statements, Council has been deemed to be a not-for-profit entity.
(ii) Compliance with International Financial Reporting Standards (IFRSs)
Because Australian Accounting Standards (AASB's) are sector neutral, some standards either:
(a) have local Australian content and prescription that is specific to the Not-For-Profit sector (including Local Government) which are not in compliance with IFRS’s, or
(b) specifically exclude application by Not for Profit entities.
Accordingly in preparing these financial statementsand accompanying notes, Council has been unable to comply fully with International Accounting Standards, but has complied fully with Australian Accounting Standards.
Under the Local Government Act (LGA), Regulations and Local Government Code of Accounting Practice & Financial Reporting, it should be noted that Councils in NSW only have a requirement to comply with Australian Accounting Standards.
(iii) New and amended standards adopted by Council
None of the new standards and amendments to standards that are mandatory for the first time for the financial year beginning 1 July 2011 affected any of the amounts recognised in the current period or any prior period and are not likely to affect future periods.
(iv) Early adoption of Accounting Standards
Council has not elected to apply any pronouncements before their operative date in the annual reporting period beginning 1 July 2011.
Refer further to paragraph (aa) relating to a summary of the effects of Standards with future operative dates.
(v) Basis of Accounting
These financial statements have been prepared under the historical cost convention except for:
(i) financial assets and liabilities at fair value through profit or loss, available-for-sale financial assets and investment properties which are all valued at fair value,
(ii) the write down of any Asset on the basis of Impairment (if warranted) and
(iii) certain classes of Infrastructure, property, plant & equipment that are accounted for at fair valuation.
The accrual basis of accounting has also been applied in their preparation.
(vi) Changes in Accounting Policies
Council’s accounting policies have been consistently applied to all the years presented, unless otherwise stated.
There have also been no changes in accounting policies when compared with previous financial statements unless otherwise stated [refer Note 20(d)].

Financial Statements 2012_
Kyogle Council
Notes to the Financial Statementsfor the financial year ended 30 June 2012
Note 1. Summary of Significant Accounting Policies (continued)
�
�
page 10
(vii) Critical Accounting Estimates
The preparation of financial statements requires the use of certain critical accounting estimates (in conformity with AASB's).
Accordingly this requires management to exercise its judgement in the process of applying the Council's accounting policies.
Estimates and judgements are continually evaluated and are based on historical experience and other factors, including expectations of future events that may have a financial impact on the entity and that are believed to be reasonable under the circumstances.
Critical accounting estimates and assumptions
Council makes estimates and assumptions concerning the future.
The resulting accounting estimates will, by definition, seldom equal the related actual results.
The estimates and assumptions that have a significant risk of causing a material adjustment to the carrying amounts of assets and liabilities within the next financial year are set out below.
(i) Estimated fair values of investment properties
(ii) Estimated fair values of infrastructure, property, plant and equipment.
(iii) Estimated tip remediation provisions.
Critical judgements in applying the entity's accounting policies
(i) Impairment of Receivables - Council has made a significant judgement about the impairment of a number of its receivables in Note 7.
(ii) Projected Section 94 Commitments - Council has used significant judgement in determining future Section 94 income and expenditure in Note 17.
(b) Revenue recognition
Council recognises revenue when the amount of revenue can be reliably measured, it is probable that
future economic benefits will flow to the entity and specific criteria have been met for each of the Council’s activities as described below.
Council bases any estimates on historical results, taking into consideration the type of customer, the type of transaction and the specifics of each arrangement. Revenue is measured at the fair value of the consideration received or receivable.
Revenue is measured on major income categories as follows:
Rates, Annual Charges, Grants and Contributions
Rates, annual charges, grants and contributions (including developer contributions) are recognised as revenues when the Council obtains control over the assets comprising these receipts.
Control over assets acquired from rates and annual charges is obtained at the commencement of the rating year as it is an enforceable debt linked to the rateable property or, where earlier, upon receipt of the rates.
A provision for the impairment on rates receivables has not been established as unpaid rates represent a charge against the rateable property that will be recovered when the property is next sold.
Control over granted assets is normally obtained upon their receipt (or acquittal) or upon earlier notification that a grant has been secured, and is valued at their fair value at the date of transfer.
Revenue from Contributions is recognised when the Council either obtains control of the contribution or the right to receive it, (i) it is probable that the economic benefits comprising the contribution will flow to the Council and (ii) the amount of the contribution can be measured reliably.
Where grants or contributions recognised as revenues during the financial year were obtained on condition that they be expended in a particular manner or used over a particular period and those conditions were undischarged at balance date, the unused grant or contribution is disclosed in Note 3(g).

Financial Statements 2012_
Kyogle Council
Notes to the Financial Statementsfor the financial year ended 30 June 2012
Note 1. Summary of Significant Accounting Policies (continued)
�
�
page 11
Note 3(g) also discloses the amount of unused grant or contribution from prior years that was expended on Council’s operations during the current year.
The Council has obligations to provide facilities from contribution revenues levied on developers under the provisions of S94 of the EPA Act 1979. Whilst Council generally incorporates these amounts as part of a Development Consents Order, such developer contributions are only recognised as income upon their physical receipt by Council, due to the possibility that individual Development Consents may not be acted upon by the applicant and accordingly would not be payable to Council.
Developer contributions may only be expended for the purposes for which the contributions were required but the Council may apply contributions according to the priorities established in work schedules.
A detailed Note relating to developer contributions can be found at Note 17.
User Charges, Fees and Other Income
User charges, fees and other income (including parking fees and fines) are recognised as revenue when the service has been provided, the payment is received, or when the penalty has been applied, whichever first occurs.
A provision for the impairment of these receivables is recognised when collection in full is no longer probable.
A liability is recognised in respect of revenue that is reciprocal in nature to the extent that the requisite service has not been provided as at balance date.
Sale of Infrastructure, Property, Plant and Equipment
The profit or loss on sale of an asset is determined when control of the asset has irrevocably passed to the buyer.
Interest and Rents
Rents are recognised as revenue on a proportional basis when the payment is due, the value of the payment is notified, or the payment is received, whichever first occurs.
Interest Income from Cash & Investments is accounted for using the Effective Interest method in accordance with AASB 139.
(c) Principles of Consolidation
These financial statements incorporate (i) the assets and liabilities of Council and any Entities (or operations) that it controls (as at 30/6/12) and (ii) all the related operating results (for the financial year ended the 30th June 2012).
The financial statements also include Council’s share of the assets, liabilities, income and expenses of any Jointly Controlled Operations under the appropriate headings.
In the process of reporting on Council’s activities as a single unit, all inter-entity year end balances and reporting period transactions have been eliminated in full between Council and its controlled entities.
(i) The Consolidated Fund
In accordance with the provisions of Section 409(1) of the LGA 1993, all money and property received by Council is held in the Council’s Consolidated Fund unless it is required to be held in the Council’s Trust Fund.
The Consolidated Fund and other entities through which the Council controls resources to carry on its functions have been included in the financial statements forming part of this report.
The following entities have been included as part of the Consolidated Fund:
� General Purpose Operations � Water Supply � Sewerage Service � Domestic Waste Management
Due to their immaterial value and nature, the following Committees, Entities & Operations have been excluded from consolidation:
� Australia Day Committees � Progress Associations
The (i) total income and expenditure from continuing operations and (ii) the net assets held by these excluded Committees & Operations is as follows:

Financial Statements 2012_
Kyogle Council
Notes to the Financial Statementsfor the financial year ended 30 June 2012
Note 1. Summary of Significant Accounting Policies (continued)
�
�
page 12
Total income from continuing operations $0
Total expenditure from continuing operations $10,000
Total net assets held (ie Equity) $4,000
Note:Where actual figures are not known, best estimates have been applied.
(ii) The Trust Fund
In accordance with the provisions of Section 411 of the Local Government Act 1993 (as amended), a separate and distinct Trust Fund is maintained to account for all money and property received by the Council in trust which must be applied only for the purposes of or in accordance with the trusts relating to those monies.
Trust monies and property subject to Council’s control have been included in these statements.
Trust monies and property held by Council but not subject to the control of Council, have been excluded from these statements.
A separate statement of monies held in the Trust Fund is available for inspection at the Council office by any person free of charge.
(iii) Joint Ventures
Jointly Controlled Assets & Operations
The proportionate interests in the assets, liabilities and expenses of a Joint Venture Activity have been incorporated throughout the financial statements under the appropriate headings.
Jointly Controlled Entities
Any interests in Joint Venture Entities & Partnerships are accounted for using the equity method and is carried at cost.
Under the equity method, the share of the profits or losses of the partnership is recognised in the income statement, and the share of movements in retained earnings & reserves is recognised in the balance sheet.
(iv) Associated Entities
Where Council has the power to participate in the financial and operating decisions (of another entity), ie. where Council is deemed to have “significant influence” over the other entities operations but neither controls nor jointly controls the entity, then Council accounts for such interests using the equity method of accounting – in a similar fashion to Joint Venture Entities & Partnerships.
Such entities are usually termed Associates.
(v) County Councils
Council is a member of the Far North Coast County Council, a body corporate established under the Local Government Act to control weeds in the Far North Coast Area. Council is one of 6 constituent members and neither controls or significantly influences the County Council. Accordingly, the County Council has not been consolidated or otherwise included in the financial statements.
(vi) Additional Information
Note 19 provides more information in relation to Joint Venture Entities, Associated Entities and Joint Venture Operations where applicable.
(d) Leases
All Leases entered into by Council are reviewed and classified on inception date as either a Finance Lease or an Operating Lease.
Finance Leases
Leases of property, plant and equipment where the Council has substantially all the risks and rewards of ownership are classified as finance leases.
Finance leases are capitalised at the lease’s inception at the lower of the fair value of the leased property and the present value of the minimum lease payments.
The corresponding rental obligations, net of finance charges, are included in borrowings.
Each lease payment is allocated between the liability outstanding and the recognition of a finance charge.

Financial Statements 2012_
Kyogle Council
Notes to the Financial Statementsfor the financial year ended 30 June 2012
Note 1. Summary of Significant Accounting Policies (continued)
�
�
page 13
The interest element of the finance charge is costed to the income statement over the lease period so as to produce a constant periodic rate of interest on the remaining balance of the liability for each period.
Property, plant and equipment acquired under finance leases is depreciated over the shorter of each leased asset’s useful life and the lease term.
Operating Leases
Leases in which a significant portion of the risks and rewards of ownership are retained by the lessor are classified as operating leases.
Payments made under operating leases (net of any incentives received from the lessor) are charged to the income statement on a straight-line basis over the period of the lease.
Lease income from operating leases is recognised in income on a straight-line basis over the lease term.
(e) Cash and Cash Equivalents
Cash and cash equivalents includes;
� cash on hand,
� deposits held at call with financial institutions,
� other short-term, highly liquid investments with original maturities of three months or less that are readily convertible to known amounts of cash and which are subject to an insignificant risk of changes in value, and
� bank overdrafts.
Bank overdrafts are shown within borrowings in current liabilities on the balance sheet but are incorporated into Cash & Cash Equivalents for presentation of the Cash Flow Statement.
(f) Investments and Other Financial Assets
Council (in accordance with AASB 139) classifies each of its investments into one of the following categories for measurement purposes:
� financial assets at fair value through profit or loss,
� loans and receivables,
� held-to-maturity investments, and
� available-for-sale financial assets.
Each classification depends on the purpose/intention for which the investment was acquired & at the time it was acquired.
Management determines each Investment classification at the time of initial recognition and re-evaluates this designation at each reporting date.
(i) Financial assets at fair value through profit or loss
Financial assets at fair value through profit or loss include financial assets that are “held for trading”.
A financial asset is classified in the “held for trading” category if it is acquired principally for the purpose of selling in the short term.
Derivatives are classified as held for trading unless they are designated as hedges.
Assets in this category are primarily classified as current assets as they are primarily held for trading &/or are expected to be realised within 12 months of the balance sheet date.
(ii) Loans and receivables
Loans and receivables are non derivative financial assets with fixed or determinable payments that are not quoted in an active market.
They arise when the Council provides money, goods or services directly to a debtor with no intention (or in some cases ability) of selling the resulting receivable.
They are included in current assets, except for those with maturities greater than 12 months after the balance sheet date which are classified as non-current assets.

Financial Statements 2012_
Kyogle Council
Notes to the Financial Statementsfor the financial year ended 30 June 2012
Note 1. Summary of Significant Accounting Policies (continued)
�
�
page 14
(iii) Held-to-maturity investments
Held-to-maturity investments are non-derivative financial assets with fixed or determinable payments and fixed maturities that the Council’s management has the positive intention and ability to hold to maturity.
In contrast to the “Loans & Receivables” classification, these investments are generally quoted in an active market.
Held-to-maturity financial assets are included in non-current assets, except for those with maturities less than 12 months from the reporting date, which are classified as current assets.
(iv) Available-for-sale financial assets
Available-for-sale financial assets are non-derivatives that are either designated in this category or not classified in any of the other categories.
Investments must be designated as available-for-sale if they do not have fixed maturities and fixed or determinable payments and management intends to hold them for the medium to long term.
Accordingly, this classification principally comprises marketable equity securities, but can include all types of financial assets that could otherwise be classified in one of the other investment categories.
They are generally included in non-current assets unless management intends to dispose of the investment within 12 months of the balance sheet date or the term to maturity from the reporting date is less than 12 months.
Financial Assets – Reclassification
Council may choose to reclassify a non-derivative trading financial asset out of the held-for-trading category if the financial asset is no longer held for the purpose of selling it in the near term.
Financial assets other than loans and receivables are permitted to be reclassified out of the held-for-trading category only in rare circumstances arising from a single event that is unusual and highly unlikely to recur in the near term.
Council may also choose to reclassify financial assets that would meet the definition of loans and
receivables out of the held-for-trading or available-for-sale categories if it has the intention and ability to hold these financial assets for the foreseeable future or until maturity at the date of reclassification.
Reclassifications are made at fair value as of the reclassification date. Fair value becomes the new cost or amortised cost as applicable, and no reversals of fair value gains or losses recorded before reclassification date are subsequently made.
Effective interest rates for financial assets reclassified to loans and receivables and held-to-maturity categories are determined at the reclassification date. Further increases in estimates of cash flows adjust effective interest rates prospectively.
General Accounting & Measurement of Financial Instruments:
(i) Initial Recognition
Investments are initially recognised (and measured)at fair value, plus in the case of investments not at “fair value through profit or loss”, directly attributable transactions costs
Purchases and sales of investments are recognised on trade-date - the date on which the Council commits to purchase or sell the asset.
Financial assets are derecognised when the rights to receive cash flows from the financial assets have expired or have been transferred and the Council has transferred substantially all the risks and rewards of ownership.
(ii) Subsequent Measurement
Available-for-sale financial assets and financial assets at fair value through profit and loss are subsequently carried at fair value.
Loans and receivables and held-to-maturityinvestments are carried at amortised cost using the effective interest method.
Realised and unrealised gains and losses arising from changes in the fair value of the financial assets classified as “fair value through profit or loss”category are included in the income statement in the period in which they arise.
Financial Statements 2012_
Kyogle Council
Notes to the Financial Statementsfor the financial year ended 30 June 2012
Note 1. Summary of Significant Accounting Policies (continued)
�
�
page 15
Unrealised gains and losses arising from changes in the fair value of non monetary securities classified as "available-for-sale" are recognised in equity in the available-for-sale investments revaluation reserve.
When securities classified as "available-for-sale"are sold or impaired, the accumulated fair value adjustments are included in the income statement as gains and losses from investment securities.
Impairment
Council assesses at each balance date whether there is objective evidence that a financial asset or group of financial assets is impaired.
A financial asset or a group of financial assets is impaired and impairment losses are incurred only if there is objective evidence of impairment as a result of one or more events that occurred after the initial recognition of the asset (a ‘loss event’) and that loss event (or events) has an impact on the estimated future cash flows of the financial asset or group of financial assets that can be reliably estimated.
In the case of equity securities classified as available-for-sale, a significant or prolonged decline in the fair value of a security below its cost is considered in determining whether the security is impaired.
If any such evidence exists for available-for-sale financial assets, the cumulative loss - measured as the difference between the acquisition cost and the current fair value, less any impairment loss on that financial asset previously recognised in profit and loss - is removed from equity and recognised in the income statement.
Impairment losses recognised in the income statement on equity instruments are not reversed through the income statement.
If there is evidence of impairment for any of Council’s financial assets carried at amortised cost (eg. loans and receivables), the amount of the loss is measured as the difference between the asset’s carrying amount and the present value of estimated future cash flows (excluding future credit losses that have not been incurred) discounted at the financial asset’s original effective interest rate.
The carrying amount of the asset is reduced and the amount of the loss is recognised in profit or loss. If a loan or held-to-maturity investment has a variable interest rate, the discount rate for measuring any impairment loss is the current effective interest rate determined under the contract.
As a practical expedient, the group may measure impairment on the basis of an instrument’s fair value using an observable market price.
(iii) Types of Investments
Council has an approved Investment Policy in order to undertake its investment of money in accordance with (and to comply with) Section 625 of the Local Government Act and S212 of the LG (General) Regulation 2005.
Investments are placed and managed in accordance with the Policy and having particular regard to authorised investments prescribed under the Ministerial Local Government Investment Order.
Council maintains its investment Policy in compliance with the Act and ensures that it or its representatives exercise care, diligence and skill that a prudent person would exercise in investing Council funds.
Council amended its policy following revisions to the Ministerial Local Government Investment Order arising from the Cole Inquiry recommendations.
(g) Fair value estimation
The fair value of financial assets and financial liabilities must be estimated for recognition and measurement or for disclosure purposes.
The fair value of financial instruments traded in active markets is based on quoted market prices at the balance sheet date.
The fair value of financial instruments that are not traded in an active market is determined using valuation techniques.
Council uses a variety of methods and makes assumptions that are based on market conditions existing at each balance date.

Financial Statements 2012_
Kyogle Council
Notes to the Financial Statementsfor the financial year ended 30 June 2012
Note 1. Summary of Significant Accounting Policies (continued)
�
�
page 16
Quoted market prices or dealer quotes for similar instruments are used for long-term debt instruments held.
If the market for a financial asset is not active (and for unlisted securities), the Council establishes fair value by using valuation techniques.
These include reference to the fair values of recent arm’s length transactions, involving the same instruments or other instruments that are substantially the same, discounted cash flow analysis, and option pricing models refined to reflect the issuer’s specific circumstances.
The nominal value less estimated credit adjustments of trade receivables and payables are assumed to approximate their fair values.
The fair value of financial liabilities for disclosure purposes is estimated by discounting the future contractual cash flows at the current market interest rate that is available to the Council for similar financial instruments.
(h) Receivables
Receivables are initially recognised at fair value and subsequently measured at amortised cost, less any provision for impairment.
Receivables (excluding Rates & Annual Charges) are generally due for settlement no more than 30 days from the date of recognition.
The collectibility of receivables is reviewed on an ongoing basis. Debts which are known to be uncollectible are written off in accordance with Council’s policy.
A provision for impairment (ie. an allowance account) relating to receivables is established when there is objective evidence that the Council will not be able to collect all amounts due according to the original terms of each receivable.
The amount of the provision is the difference between the asset’s carrying amount and the present value of estimated future cash flows, discounted at the effective interest rate.
Impairment losses are recognised in the Income Statement within other expenses.
When a receivable for which an impairment allowance had been recognised becomes uncollectible in a subsequent period, it is written off against the allowance account.
Subsequent recoveries of amounts previously written off are credited against other expenses in the income statement.
(i) Inventories
Raw Materials and Stores, Work in Progress and Finished Goods
Raw materials and stores, work in progress and finished goods in respect of business undertakings are all stated at the lower of cost and net realisable value.
Cost comprises direct materials, direct labour and an appropriate proportion of variable and fixed overhead expenditure, the latter being allocated on the basis of normal operating capacity.
Costs are assigned to individual items of inventory on the basis of weighted average costs. Net realisable value is the estimated selling price in the ordinary course of business less the estimated costs of completion and the estimated costs necessary to make the sale.
Inventories held in respect of non-business undertakings have been valued at cost subject to adjustment for loss of service potential.
Land Held for Resale/Capitalisation of Borrowing Costs
Land held for resale is stated at the lower of cost and net realisable value.
Cost is assigned by specific identification and includes the cost of acquisition, and development and borrowing costs during development.
When development is completed borrowing costs and other holding charges are expensed as incurred.
Borrowing costs included in the cost of land held for resale are those costs that would have been avoided

Financial Statements 2012_
Kyogle Council
Notes to the Financial Statementsfor the financial year ended 30 June 2012
Note 1. Summary of Significant Accounting Policies (continued)
�
�
page 17
if the expenditure on the acquisition and development of the land had not been made.
Borrowing costs incurred while active development is interrupted for extended periods are recognised as expenses.
(j) Infrastructure, Property, Plant and Equipment (I,PP&E)
Acquisition of assets
Council’s non current assets have been progressively revalued to fair value in accordance with a staged implementation as advised by the Division of Local Government.
At balance date, the following classes of I,PP&E were stated at their Fair Value;
- Water and Sewerage Networks(Internal Valuation)
- Operational Land (External Valuation)
- Buildings – Specialised/Non Specialised (External Valuation)
- Plant and Equipment(as approximated by depreciated historical cost)
- Roads Assets incl. roads, bridges & footpaths (Internal Valuation)
- Drainage Assets (Internal Valuation)
- Bulk Earthworks (Internal Valuation)
- Community Land (External Valuation)
- Land Improvements (Internal Valuation)
- Other Structures (External Valuation)
- Other Assets(as approximated by depreciated historical cost)
Initial Recognition
On initial recognition, an assets cost is measured at its fair value, plus all expenditure that is directly attributable to the acquisition.
Where settlement of any part of an asset’s cash consideration is deferred, the amounts payable in the future are discounted to their present value as at the date of recognition (ie. date of exchange) of the asset to arrive at fair value.
The discount rate used is the Council’s incremental borrowing rate, being the rate at which a similar borrowing could be obtained from an independent financier under comparable terms and conditions.
Where infrastructure, property, plant and equipment assets are acquired for no cost or for an amount other than cost, the assets are recognised in the financial statements at their fair value at acquisition date - being the amount that the asset could have been exchanged between knowledgeable willing parties in an arm’s length transaction.
Subsequent costs
Subsequent costs are included in the asset’s carrying amount or recognised as a separate asset, as appropriate, only when it is probable that future economic benefits associated with the item will flow to Council and the cost of the item can be measured reliably. All other repairs and maintenance are charged to the income statement during the financial period in which they are incurred.
Asset Revaluations (including Indexation)
In accounting for Asset Revaluations relating to Infrastructure, Property, Plant & Equipment:
� Increases in the carrying amounts arising on revaluation are credited to the asset revaluation reserve.
� To the extent that the increase reverses a decrease previously recognised via the profit or loss, then increase is first recognised in profit or loss.
� Decreases that reverse previous increases of the same asset are first charged against revaluation reserves directly in equity to the extent of the remaining reserve attributable to the asset, with all other decreases charged to the Income statement.

Financial Statements 2012_
Kyogle Council
Notes to the Financial Statementsfor the financial year ended 30 June 2012
Note 1. Summary of Significant Accounting Policies (continued)
�
�
page 18
Water and sewerage network assets are indexed annually between full revaluations in accordance with the latest indices provided in the NSW Office of Water - Rates Reference Manual.
For all other assets, Council assesses at each reporting date whether there is any indication that a revalued asset’s carrying amount may differ materially from that which would be determined if the asset were revalued at the reporting date.
If any such indication exists, Council determines the asset’s fair value and revalues the asset to that amount.
Full revaluations are undertaken for all assets on a 5 year cycle.
Capitalisation Thresholds
Items of infrastructure, property, plant and equipment are not capitalised unless their cost of acquisition exceeds the following;
Land - council land 100% Capitalised - open space 100% Capitalised - land under roads 100% Capitalised
Plant & Equipment Office Furniture > $1,000 Office Equipment > $1,000 Other Plant &Equipment > $1,000
Buildings & Land Improvements Park Furniture & Equipment > $2,000
Building - construction/extensions 100% Capitalised - renovations > $10,000
Other Structures > $2,000
Water & Sewer Assets Reticulation extensions > $5,000 Other > $5,000
Stormwater Assets Drains & Culverts > $5,000 Other > $5,000
Transport Assets Road construction & reconstruction > $10,000 Reseal/Re-sheet & major repairs: > $10,000
Bridge construction & reconstruction > $10,000
Depreciation
Depreciation on Council's infrastructure, property, plant and equipment assets is calculated using the straight line method in order to allocate an assetscost (net of residual values) over its estimated useful life.
Land is not depreciated.
Estimated useful lives for Council's I,PP&E include:
Plant & Equipment - Office Equipment 5 to 10 years - Office furniture 10 to 20 years - Computer Equipment 3 years - Vehicles 5 to 12 years - Heavy Plant/Road Making equip. 5 to 12 years - Other plant and equipment 5 to 15 years
Other Equipment - Playground equipment 5 to 15 years - Benches, seats etc 10 to 20 years
Buildings - Buildings : Masonry 50 to 100 years - Buildings : Other 20 to 40 years
Stormwater Drainage - Drains 70 to 100 years - Culverts 80 to 100 years
Transportation Assets - Sealed Roads : Surface 10 to 30 years - Sealed Roads : Structure 100 years - Unsealed roads 20 years - Bridge : Concrete 80 to 100 years - Bridge : Other 50 years
- Road Pavements 60 years - Kerb, Gutter & Paths 40 years

Financial Statements 2012_
Kyogle Council
Notes to the Financial Statementsfor the financial year ended 30 June 2012
Note 1. Summary of Significant Accounting Policies (continued)
�
�
page 19
Water & Sewer Assets - Dams and reservoirs 80 to 100 years - Bores 20 to 40 years
- Reticulation pipes : PVC 80 years - Reticulation pipes : Other 25 to 75 years - Pumps and telemetry 15 to 20 years
Other Infrastructure Assets- Bulk earthworks Infinite
All asset residual values and useful lives are reviewed and adjusted (where appropriate), at each balance sheet date.
An asset’s carrying amount is written down immediately to its recoverable amount if the asset’s carrying amount is greater than its estimated recoverable amount – refer Note 1(r) on Asset Impairment.
Disposal and De-recognition
An item of property, plant and equipment is derecognised upon disposal or when no further future economic benefits are expected from its use or disposal.
Any gain or loss arising on derecognition of the asset (calculated as the difference between the net disposal proceeds and the carrying amount of the asset) is included in Council’s Income Statement in the year the asset is derecognised.
(k) Land
Land (other than Land under Roads) is in accordance with Part 2 of Chapter 6 of the Local Government Act (1993) classified as either Operational or Community.
This classification of Land is disclosed in Note 9(a).
(l) Land under roads
Land under roads is land under roadways and road reserves including land under footpaths, nature strips and median strips.
Council has elected to recognise land under roads acquired before 1 July 2008 in accordance with AASB 1051.
Land under roads acquired after 1 July 2008 is recognised in accordance with AASB 116 – Property, Plant and Equipment.
(m) Intangible Assets
Council has not classified any assets as Intangible.
(n) Crown Reserves
Crown Reserves under Council’s care and control are recognised as assets of the Council.
While ownership of the reserves remains with the Crown, Council retains operational control of the reserves and is responsible for their maintenance and use in accordance with the specific purposes to which the reserves are dedicated.
Improvements on Crown Reserves are also recorded as assets, while maintenance costs incurred by Council and revenues relating the reserves are recognised within Council’s Income Statement.
Representations are currently being sought across State and Local Government to develop a consistent accounting treatment for Crown Reserves across both tiers of government.
(o) Rural Fire Service assets
Under section 119 of the Rural Fires Act 1997, “all fire fighting equipment purchased or constructed wholly or from money to the credit of the Fund is to be vested in the council of the area for or on behalf of which the fire fighting equipment has been purchased or constructed”.
At present, the accounting for such fire fighting equipment is not treated in a consistent manner across all Councils.
Until such time as discussions on this matter have concluded and the legislation changed, Council will continue to account for these assets as it has been

Financial Statements 2012_
Kyogle Council
Notes to the Financial Statementsfor the financial year ended 30 June 2012
Note 1. Summary of Significant Accounting Policies (continued)
�
�
page 20
doing in previous years, which is to incorporate the assets, their values and depreciation charges within these financial statements.
(p) Provisions for close down, restoration and for environmental clean up costs – including Tips and Quarries
Close down, Restoration and Remediation costs include the dismantling and demolition of infrastructure, the removal of residual materials and the remediation of disturbed areas.
Estimated close down and restoration costs are provided for in the accounting period when the obligation arising from the related disturbance occurs, whether this occurs during the development or during the operation phase, based on the net present value of estimated future costs.
Provisions for close down and restoration costs do not include any additional obligations which are expected to arise from future disturbance.
Costs are estimated on the basis of a closure plan.
The cost estimates are calculated annually during the life of the operation to reflect known developments, eg updated cost estimates and revisions to the estimated lives of operations, and are subject to formal review at regular intervals.
Close down, Restoration and Remediation costs are a normal consequence of tip and quarry operations, and the majority of close down and restoration expenditure is incurred at the end of the life of the operations.
Although the ultimate cost to be incurred is uncertain, Council estimates the respective costs based on feasibility and engineering studies using current restoration standards and techniques.
The amortisation or ‘unwinding’ of the discount applied in establishing the net present value of provisions is charged to the income statement in each accounting period.
This amortisation of the discount is disclosed as a borrowing cost in Note 4(b).
Other movements in the provisions for Close down, Restoration and Remediation costs including those resulting from new disturbance, updated cost estimates, changes to the estimated lives of operations and revisions to discount rates are capitalised within property, plant and equipment.
These costs are then depreciated over the lives of the assets to which they relate.
Where rehabilitation is conducted systematically over the life of the operation, rather than at the time of closure, provision is made for the estimated outstanding continuous rehabilitation work at each balance sheet date and the cost is charged to the income statement.
Provision is made for the estimated present value of the costs of environmental clean up obligations outstanding at the balance sheet date. These costs are charged to the income statement.
Movements in the environmental clean up provisions are presented as an operating cost, except for the unwind of the discount which is shown as a borrowing cost.
Remediation procedures generally commence soon after the time the damage, remediation process and estimated remediation costs become known, but may continue for many years depending on the nature of the disturbance and the remediation techniques.
As noted above, the ultimate cost of environmental remediation is uncertain and cost estimates can vary in response to many factors including changes to the relevant legal requirements, the emergence of new restoration techniques or experience at other locations.
The expected timing of expenditure can also change, for example in response to changes in quarry reserves or production rates.
As a result there could be significant adjustments to the provision for close down and restoration and environmental clean up, which would affect future financial results.
Specific Information relating to Council's provisions relating to Close down, Restoration and Remediation costs can be found at Note 26.

Financial Statements 2012_
Kyogle Council
Notes to the Financial Statementsfor the financial year ended 30 June 2012
Note 1. Summary of Significant Accounting Policies (continued)
�
�
page 21
(q) Non-Current Assets (or Disposal Groups) “Held for Sale” & Discontinued Operations
Non-current assets (or disposal groups) are classified as held for sale and stated at the lower of either (i) their carrying amount and (ii) fair value less costs to sell, if their carrying amount will be recovered principally through a sale transaction rather than through continuing use.
The exception to this is plant and motor vehicles which are turned over on a regular basis. Plant and motor vehicles are retained in Non Current Assets under the classification of Infrastructure, Property, Plant and Equipment - unless the assets are to be traded in after 30 June and the replacement assets were already purchased and accounted for as at 30 June.
For any assets or disposal groups classified as Non-Current Assets “held for sale”, an impairment loss is recognised at any time when the assets carrying value is greater than its fair value less costs to sell.
Non-current assets “held for sale” are not depreciated or amortised while they are classified as “held for sale”.
Non-current assets classified as “held for sale” are presented separately from the other assets in the balance sheet.
A Discontinued Operation is a component of the entity that has been disposed of or is classified as “held for sale” and that represents a separate major line of business or geographical area of operations, is part of a single co-ordinated plan to dispose of such a line of business or area of operations, or is a subsidiary acquired exclusively with a view to resale.
The results of discontinued operations are presented separately on the face of the income statement.
(r) Impairment of assets
All Council's I,PP&E is subject to an annual assessment of impairment.
Assets that are subject to amortisation are reviewed for impairment whenever events or changes in
circumstances indicate that the carrying amount may not be recoverable.
An impairment loss is recognised for the amount by which the asset’s carrying amount exceeds its recoverable amount.
The recoverable amount is the higher of an asset’s fair value less costs to sell and value in use.
For non-cash generating assets of Council such as roads, drains, public buildings etc - value in use is represented by the “deprival value” of the asset which is approximated as its written down replacement cost.
Other assets are tested for impairment whenever events or changes in circumstances indicate that the carrying amount may not be recoverable.
Goodwill & other Intangible Assets that have an indefinite useful life and are not subject to amortisation are tested annually for impairment.
(s) Payables
These amounts represent liabilities and include goods and services provided to the Council prior to the end of financial year which are unpaid.
The amounts for goods and services are unsecured and are usually paid within 30 days of recognition.
(t) Borrowings
Borrowings are initially recognised at fair value, net of transaction costs incurred.
Borrowings are subsequently measured at amortised cost.
Amortisation results in any difference between the proceeds (net of transaction costs) and the redemption amount being recognised in the Income Statement over the period of the borrowings using the effective interest method.
Borrowings are removed from the balance sheet when the obligation specified in the contract is discharged, cancelled or expired.

Financial Statements 2012_
Kyogle Council
Notes to the Financial Statementsfor the financial year ended 30 June 2012
Note 1. Summary of Significant Accounting Policies (continued)
�
�
page 22
Borrowings are classified as current liabilities unless the Council has an unconditional right to defer settlement of the liability for at least 12 months after the balance sheet date.
(u) Borrowing costs
Borrowing costs are expensed. / except to the extent that the they are incurred during the construction of qualifying assets.
Borrowing costs incurred for the construction of any qualifying asset are capitalised during the period of time that is required to complete and prepare the asset for its intended use or sale.
(v) Provisions
Provisions for legal claims, service warranties and other like liabilities are recognised when:
� Council has a present legal or constructive obligation as a result of past events;
� it is more likely than not that an outflow of resources will be required to settle the obligation; and
� the amount has been reliably estimated.
Provisions are not recognised for future operating losses.
Where there are a number of similar obligations, the likelihood that an outflow will be required in settlement is determined by considering the class of obligations as a whole.
A provision is recognised even if the likelihood of an outflow with respect to any one item included in the same class of obligations may be small.
Provisions are measured at the present value of management’s best estimate of the expenditure required to settle the present obligation at the reporting date.
The discount rate used to determine the present value reflects current market assessments of the time value of money and the risks specific to the liability.
The increase in the provision due to the passage of time is recognised as interest expense.
(w) Employee benefits
(i) Short Term Obligations Short term employee benefit obligations include liabilities for wages and salaries (including non-monetary benefits), annual leave and vesting sick leave expected to be settled within the 12 months after the reporting period.
Leave liabilities are recognised in the provision for employee benefits in respect of employees’ services up to the reporting date with other short term employee benefit obligations disclosed under payables.
These provisions are measured at the amounts expected to be paid when the liabilities are settled.
Liabilities for non vesting sick leave are recognised at the time when the leave is taken and measured at the rates paid or payable, and accordingly no Liability has been recognised in these reports.
Wages & salaries, annual leave and vesting sick leave are all classified as Current Liabilities.
(ii) Other Long Term Obligations
The liability for all long service and annual leave in respect of services provided by employees up to the reporting date (which is not expected to be settled within the 12 months after the reporting period) are recognised in the provision for employee benefits.
These liabilities are measured at the present value of the expected future payments to be made using the projected unit credit method.
Consideration is given to expected future wage and salary levels, experience of employee departures and periods of service.
Expected future payments are then discounted using market yields at the reporting date based on national government bonds with terms to maturity and currency that match as closely as possible the estimated future cash outflows.

Financial Statements 2012_
Kyogle Council
Notes to the Financial Statementsfor the financial year ended 30 June 2012
Note 1. Summary of Significant Accounting Policies (continued)
�
�
page 23
Due to the nature of when and how Long Service Leave can be taken, all Long Service Leave for employees with 4 or more years of service has been classified as Current, as it has been deemed that Council does not have the unconditional right to defer settlement beyond 12 months – even though it is not anticipated that all employees with more than 4 years service (as at reporting date) will apply for and take their leave entitlements in the next 12 months.
(iii) Retirement benefit obligations
All employees of the Council are entitled to benefits on retirement, disability or death.
Council contributes to various defined benefit plans and defined contribution plans on behalf of its employees.
Defined Benefit Plans
A liability or asset in respect of defined benefit superannuation plans would ordinarily be recognised in the balance sheet, and measured as the present value of the defined benefit obligation at the reporting date plus unrecognised actuarial gains (less unrecognised actuarial losses) less the fair value of the superannuation fund’s assets at that date and any unrecognised past service cost.
The present value of the defined benefit obligation is based on expected future payments which arise from membership of the fund to the reporting date, calculated annually by independent actuaries using the projected unit credit method. Consideration is given to expected future wage and salary levels, experience of employee departures and periods of service.
However, when this information is not reliably available, Council can account for its obligations to defined benefit plans on the same basis as its obligations to defined contribution plans – i.e. as an expense when they become payable.
Council is party to an Industry Defined Benefit Plan under the Local Government Superannuation Scheme, named the “Local Government Superannuation Scheme – Pool B”
This Scheme has been deemed to be a “multi employer fund” for the purposes of AASB 119.
Sufficient information is not available to account for the Scheme as a defined benefit plan (in accordance with AASB 119) because the assets to the scheme are pooled together for all Councils.
Accordingly, Council’s contributions to the scheme for the current reporting year have been recognised as an expense and disclosed as part of Superannuation Expenses at Note 4(a).
The Local Government Superannuation Scheme has advised member councils that, as a result of the global financial crisis, it has a significant deficiency of assets over liabilities as disclosed in Note 18 of these financial statements.
As a result, they have asked for significant increases in future contributions to recover that deficiency.
Council’s share of that deficiency cannot be accurately calculated as the Scheme is a mutual arrangement where assets and liabilities are pooled together for all member councils.
For this reason, no liability for the deficiency has been recognised in these financial statements.
Council has, however, disclosed a contingent liability in note 18 to reflect the possible obligation that may arise should the Scheme require immediate payment to correct the deficiency.
Defined Contribution Plans
Contributions to Defined Contribution Plans are recognised as an expense as they become payable. Prepaid contributions are recognised as an asset to the extent that a cash refund or a reduction in the future payments is available.�
(iv) Employee Benefit On-Costs
Council has recognised at year end the aggregate on-cost liabilities arising from employee benefits, and in particular those on-cost liabilities that will arise when payment of current employee benefits is made in future periods.
These amounts include Superannuation and Workers Compensation expenses which will be payable upon the future payment of certain Leave Liabilities accrued as at 30/6/12.

Financial Statements 2012_
Kyogle Council
Notes to the Financial Statementsfor the financial year ended 30 June 2012
Note 1. Summary of Significant Accounting Policies (continued)
�
�
page 24
(x) Self insurance
Council does not self insure.
(y) Allocation between current and non-current assets & liabilities
In the determination of whether an asset or liability is classified as current or non-current, consideration is given to the time when each asset or liability is expected to be settled.
The asset or liability is classified as current if it is expected to be settled within the next 12 months, being the Council’s operational cycle.
Exceptions
In the case of liabilities where Council does not have the unconditional right to defer settlement beyond 12 months (such as vested long service leave), the liability is classified as current even if not expected to be settled within the next 12 months.
In the case of inventories that are “held for trading”, these are also classified as current even if not expected to be realised in the next 12 months.
(z) Taxes
The Council is exempt from both Commonwealth Income Tax and Capital Gains Tax.
Council does however have to comply with both Fringe Benefits Tax and Goods and Services Tax (GST).
Goods & Services Tax (GST)
Income, expenses and assets are all recognised net of the amount of GST, except where the amount of GST incurred is not recoverable from the Australian Tax Office (ATO).
In these circumstances the GST is recognised as part of the cost of acquisition of the asset or as part of the revenue / expense.
Receivables and payables within the Balance Sheet are stated inclusive of any applicable GST.
The net amount of GST recoverable from or payable to the ATO is included as a current asset or current liability in the Balance Sheet. Operating cash flows within the Cash Flow Statement are on a gross basis, ie. they are inclusive of GST where applicable.
Investing and Financing cash flows are treated on a net basis (where recoverable form the ATO), ie. they are exclusive of GST. Instead, the GST component of investing and financing activity cash flows which are recoverable from or payable to the ATO are classified as operating cash flows.
Commitments and contingencies are disclosed net of the amount of GST recoverable from (or payable to) the ATO.
(aa) New accounting standards and UIG interpretations
Certain new (or amended) accounting standards and interpretations have been published that are not mandatory for reporting periods ending 30 June 2012.
Council has not adopted any of these standards early.
Council’s assessment of the impact of these new standards and interpretations is set out below.
Applicable to Local Government with implications:
AASB 9 Financial Instruments, AASB 2009 11 Amendments to Australian Accounting Standards arising from AASB 9 and AASB 2010-7 Amendments to Australian Accounting Standards arising from AASB 9 (December 2010) (effective from 1 January 2013)
AASB 9 Financial Instruments addresses the classification, measurement and derecognition of financial assets and financial liabilities.
The standard is not applicable until 1 January 2013 but is available for early adoption.
When adopted, the standard will affect in particular the Council’s accounting for its available-for-sale financial assets, since AASB 9 only permits the
Financial Statements 2012_
Kyogle Council
Notes to the Financial Statementsfor the financial year ended 30 June 2012
Note 1. Summary of Significant Accounting Policies (continued)
�
�
page 25
recognition of fair value gains and losses in other comprehensive income if they relate to equity investments that are not held for trading. Fair value gains and losses on available-for-sale debt investments, for example, will therefore have to be recognised directly in profit or loss.
There will be no impact on Council’s accounting for financial liabilities, as the new requirements only affect the accounting for financial liabilities that are designated at fair value through profit or loss and Council does not have any such liabilities.
The derecognition rules have been transferred from AASB 139 Financial Instruments: Recognition and Measurement and have not been changed
AASB 10 - Consolidated Financial Statements, AASB 11 - Joint Arrangements, AASB 12 - Disclosure of Interests in Other Entities, revised AASB 127 - Separate Financial Statements and AASB 128 - Investments in Associates and Joint Ventures and AASB 2011-7 Amendments to Australian Accounting Standards arising from the Consolidation and Joint Arrangements Standards (effective 1 January 2013)
In August 2011, the AASB issued a suite of five new and amended standards which address the accounting for joint arrangements, consolidated financial statements and associated disclosures.
AASB 10 replaces all of the guidance on control and consolidation in AASB 127 Consolidated and Separate Financial Statements, and Interpretation 12 Consolidation – Special Purpose Entities.
The core principle that a consolidated entity presents a parent and its subsidiaries as if they are a single economic entity remains unchanged, as do the mechanics of consolidation.
However, the standard introduces a single definition of control that applies to all entities.
It focuses on the need to have both power and rights or exposure to variable returns.
Power is the current ability to direct the activities that significantly influence returns. Returns must vary and can be positive, negative or both. Control exists when the investor can use its power to affect the amount of its returns.
There is also new guidance on participating and protective rights and on agent/principal relationships. Council does not expect the new standard to have a significant impact on its composition.
AASB 11 introduces a principles based approach to accounting for joint arrangements.
The focus is no longer on the legal structure of joint arrangements, but rather on how rights and obligations are shared by the parties to the joint arrangement.
Based on the assessment of rights and obligations, a joint arrangement will be classified as either a joint operation or a joint venture. Joint ventures are accounted for using the equity method, and the choice to proportionately consolidate will no longer be permitted.
Parties to a joint operation will account their share of revenues, expenses, assets and liabilities in much the same way as under the previous standard.
AASB 11 also provides guidance for parties that participate in joint arrangements but do not share joint control.
Council's investment in the joint venture partnership will be classified as a joint venture under the new rules.
As Council already applies the equity method in accounting for this investment, AASB 11 will not have any impact on the amounts recognised in its financial statements.
AASB 12 sets out the required disclosures for entities reporting under the two new standards, AASB 10 and AASB 11, and replaces the disclosure requirements currently found in AASB 127 and AASB 128.
Application of this standard by Council will not affect any of the amounts recognised in the financial statements, but will impact the type of information disclosed in relation to Council's investments.
Amendments to AASB 128 provide clarification that an entity continues to apply the equity method and does not remeasure its retained interest as part of ownership changes where a joint venture becomes an associate, and vice versa. The amendments also

Financial Statements 2012_
Kyogle Council
Notes to the Financial Statementsfor the financial year ended 30 June 2012
Note 1. Summary of Significant Accounting Policies (continued)
�
�
page 26
introduce a “partial disposal” concept. Council is still assessing the impact of these amendments.
Council does not expect to adopt the new standards before their operative date. They would therefore be first applied in the financial statements for the annual reporting period ending 30 June 2014.
AASB 13 Fair Value Measurement and AASB 2011-8 Amendments to Australian Accounting Standards arising from AASB 13 (effective 1 January 2013)
AASB 13 was released in September 2011.
It explains how to measure fair value and aims to enhance fair value disclosures. Council has yet to determine which, if any, of its current measurement techniques will have to change as a result of the new guidance.
It is therefore not possible to state the impact, if any, of the new rules on any of the amounts recognised in the financial statements. However, application of the new standard will impact the type of information disclosed in the notes to the financial statements.
Council does not intend to adopt the new standard before its operative date, which means that it would be first applied in the annual reporting period ending 30 June 2014.
Applicable to Local Government but no implications for Council;
None
Applicable to Local Government but not relevant to Council at this stage;
Revised AASB 119 Employee Benefits, AASB 2011-10 Amendments to Australian Accounting Standards arising from AASB 119 (September 2011) and AASB 2011-11 Amendments to AASB 119 (September 2011) arising from Reduced Disclosure Requirements (effective 1 January 2013) In September 2011, the AASB released a revised standard on accounting for employee benefits.
It requires the recognition of all remeasurements of defined benefit liabilities/assets immediately in other comprehensive income (removal of the so-called 'corridor' method) and the calculation of a net interest expense or income by applying the discount rate to the net defined benefit liability or asset.
This replaces the expected return on plan assets that is currently included in profit or loss.
The standard also introduces a number of additional disclosures for defined benefit liabilities/assets and could affect the timing of the recognition of termination benefits. The amendments will have to be implemented retrospectively.
Council does not recognise defined benefit assets and liabilities for the reasons set out in note 1 (w)(iii) and so these changes will not have an impact on its reported results.
Not applicable to Local Government per se;
None
There are no other standards that are not yet effective and that are expected to have a material impact on the entity in the current or future reporting periods and on foreseeable future transactions.
(ab) Rounding of amounts
Unless otherwise indicated, amounts in the financial statements have been rounded off to the nearest thousand dollars.

Financial Statements 2012_
Kyogle Council
Notes to the Financial Statementsfor the financial year ended 30 June 2012
Note 1. Summary of Significant Accounting Policies (continued)
�
�
page 27
(ac) Comparative Figures
To ensure comparability with the current reporting period’s figures, some comparative period line items and amounts may have been reclassified or individually reported for the first time within these financial statements and/or the notes.
(ad) Disclaimer
Nothing contained within these statements may be taken to be an admission of any liability to any person under any circumstance.

������������
� ��� �� �������������� � ���� ������ ���������������������������� ���!�"!
� ��!#�$%��� ������ �� �����&�'� �(� ����)������������������ ���
"%����� ���*�+� ���,�'�� �������-���#����%��.)��� ��$/�� ������������0 �1�������� ��,����� ��� ����� ���� �,���(�� ��� �������%
����������
'� ���� '� ������� ��
����
�� ����
!�""
�� ����
!�"" ����
������� ������������������������� ����������������� � �� ��� ��� �� ���!����"����#�� �����$��� ��� ���%
&� ������!� �����#�� ����$�� ��� ��������������������'� ���(�)%
�������!����*�� ������
����� ����
���������!����*�� ������
����� ����
+� ������� �������
(*���� �,��������������������������
'��-����� )�#�� ����$�� ��� ���
����!�""
��� ��
����������
�� ����
����
�� ����
����������
��� ��
����
.��� �������������
�������!����
*�� ������
����� ����
����� ����/��� �!����
*�� ����������� ����
#"22$�������
34����������
"5���������
46����������
#"36$�������
'� ���� '� ����
#!/�34$����
#"36$�������
���� !�""����
#"25$�������
#"/5��$����#!/�3�$����!/�"!�����
"36��������
!/"7������
"36��������
4!5�������� #272$�������)�������������)�������������
"�2��������
"/�4"�����467��������
���(�������
�'������ �� ��� 6!���������� "�"��������
)������������� )�������������
#"�7$�������
"25���������������������
"75��������
!"!�������� !/""!�����
72���������2�4���������0 8����������,����� �
�9��� �
���(������� )������������� !/653�����
374��������
"�!�������� "44�������������������
233��������!�2�������� !75��������
353��������
"�3�������� "�!��������
345��������
!�����������
�9� ���-�,����� �� ��'���� ��� "/33������
"!���������6�����������
"/"65����� "/5�3�����"/572�����
3���������������� �� �����(�����,��� �� ���
"/723�����
!/�""�����
"/""4����� "/"������� "/�64�����
"/�42����� "/"!6�����
�4"���������7"��������
!/"3������
347��������
�+����� ����,�� � �� "76��������
444��������
���:���-�����(���� "/�52����� "/!4������
�!4��������!"3�������� "/7"7�����
�;� ���� 11����
2/436�����
"�3��������
#2/"33$����4/2�"����� "2/267����
27���������54���������
"3/�6!�����<����1�� �,����� ���� ��� 3/422�����
�=����-/�=�� ��� ���-�,����� � � ��� �65��������
"�/7�"���� #"/45"$����
)�������������
#3"$���������
#"/�75$���� #"/4!2$����!/�!7�����
!6����������
"/!47�����
5/3!5�����
"5/3�"����!!/2""����!2����������
5/2"5�����
#"44$�������
72����������
!6����������
"2!��������
)�������������
)�������������
������������
)�������������
'� ����
)�������������
"!/6�5���� "3/533����
�� ����
����
)�������������
!�""
4/73"�����
"6/"25����
"!/�!7����
#"!!$������� "�3��������
�3���������� 734��������
"/5�������
2������������
)�������������
#!6"$�������
#"/242$����
)�������������
#�!2$�������
)�������������#46$��������� )�������������
7!����������
#!3�$�������
762�������� "64��������
#35$���������
#723$������� !/�6������
)�������������
4������������
772��������
!�/"47�����5����������
"5!��������3�����������
#3�5$�������
#5�$��������� #�2$���������
������������
4������������ 34����������
6/"�7����� "�/!5!����
#3/36"$����
#"34$�������
(0�12�)����
)�������������
!3���������
�/�24������/6!������
)�������������#"!�$�������
5/564�����
!3����������
#76"$�������
#66$���������
"/337�����"/2�5�����
!!�/44!��
�����������
� ���� ��!�"!
)�������������
�/5"7�����
3�431����� �56�55���
)�������������
3���112��
)�������������)�������������
�56�55���
)�������������
)�������������
3���112��
)�������������
5�016�����
)�������������
!�6/��4��
"�!�������� #"""$�������
)�������������)�������������
�1�214����
"72�������� ""6��������
3/643�����
6����������5�2�2�����0�3�6���� 041�������� (003)�������(365)��������1�214����
)�������������
)�������������
�5�2�2����
)�������������
1�1�4�����(6�21�)����(���056)��
2����������������������'������
6�404������+� ���#�� �����,��� ��� ���
6������������ 4������������
�2���0���� �0�3�6����
1�-��!5
�0�410����
����������-����&#������$����'������ ���,
���������0 �1�����������"
�*�� ����������� ����
"�/!5!����
������ �>�� ����# ���-� ����? � ��=� ���$ )�������������
������ ����/��� �!���
)�������������
5/564�����6/"�7�����
�5���4�����5���3���� �3�442����

Financial Statements 2012
KYOGLE COUNCIL
Notes to the Financial Statements
page 29
Notes to the Financial Statements for the financial year ended 30 June 2012
Note 2(b). Council Functions / Activities - Component Descriptions
Details relating to the Council's functions / activities as reported in Note 2(a) are as follows:
GOVERNANCEGOVERNANCE
ADMINISTRATION
PUBLIC ORDER & SAFETY
Costs relating to the Council’s role as a component of democratic government, including elections, members’
fees and expenses, subscriptions to local authority associations, meetings of council and policy making
committees, area representation and public disclosure and compliance.
Corporate Support and Other Support Services (not otherwise attributed to the listed functions / activities).
PUBLIC ORDER & SAFETY
HEALTH
ENVIRONMENT
Fire protection, animal control, beach control, enforcement of local government regulations, emergency
services, other.
Inspection, immunisations, food control, health centres, other, administration.
ENVIRONMENT
COMMUNITY SERVICES & EDUCATION
Noxious plants and insect/vermin control, other environmental protection, solid waste management, street
cleaning, drainage, stormwater management.
Administration, family day care, child care, youth services, other family and children, aged and disabled,
migrant services, Aboriginal services, other community services, education.
HOUSING & COMMUNITY AMENITIES
WATER SUPPLIES - all matters relating to the provision of Water Supplies.
SEWERAGE SERVICES - all matters relating to the provision of Sewerage Services.
Housing, town planning, street lighting, other sanitation and garbage, public cemeteries, public conveniences,
other community amenities.
RECREATION & CULTURE
MINING, MANUFACTURING & CONSTRUCTION
Public libraries, museums, art galleries, community centres, public halls, other cultural services, swimming
pools, sporting grounds, parks and gardens (lakes), other sport and recreation.
Building control, abattoirs, quarries & pits, other.
TRANSPORT & COMMUNICATION
ECONOMIC AFFAIRS
Camping areas, caravan parks, tourism and area promotion, industrial development promotion, saleyards and
markets, real estate development, commercial nurseries, other business undertakings.
Urban roads, sealed rural roads, unsealed rural roads, bridges, footpaths, aerodromes, parking areas, bus
shelters and services, water transport, RTA works, other.
markets, real estate development, commercial nurseries, other business undertakings.
page 29

Financial Statements 2012
KYOGLE COUNCIL
Notes to the Financial Statements for the financial year ended 30 June 2012
Note 3. Income from Continuing Operations
$ '000
(a). Rates & Annual Charges
Ordinary Rates
Residential
Farmland
Mining
Business
Other
Total Ordinary Rates
Annual Charges (pursuant to s.496, s.496A, s.496B, s.501 & s.611)
Domestic Waste Management Services
Stormwater Management Services
Water Supply Services
Sewerage Services
Drainage
Waste Management Services (non-domestic)
Other
Total Annual Charges
TOTAL RATES & ANNUAL CHARGES
Council has used 2009 year valuations provided by the NSW Valuer General in calculating its rates.
6,372
Notes 2012
208
Actual
1,860
224
2,457
Actual
-
2011
2,343
1,779
-
-
515
899
512
833
4,330
45
469
699
-
-
2,231
6,772
114
2,042
-
45
142
4,541
-
-
page 30

Financial Statements 2012
KYOGLE COUNCIL
Notes to the Financial Statements for the financial year ended 30 June 2012
Note 3. Income from Continuing Operations (continued)
$ '000
(b). User Charges & Fees
Specific User Charges (per s.502 - Specific "actual use" charges)
Domestic Waste Management Services
Water Supply Services
Sewerage Services
Drainage Services
Waste Management Services (non-domestic)
Other
Total User Charges
Other User Charges & Fees
(i) Fees & Charges - Statutory & Regulatory Functions (per s.608)
RTA Claims - State Roads
Building Services - Other
Inspection Services
Planning & Building Regulation
Private Works
Section 603 Certificates
Art Galleries
Pools
Quarries
Cemeteries
Other
Total Fees & Charges - Statutory/Regulatory
TOTAL USER CHARGES & FEES
32 27
7
6,102 7,674
103
11
164
460
-
-
5,091
85
385
5
95
89
4
1,011
6,723
70
203
800
212
92
120
-
431
5,175
-
192
951
5
4,043
-
12
135
443
376
-
2012
Actual Actual
2011Notes
page 31

Financial Statements 2012
KYOGLE COUNCIL
Notes to the Financial Statements for the financial year ended 30 June 2012
Note 3. Income from Continuing Operations (continued)
$ '000
(c). Interest & Investment Revenue (incl. losses)
Interest & Dividends
- Interest on Overdue Rates & Annual Charges
- Interest earned on Investments (interest & coupon payment income)
- Interest & Dividend Income (Other)
Other
TOTAL INTEREST & INVESTMENT REVENUE
Interest Revenue is attributable to:
Unrestricted Investments/Financial Assets:
Overdue Rates & Annual Charges (General Fund)
General Council Cash & Investments
Restricted Investments/Funds - External:
Development Contributions
- Section 94
- Section 64
Water Fund Operations
Sewerage Fund Operations
Total Interest & Investment Revenue Recognised
(d). Other Revenues
Other
TOTAL OTHER REVENUE
82 105
10
864
2
30
-
722
28
-
985
37
1
30
864
802
985
125
752 829
-
30 31
Actual
2011
Actual
82
2012Notes
30 30 87
87
page 32

Financial Statements 2012
KYOGLE COUNCIL
Notes to the Financial Statements for the financial year ended 30 June 2012
Note 3. Income from Continuing Operations (continued)
$ '000
(e). Grants
General Purpose (Untied)
Financial Assistance
Pensioners' Rates Subsidies - General Component
Other Grants
Total General Purpose
Specific Purpose
Pensioners' Rates Subsidies:
- Water
- Sewerage
- Domestic Waste Management
Water Supplies
Sewerage Services
Community Projects
Flood Restoration
Library
NSW Rural Fire Services
Street Lighting
Transport (Other Roads & Bridges Funding)
Flood Mitigation
Other
Total Specific Purpose
Total Grants
Grant Revenue is attributable to:
- Commonwealth Funding
- State Funding
- Other Funding
1,394
682
-
-
1,062
-
332
-
-
3
1,394
262
1,394
156
529
56
-
-
-
-
-
-
1,366
-
-
-
681
-
1,366
111
1,366
1,255
-
3,703
2,468
6,283
-
-
3,014
257
27
2012
Operating
6,283
7,808
30
2,580
-
-
109
4,685
4,794
1
33
26
-
37
22
2,637
7,808
5
3,123
-
4,685
2,115
2011
Capital
20112012
Capital
- - 3,703
Operating
- -
-
28
-
-
27
112
3,815
26 -
-
-
-
-
27
30
38
38
134
39
31 -
391
-
(126)
page 33
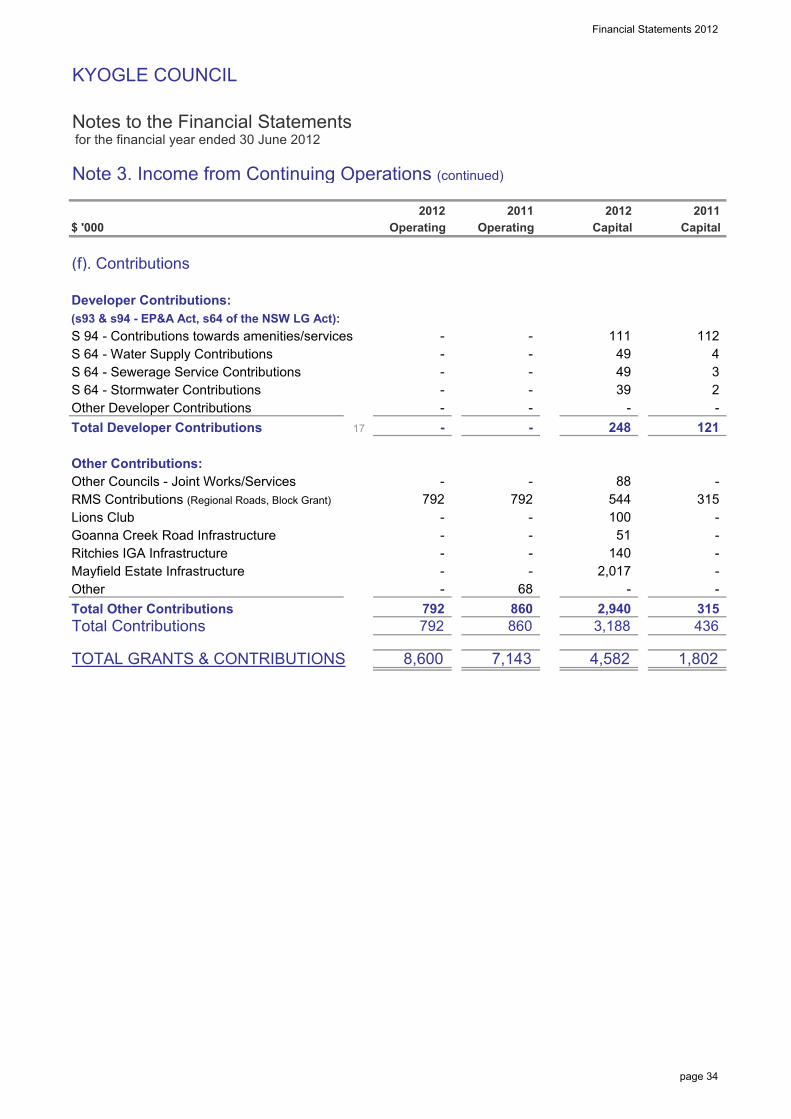
Financial Statements 2012
KYOGLE COUNCIL
Notes to the Financial Statements for the financial year ended 30 June 2012
Note 3. Income from Continuing Operations (continued)
$ '000
(f). Contributions
Developer Contributions:
(s93 & s94 - EP&A Act, s64 of the NSW LG Act):
S 94 - Contributions towards amenities/services
S 64 - Water Supply Contributions
S 64 - Sewerage Service Contributions
S 64 - Stormwater Contributions
Other Developer Contributions
Total Developer Contributions
Other Contributions:
Other Councils - Joint Works/Services
RMS Contributions (Regional Roads, Block Grant)
Lions Club
Goanna Creek Road Infrastructure
Ritchies IGA Infrastructure
Mayfield Estate Infrastructure
Other
Total Other Contributions
Total Contributions
TOTAL GRANTS & CONTRIBUTIONS
-
544 792
-
-
88
-
2012
-
49
Capital
1,802
2011
Capital
-
2
-
315
-
-
112
315
-
248
49
121
3 -
-
-
-
4
111
-
- 39
100
-
792 860
-
-
860 792
-
7,143
2,940
3,188
140
68
2,017
-
-
-
-
4,582
51
-
-
436
8,600
2011
17 -
792
2012
Operating Operating
- -
-
-
-
page 34

Financial Statements 2012
KYOGLE COUNCIL
Notes to the Financial Statements for the financial year ended 30 June 2012
Note 3. Income from Continuing Operations (continued)
$ '000
(g). Restrictions relating to Grants and Contributions
Certain grants & contributions are obtained by Council on condition
that they be spent in a specified manner:
Unexpended at the Close of the Previous Reporting Period
add: Grants & contributions recognised in the current period but not yet spent:
less: Grants & contributions recognised in a previous reporting period now spent:
Net Increase (Decrease) in Restricted Assets during the Period
Unexpended and held as Restricted Assets
Comprising:
- Specific Purpose Unexpended Grants
- Developer Contributions
- Other Contributions
867
(204)
569
867
595
476
1,071
Actual
2011
Actual
867
298
(1,071)
570
(1,036)
1,071
(466)
-
1,071
2012
1,537
-
page 35

Financial Statements 2012
KYOGLE COUNCIL
Notes to the Financial Statements for the financial year ended 30 June 2012
Note 4. Expenses from Continuing Operations
$ '000
(a) Employee Benefits & On-Costs
Salaries and Wages
Employee Leave Entitlements (ELE)
Superannuation - Defined Contribution Plans
Superannuation - Defined Benefit Plans
Workers' Compensation Insurance
Fringe Benefit Tax (FBT)
Training Costs (other than Salaries & Wages)
Other
Total Employee Costs
less: Capitalised Costs
TOTAL EMPLOYEE COSTS EXPENSED
Number of "Equivalent Full Time" Employees at year end
(b) Borrowing Costs
(i) Interest Bearing Liability Costs
Interest on Loans
Other Debts
Total Interest Bearing Liability Costs Expensed
(ii) Other Borrowing Costs
Discount adjustments relating to movements in Provisions (other than ELE)
- Remediation Liabilities
- Other Liabilities
Other Borrowing Costs
Total Other Borrowing Costs
TOTAL BORROWING COSTS EXPENSED
Notes
25
76
-
96 97
173 87
-
97
7,522
17
Actual
335
5,401
2011
379
76
-
-
6,927
-
29
910
(595)
23
183
26 87
402
96
-
-
2012
Actual
5,040
252
92
428
1,071
421
(721)
90
7,374
70
93
6,653
-
page 36

Financial Statements 2012
KYOGLE COUNCIL
Notes to the Financial Statements for the financial year ended 30 June 2012
Note 4. Expenses from Continuing Operations (continued)
$ '000
(c) Materials & Contracts
Raw Materials & Consumables
Auditors Remuneration (1)
Legal Expenses:
- Legal Expenses: Planning & Development
- Legal Expenses: Other
Other
Total Materials & Contracts
less: Capitalised Costs
TOTAL MATERIALS & CONTRACTS
1. Auditor Remuneration
During the year, the following fees were incurred for services provided by
the Council's Auditor Thomas Noble & Russell
(i) Audit and Other Assurance Services
- Audit & review of financial statements: Council's Auditor
Total Auditor Remuneration
Actual
2011
52
108
-
8,080
52
-
-
7,865
52
7,865
31
32
7,750 7,921
-
46
2012
Actual
8,080
5
46
Notes
46
page 37

Financial Statements 2012
KYOGLE COUNCIL
Notes to the Financial Statements for the financial year ended 30 June 2012
Note 4. Expenses from Continuing Operations (continued)
$ '000
(d) Depreciation, Amortisation & Impairment
Plant and Equipment
Office Equipment
Furniture & Fittings
Land Improvements (depreciable)
Buildings - Non Specialised
Buildings - Specialised
Other Structures
Infrastructure:
- Roads, Bridges & Footpaths
- Stormwater Drainage
- Water Supply Network
- Sewerage Network
Asset Reinstatement Costs
Total Depreciation & Impairment Costs
less: Capitalised Costs
less: Asset Reinstatement Costs - Write Back
TOTAL DEPRECIATION &IMPAIRMENT COSTS EXPENSED 7,579
64
992
Impairment Costs
2012
- 1,127
Actual
2012
-
Actual
2011
122
304
-
7,822
2011
-
-
188
45
79
-
-
7,579
298
5,081
301
54
103
204
2
221
2
51
336
87
-
Actual
5,411
192
83
Actual
Depreciation/Amortisation
Notes
-
-
-
-
-
-
-
-
-
-
-
-
-
-
-
-
-
-
-
-
-
-
-
-
-
9 & 26
-
-
(164)
54
7,658
page 38

Financial Statements 2012
KYOGLE COUNCIL
Notes to the Financial Statements for the financial year ended 30 June 2012
Note 4. Expenses from Continuing Operations (continued)
$ '000
(e) Other Expenses
Other Expenses for the year include the following:
Advertising
Bad & Doubtful Debts
Councillor Expenses - Mayoral Fee
Councillor Expenses - Councillors' Fees
Councillors' Expenses (incl. Mayor) - Other (excluding fees above)
Donations, Contributions & Assistance to other organisations (Section 356)
Electricity & Heating
Insurance
Street Lighting
Subscriptions & Publications
Telephone & Communications
Regional Library
Emergency Services
TOTAL OTHER EXPENSES
266
9
86
33
23
392
49
184
Actual
96
2011
203 222
Actual
51 55
24
107
1,728 135 202
1,634
2012
302
51
105
90
22
Notes
289
(84)
433
17
page 39

Financial Statements 2012
KYOGLE COUNCIL
Notes to the Financial Statements for the financial year ended 30 June 2012
Note 5. Gains or Losses from the Disposal of Assets
$ '000
Property (excl. Investment Property)
Plant & EquipmentProceeds from Disposal - Plant & Equipment
less: Carrying Amount of P&E Assets Sold / Written Off
Net Gain/(Loss) on Disposal
InfrastructureProceeds from Disposal - Infrastructure
less: Carrying Amount of Infrastructure Assets Sold / Written Off
Net Gain/(Loss) on Disposal
NET GAIN/(LOSS) ON DISPOSAL OF ASSETS
(456)
-
Actual
(456)
86
(420)
2011
(370)
2012Notes
608
(488)
506
(3,223)
120
(3,343)
Actual
-
(3,343)
page 40

Financial Statements 2012
KYOGLE COUNCIL
Notes to the Financial Statements for the financial year ended 30 June 2012
Note 6a. - Cash Assets and Note 6b. - Investment Securities
$ '000
Cash & Cash Equivalents (Note 6a)Cash on Hand and at Bank
Cash-Equivalent Assets1
- Deposits at Call
Total Cash & Cash Equivalents
Investment Securities (Note 6b)Nil
2011
-
-
5,671
12,900
Actual
-
2012
-
Non Current
Actual
Non Current
10,900
15,719
2011
-
-
18,571
4,819
Current
Actual
Notes
2012
Actual
Current
page 41
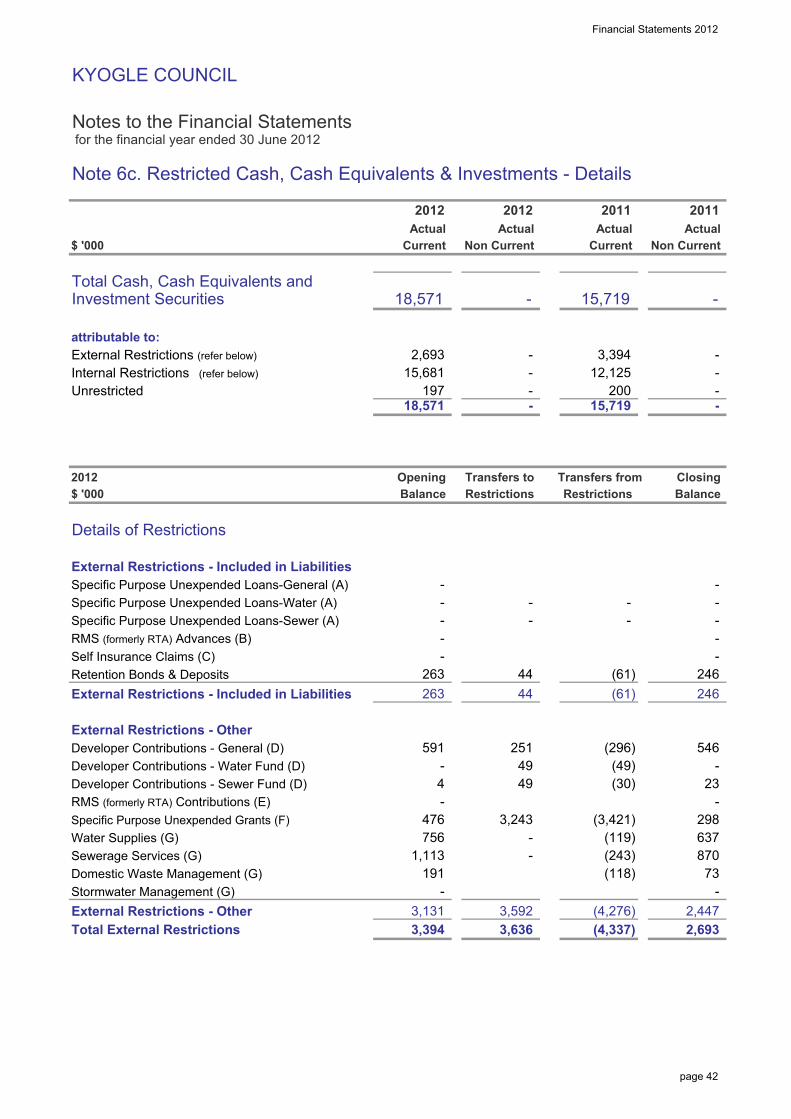
Financial Statements 2012
KYOGLE COUNCIL
Notes to the Financial Statements for the financial year ended 30 June 2012
Note 6c. Restricted Cash, Cash Equivalents & Investments - Details
$ '000
Total Cash, Cash Equivalents andInvestment Securities
attributable to:
External Restrictions (refer below)
Internal Restrictions (refer below)
Unrestricted
$ '000
Details of Restrictions
External Restrictions - Included in Liabilities
Specific Purpose Unexpended Loans-General (A)
Specific Purpose Unexpended Loans-Water (A)
Specific Purpose Unexpended Loans-Sewer (A)
RMS (formerly RTA) Advances (B)
Self Insurance Claims (C)
Retention Bonds & Deposits
External Restrictions - Included in Liabilities
External Restrictions - Other
Developer Contributions - General (D)
Developer Contributions - Water Fund (D)
Developer Contributions - Sewer Fund (D)
RMS (formerly RTA) Contributions (E)
Specific Purpose Unexpended Grants (F)
Water Supplies (G)
Sewerage Services (G)
Domestic Waste Management (G)
Stormwater Management (G)
External Restrictions - Other
Total External Restrictions
2012 Closing Transfers from
- 15,681
15,719
12,125
-
-
Actual
Balance
- -
Non Current
2011
Opening
Actual
2011
Actual
246
-
246
298
-
23
-
-
-
546
-
-
870
637
(4,337)
2,447
2,693
73
-
-
251
18,571
3,636
3,592
-
2,693
2012
Non Current
197 18,571
Balance
-
44
-
263 44
-
4
591
49
191
-
476
756 -
263
3,243
49
Current
-
Transfers to
-
-
-
Actual
-
2012
3,394
15,719
200
Restrictions
-
Current
- -
-
Restrictions
-
(61)
(61)
(296)
(30)
(118)
(49)
(3,421)
3,394
3,131
(243) -
(119)
-
1,113
(4,276)
page 42

Financial Statements 2012
KYOGLE COUNCIL
Notes to the Financial Statements for the financial year ended 30 June 2012
Note 6c. Restricted Cash, Cash Equivalents & Investments - Details (continued)
$ '000
Internal Restrictions
Plant & Vehicle Replacement
Building Replacement
Employees Leave Entitlement
Carry Over Works
Quarries
Transport
Information Technology
Roads & Bridges
Emergency Works
Stormwater Management
Commercial Waste
Total Internal Restrictions
TOTAL RESTRICTIONS
A Loan moneys which must be applied for the purposes for which the loans were raised.
B Advances by the Roads and Traffic Authority for works on the State's classified roads.
C Self Insurance liability resulting from reported claims or incurred claims not yet reported.
D Development contributions which are not yet expended for the provision of services and amenities in accordance
with contributions plans (refer Note 17).
E RMA Contributions which are not yet expended for the provision of services and amenities in accordance with
those contributions.
F Grants which are not yet expended for the purposes for which the grants were obtained. (refer Note 1)
G Water, Sewerage, Domestic Waste Management (DWM) & other Special Rates/Levies/Charges are externally
restricted assets and must be applied for the purposes for which they were raised.
Restrictions Balance
3,608
462
1,138
6,181
Closing
884
1,490
100
15,681
564
300
754
200
408
200
(4,314) 12,125 7,870
2012
2,354
11,506
80
(8,651)
194
20
602 282
3,608
Opening
15,519 18,374
604
200 100
-
562
1,890
370
Balance
730
Restrictions
Transfers to
3,827
3,814
150
(3,814)
(100)
(400)
Transfers from
page 43

Financial Statements 2012
KYOGLE COUNCIL
Notes to the Financial Statements for the financial year ended 30 June 2012
Note 7. Receivables
$ '000
Purpose
Rates & Annual Charges
Interest & Extra Charges
User Charges & Fees
Accrued Revenues
- Interest on Investments
Government Grants & Subsidies
Net GST Receivable
Other Debtors
Total
less: Provision for Impairment
Rates & Annual Charges
User Charges & Fees
TOTAL NET RECEIVABLES
Externally Restricted Receivables
Water Supply
- Rates & Availability Charges
- Other
Sewerage Services
- Rates & Availability Charges
- Other
Domestic Waste Management
Total External Restrictions
Unrestricted Receivables
TOTAL NET RECEIVABLES
Notes on Debtors above:
(i) Rates & Annual Charges Outstanding are secured against the property.
(ii) Doubtful Rates Debtors are provided for where the value of the property is less than the debt outstanding.
An allowance for other doubtful debts is made when there is objective evidence that a receivable is impaired.
(iii) Interest was charged on overdue rates & charges at 11.00% (2011 9.00%).
Generally all other receivables are non interest bearing.
(iv) Please refer to Note 15 for issues concerning Credit Risk and Fair Value disclosures.
2012
58
700
-
Non Current
68
Current
2,138
105
21
2,363
4,513
4,488 3,801
152
148
185
1,040
-
105
2011
-
Non Current
1,788
72
-
-
-
130
4,488 -
-
-
-
Current
- -
-
- 207
- - - 4,630
- 5,160
(21)
-
141
-
21
-
1,055
1
(25)
-
Notes
33
202 -
687 530
-
-
5,185
(105)
241
-
-
-
-
-
- 87
-
-
5,160 - (25)
-
105
1
page 44

Financial Statements 2012
KYOGLE COUNCIL
Notes to the Financial Statements for the financial year ended 30 June 2012
Note 8. Inventories & Other Assets
$ '000
Inventories
Stores & Materials
Trading Stock
Total Inventories
Other Assets
Prepayments
Total Other Assets
TOTAL INVENTORIES / OTHER ASSETS
Externally Restricted Assets
There are no restrictions applicable to the above assets.
256
992
256
-
670
284
248
-
-
Non Current
-
Current
2011
Non Current
954
-
189
2012
Current
736
547
Notes
-
-
-
-
-
-
-
1,202
248
page 45

KYOGLE COUNCIL
Notes to the Financial Statements for the financial year ended 30 June 2012
Note 9a. Infrastructure, Property, Plant & Equipment
At At Carrying At At Carrying
$ '000 Cost Fair Value Dep'n Value Cost Fair Value Dep'n Value
Capital Work in Progress 1,318 - - 1,318 1,088 (1,185) 1,221 - - 1,221
Plant & Equipment - 15,577 7,107 8,470 1,187 (488) (992) (1,806) - 12,546 6,175 6,371
Office Equipment - 1,211 1,059 152 101 (87) - 630 463 167
Furniture & Fittings - 98 79 19 (2) - 69 52 17
Plant & Equipment (under Finance Lease) - - - - - - - - -
Land:
- Operational Land - 4,677 - 4,677 295 (683) - 4,289 - 4,289
- Community Land - 1,016 - 1,016 - 1,016 - 1,016
- Land under Roads (pre 1/7/08) - 3,391 - 3,391 - 3,391 - 3,391
- Land under Roads (post 30/6/08) - - - - 2 - 2 - 2
Land Improvements - non depreciable - - - - - - - -
Land Improvements - depreciable - 2,124 255 1,869 114 (51) 436 (1,329) - 1,346 306 1,040
Buildings - Non Specialised - 3,437 1,718 1,719 (83) - 3,437 1,801 1,636
Buildings - Specialised - 18,119 10,029 8,090 40 (14) (304) (59) - 17,932 10,179 7,753
Other Structures - 18,904 9,640 9,264 250 (4) (192) 8 (6,642) - 5,591 2,906 2,685
Infrastructure:
- Roads, Bridges, Footpaths - 251,035 107,436 143,599 4,310 (2,873) (5,411) 576 10,196 - 268,001 117,604 150,397
- Bulk Earthworks (non-depreciable) - 43,395 - 43,395 3,326 - 46,721 - 46,721
- Stormwater Drainage - 24,456 9,636 14,820 1,401 (113) (122) 1,448 - 22,825 5,392 17,433
- Water Supply Network - 9,078 5,800 3,278 673 (4) (188) 165 5,055 2,248 - 20,489 9,261 11,228
- Sewerage Network - 20,960 9,341 11,619 552 (335) (336) 5,464 4,497 - 27,502 6,042 21,460
Other Assets:
- Heritage Collections - - - - - - - - -
- Library Books - - - - - - - - -
- Other - 2 2 - - - 2 2 -
Reinstatement, Rehabilitation &
Restoration Assets (refer Note 26)
- Tip Asset 1,528 - 577 951 (41) (391) 963 - 444 519
- Quarry Asset 180 - 137 43 18 (13) 198 - 150 48
- Other Assets - - - - - - - - -
TOTAL INFRASTRUCTURE,PROPERTY, PLANT & EQUIP.
Additions to Depreciable Land Improvements, Buildings, Other Structures & Infrastructure Assets are made up of Asset Renewals ($5,607) and New Assets ($2,839). Renewals are defined as the replacement of existing assets (as opposed to the acquisition of new assets).
as at 30/6/2011Asset Movements during the Reporting Period
page 4
6
Fin
ancia
l Sta
tem
ents 2
012
as at 30/6/2012
Asset
Additions
WDV
of Asset
Disposals
Depreciation
Expense
WIP
Transfers
Adjustments
& Transfers
257,690 10,031 (3,831) (7,822)
Accumulated
3,026 417,480 162,816 277,394 21,715 2,382 435,789 160,777 - (391)
Revaluation
Increments
to Equity
(ARR)
Accumulated

Financial Statements 2012
KYOGLE COUNCIL
Notes to the Financial Statements for the financial year ended 30 June 2012
Note 9b. Externally Restricted Infrastructure, Property, Plant & Equipment
- 131 -
210 - -
11,228
-
11,388 211
-
3,558
152
Impairm't
5,800
8,543 11,815
3,278
780 921 1,701
-
20,489 9,261
-
9,078
5,409
58
553
Actual
At A/Dep &At
2012
Impairm'tFair Value Fair ValueCost
160
Carrying
Value
160
885 -
At
Actual
2011
A/Dep & Carrying
ValueCost
At
8,967
211 211
454
- -
1,339
553 - -
-
-
9,261 20,649 Total Water Supply
Other Structures
Buildings
Infrastructure
- Operational Land
Plant & Equipment
Land
Sewerage Services
- Operational Land
Land
$ '000
Class of Asset
Water Supply
WIP
-
Plant & Equipment
20,147
- 131
-
page 47
156
1,383
1,528
1,684
3,083
17,082
11,619
11,599
9,341
680
-
-
-
577
379
-
-
1,478
379
28,681
4,561
951
1,328
131
- -
276 103
20,960
-
21,460
-
-
-
-
519
565
444
27,502
609
609
-
121 488
1,007
15,868 33,855
-
27,008 49,207
Other Structures
- Improvements non-depreciable
- Operational Land
6,042
6,042
Domestic Waste Management
Infrastructure
Total Sewerage Services -
WIP
Land
- Improvements - depreciable
Future Reinstatement Costs 963
963 1,895 TOTAL RESTRICTED I,PP&E
Total DWM 963
24,094 48,760
-
156
27,502
131
21,460
1,328
page 47

Financial Statements 2012
KYOGLE COUNCIL
Notes to the Financial Statements for the financial year ended 30 June 2012
Note 9c. Infrastructure, Property, Plant & Equipment - Current Year Impairments
$ '000
Council has recognised no impairment losses during the reporting period nor reversed any prior period losses.
20112012
Actual Actual
Notes
page 48page 48

Financial Statements 2012
KYOGLE COUNCIL
Notes to the Financial Statements for the financial year ended 30 June 2012
Note 10a. Payables, Borrowings & Provisions
$ '000
PayablesGoods & Services - operating expenditure
Goods & Services - capital expenditure
Accrued Expenses:
- Borrowings
- Salaries & Wages
- Other Expenditure Accruals
Security Bonds, Deposits & Retentions
Total Payables
BorrowingsLoans - Secured 1
Total Borrowings
ProvisionsEmployee Benefits;
132
1,241
1,241
1,635
2012
Non Current
471
6
Current
31
-
1,681
-
-
29
-
-
218
2011
131
Non Current Current
1,265
131
-
-
-
31
-
- 76
123
59
7
123
2,553
- 242
Notes
1,210 29
123
1,210
page 49
Employee Benefits;
Annual Leave
Long Service Leave
Sub Total - Aggregate Employee Benefits
Asset Remediation/Restoration (Future Works)
Other
Total Provisions
Total Payables, Borrowings & Provisions
(i) Liabilities relating to Restricted Assets
Externally Restricted Assets
Water
Sewer
Domestic Waste Management
Other
Total Liabilities relating to restricted assets
1.Loans are secured over the General Rating Income of Council
Disclosures on Liability Interest Rate Risk Exposures, Fair Value Disclosures & Security can be found in Note 15.
-
1,786
582
2011
141
3,191 2,592 141
277
-
1,646
140
Current
76
Non Current
110
548
2,238
1,950
964
3,720
2,348
Non Current
-
133 1,606
1,052
26 -
1,830
Current
-
1,747
246
943
4,370 3,457
1,382 -
267
988
594 -
70
90
110
-
65
-
3,163
1,697
1,058
2012
-
133
page 49

Financial Statements 2012
KYOGLE COUNCIL
Notes to the Financial Statements for the financial year ended 30 June 2012
Note 10a. Payables, Borrowings & Provisions (continued)
$ '000
(ii) Current Liabilities not anticipated to be settled within the next 12 months
The following Liabilities, even though classified as current, are not expected
to be settled in the next 12 months.
Provisions - Employees Benefits
Note 10b. Description of and movements in Provisions
Change in
Estimates
Annual Leave (363)
Long Service Leave 1,168 267
548 409
(250)
594
Decrease due to
Payments
2011
2012
Remeasureme
nt effects due
to
Discounting
Unused
amounts
reversed
Opening
Balance
as at 1/7/11Class of Provision
2011
900
1,185
918
2012
Closing
Balance
as at 30/6/12
Additional
Provisions
page 50
a. Employees Leave Entitlements & On-Costs represents those benefits accrued and payable and an estimate of those
that will become payable in the future as a result of past service.
b. Asset Remediation, Reinstatement & Restoration Provisions represent the Present Value estimate of future costs Council
will incur in order to remove, restore & remediate assets &/or activities as a result of past operations.
(342)
(342)
(196)
(196) TOTAL 4,095 (704)
Other 141 (1) -
- 2,238 (90) Asset Remediation
Long Service Leave 1,168 267 (250)
140
1,697 87
87
1,185
676 3,616
page 50
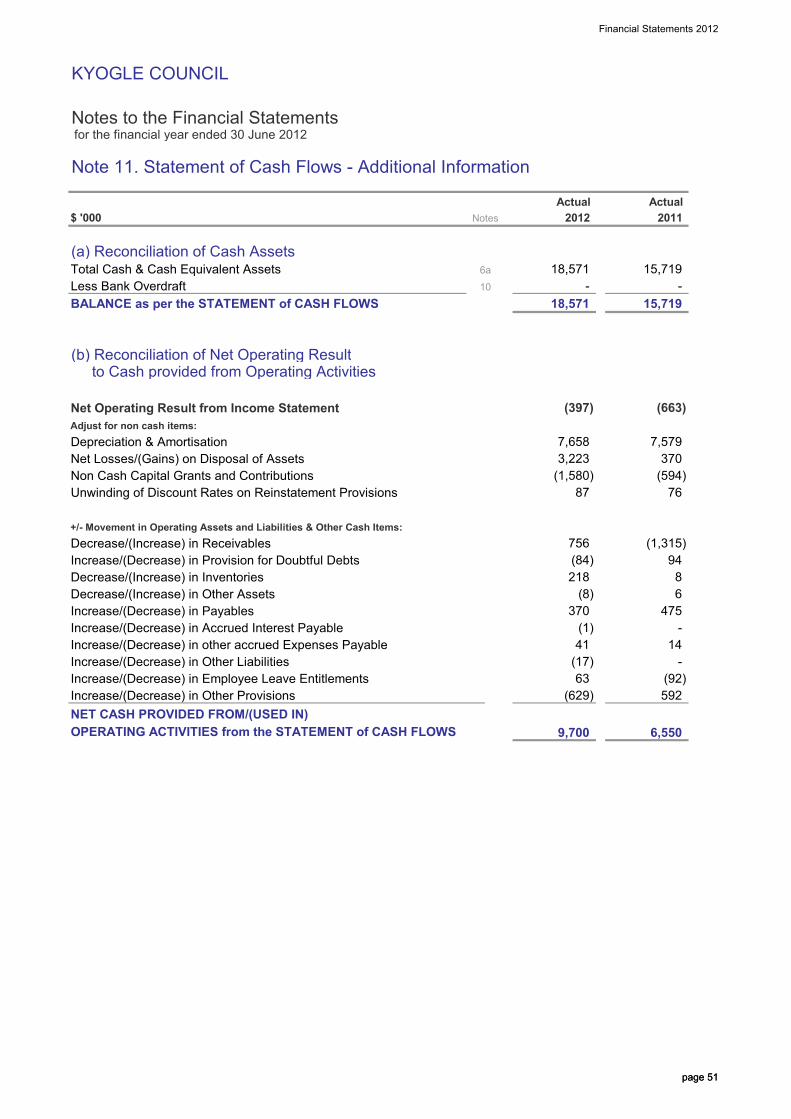
Financial Statements 2012
KYOGLE COUNCIL
Notes to the Financial Statements for the financial year ended 30 June 2012
Note 11. Statement of Cash Flows - Additional Information
$ '000
(a) Reconciliation of Cash AssetsTotal Cash & Cash Equivalent Assets
Less Bank Overdraft
BALANCE as per the STATEMENT of CASH FLOWS
(b) Reconciliation of Net Operating Result to Cash provided from Operating Activities
Net Operating Result from Income Statement
Adjust for non cash items:
Depreciation & Amortisation
Net Losses/(Gains) on Disposal of Assets
Non Cash Capital Grants and Contributions
Unwinding of Discount Rates on Reinstatement Provisions 76
Actual
2011
15,719
(663)
370
(594) (1,580)
7,658
Notes
87
18,571
2012
10
Actual
18,571
-
6a
3,223
(397)
7,579
15,719
-
page 51
+/- Movement in Operating Assets and Liabilities & Other Cash Items:
Decrease/(Increase) in Receivables
Increase/(Decrease) in Provision for Doubtful Debts
Decrease/(Increase) in Inventories
Decrease/(Increase) in Other Assets
Increase/(Decrease) in Payables
Increase/(Decrease) in Accrued Interest Payable
Increase/(Decrease) in other accrued Expenses Payable
Increase/(Decrease) in Other Liabilities
Increase/(Decrease) in Employee Leave Entitlements
Increase/(Decrease) in Other Provisions
NET CASH PROVIDED FROM/(USED IN)
OPERATING ACTIVITIES from the STATEMENT of CASH FLOWS
63
(1)
94
8
6
-
218
756
475
(92)
-
6,550
14
592
(1,315)
(84)
(629)
370
(8)
(17)
9,700
41
page 51

Financial Statements 2012
KYOGLE COUNCIL
Notes to the Financial Statements for the financial year ended 30 June 2012
Note 11. Statement of Cash Flows - Additional Information (continued)
$ '000
(c) Non-Cash Investing & Financing Activities
Subdivider Dedications
Estimated Future Reinstatement Costs
Total Non-Cash Investing & Financing Activities
(d) Financing Arrangements
(i) Unrestricted access was available at balance date to the
following lines of credit:
Credit Cards / Purchase Cards
Total Financing Arrangements
5
-
2011
594 1,580
Actual
5
594
2012
Actual
5
(628)
Notes
2,208
5
page 52page 52

Financial Statements 2012
KYOGLE COUNCIL
Notes to the Financial Statements for the financial year ended 30 June 2012
Note 12. Commitments for Expenditure
$ '000
(a) Capital Commitments (exclusive of GST)
Capital expenditure committed for at the reporting date but not
recognised in the financial statements as liabilities:
Property, Plant & Equipment
Computer Equipment
Bridge Construction
Total Commitments
These expenditures are payable as follows:
Within the next year
Later than one year and not later than 5 years
Later than 5 years
Total Payable
2012
76
Notes
140
-
64
140
-
838
774
-
140
Actual
978
204
Actual
2011
978
140
page 53
Total Payable
Sources for Funding of Capital Commitments:
Unrestricted General Funds
Total Sources of Funding
140
978
978
978 140
140
page 53

Financial Statements 2012
KYOGLE COUNCIL
Notes to the Financial Statements for the financial year ended 30 June 2012
Note 12. Commitments for Expenditure (continued)
$ '000
(b) Finance Lease Commitments
Nil
(c) Operating Lease Commitments (Non Cancellable)
a. Commitments under Non Cancellable Operating Leases at the
Reporting date, but not recognised as Liabilities are payable:
Within the next year
Later than one year and not later than 5 years
Later than 5 years
Total Non Cancellable Operating Lease Commitments
b. Non Cancellable Operating Leases include the following assets:
Office Rental
Notes
22
-
56
2012
-
Actual Actual
2011
-
11
11
34
page 54
Office Rental
Contingent Rentals may be payable depending on the condition of items or usage during the lease term.
Conditions relating to Operating Leases:
- All Operating Lease Agreements are secured only against the Leased Asset.
- No Lease Agreements impose any financial restrictions on Council regarding future debt etc.
(d) Investment Property Commitments
Nil
page 54

Financial Statements 2012
KYOGLE COUNCIL
Notes to the Financial Statements for the financial year ended 30 June 2012
Note 13a(i). Statement of Performance Measurement - Indicators (Consolidated)
$ '000
Local Government Industry Indicators
1. Unrestricted Current Ratio
Current Assets less all External Restrictions (1)
Current Liabilities less Specific Purpose Liabilities(2,3)
2. Debt Service Ratio
Debt Service Cost
Income from Continuing Operations
excluding Capital Items & Specific
Purpose Grants/Contributions
3. Rates & Annual Charges
Coverage Ratio
18,740
Amounts
2,464
2012 2011
7.52
0.70%125
0.66%0.67%
Prior Periods
2010
Indicator
2012
20,671 8.39 7.80
page 55
Coverage Ratio
Rates & Annual Charges
Income from Continuing Operations
4. Rates, Annual Charges, Interest &
Extra Charges Outstanding Percentage
Rates, Annual & Extra Charges Outstanding
Rates, Annual & Extra Charges Collectible
5. Building & Infrastructure Renewals Ratio
Asset Renewals(4)
Depreciation, Amortisation & Impairment
Notes
(1) Refer Notes 6-8 inclusive.
Also excludes any Real Estate & Land for resale not expected to be sold in the next 12 months
(2) Refer to Note 10(a).
(3) Refer to Note 10(a)(ii) - excludes all payables & provisions not expected to be paid in the next 12 months (incl. ELE).
(4) Asset Renewals represent the replacement &/or refurbishment of existing assets to an equivalent capacity/performance as opposed to the acquisition of new assets (or the refurbishment of old assets) that increases capacity/performance. Asset Renewals include building and infrastructure assets only.
7,655
27,128 24.96% 25.70%
14.96% 10.76%
6,444
6,772
1,145
87.01%5,607
137.90%53.00%
26.68%
10.56%
page 55

Financial Statements 2012
KYOGLE COUNCIL
Notes to the Financial Statements for the financial year ended 30 June 2012
Note 13a(ii). Statement of Performance Measurement - Graphs (Consolidated)
Commentary on 2011/12 Result
2011/12 Ratio 8.39
Commentary on 2011/12 Result
To assess the
adequacy of working
capital and its ability
to satisfy obligations
in the short term for
the unrestricted
activities of Council.
Council has adequate unrestricted cash
and internal reserves to satisfy its current
obligations and has adequate levels of
internally restricted funds to meet identified
needs
To assess the impact
of loan principal &
interest repayments
on the discretionary
revenue of council.
2011/12 Ratio 0.67%
Council's debt levels remain low, General
Fund remains debt free
Purpose of
Unrestricted
Current Ratio
Purpose of Debt
Service Ratio
�����
�����
����
����
����
����
����
����
����
����
����
����
��� �� ���
�� �����
���������� ��������������� �
�����
����������
�� ���
������������ ����� �
page 56
Council's reliance on Rates and Annual
Charges has remained relatively steady
over the last 3 years
2011/12 Ratio 24.96%
2011/12 Ratio 87.01%
Commentary on Result
Commentary on 2011/12 Result
Purpose of Asset
Renewals Ratio
To assess the degree
of Council's
dependence upon
revenue from rates
and annual charges
and to assess the
security of Council's
income.
Commentary on 2011/12 Result
Purpose of Rates &
Annual Charges
Outstanding Ratio
revenue of council.
Purpose of Rates &
Annual Charges
Coverage Ratio
To assess the impact
of uncollected rates
and annual charges
on Council's liquidity
and the adequacy of
recovery efforts.
2011/12 Ratio 14.96%
This ratio has risen mainly as a result of
hardship within the timber industry as well
as one large debtor that has subsequently
been paid in July
This ratio should also be considered in
conjunction with the level of new asset
additions and councils adopted asset
management plan
To assess the rate at
which these assets
are being renewed
relative to the rate at
which they are
�����
�����
����
����
����
����
����
����
����
����
����
����
��� �� ���
�� �����
���������� ��������������� �
�����
����������
��� �� ���
�� ���
������������ ����� �
������
������
� ���
��
��
��
��
��
��
��
��� �� ���
�� ���
��������!�"����#��$��%���������%��
�� �
������ ������
� ���
�
�
�
�
�
�
�
�
�
��� �� ���
�� ���
������&�"����#��$��%��&�'��������!�
()�����$��%���*������� �%�+�������%�
������
������
������
�
��
��
��
��
��
��
��
��
�� ���
���,� #� �%�!�'�-���������������.�#��
�� �
management planwhich they are
depreciating.
�����
�����
����
����
����
����
����
����
����
����
����
����
��� �� ���
�� �����
���������� ��������������� �
�����
����������
��� �� ���
�� ���
������������ ����� �
������
������
� ���
��
��
��
��
��
��
��
��� �� ���
�� ���
��������!�"����#��$��%���������%��
�� �
������ ������
� ���
�
�
�
�
�
�
�
�
�
��� �� ���
�� ���
������&�"����#��$��%��&�'��������!�
()�����$��%���*������� �%�+�������%�
������
������
������
�
��
��
��
��
��
��
��
��
��� �� ���
�� ���
���,� #� �%�!�'�-���������������.�#��
�� �
page 56

Financial Statements 2012
KYOGLE COUNCIL
Notes to the Financial Statements for the financial year ended 30 June 2012
Note 13b. Statement of Performance Measurement - Indicators (by Fund)
$ '000
Local Government Industry Indicators
1. Unrestricted Current Ratio
Current Assets less all External Restrictions (1)
Current Liabilities less Specific Purpose Liabilities (2,3)
2. Debt Service Ratio
Debt Service Cost
Income from Continuing Operations
excluding Capital Items & Specific
Purpose Grants/Contributions
3. Rates & Annual Charges
Coverage Ratio
20.22
1.62
prior period:
prior period:
13.12
0.00%8.32%
Sewer
2012
17.08 8.36
3.39%
2012 2012
Water
7.52
3.60% 8.50% 0.00%
General1
page 57
Coverage Ratio
Rates & Annual Charges
Income from Continuing Operations
4. Rates, Annual Charges, Interest &
Extra Charges Outstanding Percentage
Rates, Annual & Extra Charges Outstanding
Rates, Annual & Extra Charges Collectible
5. Building & Infrastructure Renewals Ratio
Asset Renewals (Building & Infrastructure assets)
Depreciation, Amortisation & Impairment
Notes
(1) General Fund refers to all of Council's activities except for its Water & Sewer activities which are listed separately.
29.10% 63.70% 53.30%
19.69%
21.00%prior period:
prior period:
prior period:
93.61% 84.93%119.94%
13.18%
45.67%
81.90% 82.00%
14.65% 12.60%
25.12%
9.72%
21.97%64.19%
page 57

Financial Statements 2012
KYOGLE COUNCIL
Notes to the Financial Statements for the financial year ended 30 June 2012
Note 14. Investment Properties
$ '000
Council has not classified any Land or Buildings as "Investment Properties"
Notes
Actual Actual
20112012
page 58page 58

Financial Statements 2012
KYOGLE COUNCIL
Notes to the Financial Statements for the financial year ended 30 June 2012
Note 15. Financial Risk Management
$ '000
Risk Management
Council's activities expose it to a variety of financial risks including (1) price risk, (2) credit risk, (3) liquidity risk
and (4) interest rate risk.
The Council's overall risk management program focuses on the unpredictability of financial markets and seeks
to minimise potential adverse effects on the financial performance of the Council.
Council does not engage in transactions expressed in foreign currencies and is therefore not subject to foreign
currency risk.
Financial risk management is carried out by Council's Finance Section under policies approved by the Council.
A comparison by category of the carrying amounts and fair values of Council's Financial Assets & Financial
Liabilities recognised in the financial statements is presented below.
Carrying Value Fair Value
page 59
Financial Assets
Cash and Cash Equivalents
Investments
Receivables
Other Financial Assets
Total Financial Assets
Financial Liabilities
Payables
Loans / Advances
Total Financial Liabilities
Fair Value is determined as follows:
- Cash & Cash Equivalents, Receivables, Payables - are estimated to be the carrying value which approximates mkt value.
- Borrowings & Held to Maturity Investments - are based upon estimated future cash flows discounted by the current
market interest rates applicable to assets & liabilities with similar risk profiles, unless quoted market prices are available.
- Financial Assets classified (i) "at fair value through profit & loss" or (ii) Available for Sale - are based upon quoted
market prices (in active markets for identical investments) at the reporting date or independent valuation.
2011
Carrying Value
2,676
2012
-
1,812
4,488
20,879
4,559
4,488
23,059
2,676
2011
Fair Value
2012
1,270 1,883 1,241
3,082 3,917
5,160
-
23,059
15,719 18,571
1,812
1,639
3,451
-
15,719 18,571
20,879
5,160
page 59

Financial Statements 2012
KYOGLE COUNCIL
Notes to the Financial Statements for the financial year ended 30 June 2012
Note 15. Financial Risk Management (continued)
$ '000
(a) Fair Value Measurements
The fair value of financial assets and financial liabilities must be estimated in accordance with Accounting
Standards for either recognition and measurement requirements or for disclosure purposes.
AASB 7 Financial Instruments: Disclosures, requires the disclosure of how fair valuations have been arrived at
for all financial assets and financial liabilities that have been measured at fair value.
Arriving at fair values for financial assets & liabilities can be broken up into 3 distinct measurement hierarchies:
Level 1: Quoted prices (unadjusted) in active markets for identical assets or liabilities
Level 2: Inputs other than quoted prices included within Level 1 that are observable for the asset or liability,
either directly (as prices) or indirectly (derived from prices)
Level 3: Inputs for the asset or liability that are not based on observable market data (unobservable inputs)
Council's investment portfolio consists of deposits at fixed interest rates, generally for periods of less than 120 days.
page 60
Council's investment portfolio consists of deposits at fixed interest rates, generally for periods of less than 120 days.
Whilst these are subject to interest rate risk, this is minimised by the short term nature of the financial assets held.
page 60

Financial Statements 2012
KYOGLE COUNCIL
Notes to the Financial Statements for the financial year ended 30 June 2012
Note 15. Financial Risk Management (continued)
$ '000
(a) Cash & Cash Equivalents, Financial assets 'at fair value through the profit & Loss', "Available-for-sale" financial assets & "Held-to-maturity" Investments
Council's objective is to maximise its return on cash & investments whilst maintaining an adequate level of
liquidity and preserving capital.
Council's Finance area manages the Cash & Investments portfolio.
Council has an Investment Policy which complies with the Local Government Act & Minister's Investment Order.
This Policy is regularly reviewed by Council and it's staff and an Investment Report is tabled before Council on
a monthly basis setting out the portfolio breakup and its performance.
The major risk associated with Investments is price risk - the risk that the capital value of Investments may
fluctuate due to changes in market prices, whether there changes are caused by factors specific to individual
financial instruments or their issuers or are caused by factors affecting similar instruments traded in a market.
page 61
Cash & Investments are also subject to interest rate risk - the risk that movements in interest rates could affect
returns and income.
A further risk associated with Cash & Investments is credit risk - the risk that the investment counterparty will
not complete their obligations particular to a financial instrument, resulting in a financial loss to Council - be it
of a capital or income nature.
Council manages these risks (amongst other measures) by diversifying its portfolio and only purchasing
investments with high credit ratings or capital guarantees.
The following represents a summary of the sensitivity of Council's Income Statement and Accumulated Surplus
(for the reporting period) due to a change in either the price of a financial asset or the interest rates applicable.
It is assumed that the change in interest rates would have been constant throughout the reporting period.
2012
Possible impact of a 10% movement in Market Values
Possible impact of a 1% movement in Interest Rates
2011
Possible impact of a 10% movement in Market Values
Possible impact of a 1% movement in Interest Rates
Increase of Values/Rates Decrease of Values/Rates
186
157
Profit
157
Equity
186
Profit Equity
page 61

Financial Statements 2012
KYOGLE COUNCIL
Notes to the Financial Statements for the financial year ended 30 June 2012
Note 15. Financial Risk Management (continued)
$ '000
(b) Receivables
Council's major receivables comprise (i) Rates & Annual charges and (ii) User Charges & Fees.
The major risk associated with these receivables is credit risk - the risk that debts due and payable to Council
may not be repaid in full.
Council manages this risk by monitoring outstanding debt and employing stringent debt recovery procedures.
It also encourages ratepayers to pay their rates by the due date through incentives.
Credit risk on rates and annual charges is minimised by the ability of Council to secure a charge over the land
relating to the debts - that is, the land can be sold to recover the debt. Council is also able to charge interest
on overdue rates & annual charges at higher than market rates which further encourages the payment of debt.
There are no significant concentrations of credit risk, whether through exposure to individual customers,
specific industry sectors and/or regions.
page 62
specific industry sectors and/or regions.
The level of outstanding receivables is reported to Council monthly and benchmarks are set and monitored for
acceptable collection performance.
Council makes suitable provision for doubtful receivables as required and carries out credit checks on most
non-rate debtors.
There are no material receivables that have been subjected to a re-negotiation of repayment terms.
A profile of Council's receivables credit risk at balance date follows:
(i) Ageing of Receivables
Current (not yet overdue)
Past due by up to 30 days
Past due between 31 and 180 days
Past due between 181 and 365 days
Past due by more than 1 year
(ii) Movement in Provision for Impairment
of Receivables
Balance at the beginning of the year
+ new provisions recognised during the year
- amounts already provided for & written off this year
Balance at the end of the year
4,485
2011
(84)
Other
Rates &
Receivables
20112012 20112012
Rates &
Annual
923
Annual
Charges
Other
765
130 46
45
Charges
40
Receivables
3,289 138
1,061 3,473
184
-
94
130 36
-
805
2012
4,440
page 62

Financial Statements 2012
KYOGLE COUNCIL
Notes to the Financial Statements for the financial year ended 30 June 2012
Note 15. Financial Risk Management (continued)
$ '000
(c) Payables & Borrowings
Payables & Borrowings are both subject to liquidity risk - the risk that insufficient funds may be on hand to meet
payment obligations as and when they fall due.
Council manages this risk by monitoring its cash flow requirements and liquidity levels and maintaining an
adequate cash buffer.
Payment terms can (in extenuating circumstances) also be extended & overdraft facilities utilised as required.
The contractual undiscounted cash outflows (ie. principal and interest) of Council's Payables & Borrowings are
set out in the Liquidity Table below:
$ '000 Total
> 5 Yrs
Cash
Outflows4-5 Yrs
payable in:
Values
Actual
Carrying
1-2 Yrs
Subject
maturity
to no
� 1 Year 2-3 Yrs 3-4 Yrs
page 63
Trade/Other Payables
Loans & Advances
Total Financial Liabilities
Trade/Other Payables
Loans & Advances
Total Financial Liabilities
Borrowings are also subject to interest rate risk - the risk that movements in interest rates could adversely
affect funding costs & debt servicing requirements. Council manages this risk through the diversification of
borrowing types, maturities & interest rate structures.
The following interest rates were applicable
to Council's Borrowings at balance date:
Trade/Other Payables
Loans & Advances - Fixed Interest Rate
3,917
1,241
2,676
1,812
> 5 Yrs
1,270
3,082
7.55%
- 1,812
Average
Outflows
2011
4-5 Yrs
2012
Values1-2 Yrsmaturity � 1 Year
125 123 83
2-3 Yrs 3-4 Yrs
246
246 2,555
2,430
263
349 83
-
131 1,418
263 1,543 301
-
170 125
83
- -
123 349 83
170
1,706
1,789
5,145
1,706 2,469
2,676
Value
Average
Interest Rate
Carrying
1,789
1,812
170 170
2012
170 170
170 2,594
Interest Rate
1,270
3,082
Value
2011
Carrying
4,406
2,676
1,241
3,917
7.56%
page 63

Financial Statements 2012
KYOGLE COUNCIL
Notes to the Financial Statements for the financial year ended 30 June 2012
Note 16. Material Budget Variations
$ '000
Council's Original Financial Budget for 11/12 was adopted by the Council on 27 June 2012.
While the Income Statement included in this General Purpose Financial Report must disclose the Original
Budget adopted by Council, the Local Government Act requires Council to review its Financial Budget on a
Quarterly Basis, so that it is able to manage the various variations between actuals versus budget that
invariably occur throughout the year.
This Note sets out the details of MATERIAL VARIATIONS between Council's Original Budget and its Actual
results for the year as per the Income Statement - even though such variations may have been adjusted for
during each Quarterly Budget Review.
Note that for Variations* of Budget to Actual :
Material Variations represent those variances that amount to 10% or more of the original budgeted figure.
F = Favourable Budget Variation, U = Unfavourable Budget Variation
201220122012
page 64
$ '000
REVENUES
User Charges & Fees
Level of RMS ( formerly RTA ) works higher than anticipated
Interest & Investment Revenue
Level of funds invested was higher than anticipated
Other Revenues
Exceeded budget due to various unanticipated amounts being received after original budget was adopted
Operating Grants & Contributions
Exceeded budget as additional grant funds were allocated after original budget was adopted
Capital Grants & Contributions
Donated assets from large residential and commercial developments not budgeted for
3,596
78%
---------- Variance* ----------
101%
F
F
38
1,588 2,994 189%
F72%
4,582 F
F
2012
3,062
5,004
3,040
344
49
Actual
8,600
87
6,102
985
2012
Budget
2012
641 186%
page 64

Financial Statements 2012
KYOGLE COUNCIL
Notes to the Financial Statements for the financial year ended 30 June 2012
Note 16. Material Budget Variations (continued)
$ '000
EXPENSES
Employee Benefits & On-Costs
Contractors utilised instead of additional staffing as per materials and contracts below
Initial budgeting does not detail split between wages and contractors for all projects
Borrowing Costs
Exceeded budget due mainly to Quarries and Tips unwinding of present value discount not budgeted for
Materials & Contracts
Contractors utilised instead of additional staffing as per above
Initial budgeting does not detail split between wages and contractors for all projects
Level of RMS ( formerly RTA ) works higher than anticipated
Depreciation & Amortisation
Original estimate based on older depreciation expense figures as budget adopted prior to
updated figures being available
183
7,658
(74)
8,080 (7,096)
(3,411)
(721%) U
(80%)
F
U(68%)
4,247
6,653
2012
U
984
109
Budget
9,318 2,665
2012
---------- Variance* ----------
29%
Actual
2012
page 65
updated figures being available
Net Losses from Disposal of Assets
Council does not budget for disposal of infrastructure assets
U3,223 (207) 1657%(3,430)
page 65

������������������������
� ��� �� �������������� � ���� ������ ���������������������������� ���!�"!
� ��"#$�� � ���� ����%�&���'������ ��( ����� ��"#$�� � ���� ����%�&���'������ ��( ����
������
�� ���������&������� ��( ����)����������&����*��� ������ ��'������+��+������ �������&���'��� �,��-�� �� ������ (.�� � ������&���'��� ������� ���� ���(���� ����$
/������ ��( ������ � �(���'�� 0 ����������� ����'�������' �'���� ����,������&�������������� ���� ��''����(��� �� ��'�� �� ����� � �(��� ��( ��� ����������+�� ���$
1��������,��+� �(������ ���� ��������' )��� ���� ����� ������ ����(�&����� ��( �����*���&�������� ���&�� �����������������+�� ����,���������2��� ��� ��2���� ������ ��� ��$
��������� ��������������������
%�����+�
� � �� �&������������
�3'
� ���
�� ������&�����
� � �����+
4����,��+�5 ����6
7�������������������
� �05'���(��6� ����+
7�������������������
����� ��! � ����������"
#��$%&��'
(������������ 5886������������
������
8���������������
�����
������)* +�*"�)�
7��������������
�������� �,-��"��.��
�)���" ".���!
�)�
7��������������
����)�
"�������������
������ �-����!
�)*)���
�����/.�����
7��������������7��������������
���� )�0
�����1�"�".���!��0���)�
)�0
�9�����������
:����
�'����'���
7�������������������
7�������������������
7�������������������5;#;6����������
7�������������������
7��������������
"��������������
((2���������
3(3��������������
4�������������������
4�������������������
5<#6������������56�����������
"!#�����������
4�������������������
4�������������������
#727$�������������
5(5���������
4��������������
583������������)*��8(��1��.����"����*)��
�8(����1����4�.�"���)��*)�
4��������������
�8(� �����/.������4�.�"���)��*)�
4��������������
583��������� 938���������
938���������
4��������������
4��������������
4��������������
5(5���������
!;����������� 5!�;6��������
7��������������5<�6����������8�������������
7��������������
=#����������� !<����������� 7��������������
";8���������;�8���������
4��������������
4��������������
:������������
4��������������
:������������
4��������������
#985$��������
4��������������
#985$��������
7����������������
�����������
� ���� ��!�"!
7����������������
4�������������������5(5���������
4��������������
4��������������
7�������������������
"�������������
583���������
7��������������
�98��� � �����>����
�<8���� ��( ����
7�������������������7��������������
99�����������
���)*��8(��1��.����"����*)��
�9���>������+�/+������ �
7��������������
4��������������
7��������������
8�������������
938���������
7��������������
9(�����������
4��������������
7��������������
:������������
5=�6����������
7��������������
#985$��������
3(3��������� #727$�������� 4��������������
�����������
� ���� ��!�"!
578���������:32��������� 4��������������
'�+��<<
���)*� �����/.����� 4��������������585��������� :3����������� #:65$�������� 4��������������

������������������������
� ��� �� �������������� � ���� ������ ���������������������������� ���!�"!
� ��"#$�� � ���� ����%�&���'������ ��( ������ ��"#$�� � ���� ����%�&���'������ ��( �����5��� �� ��6
������
�8(� ������������4���;��������
��1:�41���>�/�?4�:�"
� ���
������ � � �����+
�����������
�3' �&�����
4����,��+�
�� �����
� ����+
� � �� �&�
+�*"�)�
� ��
#��$%&��'
�-����! 5 ����6
� �05'���(��6
�����/.�����
������
)�0
�����1�"�".���!��0���)�
���� )�0�)*)���
������)*
����� ��!
����)�
��������
".���!�)���"
�,-��"��.��
�)�
��������"
�����
%�����+�
:����
�'����'���
������ � � �����+
5<#6������������ 7����������������
4�������������������
� ����+
5(5�����������
#��$%&��'
5<�6������������
938�����������
;�8�����������
7���������������� 5886������������
5;#;6����������
���)*
7����������������
7����������������
� �05'���(��6
583����������� :��������������4���������������� 4����������������
";8�����������
�9�������������
)�0 ���� )�0�)*)���
=#������������� !<�������������
#985$����������
8���������������
((2�����������
����)�
!;�������������
"���������������
5!�;6����������
�)�
8���������������
"!#�����������
(��������������
#727$�������������
�����
3(3�������������� 4�������������������
"��������������56�������������
�����������
� ���� ��!�"!
'�+��<#
�����������
� ���� ��!�"!

Financial Statements 2012
KYOGLE COUNCIL
Notes to the Financial Statements
page 68
Notes to the Financial Statements for the financial year ended 30 June 2012
Note 18. Contingencies & Other Assets/Liabilities Not Recognised
$ '000
(a) Richmond Upper-Clarence Regional Library
The following assets and liabilities do not qualify for recognition in the Balance Sheet but knowledge of those items is
considered relevant to the users of the financial report in making and evaluating decisions about the allocation of scarce
resources:
Council together with other local government authorities have entered into an agreement to operate a regional library
known as the Richmond Upper-Clarence Regional Library. Annually, the Council contributes to the library to fund its
activities based upon a prescribed formula. In the event that Council wishes to withdraw from the agreement, the assets
(b) Legal Issues
activities based upon a prescribed formula. In the event that Council wishes to withdraw from the agreement, the assets
and liabilities of the Regional Library attributable to Council will be determined by the Library Board of New South Wales.
The Council from time to time defends actions in respect of the Land and Environment Court matters and other issues
served on it. It is not practicable to estimate the amount, if any, for which the Council could be liable thereof.
(c ) Section 94 Infrastructure
(d) Superannuation
Council has significant obligations to provide Section 94 infrastructure in new release areas. It is possible that funds
contributed may be less than the cost of this infrastructure requiring Council to borrow or use general revenue to fund the
difference. (Refer Note 17.)
The Local Government Superannuation Scheme – Pool B ( the scheme ) is a defined benefit plan that has been deemed The Local Government Superannuation Scheme – Pool B ( the scheme ) is a defined benefit plan that has been deemed
to be a “multi-employer fund” for purposes of AASB119. Sufficient information under AASB119 is not available to account
for the Scheme as a defined benefit plan, because the assets to the Scheme are pooled together for all employers.
The amount of employer contributions to the defined benefit section of the Local Government Superannuation Scheme
and recognised as an expense for the year ending 30 June 2012 was $252,273. The last valuation of the Scheme was
performed by Mr Martin Stevenson BSc, FIA, FIAA on 16th
February 2010 and covers the period ended 30 June 2009.
However the position is monitored annually and the actuary has estimated that as at 30th
June 2012 a deficit still exists.
Effective from 1 July 2009, employers are required to contribute at twice the “notional” or long term cost for a period of up
to ten years in order to rectify this deficit. The share of this deficit that can be broadly attributed to the employer was
estimated to be in the order of $689,405 as at 30 June 2012.
page 68
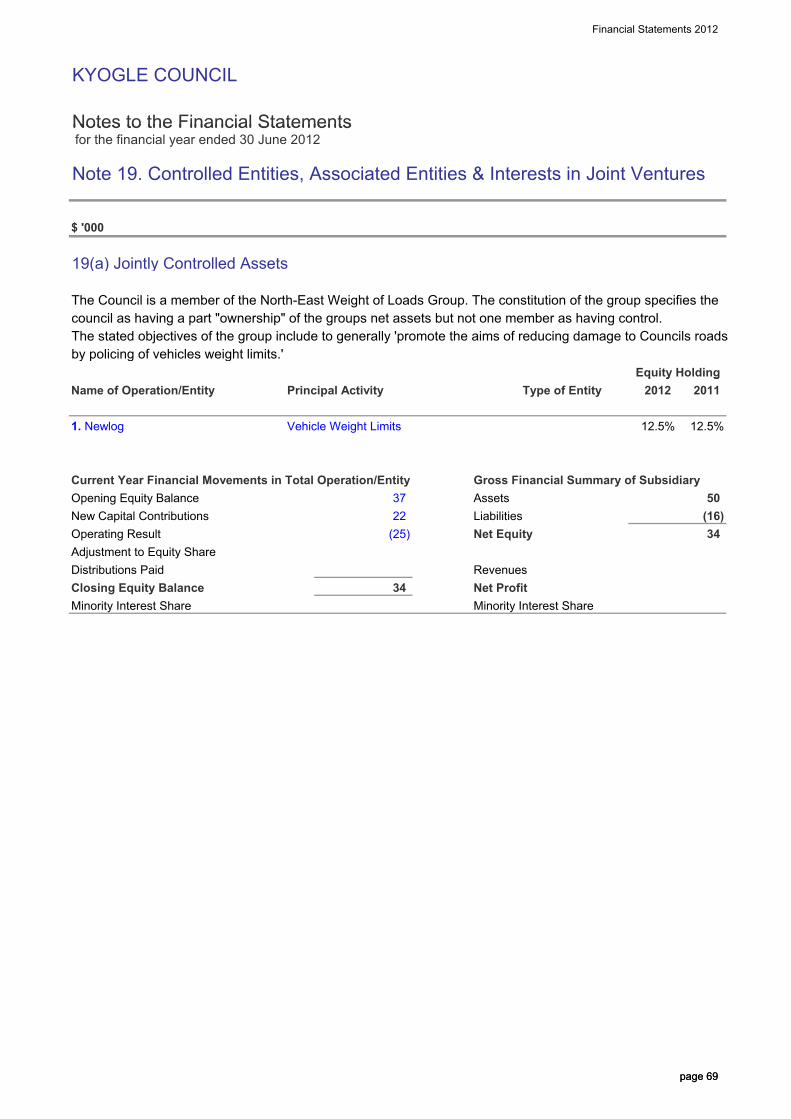
Financial Statements 2012
KYOGLE COUNCIL
Notes to the Financial Statements
page 69
Notes to the Financial Statements for the financial year ended 30 June 2012
Note 19. Controlled Entities, Associated Entities & Interests in Joint Ventures
$ '000
19(a) Jointly Controlled Assets
The Council is a member of the North-East Weight of Loads Group. The constitution of the group specifies the
council as having a part "ownership" of the groups net assets but not one member as having control.
The stated objectives of the group include to generally 'promote the aims of reducing damage to Councils roads
by policing of vehicles weight limits.'
Equity Holding
Name of Operation/Entity
Current Year Financial Movements in Total Operation/Entity Gross Financial Summary of Subsidiary
Opening Equity Balance Assets
Principal Activity Type of Entity 2011
12.5%Vehicle Weight Limits1. Newlog
2012
Equity Holding
12.5%
50 37 Opening Equity Balance Assets
New Capital Contributions Liabilities
Operating Result Net Equity
Adjustment to Equity Share
Distributions Paid Revenues
Closing Equity Balance Net Profit
Minority Interest Share Minority Interest Share
50
34 (25)
37
22 (16)
34
page 69

Financial Statements 2012
KYOGLE COUNCIL
Notes to the Financial Statements
page 70
Notes to the Financial Statements for the financial year ended 30 June 2012
Note 20. Equity - Retained Earnings and Revaluation Reserves
$ '000 2012
Actual Actual
2011Notes
a. Retained Earnings
Movements in Retained Earnings were as follows:
Balance at beginning of Year (from previous years audited accounts)
c. Other Comprehensive Income (excl. direct to Reserves transactions)
d. Net Operating Result for the Year
Balance at End of the Reporting Period(663)
146,616 143,888
(397)
3,391 -
146,616 146,219 Balance at End of the Reporting Period
b. Reserves
(i) Reserves are represented by:
- Infrastructure, Property, Plant & Equipment Revaluation Reserve 147,693 125,978
146,616 146,219
- Infrastructure, Property, Plant & Equipment Revaluation Reserve
(ii). Reconciliation of movements in Reserves:
Infrastructure, Property, Plant & Equipment Revaluation Reserve
- Opening Balance
- Revaluations for the year
- Balance at End of Year
147,693
125,978
125,978
11,049
147,693
114,929 125,978
9(a) 21,715
- Balance at End of Year
(iii). Nature & Purpose of Reserves
Infrastructure, Property, Plant & Equipment Revaluation Reserve
- The Infrastructure, Property, Plant & Equipment Revaluation
Reserve is used to record increments/decrements of Non
Current Asset values due to their revaluation.
125,978 147,693
Current Asset values due to their revaluation.
page 70

Financial Statements 2012
KYOGLE COUNCIL
Notes to the Financial Statements
page 71
Notes to the Financial Statements for the financial year ended 30 June 2012
Note 21. Financial Result & Financial Position by Fund
Income Statement by Fund$ '000 2012
Actual
2012 2012
Actual Actual
Continuing Operations
Income from Continuing Operations
Rates & Annual Charges
User Charges & Fees
Interest & Investment Revenue
Other Revenues
Grants & Contributions provided for Operating Purposes
Sewer
192 5,456
37 937
830 5,431
Water
27 49
-
11
8,524
General1
78 9
454
511
Grants & Contributions provided for Operating Purposes
Grants & Contributions provided for Capital Purposes
Other Income
Net Gains from Disposal of Assets
Total Income from Continuing Operations
Expenses from Continuing Operations
Employee Benefits & on-costs
1,293
6,228
27 49
94 198
8,524
24,716
-
4,290
-
1,119
-
215 210 Employee Benefits & on-costs
Borrowing Costs
Materials & Contracts
Depreciation & Amortisation
Other Expenses
Interest & Investment Losses
Net Losses from the Disposal of Assets
Total Expenses from Continuing Operations
6,981
4
6,228
549
1,078
2,884
24,883
1,569
87
7,134
- -
1,564
335
-
57
215
72
210
24
102
550
336 188
Total Expenses from Continuing OperationsOperating Result from Continuing Operations
Discontinued Operations
Net Profit/(Loss) from Discontinued Operations
Net Operating Result for the Year
41
-
1,078 24,883
(167)
(167)
-
41
1,564
(271)
-
(271)
Net Operating Result attributable to each Council Fund
Net Operating Result attributable to Minority Interests
Net Operating Result for the year before Grantsand Contributions provided for Capital Purposes (53)
-
(4,457)
(167)
-
41
-
(469)
(271)
and Contributions provided for Capital Purposes
1General Fund refers to all Council's activities other than Water & Sewer.
(53) (4,457) (469)
page 71
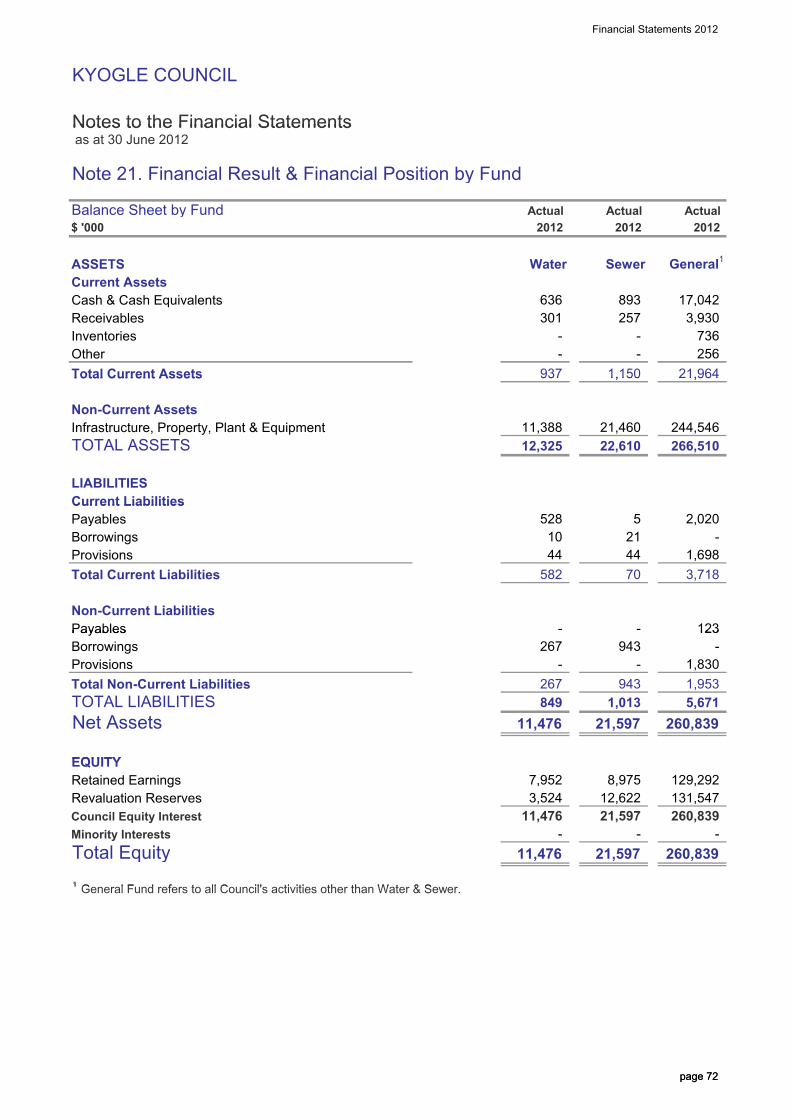
Financial Statements 2012
KYOGLE COUNCIL
Notes to the Financial Statements
page 72
Notes to the Financial Statements as at 30 June 2012
Note 21. Financial Result & Financial Position by Fund
Balance Sheet by Fund$ '000 2012
Actual Actual Actual
2012 2012
ASSETS
Current Assets
Cash & Cash Equivalents
Receivables
Inventories
Other
Total Current Assets
17,042
Water
937
-
636
-
301 3,930
General1
Sewer
-
893
257
21,964 1,150
736
- 256
Total Current Assets
Non-Current Assets
Infrastructure, Property, Plant & Equipment
TOTAL ASSETS
LIABILITIES
Current Liabilities
937
244,546
21,964
21,460
1,150
11,388
12,325 22,610 266,510
Current Liabilities
Payables
Borrowings
Provisions
Total Current Liabilities
Non-Current Liabilities
Payables
21
5
123
-
1,698
3,718
44
70
2,020
-
528
582
10
44
- Payables
Borrowings
Provisions
Total Non-Current Liabilities
TOTAL LIABILITIES
Net Assets
EQUITY
-
267
849
267
943
11,476
1,013
-
-
123
1,953 943
5,671
260,83921,597
1,830
- -
EQUITY
Retained Earnings
Revaluation Reserves
Council Equity Interest
Minority Interests
Total Equity
1General Fund refers to all Council's activities other than Water & Sewer.
7,952
11,476
- -
12,622 3,524 131,547
129,292 8,975
260,839 11,476
21,597
-
260,839
21,597
1General Fund refers to all Council's activities other than Water & Sewer.
page 72

Financial Statements 2012
KYOGLE COUNCIL
Notes to the Financial Statements
page 73
Notes to the Financial Statements for the financial year ended 30 June 2012
Note 26. Reinstatement, Rehabilitation & Restoration Liabilities
$ '000
Council has legal/public obligations to make restore, rehabilitate and reinstate the following assets/operations:
Asset/Operation
Tip Remediation 1,950
2012
Estimated
2011restoration
1,382 2050
NPV of Provision year of
Tip Remediation
Quarry Remediation
Balance at End of the Reporting Period
Under AASB 116 - Property, Plant & Equipment, where the use of an asset results in the obligation to dismantle
or remove the asset and restore the site on which the asset stands, an estimate of such costs is required to be
included in the cost of the asset.
1,950
315
2,238 10(a) 1,697
1,382 2050
288 2020
An equivalent liability must be recognised under AASB 137 - Provisions, Contingent Liabilities and Contingent
Assets.
The provision has been calculated by determining the present value of the future expenditures expected to be
incurred. The discount rate used is the risk free borrowing rate applicable to Council.
Reconciliation of movement in Provision for year:Reconciliation of movement in Provision for year:
Balance at beginning of year
Reductions arising from payments
Effect of a change in other calculation estimates used
Settlement without cost
Amortisation of discount (expensed to borrowing costs)
Total - Reinstatement, rehabilitation and restoration provision
Tip Quarry
1,950
(213)
-
17
288
(343)
- (90)
1,382 315 10 77
Total - Reinstatement, rehabilitation and restoration provision
Amount of Expected Reimbursements
Of the above Provisions for Reinstatement, Rehabilitation and Restoration works, those applicable to Garbage
Services & Waste Management are able to be funded through future charges incorporated within Council's
Annual Domestic Waste Management Charge.
1,382 315
page 73

31 Keen Street (PO Box 106) | Email: [email protected] | Website: www.tnr.com.au
Lismore NSW 2480 | Phone: Business Services +61 (0)2 6621 8544 | Facsimile: +61 (0)2 6621 9035 Audit & Assurance +61 (0)2 6626 3000
Liability limited by a scheme approved under the Professional Standards Legislation.
i
KYOGLE COUNCIL GENERAL PURPOSE FINANCIAL STATEMENTS
INDEPENDENT AUDIT REPORT Report on the Financial Statements We have audited the accompanying financial statements of Kyogle Council (the Council), which comprises the balance sheet as at 30 June 2012, the income statement, statement of comprehensive income, statement of changes in equity and statement of cash flows for the year then ended, notes comprising a summary of significant accounting policies and other explanatory information, and the statement by Councillors’ and Management. Councils’ Responsibility for the Financial Statements The Council is responsible for the preparation of the financial statements that give a true and fair view in accordance with Australian Accounting Standards and the Local Government Act 1993 and for such internal control as the Council determines is necessary to enable the preparation of financial statements that are free from material misstatement, whether due to fraud or error. Auditor’s Responsibility Our responsibility is to express an opinion on the financial statements based on our audit. We conducted our audit in accordance with Australian Auditing Standards. Those standards require that we comply with relevant ethical requirements relating to audit engagements and plan and perform the audit to obtain reasonable assurance whether the financial statements are free from material misstatement. An audit involves performing procedures to obtain audit evidence about the amounts and disclosures in the financial statements. The procedures selected depend on the auditor’s judgement, including the assessment of the risks of material misstatement of the financial statements, whether due to fraud or error. In making those risk assessments, the auditor considers internal control relevant to the Council’s preparation and fair presentation of the financial statements in order to design audit procedures that are appropriate in the circumstances, but not for the purpose of expressing an opinion on the effectiveness of the Council’s internal control.
An audit also includes evaluating the appropriateness of accounting policies used and the reasonableness of accounting estimates made by Council, as well as evaluating the overall presentation of the financial statements. Our audit responsibility does not extend to the original budget information included in the income statement, statement of cash flows, Note 2(a), Note 16 budget variation explanations and Note 17 forecast information, and accordingly, we do not express an opinion on such. In addition, our audit did not include an analysis of the prudence of business decisions made by Council or management. We believe that the audit evidence we have obtained is sufficient and appropriate to provide a basis for our audit opinion.
ii
Independence In conducting our audit, we have complied with the independence requirements of the Australian professional accounting bodies. Audit Opinion
In our opinion: a) The Council’s accounting records have been kept in accordance with the requirements of the
Local Government Act, 1993, Chapter 13, Part 3, Division 2;
b) The financial statements:
i. Have been prepared in accordance with the requirements of this Division;
ii. Are consistent with the Council’s accounting records;
iii. Present fairly, in all material respects, the Council’s financial position as at 30 June 2012, and of its performance and its cash flows for the year then ended; and
iv. Are in accordance with applicable Accounting Standards, Interpretations and other mandatory professional reporting requirements in Australia;
c) All information relevant to the conduct of the audit has been obtained; and
d) There are no material deficiencies in the accounting records or financial report that have come to light in the course of the audit.
Matters Relating to the Electronic Presentation of the Audited Financial Statements This auditor’s report relates to the general purpose financial statements of Kyogle Council for the year ended 30 June 2012 included on Council’s website. The Council is responsible for the integrity of the website. We have not been engaged to report on the integrity of this website. The auditor’s report refers only to the financial statements identified above. It does not provide an opinion on any other information which may have been hyperlinked to/from the financial statements. If users of the financial statements are concerned with the inherent risks arising from publication on a website, they are advised to refer to the hard copy of the audited financial statements to confirm the information contained in this website version of the financial statements. THOMAS NOBLE & RUSSELL CHARTERED ACCOUNTANTS G W DWYER (Partner) Registered Company Auditor
Dated at Lismore this 31st day of October 2012.

31 Keen Street (PO Box 106) | Email: [email protected] | Website: www.tnr.com.au
Lismore NSW 2480 | Phone: Business Services +61 (0)2 6621 8544 | Facsimile: +61 (0)2 6621 9035 Audit & Assurance +61 (0)2 6626 3000
Liability limited by a scheme approved under the Professional Standards Legislation.
iii
Lismore, 31 October 2012 Mayor and Councillors Kyogle Council Stratheden Street KYOGLE NSW 2474 Dear Councillors
We advise that we have completed our audit of the Council’s general purpose and special purpose financial statements for the year ended 30 June 2012 under section 417 of the Local Government Act 1993.
In accordance with that section we now report on the conduct of the audit. Yours faithfully THOMAS NOBLE & RUSSELL Per:
..................................................... G W DWYER (Partner) Registered Company Auditor

Kyogle Council
Report to Council Under s417 of the Local Government Act 1993 for the Year Ended 30 June 2012

v
CONTENTS
1. COUNCIL’S FINANCIAL REPORTING REQUIREMENTS ................................................... vi
2. AUDITORS’ RESPONSIBILITIES ........................................................................................ vi
3. OPERATING RESULT ........................................................................................................ vii
3.1 Variations to 2011 by Income / Expenditure .......................................................... viii
3.2 Analysis of income sources ...................................................................................... xi
3.3 Depreciation .............................................................................................................. xii
3.4 Capital Grants and Contributions ............................................................................ xii
3.5 Gain / (Loss) on Disposal of Assets ....................................................................... xiii
3.6 Water Supplies ......................................................................................................... xiv
3.7 Sewerage Services ................................................................................................... xv
3.8 National Competition Policy Business Activities .................................................. xvi
4. BALANCE SHEET ........................................................................................................... xviii
4.1 Net Current Assets ................................................................................................ xviii
4.2 Non-Current Assets and Liabilities ......................................................................... xx
5. KEY PERFORMANCE INDICATORS................................................................................ xxii
6. INTERNAL CONTROL ENVIRONMENT ........................................................................... xxv

vi
1. COUNCIL’S FINANCIAL REPORTING REQUIREMENTS
Council is required to prepare two financial statements ready for audit each year: General Purpose Financial Statements These financial statements present the financial position and performance of the Council on a consolidated basis. It includes all controlled Council operations such as general, water and sewer funds as well as domestic waste management activities. Council has prepared its general purpose financial statements in accordance with the Division of Local Government Code of Accounting Practice Manual which adopts applicable Australian Accounting Standards as the framework for financial reporting. Special Purpose Financial Statements These financial statements provide an understanding of the financial position and performance of Council's declared business activities as required under National Competition Policy. Council's declared business activities for the 2012 financial year are:
n Water Fund Operations;
n Sewer Fund Operations;
n Domestic Waste Management;
n Quarry Operations; and
n Transport.
Council is not required to adopt Australian Accounting Standards when preparing these financial statements, however the financial position and performance have been calculated by adopting applicable Accounting Standard requirements.
2. AUDITORS’ RESPONSIBILITIES
In order that your Councillors may appreciate our responsibilities as auditors, we take this opportunity to briefly discuss the scope of our audit.
In accordance with our contractual arrangements with Council we have undertaken to perform an attest (risk based) audit. The definition of an attest audit is:
"the minimum audit work necessary to enable an opinion to be expressed as to whether the financial statements are presented fairly in accordance with the requirements of the Local Government Act 1993, Australian Accounting Standards and Accounting Concepts so as to present a view which is consistent with an understanding of the Council’s financial position, the results of its operations and its cash flows.”

vii
Forming Our Audit Opinion
Our function as auditors is to examine the general purpose and special purpose financial statements presented to us by the Council. Our audit responsibility does not extend to:
n The original budget information included in the income statement, statement of cash flows, Note 2(a) and Note 16 budget variation explanations in the general purpose financial statements;
n Information presented at Note 17 to the general purpose financial statements relating to projected future contributions, cost of works and over/(under) funding; and
n The best practice disclosures in Notes 2 & 3 to the special purpose financial statements.
Accordingly, we do not express an opinion on such. As auditors of the Council we are not responsible for the preparation of the financial statements or for the maintenance of proper and adequate accounting records and proper systems of internal control. These responsibilities, together with the requirement to present financial statements which give a true and fair view of the state of the Council’s affairs and of its results, are imposed on the Councillors by the Local Government Act and Regulations 1993.
Reporting on the Conduct of the Audit
As part of our role as auditor of Council, Section 415 (3) of the Local Government Act 1993 and the Local Government (General) Regulation requires us to consider and provide comment on the material items affecting the general purpose financial statements and other matters pertinent to the beneficial audit. The following section of this report provides an understanding of Council's financial position as at 30 June 2012, its performance for the year then ended, its cash flows and other material financial matters.
3. OPERATING RESULT
Council’s result from all activities for the year ended 30 June 2012 was a $397,000 deficit. This compares to a deficit of $663,000 in 2011. The 2012 result can be summarised as follows:
2012 2011 2010
$’000 $’000 $’000
Revenues from continuing operations 22,546 22,083 19,719
Expenses from continuing operations (16,644) (16,599) (15,165)
Result from continuing operations before depreciation and capital amounts 5,902 5,484 4,554
Depreciation (7,658) (7,579) (4,341)
Result from continuing operations before capital amounts (1,756) (2,095) 213
Capital grants and contributions 4,582 1,802 4,065
Gain / (loss) on disposal of assets (3,223) (370) (714)
Surplus / (Deficit) from all activities (397) (663) 3,564

viii
3.1 Variations to 2011 by Income / Expenditure
The surplus from continuing operations before depreciation and capital amounts has increased by $418,000 from $5,484,000 in 2011 to $5,902,000 in 2012. Some of the components contributing to the result included:
Account Increase / (Decrease)
$'000 Reason for Increase / Decrease
REVENUE
Rates and Annual Charges
Ordinary Rates 211 The $211,000 increase in ordinary rates, from $4,330,000 in 2010/2011 to $4,541,000 in 2011/2012, is largely attributable to increases in ordinary rates from the pegging amount of 2.8%, a 0.81% catch up amount and the impact of supplementary levies.
Domestic Waste Management Services
184 Domestic Waste Management Charge revenue increased by $184,000, from $515,000 in 2010/2011 to $699,000 in 2011/2012. This increase is attributable to a 33% increase in the annual DWM charge, from $293 to $390 due to the impact of the State Waste Levy.
Sewerage Services
(66) Sewerage annual charges decreased by $66,000, from $899,000 in 2010/2011 to $833,000 in 2011/2012. This decrease is primarily due to non-residential sewerage charges, which are now only consumption based and no longer have an annual charge component. The non-residential annual sewerage charge for 2010/2011 amounted to $72,000.
Water Supply Services
43 Water Supply Services revenue increased by $43,000, from $469,000 in 2010/2011 to $512,000 in 2011/2012, due to a increase of 8% in the charge levied and an increase in the number of assessments.
Other Annual Charges revenue
28 Other annual charges revenue, consisting of Drainage annual charges and Non-Domestic Waste Management Services, remained relatively consistent with the previous year.
User Charges and Fees
Specific User Charges
60 Specific user charges, consisting of Water Supply, Sewerage Services and Non-Domestic Waste Management Services, remained relatively consistent with the previous year with the largest movement relating to an increase in Sewerage Services charges of $57,000 from the previous year.

ix
Account Increase / (Decrease)
$'000 Reason for Increase / Decrease
RMS Claims (1,132) RMS revenue decreased by $1,132,000 from $5,175,000 in 2010/2011 to $4,043,000 in 2011/2012. This resulted from the decreased level of road maintenance works carried out on State roads under the RMS Road Maintenance Council Contracts (RMCC).
Planning and Building Regulation
(108) Planning and Building Regulation revenue decreased by $108,000 from $203,000 in 2010/2011 to $95,000 in 2011/2012. This decrease was attributable to a decline in Planning Development Fees - $81,000; Construction Certificates - $21,000 and Development Application Advertising - $7,000.
Quarry Fees (340) Quarry Fees decreased by $340,000, from $800,000 in 2010/2011 to $460,000 in 2011/2012. This decrease is attributable to the decreased road maintenance works carried out for the RMS.
Interest and Investment Revenue
Interest Revenue 121 Interest revenue increased by $121,000, from $864,000 in 2010/2011 to $985,000 in 2011/2012.
This increase has occurred due to additional funds being available for investment on short term deposits, combined with increased revenue recognised on overdue rates and charges.
Other Revenue
Other Revenue 57 Other revenue increased by $57,000, to $87,000 in 2011/2012. The largest component of this revenue is Commissions & Agency Fees, which accounts for $57,000 of the 2011/2012 revenue.
Operating Grants and Contributions
Financial Assistance
982 The Financial Assistance grants received in the 2011/2012 year were $982,000 higher than that received in the 2010/2011 year. The revenue recognised for the 2011/2012 year represents five quarters, as the Division of Local Government has paid two quarters in advance, whereas previously had paid one quarter in advance.

x
Account Increase / (Decrease)
$'000 Reason for Increase / Decrease
Transport Grants 522 Operating Transport grants of $2,637,000 were received in 2011/2012, compared to $2,115,000 in 2010/2011. The amounts recognised in the 2011/2012 year included amounts of $1,633,000 relating to the January 2011 flood event, an amount of $886,000 relating to the January 2012 flood event and an amount of $118,000 was also received for an extended regional roads block grant.
Flood Restoration 219 Flood Restoration grants of $257,000 were received in 2011/2012, compared to $38,000 in 2010/2011. The amount recognised in the 2011/2012 year, from the Department of Public Works, relates to the January 2011 flood event.
NSW Rural Fire Services
(260) An amount of $126,000 was recognised as revenue in 2010/2011. These amounts were not subsequently received and so have been reversed in 2011/2012, hence a turnaround (decrease in revenue) of $260,000.
EXPENSES
Employee Benefits and On-Costs
(148) Salaries and wages decreased by $361,000 due to less casuals being utilised in 2012, coupled with a decrease in staff numbers from 92 employees in 2011 to 90 employees in 2012 and more staff utilising long service leave in 2012.
Expenditure relating to employee leave entitlements increased by $161,000 with long service leave increasing by $182,000, offset in part by a decrease in sick leave of $64,000.
Superannuation expenses were reduced by $41,000, to $673,000 in 2011/2012.
Materials & Contracts
215 Raw materials and consumables increased by $171,000, from $7,750,000 to $7,921,000.
Legal expenses related to planning and development increased by $77,000, to $108,000 in 2011/2012. The 2011/2012 costs related to action taken in the Land and Environment Court in relation to a refused Development Application which Council successfully defended.

xi
Account Increase / (Decrease)
$'000 Reason for Increase / Decrease
Other Expenses 94 The Bad & Doubtful debts expense for the 2010/2011 year, being $96,000, was largely reversed resulting in a negative expense of $84,000 recognised in 2011/2012. This reversal related to arrears from the Kyogle Recreational Reserve. This resulted in a turnaround difference (net decrease in expenses) of $180,000.
Electricity and heating costs increased by $118,000 to $302,000 in 2011/2012.
Emergency Services costs increased by $67,000 to $202,000 in 2011/2012.
3.2 Analysis of income sources
2012 2011 2010
$’000 $’000 $’000
General - rates & annual charges 4,728 4,489 4,374
DWM - annual charges 699 515 430
Sewer - annual charges 833 899 882
Water - annual charges 512 469 419
Total rates & annual charges 6,772 6,372 6,105
Sewer - user charges 192 135 101
Water - user charges 443 431 499
Other user charges and fees 5,467 7,108 5,281
Total user charges and fees 6,102 7,674 5,881
Interest & investment revenue 985 864 559
Other revenue 87 30 142
Operating grants and contributions 8,600 7,143 7,032
Total revenue before capital amounts 22,546 22,083 19,719
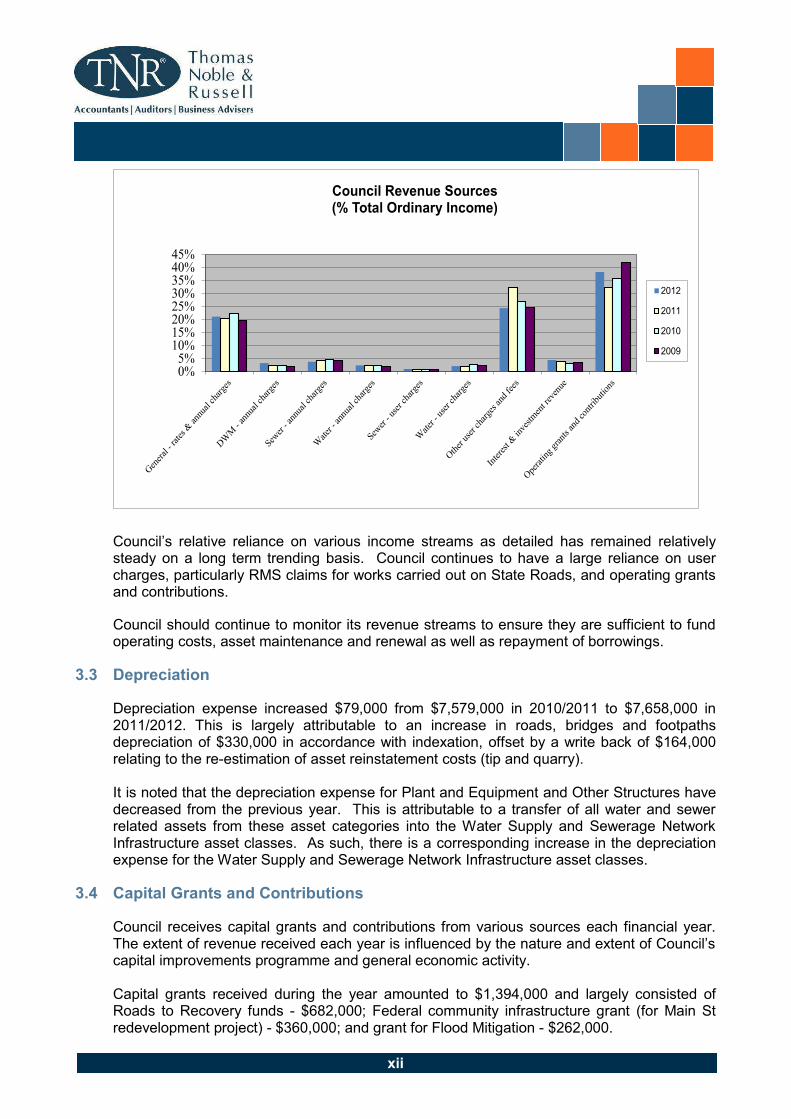
xii
Council’s relative reliance on various income streams as detailed has remained relatively steady on a long term trending basis. Council continues to have a large reliance on user charges, particularly RMS claims for works carried out on State Roads, and operating grants and contributions.
Council should continue to monitor its revenue streams to ensure they are sufficient to fund operating costs, asset maintenance and renewal as well as repayment of borrowings.
3.3 Depreciation
Depreciation expense increased $79,000 from $7,579,000 in 2010/2011 to $7,658,000 in 2011/2012. This is largely attributable to an increase in roads, bridges and footpaths depreciation of $330,000 in accordance with indexation, offset by a write back of $164,000 relating to the re-estimation of asset reinstatement costs (tip and quarry). It is noted that the depreciation expense for Plant and Equipment and Other Structures have decreased from the previous year. This is attributable to a transfer of all water and sewer related assets from these asset categories into the Water Supply and Sewerage Network Infrastructure asset classes. As such, there is a corresponding increase in the depreciation expense for the Water Supply and Sewerage Network Infrastructure asset classes.
3.4 Capital Grants and Contributions
Council receives capital grants and contributions from various sources each financial year. The extent of revenue received each year is influenced by the nature and extent of Council’s capital improvements programme and general economic activity.
Capital grants received during the year amounted to $1,394,000 and largely consisted of Roads to Recovery funds - $682,000; Federal community infrastructure grant (for Main St redevelopment project) - $360,000; and grant for Flood Mitigation - $262,000.
0%
5%
10%
15%
20%
25%
30%
35%
40%
45%
Council Revenue Sources (% Total Ordinary Income)
2012
2011
2010
2009

xiii
Capital contributions received during the period amounted to $3,188,000. This can be broken down as follows:
2012 2011 2010 $’000 $’000 $’000
Section 94 Contributions - cash 111 112 94
Section 64 Contributions - cash 137 9 7
RMS Contributions * 544 315 1,049
Subdivider Dedications ** 2,208 - -
Other Contributions 188 - -
TOTAL 3,188 436 1,150
* RMS contributions were higher in the current year, with major contributions relating to Boomi Creek Bridge - $245,000; Boomi Creek approaches - $127,000; and Bentley Road rehabilitation - $135,000.
** Subdivider dedications largely relate to the Mayfield Estate - $2,017,000 and the Kyogle
Supermarket development - $140,000.
At 30 June 2012 Council held $545,000 as a restricted asset for S94 contributions and $24,000 as a restricted asset for S64 contributions.
3.5 Gain / (Loss) on Disposal of Assets
Council’s loss on disposal of assets comprise the following items.
2012 2011 2010
$’000 $’000 $’000
Profit on sale of plant and equipment 120 86 32
Loss on write-off of infrastructure assets (3,343) (456) (414)
Write-off resulting from review of asset register - - (332)
(3,223) (370) (714)
The loss on disposal of assets largely represents the written-down value of infrastructure assets that have been disposed or rehabilitated in the normal course of Council’s budgeted asset replacement program.
The write-off of infrastructure assets in the 2012 year included $1,574,000 relating to roads and footpaths; and $1,098,000 relating to reconstruction of bridges. Major disposals of bridges were attributed to the Boomi Creek bridge replacements.

xiv
3.6 Water Supplies
(i) Operating Result
Water supply activities can be summarised as follows:
Actual Actual Actual 2012 2011 2010
$’000 $’000 $’000
Rates and service availability charges 511 467 419
User charges 443 444 499
Interest 11 2 14
Other 11 12 81
Grants - Capital - 156 621
Grants - Operating 49 27 27
Capital Contributions 94 4 1
Total Revenue 1,119 1,112 1,662
Management Expenses 210 315 248
Operating Costs 620 515 395
Other 32 31 101
Depreciation 188 215 184
Interest 24 24 14
Loss on Disposal 4 4 59
Total Expenses 1,078 1,104 1,001
Operating Result 41 8 661
(ii) Explanations for Significant Variances
Revenue
o Capital grants decreased by $156,000 from the previous year due to no grants being received for the Bonalbo water treatment plant in 2012.
o Capital contributions increased by $90,000 due to developer charges and assets provided by developers in relation to the Mayfield and Kyogle Supermarket developments.
Expenses
o Operating expenses increased by $105,000. This was mainly attributed to costs associated with the Kyogle mains maintenance in 2012.
o Management expenses decreased by $105,000 due to a one off bad debts expense of $61,000 for Kyogle recreational reserves in 2011.

xv
(iii) Key Indicators
2012 2011 2010
$ $ $
Average service availability charge per assessment 256 239 215
Average user charge per assessment 222 229 257
Management and operating cost per assessment 417 427 331
3.7 Sewerage Services
(i) Operating Result
Sewerage services activities can be summarised as follows:
Actual Actual Actual 2012 2011 2010
$’000 $’000 $’000
Rates and service availability charges 830 899 891
User charges 192 135 120
Interest 37 28 14
Other 9 5 9
Grants - Operating 27 26 26
Capital Contributions 198 3 2
Total Revenue 1,293 1,096 1,062
Management Expenses 235 202 177
Operating Costs 586 483 457
Other - 12 17
Depreciation 336 333 323
Loss on Disposal 335 192 -
Interest 72 73 74
Total Expenses 1,564 1,295 1,048
Operating Result (271) (199) 14
(ii) Explanation for Significant Variances
Revenue
o Capital contributions increased by $195,000 due to developer charges and assets provided by developers in relation to the Mayfield and Kyogle Supermarket developments.

xvi
Expenses
o Write-off of assets relating to the Kyogle sewer relining program led to a loss on disposals of $335,000, an increase in 2012 of $143,000.
o Operating expenses increased by $103,000. This was mainly attributed to costs associated with the Kyogle mains maintenance in 2012.
(iii) Key Indicators
2012 2011 2010
$ $ $
Average service availability charge per assessment 464 504 500
Average user charge per assessment 107 76 67
Management and operating cost per assessment 459 384 356
3.8 National Competition Policy Business Activities
Under the National Competition guidelines Council is required to apply taxation equivalent principles to each business similar to those that would apply if they were operating in the commercial sector. Council declared business activities have been reported with operating details and assets disclosed on a gross basis in Council’s special purpose financial statements. Each activity has a required rate of return on its activities that is calculated as the operating result plus interest expense divided by the written down value of property, plant & equipment. Where the return on investment is below the required rate of return, the difference is disclosed as a notional subsidy from Council’s General Fund activities. Dividends represent funds provided by the relevant business activity for other functions of Council.
A summary of the financial performance of Council’s declared business activities is:
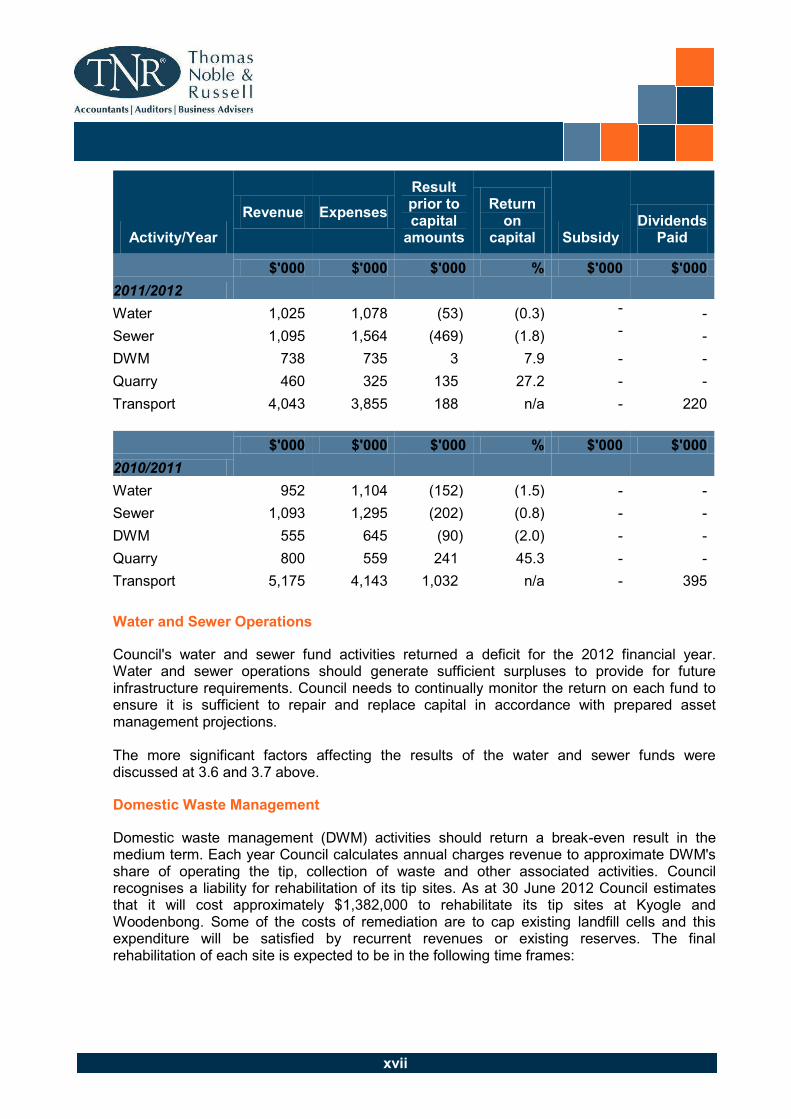
xvii
Activity/Year
Revenue Expenses
Result prior to capital
amounts
Return on
capital Subsidy Dividends
Paid
$'000 $'000 $'000 % $'000 $'000
2011/2012
Water 1,025 1,078 (53) (0.3) - -
Sewer 1,095 1,564 (469) (1.8) - -
DWM 738 735 3 7.9 - -
Quarry 460 325 135 27.2 - -
Transport 4,043 3,855 188 n/a - 220
$'000 $'000 $'000 % $'000 $'000
2010/2011
Water 952 1,104 (152) (1.5) - -
Sewer 1,093 1,295 (202) (0.8) - -
DWM 555 645 (90) (2.0) - -
Quarry 800 559 241 45.3 - -
Transport 5,175 4,143 1,032 n/a - 395
Water and Sewer Operations
Council's water and sewer fund activities returned a deficit for the 2012 financial year. Water and sewer operations should generate sufficient surpluses to provide for future infrastructure requirements. Council needs to continually monitor the return on each fund to ensure it is sufficient to repair and replace capital in accordance with prepared asset management projections. The more significant factors affecting the results of the water and sewer funds were discussed at 3.6 and 3.7 above.
Domestic Waste Management
Domestic waste management (DWM) activities should return a break-even result in the medium term. Each year Council calculates annual charges revenue to approximate DWM's share of operating the tip, collection of waste and other associated activities. Council recognises a liability for rehabilitation of its tip sites. As at 30 June 2012 Council estimates that it will cost approximately $1,382,000 to rehabilitate its tip sites at Kyogle and Woodenbong. Some of the costs of remediation are to cap existing landfill cells and this expenditure will be satisfied by recurrent revenues or existing reserves. The final rehabilitation of each site is expected to be in the following time frames:

xviii
Year $
Kyogle Final Rehabilitation 2050 1,075,000
Woodenbong Final Rehabilitation 2017 307,000
1,382,000
Changes in the underlying assumptions affecting the net present value calculation of the expected future costs resulted in a decrease to the rehabilitation provision of $568,000. The year of remediation for the Kyogle Final Cap has been reassessed from 2055 to 2050, and the Woodenbong Final Cap has been reassessed from 2020 to 2017.
Currently Council has $73,000 in DWM cash reserves. Council should continually reassess the timing and cost of rehabilitation of each site to ensure that DWM revenues are sufficient to generate cash reserves to fund the expenditure.
Quarry Operations
Council's quarry operations returned a surplus of $135,000 in 2012, compared to a surplus of $241,000 in 2011. Council quarries have a desired rate of return of 15% per annum. Council’s profitability from quarry operations has remained above this rate, with a rate of return of 27%. As at 30 June 2012 Council has quarry reserves of $884,000 (compared to $602,000 at 30 June 2011).
Transport Operations
Council's Transport Operations represents road works under contract to the RMS. Transport activities have returned a surplus during the 2012 financial year of $188,000. This compares to a surplus of $1,032,000 in 2011, with the reduction due to reduced activity and profitability on works performed. The Transport activity hires road building equipment from Council's plant fleet and as a result, no rate of return on assets is calculated. As at 30 June 2012 Council has transport reserves of $564,000 (compared to $370,000 at 30 June 2011).
4. BALANCE SHEET
4.1 Net Current Assets
Council has net current assets of $19,681,000 as at 30 June 2012, however, this includes $918,000 in leave entitlements which are not expected to be settled within twelve months. Net current assets however, also contains $2,693,000 of externally restricted cash assets in the form of retention bonds and deposits, developer contributions, specific purpose unexpended grants, and restricted water, sewer, domestic waste management funds. Also included in Council’s net current assets is $687,000 of externally restricted receivables relating to water, sewerage and domestic waste management charges and rates.

xix
2012 2011 2010 $’000 $’000 $’000
TOTAL CASH ASSETS 18,571 15,719 13,928
Less: Externally Restricted Reserves
- Water 637 756 637
- Sewer 870 1,113 1,029
- DWM 73 191 346
- Developer Contributions 569 595 633
- Unexpended Grants 298 476 904
- Other 246 263 249
2,693 3,394 3,798
Less: Internally Restricted Reserves (15,681) (12,125) (9,930)
UNRESTRICTED CASH 197 200 200
At balance date Council has allocated $15,681,000 to internally restricted cash to fund specific Council projects. We provide an understanding of internal reserve balances as at 30 June 2012:
2012 2011 2010
Internally Restricted Reserves $’000 $’000 $’000
Employee Entitlements 1,138 730 730
Buildings 462 562 622
Transport 564 370 -
Quarries 884 602 250
Plant 6,181 3,827 3,086
Revotes 3,608 3,814 2,902
Commercial Waste 754 150 150
Information Technology 100 80 130
Roads & Bridges 1,490 1,890 1,890
Emergency Works 300 100 100
Other - stormwater 200 0 70
15,681 12,125 9,930
After funding internal and external restrictions Council has unrestricted cash assets of $197,000.

xx
4.2 Non-Current Assets and Liabilities
Council has a net non-current asset position of $274,231,000, which consists largely of property, plant and equipment, infrastructure assets, loans, and provisions for employee benefits and rehabilitation of tip sites and quarries.
4.2.1 PROPERTY, PLANT & EQUIPMENT
During the year Council capitalised the following property, plant and equipment:
2012 2011 2010
$’000 $’000 $’000
Non-cash grants / contributions
Land and Buildings 2 - -
Roads and Drainage Network 2,012 - -
Water Supply Network 45 - -
Sewerage Network 149 - -
Council Constructed / Purchased Assets
Work in Progress 1,088 1,153 -
Land and Buildings 449 168 1,138
Plant and Equipment 1,187 1,098 1,588
Roads and Drainage Network 3,699 2,511 4,982
Water Supply Network 628 73 -
Sewerage Network 403 174 74
Other 369 719 95
10,031 5,896 7,877
As illustrated above, Council has capitalised approximately $10 million in infrastructure, property, plant and equipment during the 2012 financial year. Major Council constructed/purchased assets were the Main Street Development - $770,000; vehicle fleet additions - $523,000 and a motor grader - $349,000.
Asset Revaluations 2012
The Division of Local Government has mandated that all infrastructure assets including land and buildings are to be recognised in Council's financial records at their fair value. Fair value represents the written-down replacement cost of each asset using modern day equivalent materials, design and capacity.

xxi
During the year Council performed a full revaluation of the Water Supply, Sewerage and Stormwater Drainage Networks. As a result of the revaluation, a revaluation increment of $2,248,000 was recognised for the Water Network, $4,497,000 was recognised for the Sewerage Network and a revaluation increment of $1,448,000 was recognised for the Stormwater Drainage Network.
Where material, fair value adjustments are made each year to keep all infrastructure assets at fair value. As a result, a 2011/2012 increment of $10,196,000 for roads, bridges and footpaths was recognised. Bulk earthworks were also incremented by $3,326,000.
Regular Re-assessment of Useful Lives
It is important that Council regularly re-assesses the remaining useful lives of assets and their condition in future revaluations. The depreciation charge should reflect the consumption of the asset over its useful life. Fair value reporting of assets will require adequate internal resources in order to ensure the information from asset management reporting systems is accurate, timely and reflects the consumption of the assets.
4.2.2 LOANS
Total borrowings at 30 June 2012 amounted to $1,241,000, which reduced from prior year’s balance of $1,270,000.
The majority of outstanding borrowings relate to the sewerage fund, with total borrowings of $964,000 consisting primarily of a loan taken out in December 2007 to finance sewerage treatment plant augmentation works. Borrowings in the water fund totalling $277,000 relate to a loan taken out in 2010 for the Bonalbo and Woodenbong water treatment works.
Council is projecting to borrow $300,000 in the 2012/2013 year for Waste Services.
0
1,019 1,001 983 964
277
0
200
400
600
800
1000
1200
2009 2010 2011 2012
$'0
00
Debt Levels (By Fund)
Sewerage
Water
287296

xxii
5. KEY PERFORMANCE INDICATORS
Council's performance can be measured using selected indicators. The local government sector utilises certain key performance indicators to measure some aspects of its financial position and performance. Note 13 to the general purpose financial statements provides details of local government sector key performance indicators. We provide an analysis of some of these key performance indicators on a fund-by-fund basis. When interpreting the ratios below it is important to recognise that they represent a measure of certain aspects of Council’s operations at a particular point in time and do not provide a complete assessment of Council’s financial performance or position nor do they consider the plans Council has in place to manage its operations into the future.
Unrestricted Current Ratio
The unrestricted current ratio represents Council’s capacity to meet its commitments from current assets net of externally restricted cash, investments and receivables. Factors influencing Council’s unrestricted current assets ratio include:
n Planning and budgetary controls;
n Cash management and the timing of cash flows;
n The level of internally restricted assets; and
n Credit management policies and economic circumstances.
General Fund Unrestricted Current Ratio
4.68
7.80 7.528.36
0.00
2.00
4.00
6.00
8.00
10.00
2009 2010 2011 2012
General FundUnrestricted Current Ratio

xxiii
10.5812.55
20.22
17.08
0
5
10
15
20
25
2009 2010 2011 2012
Sewer Fund Unrestricted Current Ratio
Council’s general fund unrestricted current ratio has increased from 7.52 to 8.36, due to an improved net current asset position. This means that Council has $8.36 in unrestricted net current assets for every $1 of unrestricted current liabilities. An unrestricted current ratio of 2:00 is considered to be a strong short term position. Council's unrestricted current ratio as at 30 June 2012 means that the organisation has adequate unrestricted cash and internal reserves to satisfy its current obligations and illustrates Council's strong short-term financial position. It is important to note that the unrestricted current ratio does not reflect Council’s capacity to fund long term infrastructure needs nor the state of the infrastructure itself. Council needs to assess its infrastructure requirements and develop strategies to ensure the long-term viability (ability to provide services) of its assets.
Water and Sewer Fund Unrestricted Current Ratio
We note that the unrestricted current ratio for water and sewer activities may fluctuate significantly. Yearly fluctuations may result from the build up of internal reserves and the impact of debt levels and will continue to fluctuate in the future as further funds are collected and expended on infrastructure improvements.
Debt Service Ratio
This indicator assesses the degree to which revenues from continuing operations are committed to the repayment of debt.
Factors influencing a council’s debt service ratio include:
n The rate of new development in the Council area and the need to borrow to fund new infrastructure;
n Council’s debt policy;
n Interest rate movements and loan terms;
n Capital investment strategies and capital contributions policies;
n The level of cash reserves available to reduce the level of borrowings; and
n The state of Council’s infrastructure assets and the need to borrow to replace them.
12.98
10.76
13.12
1.62
0
5
10
15
2009 2010 2011 2012
Water FundUnrestricted Current Ratio
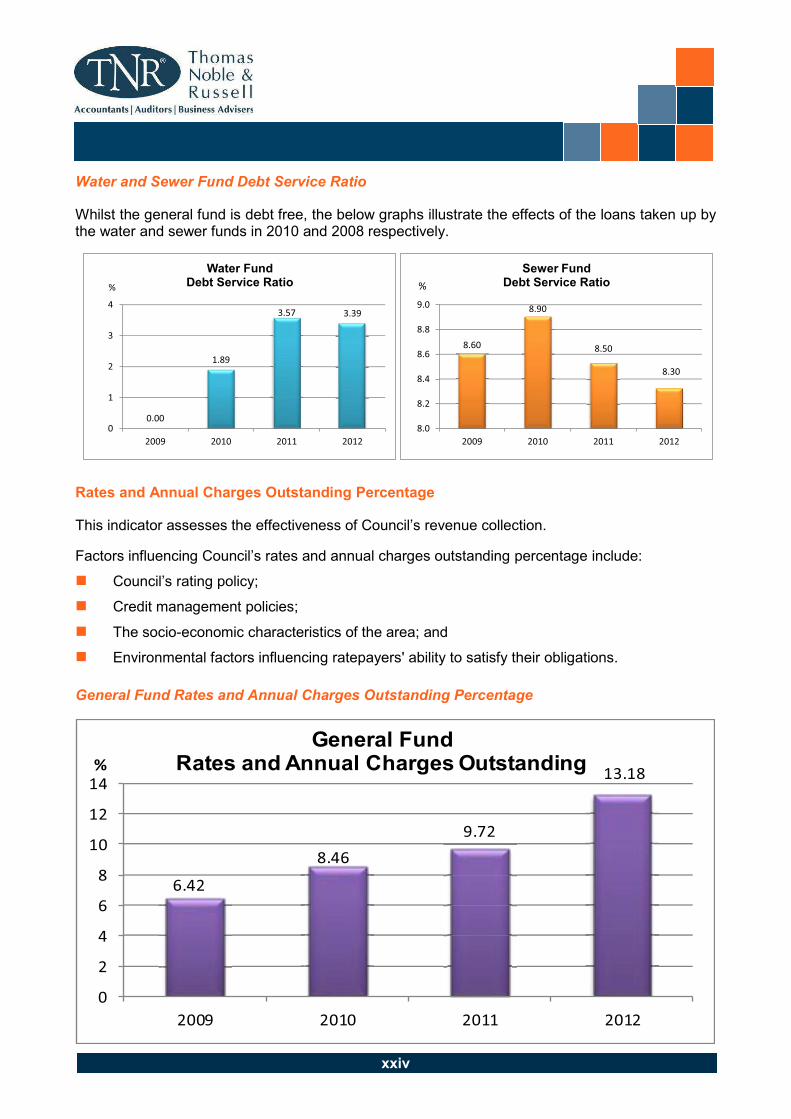
xxiv
Water and Sewer Fund Debt Service Ratio
Whilst the general fund is debt free, the below graphs illustrate the effects of the loans taken up by the water and sewer funds in 2010 and 2008 respectively.
Rates and Annual Charges Outstanding Percentage
This indicator assesses the effectiveness of Council’s revenue collection.
Factors influencing Council’s rates and annual charges outstanding percentage include:
n Council’s rating policy;
n Credit management policies;
n The socio-economic characteristics of the area; and
n Environmental factors influencing ratepayers' ability to satisfy their obligations.
General Fund Rates and Annual Charges Outstanding Percentage
0.00
1.89
3.57 3.39
0
1
2
3
4
2009 2010 2011 2012
%
Water Fund Debt Service Ratio
8.60
8.90
8.50
8.30
8.0
8.2
8.4
8.6
8.8
9.0
2009 2010 2011 2012
Sewer Fund Debt Service Ratio%
6.42
8.46
9.72
13.18
0
2
4
6
8
10
12
14
2009 2010 2011 2012
%
General Fund Rates and Annual Charges Outstanding

xxv
Council’s general fund rates and annual charges outstanding percentage has increased from 9.72% in 2011 to 13.18% in 2012. We recommend that Council review its collection procedures to determine whether this ratio can be reduced to more acceptable parameters.
Water and Sewer Fund Rates and Annual Charges Outstanding Percentage
The above graphs illustrate the rates and annual charges outstanding percentages for water and sewer funds. These percentages can often be influenced by the invoicing of charges at the end of the financial year.
Buildings and Infrastructure Renewals Ratio
The purpose of this ratio is to assess the rate at which building and infrastructure assets are being renewed against the rate at which they are depreciating. Renewals are defined as replacement of existing assets with equivalent capacity or performance as opposed to the acquisition of new assets.
The consolidated building and infrastructure renewals ratio has increased from 53.00% to 87.01%.
This ratio should also be considered in conjunction with the level of new asset additions.
6. INTERNAL CONTROL ENVIRONMENT
No significant breakdowns of internal control were encountered during the course of our audit nor did we become aware of the existence of items comprising material error, sufficient to cause us to issue a modified audit opinion. Subject to the foregoing comments the books of account and records of the Council were maintained in good order and condition and the information and explanations required during the course of our work were readily supplied by the General Manager and his staff. Yours faithfully THOMAS NOBLE & RUSSELL
G W DWYER (Partner) Registered Company Auditor
26.25
27.64
14.65
25.12
0
5
10
15
20
25
30
2009 2010 2011 2012
Water Fund Rates and Annual Charges Outstanding
%
10.45
13.38 12.60
19.69
0
5
10
15
20
25
2009 2010 2011 2012
Sewer Fund Rates and Annual Charges Outstanding
%

�������������� ������ � ��������������������������������������������� ���!�"!
����������������� ������

���������
��� �������
������������������������������������������ ������������!������"�"�#��$��������
��������
��������������� ����� �������������
��������������� ���������������������
%���������������������&����������!�'��������(���)��!%�����������������������*���+��'��������(���)��!%���������������������� ���'��������(���)�����
%�'�������� �������&����������!�'��������(���)��!%�'�������� ���������*���+��'��������(���)��!%�'�������� �������� ���'��������(���)�����
���� ����� ����������������� ��������������������
��� �!�� �"��#�� ��
$��%�� �!
, ����������������������������������������� �)��-�����������"������ ������-!�-�� �����������"�� ��.�)��������
��������)��������������������+�� ������/������������"�����������������������������!0
, ������������������������)�����������!����-���"����� ���������������1��)������!��+�����"1�-��*�����������2��������
��������+���������3��������4������������!�-��*�������)������"���-����������������������0
���������!4�� ���������������� ���+�)��������-���������4�* �� ���������*���� 4���������������4�� ���"��������
*�� �����������������)���")����+����)����� ���-�������������������������� ������-�����*���� ��0
�����������4�� ������������������������)�����������!�5���-������������+������������!����"������"�-������������)�����0
, ���������"��&�'�� ��������)���������������"�-!�� ��(����������'�����������������������-������������)������-���+
*����������!4���*���+�����)����4��-�������4�+������"���������"����������������"�&'�� ��������)������*�� ��������)��
����)���6����������� ����������� ����������!�"������"������'��������(���)��!�7"�����"��������+��!�������)�����80
�����������+�� ������������������������������������9����������������"�����+��!���-������������"�('��"�����"
����)�����4���������������&�'��"������������������������"�����"�&'�����!����������������-�����������"��+����:��/��)�����
��+������!������5�"�-��+��������������7* ����� ��-��������-����������������������-����*��+����������-!
�����������*�� �����������������80
&�('
��
;�%���
<
&�'
&��'
&���'
=
��+�
#
>
?�%�@
�
��+���


SPFS 2012
KYOGLE COUNCIL
Income Statement of Council's Water Supply Business Activity
page 3
Income Statement of Council's Water Supply Business Activity for the financial year ended 30 June 2012
$ '000
Income from continuing operations
Access charges
Actual Actual
2011 2012
511 419
Actual
2010
467 Access charges
User charges
Fees
Interest
Grants and contributions provided for non capital purposes
Profit from the sale of assets
Other income
Total income from continuing operations 1,025 952
-
-
-
1,040
14
27
443 444 499
511 419
11 12
-
2
49 27
11
- -
81
467
Total income from continuing operations
Expenses from continuing operations
Employee benefits and on-costs
Borrowing costs
Materials and contracts
Depreciation and impairment
Water purchase charges
Loss on sale of assets
110 143 210
14 24 24
1,025 952
550
188 215
31 45
59 4 4
184
542
1,040
585
32
Loss on sale of assets
Calculated taxation equivalents
Debt guarantee fee (if applicable)
Other expenses
Total expenses from continuing operations
Surplus (deficit) from Continuing Operations before capital amounts
Grants and contributions provided for capital purposes
(53)
70
- -
-
1,001
-
59 4 4
(152)
622 160
1,078
94
1,104
39
-
-
102 47
Grants and contributions provided for capital purposes
Surplus (deficit) from Continuing Operations after capital amounts
Surplus (deficit) from discontinued operations
Surplus (deficit) from ALL Operations before tax
less: Corporate Taxation Equivalent
SURPLUS (DEFICIT) AFTER TAX
-
661
649 41 8
-
-
622
8
160
41
41 8
94
(12)
661
- -
plus Opening Retained Profits
plus/less: Prior Period Adjustments
plus Adjustments for amounts unpaid:
- Taxation equivalent payments
- Debt guarantee fees
- Corporate taxation equivalent
less:
- Tax Equivalent Dividend paid
- -
-
7,911
-
- -
7,903
-
-
-
-
-
12
-
7,242
- Tax Equivalent Dividend paid
- Surplus dividend paidClosing Retained Profits
Return on Capital %
Subsidy from Council
Calculation of dividend payable:Surplus (deficit) after taxless: Capital grants and contributions (excluding developer contributions)
8
N/A
-0.3%
41
N/A
1
N/A
7,911 7,952
-1.5%
-
- -
0.63%
(621)
- 7,903
(156) 649
less: Capital grants and contributions (excluding developer contributions)
Surplus for dividend calculation purposesPotential Dividend calculated from surplus -
(148) 21 42 1
28 (621) (156)
-
page 3

SPFS 2012
KYOGLE COUNCIL
Income Statement of Council's Sewerage Business Activity
page 4
Income Statement of Council's Sewerage Business Activity for the financial year ended 30 June 2012
$ '000
Income from continuing operations
Access charges 830
Actual
2012 2010
Actual Actual
899 891
2011
Access charges
User charges
Liquid Trade Waste charges
Fees
Interest
Grants and contributions provided for non capital purposes
Profit from the sale of assets
Other income
26
9
-
-
28
830
15
177
- -
27
9
26
5
14
19
- -
37
17
101 118
899 891
Other income
Total income from continuing operations
Expenses from continuing operations
Employee benefits and on-costs
Borrowing costs
Materials and contracts
Depreciation and impairment
Loss on sale of assets
72
336
335
549
192
333
1,060
9
146
1,095
73
502
1,093
143
9 5
215
-
323
457
74
Loss on sale of assets
Calculated taxation equivalents
Debt guarantee fee (if applicable)
Other expenses
Total expenses from continuing operations
Surplus (deficit) from Continuing Operations before capital amounts
Grants and contributions provided for capital purposes
1,564 1,295
198
(469) (202)
-
3
-
52
335
-
192
57
-
48
-
1,048
-
-
12
2 Grants and contributions provided for capital purposes
Surplus (deficit) from Continuing Operations after capital amounts
Surplus (deficit) from discontinued operations
Surplus (deficit) from ALL Operations before tax
less: Corporate Taxation Equivalent (30%) [based on result before capital]
SURPLUS (DEFICIT) AFTER TAX (271)
(199)
- -
(199)
(199)
(271)
- -
(271)
198 3
-
14
(4)
10
2
14
plus Opening Retained Profits
plus/less: Prior Period Adjustments
plus Adjustments for amounts unpaid:
- Taxation equivalent payments
- Debt guarantee fees
- Corporate taxation equivalent
less:
- Tax Equivalent Dividend paid
4 - -
- -
-
9,246
-
-
9,445
-
-
-
-
9,431
-
- Tax Equivalent Dividend paid
- Surplus dividend paidClosing Retained Profits
Return on Capital %
Subsidy from Council
Calculation of dividend payable:Surplus (deficit) after taxless: Capital grants and contributions (excluding developer contributions) (3) (2)
(271)
N/A
9,445
10
-
-
-
- (199)
8,975
N/A
-0.76%-1.8%
N/A
9,246 -
0.52%
less: Capital grants and contributions (excluding developer contributions)
Surplus for dividend calculation purposesPotential Dividend calculated from surplus
(3) (2) (202)
-
- - - - 8
page 4

SPFS 2012
KYOGLE COUNCIL
Income Statement of Council's Other Business Activities
page 5
Income Statement of Council's Other Business Activities for the financial year ended 30 June 2012
$ '000
Category 2 Category 2
2012
Actual
2011
Actual Actual
2011 2012
Domestic Waste Quarries
Actual
Income from continuing operations
Access charges
User charges
Fees
Interest
Grants and contributions provided for non capital purposes
Profit from the sale of assets
-
-
40
-
-
6
33
-
-
699
-
-
460
-
515
-
-
-
-
800
-
-
-
- Profit from the sale of assets
Other income
Total income from continuing operations
Expenses from continuing operations
Employee benefits and on-costs
Borrowing costs
Materials and contracts
460
10 63 77
299 239 432
12
534
-
224
-
-
-
229
738
77
555
-
- -
800
-
33
Materials and contracts
Depreciation and impairment
Loss on sale of assets
Calculated taxation equivalents
Debt guarantee fee (if applicable)
Other expenses
Total expenses from continuing operations
Surplus (deficit) from Continuing Operations before capital amounts
- -
-
(90) 3
-
735
-
-
135 241
- -
- -
(105)
-
299 239 432
-
534
43
645
-
559
- -
325
59
-
38
Surplus (deficit) from Continuing Operations before capital amounts
Grants and contributions provided for capital purposes
Surplus (deficit) from Continuing Operations after capital amounts
Surplus (deficit) from discontinued operations
Surplus (deficit) from ALL Operations before tax
less: Corporate Taxation Equivalent (30%) [based on result before capital] (72)
241
(90)
-
(90)
-
(90)
- -
3
-
31
31
28
(1) (41)
135 241
135
-
241
-
135
-
less: Corporate Taxation Equivalent (30%) [based on result before capital]
SURPLUS (DEFICIT) AFTER TAX
plus Opening Retained Profits
plus/less: Prior Period Adjustments
plus Adjustments for amounts unpaid:
- Taxation equivalent payments
- Debt guarantee fees
169
-
(72)
-
-
-
-
597 838 (199)
(90) 95
(289)
-
- -
- -
-
30
(1) (41)
- Debt guarantee fees
- Corporate taxation equivalent
add:
- Subsidy Paid/Contribution To Operations
less:
- TER dividend paid
- Dividend paid
Closing Retained Profits 838 -
-
72
-
-
- -
973
1
-
41
- - -
-
(289) (258)
Return on Capital %
Subsidy from Council - -
45.3%27.2%7.9%
- -
-2.0%
page 5

SPFS 2012
KYOGLE COUNCIL
Income Statement of Council's Other Business Activities
page 6
Income Statement of Council's Other Business Activities for the financial year ended 30 June 2012
$ '000
Category 1
2012
Actual
Transport
2011
Actual
Income from continuing operations
Access charges
User charges
Fees
Interest
Grants and contributions provided for non capital purposes
Profit from the sale of assets
-
-
-
-
-
4,043
-
-
5,175
-
-
-
Profit from the sale of assets
Other income
Total income from continuing operations
Expenses from continuing operations
Employee benefits and on-costs
Borrowing costs
Materials and contracts
643
3,500
- -
-
-
713
5,175
-
-
4,043
3,142 Materials and contracts
Depreciation and impairment
Loss on sale of assets
Calculated taxation equivalents
Debt guarantee fee (if applicable)
Other expenses
Total expenses from continuing operations
Surplus (deficit) from Continuing Operations before capital amounts
-
-
1,032
3,855 4,143
-
-
-
188
-
-
3,500
-
-
-
3,142
Surplus (deficit) from Continuing Operations before capital amounts
Grants and contributions provided for capital purposes
Surplus (deficit) from Continuing Operations after capital amounts
Surplus (deficit) from discontinued operations
Surplus (deficit) from ALL Operations before tax
less: Corporate Taxation Equivalent (30%) [based on result before capital]
188
-
(56)
-
1,032 188
-
(310)
188
1,032
-
1,032
less: Corporate Taxation Equivalent (30%) [based on result before capital]
SURPLUS (DEFICIT) AFTER TAX
plus Opening Retained Profits
plus/less: Prior Period Adjustments
plus Adjustments for amounts unpaid:
- Taxation equivalent payments
- Debt guarantee fees
-
(56)
-
-
1,863
(310)
- -
132
2,500
722
- Debt guarantee fees
- Corporate taxation equivalent
add:
- Subsidy Paid/Contribution To Operations
less:
- TER dividend paid
- Dividend paid
Closing Retained Profits
(220)
2,468 2,500 (395)
-
-
- -
56 310
Return on Capital %
Subsidy from Council -
n/a n/a
-
page 6

���������
��� �������
��������������������������� ���!���""�#����������$���%��#�������&��'��������
������
������
��� ��������
�������(�������)��%������
*����%�+���
��������� ��������
�� ���� ��������
���!���!����!�,�"!�"�!�#,�"�������(��)��"-���
������ � ���� ��������
������������
�����������
��� �������������
��#�+���
����!����+��!��.����+�������
�!�%������
��������� �������������
�� ���� �������������
��#�+���
����!����+��!��.����+�������
�!�%������
�������� ���� �������������
�����������������
� /�$�� /�
������
*������(���!���.�
*�%���������!���!%��
���������)���#�����!���
0���!��#��)���#�����!���
//$�� 1��/
2����������������������
3,�45��������������
3,�45����������
&,6�7��������������
��,758��������
��,758������������
2����������������������
��,758��������
�,�58��������������
5,3����������������
��� !!������������ !�"# ��������������
��,&44������������
&������������������� �7������������������
$ %����������������� $$%�����������������
�&����
'����
�&����
'��'�
�'� '"������������
�7�������������������
4,67&��������������
�55�����������������
'(%�����������������
5,36���������������
'%%�����������������
8&8����������������� 568�����������������
$�"#���������������
6�4�����������������
2����������������������
2���������������������� 2����������������������
���������������������
77������������������� 7��������������������
%(�������������������"!'�����������������
���������������������
!#$�����������������
�85�����������������
2����������������������
3,�45����������
" �����������������
"�.��5

���������
��� �������
�����������������������������9�!�.�����������$���%��#�������&��'��������
������
������
��� ��������
�������(�������)��%������
*����%�+���
��������� ��������
�� ���� ��������
���!���!����!�,�"!�"�!�#,�"�������(��)��"-���
������ � ���� ��������
������������
�����������
��� �������������
��#�+���
����!����+��!��.����+�������
�!�%������
��������� �������������
�� ���� �������������
��#�+���
����!����+��!��.����+�������
�!�%������
�������� ���� �������������
�����������������
� /�$�� /�
������
*������(���!���.�
*�%���������!���!%��
���������)���#�����!���
0���!��#��)���#�����!���
//$�� 1��/
��,78������������� �5,�4�������������
�5,&5���������
�5,&5�������������
2����������������������
���'$��������������
$# ����������������� $(#�����������������
3,�78��������������
��,635��������
��,635��������
�&���� �&����
�,��8��������������
2����������������������
���� ��������������
��������������������� �3�������������������
2����������������������
7��������������������
%�������������������� ("�������������������
���"��������������� �� �!��������������
2����������������������2����������������������
''�(��������������
4,356��������������
387�����������������
2����������������������
��,8�������������� 4,��6��������������
��,635������������
37&�����������������
�65����������������� ��������������������
'����
43&�����������������
'��'�
�5,&5���������
'��#(������������� �%��!'������������
6���������������������6���������������������
�!�#��������������
77�������������������
"�.��4

���������
��� �������
������������������������������!����������$���%������������&��'��������
������
������
��� ��������
�������(�������)��%������
*����%�+���
��%����!���
��������� ��������
�� ���� ��������
���!���!����!�,�"!�"�!�#,�"�������(��)��"-���
�������� ���� ��������
������������
�����������
��� �������������
��#�+���
����!����+��!��.����+�������
�!�%������
��������� �������������
�� ���� �������������
�!�%������
�������� ���� �������������
�����������������
� /�$�� /�
������
*������(���!���.�
*�%���������!���!%��
���������)���#�����!���
0���!��#��)���#�����!���
//$�� 1��/
������������������
2�����������������
&�6������������
4&4������������35&������������
2�����������������
�"������������
������������������
�,�64������:�43;�������
��(�!���������
:�63;�����������
:�63;�������2�����������������
2�����������������
)'"$*����������� )'!$*�����������
2�����������������
��$"����������
��'$ ���������
2�����������������
��$"������������#%'���������
&��������������
�,�3&������
�,&4����������
�,�3&������
&��������������
<�-������ ����
$���������������
2�����������������
����.�!#��
�&����
�&&������������
1��!!���
����.�!#��
8��������������
'��'�
447������������
'����
2�����������������
�&����
'����
���"!���������
�� !'���������
�"������������
:�43;�����������
�,36����������
:�43;�������:�63;�������
45��������������
663������������
!!(������������
" #������������
2�����������������
�,&4&���������
��((����������
6&7������������
2�����������������
2�����������������
'!%������������
�,�64������
'!%������������
2�����������������
�45������������
������������������
��##"���������
2�����������������
�&����
2�����������������
2�����������������
2�����������������
""$������������
2�����������������
3���������������
�� ! �������������%���������
��'� ���������
2�����������������
�,��5���������
�3�������������2�����������������
'�(������������
2�����������������
�&����
'��'�
5&�������������� �3�������������
���%#���������'%!������������
2�����������������
�47������������
"�.��3

���������
��� �������
������������������������������!����������$���%������������&��'��������
������
������
��� ��������
�������(�������)��%������
*����%�+���
��������� ��������
�� ���� ��������
�������� ���� ��������
������������
�����������
��� �������������
��#�+���
����!����+��!��.����+�������
�!�%������
��������� �������������
�� ���� �������������
�������� ���� �������������
�����������������
� /�$�� /�
������
*������(���!���.�
*�%���������!���!%��
���������)���#�����!���
0���!��#��)���#�����!���
//$�� 1��/ �,6���������,784������
������������������
�,784���������
�,784������ �,6��������
������������������������������������
������������������
'�"�����������
�,6�����������
2�����������������
'�#(!���������
2�����������������
2�����������������
������������������������������������
'�#(!���������
2����������������� 2�����������������
'�"�����������
2����������������� 2�����������������
2����������������� 2�����������������
������������������ ������������������
�,3�7���������
&5�������������
'�"�����������
�,�&����������
687������������
����.�!#��
�&�����&����
'��'� '����
/!���"�!�
'�#(!���������
2�����������������
"�.����

���������
��� �������
������������������������������������������ ������������!������"�"�#��$��������
������������� ����������������!��%�� ����������������������
&������
������!������%���������'��������%���������
(����������!�)��������)�������������*���%������"������������+���������
��,���%��)��������)�������������*���%������"������������+��������� �-�.��/�
���� ��%�
�
�
���.��0
�1�.��2
��%����

SPFS 2012_
Kyogle Council
Notes to the Special Purpose Financial Statementsfor the financial year ended 30 June 2012
Note 1. Significant Accounting Policies�
page 12
These financial statements are a Special Purpose Financial Statements (SPFS) prepared for use by Council and the Division of Local Government.
For the purposes of these statements, the Council’s business activities (reported herein) are not reporting entities.
These special purpose financial statements, unless otherwise stated, have been prepared in accordance with;
� applicable Australian Accounting Standards,
� other authoritative pronouncements of the Australian Accounting Standards Board,
� Australian Accounting Interpretations,
� the Local Government Act and Regulation, and
� the Local Government Code of Accounting Practice and Financial Reporting.
The statements are also prepared on an accruals basis. They are based on historic costs and do not take into account changing money values nor current values of non-current assets (except where specifically stated).
Certain taxes and other costs (appropriately described) have been imputed for the purposes of the National Competition Policy.
National Competition Policy
Council has adopted the principle of ‘competitive neutrality’ to its business activities as part of the national competition policy which is being applied throughout Australia at all levels of government.
The framework for its application is set out in the June 1996 Government Policy statement on the “Application of National Competition Policy to Local Government”.
The “Pricing & Costing for Council Businesses A Guide to Competitive Neutrality” issued by the Division of Local Government in July 1997 has also been adopted.
The pricing & costing guidelines outline the process for identifying and allocating costs to activities and provide a standard of disclosure requirements.
These disclosures are reflected in Council’s pricing and/or financial reporting systems and include taxation equivalents; council subsidies; return on investments (rate of return); and dividends paid.
Declared Business Activities
In accordance with Pricing & Costing for Council Businesses - A Guide to Competitive Neutrality, Council has declared that the following are to be considered as business activities:
Category 1
(where gross operating turnover is over $2 million)
a. Transport Contract Road Construction and Maintenance
Category 2
(where gross operating turnover is less than $2 million)
a. Water Water Supply
b. Sewer Sewerage Services
c. Domestic Waste Domestic Waste Management
d. Quarries Quarrying Operations
Monetary Amounts
Amounts shown in the financial statements are in Australian currency and rounded to the nearest one thousand dollars, with the exception of some figures disclosed in Note 2 (Water Supply Best Practice Management Disclosures) and Note 3 (Sewerage Best Practice Management Disclosures).
As required by the NSW Office of Water (Department of Environment, Climate Change and Water) some amounts shown in Notes 2 and Note 3 are disclosed in whole dollars.

SPFS 2012_
Kyogle Council
Notes to the Special Purpose Financial Statementsfor the financial year ended 30 June 2012
Note 1. Significant Accounting Policies (continued)
�
�
page 13
(i) Taxation Equivalent Charges
Council is liable to pay various taxes and financial duties in undertaking its business activities. Where this is the case, they are disclosed in these statements as a cost of operations just like all other costs.
However, where Council is exempt from paying taxes which are generally paid by private sector businesses (such as income tax), equivalent tax payments have been applied to all Council nominated business activities and are reflected in these financial statements.
For the purposes of disclosing comparative information relevant to the private sector equivalent, the following taxation equivalents have been applied to all council nominated business activities (this does not include council’s non-business activities):
Notional Rate Applied %
Corporate Income Tax Rate – 30%
Land Tax – The first $396,000 of combined land values attracts 0%. From $396,001 to $2,421,000 the rate is 1.6% + $100. For the remaining combined land value that exceeds $2,421,000, a premium marginal rate of 2.0% applies.
Payroll Tax – 5.45% on the value of taxable salaries and wages in excess of $678,000.
In accordance with the guidelines for Best Practice Management of Water Supply and Sewerage, a payment for the amount calculated as the annual tax equivalent charges (excluding income tax) must be paid from Water Supply and Sewerage Business activities.
The payment of taxation equivalent charges, referred in the Best Practice Management of Water Supply and Sewerage Guides to as a “Dividend for Taxation equivalent”, may be applied for any purpose allowed under the Local Government Act, 1993.
Achievement of substantial compliance against the guidelines for Best Practice Management of Water Supply and Sewerage is not a prerequisite for the payment of the tax equivalent charges, however the payment must not exceed $3 per assessment.
Income Tax
An income tax equivalent has been applied on the profits of the business.
Whilst income tax is not a specific cost for the purpose of pricing a good or service, it needs to be taken into account of in terms of assessing the rate of return required on capital invested.
Accordingly, the return on capital invested is set at a pre-tax level (gain/(loss) from ordinary activities before capital amounts) as would be applied by a private sector competitor – that is, it should include a provision equivalent to the corporate income tax rate, currently 30%.
Income Tax is only applied where a positive gain/(loss) from ordinary activities before capitalamounts has been achieved.
Since this taxation equivalent is notional - that is, it is payable to the “Council” as the owner of business operations, it represents an internal payment and has no effect on the operations of the council. Accordingly, there is no need for disclosure of internal charges in Council's GPFS.
The rate applied of 30% is the equivalent company tax rate prevalent as at balance date. No adjustments have been made for variations that have occurred during the year.
Local Government Rates & Charges
A calculation of the equivalent rates and charges payable on all Category 1 businesses has been applied to all land assets owned or exclusively used by the business activity.
Loan & Debt Guarantee Fees
The debt guarantee fee is designed to ensure that council business activities face “true” commercial borrowing costs in line with private sector competitors.
In order to calculate a debt guarantee fee, council has determined what the differential borrowing rate

SPFS 2012_
Kyogle Council
Notes to the Special Purpose Financial Statementsfor the financial year ended 30 June 2012
Note 1. Significant Accounting Policies (continued)
�
�
page 14
would have been between the commercial rate and the council’s borrowing rate for its business activities.
(ii) Subsidies
Government policy requires that subsidies provided to customers and the funding of those subsidies must be explicitly disclosed.
Subsidies occur where council provides services on a less than cost recovery basis. This option is exercised on a range of services in order for council to meet its community service obligations.
Accordingly, Subsidies disclosed (in relation to National Competition Policy) represents the difference between revenue generated from ‘rate of return’ pricing and revenue generated from prices set by the council in any given financial year.
The overall effect of subsidies is contained within the Income Statement of Business Activities.
(iii) Return on Investments (Rate of Return)
The Policy statement requires that councils with Category 1 businesses “would be expected to generate a return on capital funds employed that is comparable to rates of return for private businesses operating in a similar field”.
Such funds are subsequently available for meeting commitments or financing future investment strategies.
The Rate of Return on Capital is calculated as follows:
Operating Result before Capital Income + Interest Expense
Written Down Value of I,PP&E as at 30 June
As a minimum, business activities should generate a return equal to the Commonwealth 10 year bond rate which is 5.21% at 30/6/12.
The actual rate of return achieved by each business activity is disclosed at the foot of each respective Income Statement.
(iv) Dividends
Council is not required to pay dividends to either itself as owner of a range of businesses or to any external entities.
Local Government Water Supply and Sewerage Businesses are permitted to pay an annual dividend from its water supply or sewerage business surplus.
The dividend, calculated and approved in accordance with the Best Practice Management Guidelines, must not exceed either (i) 50% of this surplus in any one year, or (ii) the number of water supply or sewerage assessments at 30 June 2012 multiplied by $30 (less the payment for tax equivalent charges, not exceeding $3 per assessment).
In accordance with the guidelines for Best Practice Management of Water Supply and Sewerage, a Dividend Payment form, Statement of Compliance, Unqualified Independent Financial Audit Report and Compliance Audit Report are required to be submitted to the NSW Office of Water prior to making the dividend and only after it has approved its payment.

���������
��� �������
�������������������������������������������������� ������� ���������!������"�"�#��$��������
������%�&����������!�'���������������������'�������������(���)������"������������*���������
��������������� ���������������������������������������� �����������������
������������������ �!�����"�#�$%�&�'������(����������)�'�������������������*������������+�!�� �����'������"�����$%�&�'������,
���������"�+�,� *��-������
���� ����������������������"�.!�/#0����������
1���������!�.��� ���+�,� *��-�������(��������"�������������,
1��������������!����"� ���+�,� *��-������
-����'������"�����+��2�3�� ���������.� ����4�-�"��"�(��������������������������� �.���� ��������/���0�����"����������++�!�����������0��)��������,
��%�� ����������������������"�.!�/#�0����������5��������,��*��-���������)��0����������
��������-����������.� ����4�-�"��"�� �������#�!��������#��$��������5�����������������-��"�-�"��"�����"� ���������!��������#��$���������6�#��$��������
-1�-���+�� -1�����+�� -1�1���+��
-1�����'����� -1�1���'�����
(�,�����"�-�"��"� ������������(�������"����2�������������������'�,
4�-�"��"��������!����"� ������������(��"���������"�����&�����+��%��'������+�!������������,
3����&������������"���4���������(#��������0�����"���� ��+�!�����"���5��'������"�����+��52������ ������������������������56��5,
������������ �������)���'�������������7�����"��)���������������8
����������9���-��!5�:���������)�� ��������������.��"���(��"���7���-�������#����������+�0��--��"�� ��.���� ��������)��������,
;������!��)�����)���(7���-�������#������,
;�4���:���������������4�-�����������)���(7���-�������#������,
;�� �4����&�������������5������!��)�����)���(7���-�0�����#������,
����"�&�����������-��������"�4����"�(���)����������������"
����"�4���)���(���)����������������"
������������ ��������9�������)��������!��8���+��������� �!����
�%�����)����"�&������!����(���)������ -��������
.%������������"���������������)����"�&������!����(���)������������)!
�
��'�
�'��
�
;����������������������
�0�
-1�-�
��5���������������
2<5=>�������������
7==5=��8�����������
25<=>��������������
;����������������������
��'� �
�
�
����
�
�
;�������������������
?�5������������ 7�?@5���8������
�
�
;�������������������
�@5#�����������
��'�
�����
���
��'�
�����
�����
���
����
����
�'�
���
��)���2

���������
��� �������
�������������������������������������������������� ������� ���������!������"�"�#��$��������
������%�&����������!�'���������������������'�������������(���)������"������������*���������� 7��������"8
��������������� ���������������������������������������� �����������������
9��������������7�������'���9�7��:��������� ��"�������7���������
+�����9�-�����7&����8#�����7��������3��%�)������"���� ����&���������"���������������%�7��������7�������;�
9�-����� ����9���"����������)������)���7&����87�����"���������������*��0��� ��0�����4���$��11���'������!�� �����"
(7�����"���������������*��0��� ��0�����4���<�7�����"��������������
�������� ��0�����4��,
&�������4�:��9����������������� ���,�"�1������7&����8��������������������������"��!�������������=>�
�������)������7(18�7&����8/���0������$+�����������<��+����������?�/������������$+��������-�
�������� ,���"������7&����8��&���������"�"�$�������������4�
��������9����9����� �9������7&����8(#�����7��������3��%�7��������7�������;��%�)������"�����&���������"���������������%
�+������0��������9�7�:����%���������������+������������3�,�$��11���'������!
(��������������������������"��!�������������=>��<� �����?��&�+������33��,
��������&��A���������7&����8)������"���� ����&���������"��������������
�����B �� 9� �����������:�7�)%�:��8��� ��������������.����:������������������"�������%�#�6�?��
�������C��1��������������������������%
-� +����&����� ����������"������������.���"���������������������� �������������:��A
D��".��A� �����.������ ��������9�������)���"��������6�4� ��������%
9�7�:-4 ;����������������������/C���
9�7�:��
9�7�:�> 3
9�7�:�= /C���
�%>�3
=@@�����������������
@>������������������/C���
/C���9�7�:;
-1�-�
�5��<��������������
9�7�:= 3
��5#@@������������
/C���
?�%>>3
9�7�:�
��)���>

���������
��� �������
�������������������������������������������������� ������� ���������!������"�"�#��$��������
�����#%���&���'��(���������������������(�������������)���'������"������������*���������
��������������� ���������������������������������������� �����������������
������������������ �!�����"�#�$%�&�'������(����������)�'�������������������*������������+�!�� �����'������"�����$%�&�'������,
���������"�+�,� *��-������
���� ����������������������"�.!�/#0����������
1���������!�.��� ���+�,� *��-�������(��������"�������������,
1��������������!����"� ���+�,� *��-������
-����'������"�����+��
2�3�� ���������.� ����4�-�"��"�(��������������������������� �.���� ��������/���0�����"����������++�!�����������0��)��������,
��%�� �������������,�5/#���������,��*��-����������'�����������������6
��������-����������.� ����"�-�"��"�� �������#�!��������#��$��������7�����������������-��"�-�"��"�����"� ���������!��������#��$���������8�#��$��������
-1�-���+�� -1�����+�� -1�1���+��
-1�����'����� -1�1���'�����
)�,�����"�-�"��"� ������������(�������"����2�������������������'�,
4�-�"��"��������!����"� ������������(��"���������"�����&�����+��%��'������+�!������������,
3����&������������"���4��������� �
(#��������0�����"���� ��+�!�����"���5��'������"�����+��52������ ������������������������56��5,
������������ �������'���(�������������5�����"��'���������������6 �
������'�&���� ��������9����-��!7�&���������'�� ��������������.��"��� �(��"���7���-�������#����������+�0��--��"�� ��.���� ��������)��������,
�����!��'�����'�� :���"�������(7���-�������#������, �
����:���"�������(7���-�������#������, �
+��"��;�����(7���-�������#������, �
4���&���������������4�-�����������'���(7���-�������#������, �
��*��"�+��"��;�����1����-����8������!�(7���-�"�����#������, �
������������ ��������:�������'��������!��8���+��������� �!���� �
�%�����'����"�;������!����)���'������ -�������� �
.%������������"���������������'����"�;������!����)���'������������'! �
9����������������������
27#<=��������������
�
�
�
9����������������������
�
-1�-�
�
�0�
�
9����������������������
�
�
5>2?7<��6���������
�
�
���
��'�
�����
����
�����
5�=�7���6������
���
���� 2#7<=�������������
��7>�����������
��'�
���
��'�
9�������������������
5�??7���6������
9�������������������
�'�
�����
���
����
���
���
��'���=

���������
��� �������
�������������������������������������������������� ������� ���������!������"�"�#��$��������
�����#%���&���'��(���������������������(�������������)���'������"������������*���������� 5��������"6
��������������� ���������������������������������������� �����������������
9��������������7�������'���9�7��:��������� ��"�������7���������
+�����:�-�����5��&���'�6#�����7��������4��%�)������"�����&���������"�����������-���%�7��������7��������1�
;�������4�&��:����������������� ���,�"�1������5��&���'�6��������������������������"��!�������������4;�
�������'������5��&���'�6/���0������$+�����������<��+����������=�/������������$+��������-�
�������� ,���"������5��&���'�6��&���������"�:�$�������������>�
��������:����:����� �:������5��&���'�6(#�����7��������4��%�7��������7��������1��%�)������"�����&���������"�����������-��
%��+������0�������9�7�:�-��%���������������+������������3�,�$��11���'������!
(�������������������������������������"��!�������������4;��<� �����=��&�+������34��,
��������;��@���������5��&���'�6)������"���� ����&���������"����������-��
9��������������7�������'���9�7��:��������� ��"�������7���������������=����������������
+������������5;�����8���&���'�6#�����7��������3�<���4��<�)���?�����������+������"�����������4�<���8�
������)������"�����&���������"��������������<���-���%�7��������7�������@�<���1�
:�-����� ������������!����-����.��'�������5;�����8���&���'�6�����!����'��������0��������9�7�:-8��$��11���'������!�#�����7������9�7�:3�
�������� ,���"������5;�����8���&���'�6��&���������"�:�$�������������A�<���>�
��������:����:����� �:������5;�����8���&���'�6(#�����7��������3�<���4��%�7��������7�������@�<���1��%�)������"�����&���������"�������
������<���-���%��+������0�������9�7�:���<�9�7�:�-��%���������������+������������3�<��3�,�$��11
��'������!�(���������������+��������������"�"�$�����������9�7�:@�<�9�7�:�1�
<� �����=��&�+������33��<��34��,
4�-�"��"�5;�����8���&���'�6��'������+����"�����+����-�'���"�9����-�<�-�'���"�9����3�
4�-�"��"���!����:�����5;�����8���&���'�6��'�������9�7�:-1��$��11���'������!�9��� ��"����"������$��9�7�:-4�
/A���
9����������������������
��7><�������������
�7�<<��������������
�%2�3
B�������������������
22������������������
-1�-�
9�7�:3 /A��� �7�><��������������
9�7�:; 3 �%2>3
9�7�:�@
9�7�:-�
9�7�:-1
3
3
9����������������������/A���
�%��3
�%2>3
�7#>���������������9�7�:�A /A���
9�7�:->
9�7�:�;
9�7�:�8 /A���
3
/A���
9�7�:-
9�7�:�1
9�7�:�-
/A���
/A���
��'���B

���������
��� �������
�������������������������������������������������� ������� ���������!������"�"�#��$��������
�����#%���&���'��(���������������������(�������������)���'������"������������*���������� 5��������"6
��������������� ���������������������������������������� �����������������
9��������������7�������'���9�7��:��������� ��"�������7���������������=����������������
����4�.����� *���!�5;�����8���&���'�6�'�����"����3A�<��3>��<�.�������0����3;�<��3@��%���� �=�7�'����������31�<��3��
$��11���'������!�(#��������������38�<��3A��%�#�������������������41�<��4��,
�����������-���5;�����8���&���'�6������0����"����7��������=�#�$���.7#����'������!�9���7�������
������0����"����7��������=�#�$���.7#�B
�+������0����������8��<���A���<�7���������$+�������4��<��4���%�7��������7�������@�<���1�
%�)���?�����������+������"�����������4�<���8��<�/�������������$+��������4��<��4��<��4��<��4��
9���7�������B
7���������$+�������4��<��4���%�7��������7�������@�<���1�
������� ���1 ����+�,�5;�����8���&���'�6��+�����"������'����������8��<���A���%�#�$��&�'�������+�����9����-%���'��<�9����3%���'��
��������!����-����.��'�������5;�����8���&���'�6)������"��� �����������������������<���-��
�����C �� :� �����������&�5�'%����6��� ��������������.����&������������������"�������%�2�8�<��
�������A��1��������������������������%
-� +����;����� ����������"������������.���"���������������������� �������������&��@�D��".��@
�����.������ ��������:�������'���"��������8�4� ��������%
9�7�:-8 /A���
9�7�:-4
9�7�:-3
9�7�:-- 3
2��������������������
#���������������������
5�#�6����������������
<?�������������������
/A���
�=B�����������������
9�%B=3
-1�-�
��'���?

31 Keen Street (PO Box 106) | Email: [email protected] | Website: www.tnr.com.au Lismore NSW 2480 | Phone: Business Services +61 (0)2 6621 8544 | Facsimile: +61 (0)2 6621 9035 Audit & Assurance +61 (0)2 6626 3000
Liability limited by a scheme approved under the Professional Standards Legislation.
i
KYOGLE COUNCIL SPECIAL PURPOSE FINANCIAL STATEMENTS
INDEPENDENT AUDIT REPORT Report on the Financial Statements We have audited the accompanying financial statements, being special purpose financial statements, of Kyogle Council (the Council), which comprises the balance sheet as at 30 June 2012, the income statement for the year then ended, notes comprising a summary of significant accounting policies and other explanatory information and the statement by Councillors’ and Management. Councils’ Responsibility for the Financial Statements The Council is responsible for the preparation of the financial statements and has determined that the basis of preparation described in Note 1 to the financial statements is appropriate to meet the requirements of the Local Government Act 1993 and meet the needs of the Division of Local Government. The Council’s responsibility also includes such internal control as the Council determines is necessary to enable the preparation of financial statements that are free from material misstatement, whether due to fraud or error. Auditor’s Responsibility Our responsibility is to express an opinion on the financial statements based on our audit. We conducted our audit in accordance with Australian Auditing Standards. Those standards require that we comply with relevant ethical requirements relating to audit engagements and plan and perform the audit to obtain reasonable assurance whether the financial statements are free from material misstatement. An audit involves performing procedures to obtain audit evidence about the amounts and disclosures in the financial statements. The procedures selected depend on the auditor’s judgement, including the assessment of the risks of material misstatement of the financial statements, whether due to fraud or error. In making those risk assessments, the auditor considers internal control relevant to the Council’s preparation of the financial statements that gives a true and fair view in order to design audit procedures that are appropriate in the circumstances, but not for the purpose of expressing an opinion on the effectiveness of the Council’s internal control.
An audit also includes evaluating the appropriateness of accounting policies used and the reasonableness of accounting estimates made by Council, as well as evaluating the overall presentation of the financial statements. Our audit responsibility does not extend to the best practice management disclosures in note 2 and note 3, and accordingly, we do not express an opinion on such. In addition, our audit did not include an analysis of the prudence of business decisions made by Council or management. We believe that the audit evidence we have obtained is sufficient and appropriate to provide a basis for our audit opinion.

ii
Independence In conducting our audit, we have complied with the independence requirements of the Australian professional accounting bodies. Audit Opinion
In our opinion, the special purpose financial statements of Kyogle Council:
a) Have been prepared in accordance with the requirements of those applicable Australian Accounting Standards detailed in Note 1 and the Local Government Code of Accounting Practice and Financial Reporting;
i. Are consistent with the Council’s accounting records;
ii. Present fairly, in all material respects, the financial position of Council’s nominated Business Activities as at 30 June 2012 and the results of their operations for the year then ended;
b) All information relevant to the conduct of the audit has been obtained; and
c) There are no material deficiencies in the accounting records or financial statements that we have become aware of in the course of the audit.
Basis of Accounting Without modifying our opinion, we draw attention to Note 1 to the financial statements, which describe the basis of accounting. The financial statements have been prepared for the purpose of fulfilling the financial reporting requirements of the Division of Local Government. As a result, the financial statements may not be suitable for another purpose. Matters Relating to the Electronic Presentation of the Audited Financial Statements This auditor’s report relates to the special purpose financial statements of Kyogle Council for the year ended 30 June 2012 included on Council’s website. The Council is responsible for the integrity of the website. We have not been engaged to report on the integrity of this website. The auditor’s report refers only to the financial statements identified above. It does not provide an opinion on any other information which may have been hyperlinked to/from the financial statements. If users of the financial statements are concerned with the inherent risks arising from publication on a website, they are advised to refer to the hard copy of the audited financial statements to confirm the information contained in this website version of the financial statements. THOMAS NOBLE & RUSSELL CHARTERED ACCOUNTANTS G W DWYER (Partner) Registered Company Auditor
Dated at Lismore this 31st day of October 2012.

KYOGLE COUNCIL SPECIAL SCHEDULES for the year ended 30 June 2012
Gateway to the Rainforests

Special Schedules 2012
KYOGLE COUNCIL
Special Schedules for the financial year ended 30 June 2012
Contents
Special Schedules1
Net Cost of Services
Statement of Long Term Debt (all purposes)
Statement of Internal Loans (Sect. 410(3) LGA 1993)
Water Supply - Income Statement
Water Supply - Balance Sheet
Sewerage Service - Income Statement
Sewerage Service - Balance Sheet
- Notes to Special Schedules No. 3 & 5
Condition of Public Works
Financial Projections
1 Special Purpose Schedules are not audited.
Background
These Special Schedules have been designed to meet the requirements of special purpose users such as;
the NSW Grants Commission
the Australian Bureau of Statistics (ABS),
the NSW Office of Water,
the Department of Environment, Climate Change and Water, and
the Division of Local Government (DLG).
The financial data is collected for various uses including;
the allocation of Financial Assistance Grants,
the incorporation of Local Government financial figures in national statistics,
the monitoring of loan approvals,
the allocation of borrowing rights, and
the monitoring of the financial activities of specific services.
(ii)
�
�
�
�
�
- Special Schedule No. 6
20
17 - 19- Special Schedule No. 7
16
15
�
�
- Special Schedule No. 8
�
(i)
�
�
- Special Schedule No. 5 11 - 14
Page
2 - 3
4
6 - 9
- Special Schedule No. 1
- Special Schedule No. 2(a)
5
- Special Schedule No. 4
- Special Schedule No. 2(b)
- Special Schedule No. 3
10
page 1

Special Schedules 2012
KYOGLE COUNCIL
Special Schedule No. 1 - Net Cost of Services for the financial year ended 30 June 2012
$'000
Governance
Administration
Public Order and Safety
Beach Control
Enforcement of Local Govt. Regulations
Animal Control
Other
Total Public Order & Safety
Health
Environment
Noxious Plants and Insect/Vermin Control
Other Environmental Protection
Solid Waste Management
Street Cleaning
Drainage
Stormwater Management
Total Environment
Community Services and Education
Administration & Education
Social Protection (Welfare)
Aged Persons and Disabled
Children's Services
Total Community Services & Education
Housing and Community Amenities
Public Cemeteries
Public Conveniences
Street Lighting
Town Planning
Other Community Amenities
Total Housing and Community Amenities
Water Supplies
Sewerage Services
Expenses from.
Continuing.
Operations. Non Capital.
-
-
-
122
Capital.
Income from
continuing operations
-
132
-
-
1,308
(108)
1,430
-
(126) 3
-
-
-
- -
-
103
20
-
1,079
31
1,095 1,564 198
-
-
(55)
(34)
(246)
(73)
-
-
102
236
1,024
2,150
328
101
- -
(564)
- (48)
3
180
131
-
459
Function or Activity
-
Fire Service Levy, Fire Protection,
Emergency Services
-
-
104
349
Net Cost.
of Services.
-
-
(451)
1,050
928
-
147 - - (147)
(113) -
-
(2,049)
-
18
101
-
123
34
-
-
95
-
-
644
157
-
371
1,384
1,856
-
-
1,354
-
1,299
-
-
20
-
20
40
(408)
(83)
-
123
-
20
-
(271)
(83)
(101)
(21)
-
-
55
-
-
-
page 2

Special Schedules 2012
KYOGLE COUNCIL
Special Schedule No. 1 - Net Cost of Services (continued) for the financial year ended 30 June 2012
$'000
Recreation and Culture
Public Libraries
Museums
Art Galleries
Community Centres and Halls
Performing Arts Venues
Other Performing Arts
Other Cultural Services
Sporting Grounds and Venues
Swimming Pools
Parks & Gardens (Lakes)
Other Sport and Recreation
Total Recreation and Culture
Fuel & Energy
Agriculture
Mining, Manufacturing and Construction
Building Control
OtherMining,Manufacturing&Construction
Total Mining, Manufacturing and Const.
Transport and Communication
Urban Roads (UR) - Local
Urban Roads - Regional
Sealed Rural Roads (SRR) - Local
Sealed Rural Roads (SRR) - Regional
Unsealed Rural Roads (URR) - Local
Unsealed Rural Roads (URR) - Regional
Bridges on UR - Local
Bridges on SRR - Local
Bridges on URR - Local
Bridges on Regional Roads
Parking Areas
Footpaths
Aerodromes
Other Transport & Communication
Total Transport and Communication
Economic Affairs
Camping Areas & Caravan Parks
Other Economic Affairs
Total Economic Affairs
Totals – Functions
General Purpose Revenues(2)
Share of interests - joint ventures &
associates using the equity method
NET OPERATING RESULT (1)
(1) As reported in the Income Statement | (2) Includes: Rates & Annual Charges (incl. Ex Gratia, excl. Water & Sewer), Non Capital General
Purpose Grants & Interest on Investments (excl. Ext. Restricted Assets)
Income from
continuing operations
-
- -
85
41
4
27,525
-
16,675 7,653
117
117
22,546
6
- -
10,282
27,525
6
-
12,264
-
-
4,582
-
-
-
-
-
-
-
4,208
-
3,070
-
- -
-
-
- -
2,878
Function or Activity
495
-
-
1,394
-
460 -
-
-
-
-
-
2,496
-
-
-
-
325
420
-
-
34 2,140
- -
180
- -
-
391
66
- -
5,112 2,050
65
-
Non Capital.
-
Expenses from.
Continuing.
Operations.
588
-
625
-
32
-
-
1,380
2,935
-
-
642 15
2,420
35
-
520
-
(540)
-
-
-
(1,926)
32 18
-
Capital.
-
2
-
-
544
- -
4,582
(496)
(2,935)
-
-
(397)
-
(10,679)
(111)
-
(6,144)
1,138
(111)
-
-
-
-
-
10,282
345
-
-
(304)
-
517
-
(61)
104
-
(483)
-
Net Cost.
of Services.
(2,076)
(31)
-
135
767
(2,542)
-
-
(538)
page 3

KYOGLE COUNCIL
Special Schedule No. 2(a) - Statement of Long Term Debt (all purpose) for the financial year ended 30 June 2012
$'000
Notes: Excludes (i) Internal Loans & (ii) Principal Inflows/Outflows relating to Loan Re-Financing.
This Schedule is prepared using the face value of debt obligations, rather than fair value (which are reported in the GPFS).
page 4
Total Long Term Debt - -
Total Debt
-
1,270
-
- 29 -
-
Deferred Payments
-
-
29
-
1,241
-
-
31
-
1,241
- - -
1,210
-
96 -
-
-
Government Advances -
Finance Leases -
-
-
-
29 1,241 Total Loans
-
1,270
Other
Other Long Term Debt
Ratepayers Advances - - -
- - - 29
29
-
Treasury Corporation
- -
Public Subscription - -
- - -
Financial Institutions 29 1,241 1,270
Other State Government - - -
Specia
l Schedule
s 2
012
Transfers
to Sinking
Funds
Principal outstandingInterest
applicable
for Year TotalNon
Current
at the end of the year
-
-
-
- -
-
- -
1,241
-
31 1,210 1,241
- -
- -
Debt redemption
during the year
From
Revenue
Sinking
Funds
31
-
96
96
-
1,210
-
Principal outstanding New
Loans
raised
during
the year
at beginning of the year
Classification of DebtCurrent
Non
CurrentTotal
Loans (by Source)
Commonwealth Government
Current
- - -

KYOGLE COUNCIL
Special Schedule No. 2(b) - Statement of Internal Loans [Section 410(3) LGA 1993] for the financial year ended 30 June 2012
$'000
Note: The summary of Internal Loans (above) represents the total of Council's Internal Loans categorised according to the borrower.
page 5
Summary of Internal Loans
Details of Individual Internal Loans
Principal Outstanding
(Principal & Interest) at end of year
Sewer
Total repaid during the year Amount originally raised
Other
Borrower (by purpose)
General
Water
Domestic Waste Management
Specia
l Schedule
s 2
012
Amount Principal
Term
-
Totals - - -
Gas
Outstanding
at end of year
Date of
Borrower Lender Dates of
(Princ. & Int.)
Total repaid
during year
Maturity Interest raised
Rate of Originally
(by purpose) (by purpose) Approval (years)
Date RaisedMinister's
- - Totals

Special Schedules 2012
KYOGLE COUNCIL
Special Schedule No. 3 - Water Supply Income Statement Includes ALL INTERNAL TRANSACTIONS, ie. prepared on a Gross Basis. for the financial year ended 30 June 2012
$'000
A Expenses and IncomeExpenses
1. Management expenses
a. Administration
b. Engineering and Supervision
2. Operation and Maintenance expenses
- Dams & Weirs
a. Operation expenses
b. Maintenance expenses
- Mains
c. Operation expenses
d. Maintenance expenses
- Reservoirs
e. Operation expenses
f. Maintenance expenses
- Pumping Stations
g. Operation expenses (excluding energy costs)
h. Energy costs
i. Maintenance expenses
- Treatment
j. Operation expenses (excluding chemical costs)
k. Chemical costs
l. Maintenance expenses
- Other
m. Operation expenses
n. Maintenance expenses
o. Purchase of water
3. Depreciation expenses
a. System assets
b. Plant and equipment
4. Miscellaneous expenses
a. Interest expenses
b. Revaluation Decrements
c. Other expenses
d. Tax Equivalents Dividends (actually paid)
5. Total expenses
Actuals
2011
Actuals
2012
1,100 1,074
- -
-
188 215
-
-
24
-
24
-
129 236
81 79
- -
41
-
- -
-
- -
80
- -
- -
-
-
32
91 148
41
-
13
66
105
235
11 8
31
-
195
101
page 6

Special Schedules 2012
KYOGLE COUNCIL
Special Schedule No. 3 - Water Supply Income Statement (continued) Includes ALL INTERNAL TRANSACTIONS, ie. prepared on a Gross Basis. for the financial year ended 30 June 2012
$'000
Income
6. Residential charges
a. Access (including rates)
b. Usage charges
7. Non-residential charges
a. Access (including rates)
b. Usage charges
8. Extra charges
9. Interest income
10. Other income
11. Grants
a. Grants for acquisition of assets
b. Grants for pensioner rebates
c. Other grants
12. Contributions
a. Developer charges
b. Developer provided assets
c. Other contributions
13. Total income
14. Gain (or loss) on disposal of assets
15. Operating Result
15a. Operating Result (less grants for acquisition of assets)
8
(148)
Actuals
41
140
13
41
(4)
-
12
156
26 27
22 -
49
1,112
(4)
-
1,119
-
45
-
276 269
371
2012
Actuals
175
4
11
- -
2
139
2011
166
328
page 7
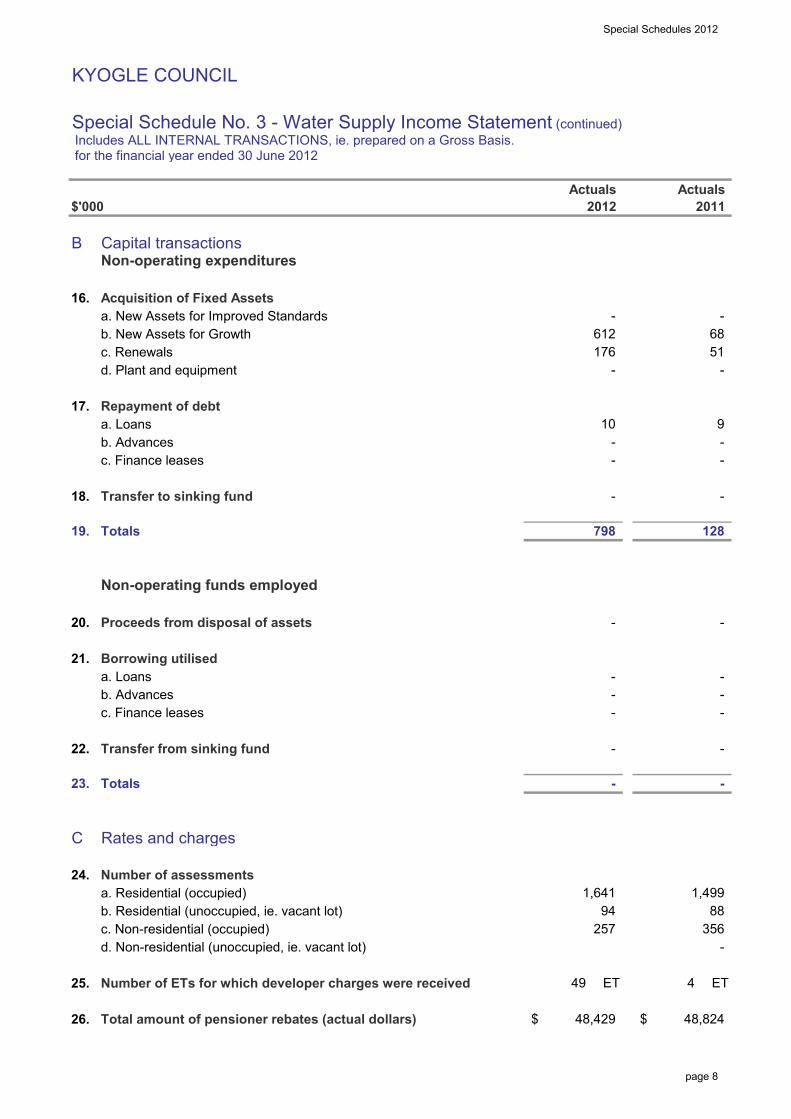
Special Schedules 2012
KYOGLE COUNCIL
Special Schedule No. 3 - Water Supply Income Statement (continued) Includes ALL INTERNAL TRANSACTIONS, ie. prepared on a Gross Basis. for the financial year ended 30 June 2012
$'000
B Capital transactionsNon-operating expenditures
16. Acquisition of Fixed Assets
a. New Assets for Improved Standards
b. New Assets for Growth
c. Renewals
d. Plant and equipment
17. Repayment of debt
a. Loans
b. Advances
c. Finance leases
18. Transfer to sinking fund
19. Totals
Non-operating funds employed
20. Proceeds from disposal of assets
21. Borrowing utilised
a. Loans
b. Advances
c. Finance leases
22. Transfer from sinking fund
23. Totals
C Rates and charges
24. Number of assessments
a. Residential (occupied)
b. Residential (unoccupied, ie. vacant lot)
c. Non-residential (occupied)
d. Non-residential (unoccupied, ie. vacant lot)
25. Number of ETs for which developer charges were received
26. Total amount of pensioner rebates (actual dollars)
356
-
257
4 ET49 ET
48,824$ 48,429$
- -
88 94
1,499 1,641
-
-
-
- -
- -
- -
- -
- -
-
Actuals
-
-
9
128
-
10
-
798
-
Actuals
612
2011
68
-
2012
51 176
page 8

Special Schedules 2012
KYOGLE COUNCIL
Special Schedule No. 3 - Water Supply Cross Subsidies for the financial year ended 30 June 2012
$'000
D Best practice annual charges and developer charges*
27. Annual charges
a. Does Council have best-practice water supply annual charges
and usage charges*?
If Yes, go to 28a.
If No, please report if council has removed land value from access
charges (ie rates)?
NB. Such charges for both residential customers and non-residential
customers comply with section 3.2 of Water Supply, Sewerage and
Trade Waste Pricing Guidelines, NSW Office of Water, December,
2002. Such charges do not involve significant cross subsidies.
b. Cross-subsidy from residential customers using less than
allowance (page 25 of Guidelines)
c. Cross-subsidy to non-residential customers (page 24 of Guidelines)
d. Cross-subsidy to large connections in unmetered supplies
(page 26 of Guidelines)
28. Developer charges
a. Has council completed a water supply Development Servicing**
Plan?
b. Total cross-subsidy in water supply developer charges for
2011/12 (page 47 of Guidelines)
** In accordance with page 9 of Developer Charges Guidelines for
Water Supply, Sewerage and Stormwater, NSW Office of Water,
December, 2002.
29. Disclosure of cross-subsidies
Total of cross-subsidies (27b +27c + 27d + 28b)
* Councils which have not yet implemented best practice water supply
pricing should disclose cross-subsidies in items 27b, 27c and 27d above.
However, disclosure of cross-subsidies is not required where a Council
has implemented best practice pricing and is phasing in such pricing over
a period of 3 years.
-
Yes
AmountNoYes
Yes
page 9

Special Schedules 2012
KYOGLE COUNCIL
Special Schedule No. 4 - Water Supply Balance Sheet Includes INTERNAL TRANSACTIONS, ie. prepared on a Gross Basis. as at 30 June 2012
$'000
ASSETS
30. Cash and investments
a. Developer charges
b. Special purpose grants
c. Accrued leave
d. Unexpended loans
e. Sinking fund
f. Other
31. Receivables
a. Specific purpose grants
b. Rates and Availability Charges
c. Other (including User Charges)
32. Inventories
33. Property, plant and equipment
a. System assets
b. Plant and equipment
34. Other assets
35. Total assets
LIABILITIES
36. Bank overdraft
37. Creditors
38. Borrowings
a. Loans
b. Advances
c. Finance leases
39. Provisions
a. Tax equivalents
b. Dividend
c. Other
40. Total liabilities
41. NET ASSETS COMMITTED
EQUITY
42. Accumulated surplus
43 Asset revaluation reserve
44. TOTAL EQUITY
Note to system assets:
45. Current replacement cost of system assets
46. Accumulated current cost depreciation of system assets
47. Written down current cost of system assets
Actuals
Total
-
- -
11,388 11,388
593
- -
152
- -
-
-
-
Actuals
Current
- -
Actuals
Non Current
-
- - -
44 - 44
-
-
-
148 148
152
-
593 -
- -
-
- -
-
-
- -
-
-
-
267 277
528
-
11,388 937
10
-
- 528
12,325
- -
44 44
- -
- -
-
-
-
11,476
849
11,121 355
582 267
7,952
11,388
20,649
(9,261)
3,524
11,476
page 10

Special Schedules 2012
KYOGLE COUNCIL
Special Schedule No. 5 - Sewerage Income Statement Includes ALL INTERNAL TRANSACTIONS, ie. prepared on a Gross Basis. for the financial year ended 30 June 2012
$'000
A Expenses and IncomeExpenses
1. Management expenses
a. Administration
b. Engineering and Supervision
2. Operation and Maintenance expenses
- Mains
a. Operation expenses
b. Maintenance expenses
- Pumping Stations
c. Operation expenses (excluding energy costs)
d. Energy costs
e. Maintenance expenses
- Treatment
f. Operation expenses (excl. chemical, energy, effluent & biosolids management costs)
g. Chemical costs
h. Energy costs
i. Effluent Management
j. Biosolids Management
k. Maintenance expenses
- Other
l. Operation expenses
m. Maintenance expenses
3. Depreciation expenses
a. System assets
b. Plant and equipment
4. Miscellaneous expenses
a. Interest expenses
b. Revaluation Decrements
c. Other expenses
d. Tax Equivalents Dividends (actually paid)
5. Total expenses
170 139
65 63
85
58
-
49
-
51
-
18
256
-
38
-
151
-
271
-
-
9
66
17
-
-
- -
-
12
333
- -
-
336
- -
1,229 1,103
- -
-
72 73
Actuals
2012
Actuals
2011
page 11

Special Schedules 2012
KYOGLE COUNCIL
Special Schedule No. 5 - Sewerage Income Statement (continued) Includes ALL INTERNAL TRANSACTIONS, ie. prepared on a Gross Basis. for the financial year ended 30 June 2012
$'000
Income
6. Residential charges (including rates)
7. Non-residential charges
a. Access (including rates)
b. Usage charges
8. Trade Waste Charges
a. Annual Fees
b. Usage charges
c. Excess mass charges
d. Re-inspection fees
9. Extra charges
10. Interest income
11. Other income
12. Grants
a. Grants for acquisition of assets
b. Grants for pensioner rebates
c. Other grants
13. Contributions
a. Developer charges
b. Developer provided assets
c. Other contributions
14. Total income
15. Gain (or loss) on disposal of assets
16. Operating Result
16a. Operating Result (less grants for acquisition of assets)
2012
118
817
Actuals
820
Actuals
2011
26 26
9 5
27 28
15 17
10 -
- -
- -
10
177
- 72
10
- -
1,293 1,096
(335)
(199)
49 3
1 -
149
(192)
-
(271) (199)
(271)
- -
page 12

Special Schedules 2012
KYOGLE COUNCIL
Special Schedule No. 5 - Sewerage Income Statement (continued) Includes ALL INTERNAL TRANSACTIONS, ie. prepared on a Gross Basis. for the financial year ended 30 June 2012
$'000
B Capital transactionsNon-operating expenditures
17. Acquisition of Fixed Assets
a. New Assets for Improved Standards
b. New Assets for Growth
c. Renewals
d. Plant and equipment
18. Repayment of debt
a. Loans
b. Advances
c. Finance leases
19. Transfer to sinking fund
20. Totals
Non-operating funds employed
21. Proceeds from disposal of assets
22. Borrowing utilised
a. Loans
b. Advances
c. Finance leases
23. Transfer from sinking fund
24. Totals
C Rates and charges
25. Number of assessments
a. Residential (occupied)
b. Residential (unoccupied, ie. vacant lot)
c. Non-residential (occupied)
d. Non-residential (unoccupied, ie. vacant lot)
26. Number of ETs for which developer charges were received
27. Total amount of pensioner rebates (actual dollars)
-
201
-
-
-
571
27
-
403 174
-
-
149
-
-
-
46,441$
-
196
-
129
-
-
49 ET
1,464
-
-
-
-
-
19
- -
Actuals Actuals
2012 2011
97
196
-
-
1,490
-
-
3 ET
46,855$
page 13

Special Schedules 2012
KYOGLE COUNCIL
Special Schedule No. 5 - Sewerage Cross Subsidies for the financial year ended 30 June 2012
$'000
D Best practice annual charges and developer charges*
28. Annual charges
a. Does Council have best-practice sewerage annual charges,
usage charges and trade waste fees & charges*?
If Yes, go to 29a.
If No, please report if council has removed land value from access
charges (ie rates)?
NB. Such charges for both residential customers and non-residential
customers comply with section 4.2 & 4.3 of the Water Supply,
Sewerage and Trade Waste Pricing Guidelines, NSW Office of
Water, December, 2002. Such charges do not involve significant
cross subsidies.
b. Cross-subsidy to non-residential customers (page 45 of Guidelines)
c. Cross-subsidy to trade waste discharges (page 46 of Guidelines)
29. Developer charges
a. Has council completed a sewerage Development Servicing**
Plan?
b. Total cross-subsidy in sewerage developer charges for
2011/12 (page 47 of Guidelines)
** In accordance with page 9 of Developer Charges Guidelines for
Water Supply, Sewerage and Stormwater, NSW Office of Water,
December, 2002.
30. Disclosure of cross-subsidies
Total of cross-subsidies (28b + 28c + 29b)
* Councils which have not yet implemented best practice sewer pricing &
liquid waste prising should disclose cross-subsidies in items 28b and 28c
above.
However, disclosure of cross-subsidies is not required where a Council
has implemented best practice sewerage and liquid waste pricing and
is phasing in such pricing over a period of 3 years.
Yes
Yes No
Yes
-
Amount
page 14

Special Schedules 2012
KYOGLE COUNCIL
Special Schedule No. 6 - Sewerage Balance Sheet Includes INTERNAL TRANSACTIONS, ie. prepared on a Gross Basis. as at 30 June 2012
$'000
ASSETS
31. Cash and investments
a. Developer charges
b. Special purpose grants
c. Accrued leave
d. Unexpended loans
e. Sinking fund
f. Other
32. Receivables
a. Specific purpose grants
b. Rates and Availability Charges
c. Other (including User Charges)
33. Inventories
34. Property, plant and equipment
a. System assets
b. Plant and equipment
35. Other assets
36. Total Assets
LIABILITIES
37. Bank overdraft
38. Creditors
39. Borrowings
a. Loans
b. Advances
c. Finance leases
40. Provisions
a. Tax equivalents
b. Dividend
c. Other
41. Total Liabilities
42. NET ASSETS COMMITTED
EQUITY
42. Accumulated surplus
44. Asset revaluation reserve
45. TOTAL EQUITY
Note to system assets:
46. Current replacement cost of system assets
47. Accumulated current cost depreciation of system assets
48. Written down current cost of system assets
1,080
-
70 943
20,517
44
1,013
8,975
21,460
27,502
(6,042)
12,622
21,597
21,597
44
-
-
-
- -
-
- -
-
-
21
-
943
21,460
1,150
-
-
21,460
- -
5
- -
-
-
22,610
Actuals
-
-
72 -
-
-
-
Actuals
-
-
-
185
826 826
-
964
-
5
Actuals
Total
23
44
-
72
-
185
-
21,460
-
-
-
-
-
44
-
-
-
-
Non Current Current
23
-
page 15

Special Schedules 2012
KYOGLE COUNCIL
Notes to Special Schedule No.'s 3 & 5 for the financial year ended 30 June 2012
Administration(1)
Engineering and supervision(1)
(item 1a of Special Schedules 3 and 5) comprises the following: (item 1b of Special Schedules 3 and 5) comprises the following:
• Administration staff: • Engineering staff:
− Salaries and allowance − Salaries and allowance
− Travelling expenses − Travelling expenses
− Accrual of leave entitlements − Accrual of leave entitlements
− Employment overheads. − Employment overheads.
• Meter reading. • Other technical and supervision staff:
− Salaries and allowance
• Bad and doubtful debts. − Travelling expenses
− Accrual of leave entitlements
• Other administrative/corporate support services. − Employment overheads.
Operational expenses (item 2 of Special Schedules 3 and 5) comprise the day to day operational expenses
excluding maintenance expenses.
Maintenance expenses (item 2 of Special Schedules 3 and 5) comprise the day to day repair and maintenance
expenses. (Refer to Section 5 of the Local Government Asset Accounting Manual regarding capitalisation
principles and the distinction between capital and maintenance expenditure).
Other expenses (item 4c of Special Schedules 3 and 5) includes all expenses not recorded elsewhere.
Revaluation decrements (item 4b of Special Schedules 3 and 5) is to be used when I,PP&E decreases in FV.
Residential charges
(2) (items 6a, 6b and item 6 of Special Schedules 3 and 5 respectively) include all income
from residential charges. Item 6 of Schedule 3 should be separated into 6a Access Charges (including rates if
applicable) and 6b Usage Charges.
Non-residential charges
(2) (items 7a, 7b of Special Schedules 3 and 5) include all income from non-residential
charges separated into 7a Access Charges (including rates if applicable) and 7b Usage Charges.
Trade waste charges (item 8 of Special Schedule 5) include all income from trade waste charges separated
into 8a Annual Fees, 8b Usage Charges and 8c Excess Mass Charges and 8d Re-inspection Fees.
Other income (items 10 and 11 of Special Schedules 3 and 5 respectively) include all income not recorded
elsewhere.
Other contributions (items 12c and 13c of Special Schedules 3 and 5 respectively) incl. capital contributions
for water supply or sewerage services received by Council under Section 565 of the Local Government Act.
Notes:(1) Administration and engineering costs for the development of capital works projects should be reported as part of the
capital cost of the project and not as part of the recurrent expenditure (ie. in item 16 for water supply and item 17 for
sewerage, and not in items 1a and 1b).
(2) To enable accurate reporting of residential revenue from usage charges, it is essential for councils to accurately
separate their residential (item 6) charges and non-residential (item 7) charges.
page 16

KYOGLE COUNCIL
Special Schedule No. 7 - Condition of Public Works as at 30 June 2012
$'000
page 1
7
Specia
l Schedule
s 2
012
Commercial Waste 1.00% 2 76 57 19 4 20 2
Quarries 1.00% 1 42 33 9 4 4 2
32
50
20
10
12
122
6
1
7
5
20
116
5
8
16
30
5
30
2
30 3
17 1
8 7
5 16
2
standard (1)
6
2 2
4 1
6
3,690 6,621
897
36 32
3
3
60
20
387
449
38
- 5
10
70
1,310
826 1,636
829 1.00%
10,311
11
171
28
2,248
1
-
3
2,906 3 2,685
-
2,096
25
120
750
9,389 11,980
787
Required(2)
Estimated
Carrying bring up to a
Condition#.
condition / Maintenance
Asset
cost to
180 3 810
561 706
4
380
1,450
18
30
Annual Annual Amount
(WDV)
136
Current(3)
Maintenance
<<<<<<<<<<<< per Note 9 >>>>>>>>>>>>
satisfactory
Cost
Accum.
Depreciation
Amortisation
&
Impairment
Dep'n
52
37
938 150 2
-
1,484 832
2 510
50
13
2
per Note 4
136
($)
21
Public Halls
Council Offices
1.00%
1.00%
Pools
Health
Preschools
Cemeteries
per Note 1
(%)
Valuation
Rate
Dep'n.
1.00%
Bushfire
1.00%
1.00%
1.00%
2,316
1,267
Works Depots 1,537
21,369
sub total
sub total
Parks & Gardens
Library
Animal Control
1.00%
Expense
Asset Category
192 -
1.00%
ASSET CLASS
Buildings
1.00%
48 1.00%
387
5,591
Other Structures Assets not included in Buildings
2,685 2,906
5.00% 192 5,591
120 50 30

KYOGLE COUNCIL
Special Schedule No. 7 - Condition of Public Works (continued)
as at 30 June 2012
$'000
Specia
l Schedule
s 2
012
page 1
8
sub total 5,411 - 267,999 117,602 150,397 27,160 6,150 4,265
32
123
12
4 113
8,540 2,746
Footpaths 5.00% 41 2,958 991 1,967 1 200 40 20 Bridges - Regional 5.00% 124 13,337 3,159 10,178 1 1,200 55 15
Roadside Furniture 5.00% 171 2,308 1,059 1,249 1 280 150 135 Bridges - Rural 5.00% 683 82,082 40,625 41,457 3 4,200 900 550
9,300 1,000 680 Rural Unsealed 5.00% 1,857 44,874 25,470 19,404 3 5,300 2,500 2,000 Regional Unsealed 5.00% 97 2,155 1,418 737 2 100 55 50
Points
Plant
Services 1.00% 200
Rural Sealed 5.00% 1,132 52,518 20,987 31,531 2 5,900 Regional Sealed 5.00% 1,012
70 250
35
5,794
17,110
1,640 332
4 1
25
60
211
70 2,865 5,500 14,245
11,228
2.00% 213 100
3 1,308
2
156 5,322
55 2
198
3
2.00%
12,113 124
2
2.00%
Accum.
Depreciation
Amortisation
&
Impairment
Carrying
Valuation Maintenance
standard (1)
Estimated
Current(3)
satisfactory Annual Annual
Condition#.
Required(2)
bring up to a
condition /
sub total
Lines
Services
sub total
Dep'n.
Expense
Plant
Water
Sewerage
Points
Lines
Public Roads Urban Sealed
ASSET CLASS Asset Category
(%) ($)
75
6
90
(WDV) Cost
Amount
<<<<<<<<<<<< per Note 9 >>>>>>>>>>>>
3,000
22 16
4
Maintenance
Asset
2,978
294 14,041 5,789 8,252 2 680 350 235 1,100 580
53,726
cost toDep'n
396
2
60 4,324 7,302
241
2
1.00%
44
5,842
197 1.00%
832
Rate
1.00%
per Note 1 per Note 4
2
6,271
300
5.00%
18,104 35,622 2
80 2,000
5 436
60
15 25
9,260 -
1.00%
20,488 188
336 141 5,982 179 21,460 6,043 27,503 -

KYOGLE COUNCIL
Special Schedule No. 7 - Condition of Public Works (continued)
as at 30 June 2012
$'000
Notes:
(1). Satisfactory refers to estimated cost to bring the asset to a satisfactory condition as deemed by Council. It does not include any planned enhancements to the existing asset.
(2). Required Annual Maintenance is what should be spent to maintain assets in a satisfactory standard.
(3). Current Annual Maintenance is what has been spent in the current year to maintain assets.
# Asset Condition "Key" - as per the DLG Integrated Planning & Reporting Manual
Excellent - No work required (normal maintenance)
Good - Only minor maintenance work required
Average - Maintenance work required
Poor - Renewal required
Very Poor - Urgent renewal/upgrading required5
2,195
page 1
9
ASSET CLASS
6,773
40
Dep'n. Dep'n cost to
Estimated
2,195
($)
Rate
Amount
Expense Carrying
Accum.
Depreciation
Amortisation
&
Impairment
per Note 4
22,825 5,392
<<<<<<<<<<<< per Note 9 >>>>>>>>>>>>
Drainage Works
Required(2)
bring up to a
per Note 1
2 122
Cost Valuation (WDV)
17,433
(%) Annual Asset satisfactory
Asset Category
Infrastructure 1.00%
condition /
42,875 153,183 212,592 365,775 TOTAL - ALL ASSETS
-
4
2
6,636 -
1
17,433 sub total 122 5,392 22,825
3
Specia
l Schedule
s 2
012
61
Condition#.
Maintenance
61 40
standard (1)
Current(3)
Annual
Maintenance
4,748

Special Schedules 2012
KYOGLE COUNCIL
Special Schedule No. 8 - Financial Projections as at 30 June 2012
(1)
$'000
(i) OPERATING BUDGET
Income from continuing operations
Expenses from continuing operations
Operating Result from Continuing Operations
(ii) CAPITAL BUDGET
New Capital Works (2)
Replacement/Refurbishment of Existing Assets
Total Capital Budget
Funded by:
– Loans
– Asset sales
– Reserves
– Grants/Contributions
– Recurrent revenue
– Other
Notes:
(1) From 11/12 Income Statement.
(2) New Capital Works are major non-recurrent projects, eg new Leisure Centre, new Library, new Swimming pool etc.
(3) If Council has only adopted 3 years of projections then only show 3 years.
(4) Financial Projections should be in accordance with Council's Integrated Planning & Reporting framework.
4,903 10,031 6,899
-
5,960 9,486
- - - -
1,659
1,260
1,411
4,582 1,980
2,710 2,777
2,064 1,801
2,266
1,263 -
2,008
4,220
2,177
4,741 4,163
-
4,903
2,000
9,486
540
-
608 524 573 556
10,031 6,899 5,960
- 300
4,745 740
27,128 18,403
17,171
856
1,539 424
18,164
3,320
18,217 18,588
17,674
7,192 5,813 5,104
27,525 16,864
(397) 1,046
2,839 1,086
Actual
11/12
Forecast
13/14 12/13
Forecast
15/16
Forecast(3)Forecast(3)
14/15
20,994
page 20


