Download - 2019 Seat Belt Use in Virginia

2019
Seat Belt Use in Virginia Final Report
Prepared for:
Virginia Department of Motor Vehicles’ Highway Safety Office
By:
Bryan E. Porter, Ph.D.* Norou Diawara, Ph.D. Jennika K. Jenkins
The Graduate School &
Psychology
Mathematics & Statistics Psychology
Old Dominion University
Norfolk, Virginia 23529-0267
With Special Acknowledgement to:
Collectors from the Behavioral Psychology Research & Analysis Team
Old Dominion University
*For Further Information:
757-683-3259

- i -
Table of Contents
Contents
Summary ............................................................................................................................................. 1
1.0 Introduction .................................................................................................................................. 2
2.0 Study Design ................................................................................................................................. 2
3.0 Sample Design .............................................................................................................................. 3 3.1 Sample Size and Precision ..................................................................................................... 6 3.2 County Selection .................................................................................................................... 7 3.3 Road Segment Selection ........................................................................................................ 8
3.4 Reserve Sample ...................................................................................................................... 9
4.0 Data Collection ........................................................................................................................... 10 4.1 Site Selection ....................................................................................................................... 10 4.2 Training ................................................................................................................................ 12
4.3 Observation Periods and Quality Control ............................................................................ 13
5.0 Imputation, Estimation and Variance Estimation .................................................................. 18 5.0 Imputation ............................................................................................................................ 18 5.1 Sampling Weights and Statistical Design ............................................................................ 18 5.2 Nonresponse Adjustment ..................................................................................................... 21
5.3 Estimators ............................................................................................................................ 21 5.4 Variance Estimation ............................................................................................................. 23
6.0 Results ......................................................................................................................................... 24 6.1 Overall Weighted State Rate ................................................................................................ 24 6.2 Additional Data Comparisons—Descriptives ...................................................................... 24
7.0 Discussion.................................................................................................................................... 28
Appendix A: Brief Notes on Calculating the Virginia Seat Belt Use Rate (2017 - 2021) .......... 29
Appendix B-1: List of Sampled Road Segments by County ........................................................ 31
Appendix B-2: List of Viable Observation Road Segments by County ...................................... 46
Appendix B-3: Data Collected at Observation Sites ..................................................................... 58
Appendix C: Virginia Seat Belt Observation Forms – Cover Sheet ........................................... 61

- 1 -
Summary
This report documents procedures to produce the 2019 seat belt use rate for Virginia. The
procedures were developed as a result of the federally-mandated “re-design” based on the final
rule for 23 CFR Part 1340: Uniform Criteria for State Observational Surveys of Seat Belt Use.
The rule was published in the Federal Register Vol. 76 No. 63, April 1, 2011, Rules and
Regulations, pp. 18042 – 18059. Virginia’s plan was approved by the National Highway Traffic
Safety Administration in February 2017 after working closely with federal personnel to ensure
compliance with the law. This plan is in place for 2017 – 2021.
The report provides significant details about sampling, procedures, and analyses. In brief:
(1) The 2019 weighted seat belt use rate, calculated with the methodology and sample approved
by NHTSA in 2017, was 85.4%.
(2) The 95% confidence interval for the seat belt use rate was between 84.3% and 86.6%.
(3) The error rate was 0.58%, well below the maximum 2.5% allowed by code.
(4) The “miss rate” or rate of “unknown” belt use observations (i.e., seeing an individual
occupant but not knowing whether he or she was buckled up) was 7.9%, below the maximum
10% allowed by code.
(5) These seat belt use rate results were based on a weighted survey design sample of 16,629
vehicles providing driver and/or passenger belt use observations.
Additional analyses of individual occupant, vehicle, and area differences are included in the
report. Readers desiring more information are encouraged to contact the lead author (contact
information on the title page).
Suggested Report Citation:
Porter, B. E., Diawara, N., & Jenkins, J. K. (2019). 2019 Seat Belt Use in Virginia. Norfolk,
Virginia: Old Dominion University for the Virginia Highway Safety Office.

- 2 -
1.0 Introduction
On April 1, 2011, the National Highway Traffic Safety Administration (NHTSA) issued new
Uniform Criteria for State Observational Surveys of Seat Belt Use. The final rule was published
in Federal Register Vol. 76 No. 63, Rules and Regulations, pp. 18042 – 18059. The survey plan
presented below represents Virginia’s required response to re-design its survey for 2017 – 2021
to follow its first approved survey which ran 2012 - 2016. The re-designed survey meets the
requirement of a study and data collection protocol for an annual state survey to estimate
passenger vehicle occupant restraint use. This plan is fully compliant with the Uniform Criteria
and was used to complete Virginia’s 2019 seat belt survey.
2.0 Study Design
Virginia is composed of 95 county aggregates (an aggregate is a county and independent cities included in one geographical area), 56 of which account for 86.3 percent of the passenger vehicle
crash-related fatalities according to Virginia Department of Motor Vehicles’ data averages for
the period 2011 - 20151. We used these 56 counties as the eligible pool from which to sample
counties for inclusion in the survey. We chose 15 of these 56 for observation (see below for selection procedures).
Using 2015 TIGER data developed by the U.S. Census Bureau, NHTSA provided to states a
listing of road segments for each county/city jurisdiction. These have been identified by road
functional classification (S1100: Interstate/Primary, S1200: Arterial/Secondary, and S1400: Local). Local roads (S1400s) were excluded from county areas in non-Metropolitan Statistical
Areas as allowed by the federal rule. In addition, the listings include segment length as determined by TIGER. This descriptive information allowed for stratification of road segments,
and we employed a systematic probability proportional to size (PPS) sample to select the road segments to be used as observation sites.
All passenger vehicles with a gross vehicle weight up to 10,000 pounds are included in the
survey. This includes small commercial vehicles. The target population is all drivers and right
front seat passengers (excluding children harnessed in child safety seats) of these vehicles who
travel on public roads between the hours of 0700 and 1800. The observation period for each
selected road segment is 50 minutes (10 additional minutes are used for site setup, background
data recording such as estimated traffic volume, and organizational paperwork and check-ins
with on-call supervisors as needed; the total time at the sites is 60 minutes to allow efficient
collection schedules and travel routes within a given day). Fifty minutes of belt-use collection is
sufficient based on past experiences with similar state projects.
Data collection is conducted by single observers who receive two days of classroom and field
training. Quality Control (QC) Monitors make unannounced visits to scheduled data collection
1 Data from the FARS system provided by NHTSA to do a county analysis did not include 2015 when the sample was created. Also, Virginia
historically aggregates cities and counties that are geographically contiguous for programming and understanding regional traffic safety concerns; data provided by NHTSA treated cities and counties separately, which was less accurate for historical purposes, and inconsistent with
how the first design was created. More on this aggregation follows in a later section.

- 3 -
locations to ensure that data are being collected according to the research protocol. Further, each
day has an “on-call supervisor” who handles collector check-ins, questions, replacement site
decisions, and so forth. Our plan also describes methods to be used when scheduled data
collection sites are not available due to temporary or permanent circumstances.
The approaches to data weighting and belt use estimation and variance estimation comply with
the Uniform Criteria and stipulate procedures to be followed when data quality goals (e.g. item
response rates) are not met.
3.0 Sample Design
The research design conforms to the requirements of the Uniform Criteria and generates annual
estimates of occupant restraint use for adults and children using booster seats in the front seats of
passenger vehicles. The selected approach includes a stratified systematic PPS sample of data
collection sites as described below.
In Virginia, there are separate county jurisdictions and city jurisdictions. The first step was to
aggregate independent cities with the most appropriate county. Treating cities and their
surrounding counties as units makes sense in the Commonwealth from historical considerations,
travel issues, and planning. All data for each area were then aggregated in kind. For example,
Bristol City and Washington County were aggregated into what was called the Washington
County Aggregate. Treating Bristol City as a separate entity for sampling from Washington
County does not make sense given how those two jurisdictions work together and are
geographically linked.
The design team also created three county aggregates where they did not exist, but did so again
because of geography, history, and how the areas work together. It also did this so that these
aggregates would only enter the final sample once each at most, which allowed other areas of the
Commonwealth better odds of being selected for observation. The South Hampton Roads cities
of Norfolk, Virginia Beach, Chesapeake, Portsmouth, and Suffolk were combined into the
Southeast Aggregate. The Peninsula cities of Williamsburg, Poquoson, Hampton, and Newport
News were combined with York County into the York County Aggregate. And the counties of
Accomack and Northampton were combined into the Eastern Shore Aggregate.
Fatalities were the key measure of eligibility based on the revised Uniform Criteria. The federal
rule stated that, at minimum, counties producing 85% of the state’s roadway fatalities must be
considered eligible. States were given leeway in how many years’ data would be used to make
this assessment (3 – 5), with Virginia choosing a 5-year average. To determine eligibility,
Virginia county aggregates were ranked by their 5-year average fatalities based on Virginia
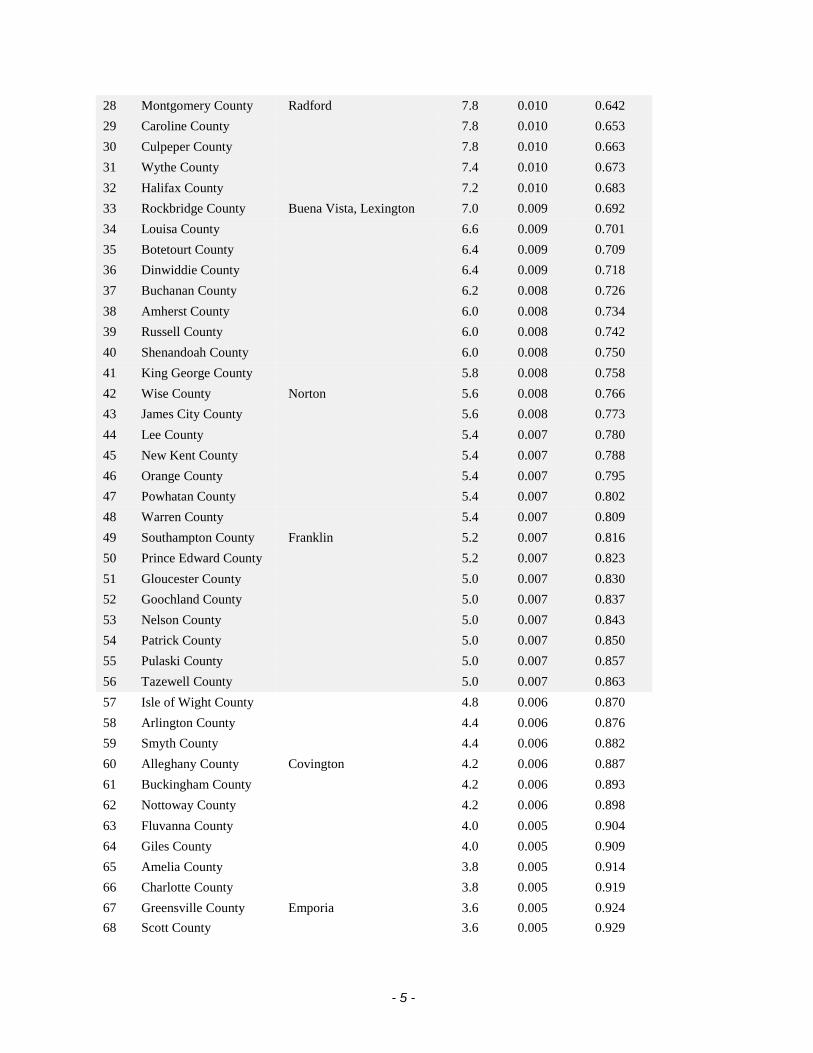
Department of Motor Vehicles’ fatality data (recall Footnote 1). Table 1 gives the ranked
aggregates and their average 5-year fatals. Shaded counties are those that were marked as
“eligible for selection.” Note that these eligible counties contributed 86.3% of the average
fatalities, a higher cut-off than required by the rule. The team made this decision because the last
eligible counties on the list tied on the 5-year average, so it allowed all counties with that last
value to be included as eligible.

- 4 -
Table 1. Virginia Average Passenger Vehicle Crash-Related Fatalities by County 2011 -
2015*
No.
County
Including Cities/
Counties if Combined
5-year
Fatal
avg.
Pct of
Fatals
Cumulative
Pct
1 Southeast Aggregate Chesapeake, Norfolk,
Portsmouth, Suffolk,
Virginia Beach
74.0 0.099 0.099
2 Fairfax County Alexandria, Fairfax,
Manassas Park2, Falls Church
43.2 0.058 0.157
3 Henrico County Richmond 31.8 0.043 0.200
4 York County Aggregate Hampton, Newport News,
Poquoson, Williamsburg
27.0 0.036 0.236
5 Chesterfield County Colonial Heights 25.0 0.033 0.269
6 Prince William County Manassas 17.6 0.024 0.293
7 Pittsylvania County Danville 17.0 0.023 0.316
8 Roanoke County Roanoke, Salem 15.0 0.020 0.336
9 Rockingham County Harrisonburg 14.8 0.020 0.355
10 Albemarle County Charlottesville 14.8 0.020 0.375
11 Henry County Martinsville 14.2 0.019 0.394
12 Spotsylvania County Fredericksburg 14.0 0.019 0.413
13 Hanover County 13.8 0.018 0.432
14 Augusta County Staunton, Waynesboro 13.4 0.018 0.450
15 Loudoun County 13.0 0.017 0.467
16 Frederick County Winchester 12.8 0.017 0.484
17 Fauquier County 12.4 0.017 0.501
18 Campbell County Lynchburg 11.4 0.015 0.516
19 Prince George County Hopewell, Petersburg 11.4 0.015 0.531
20 Bedford County Bedford 11.0 0.015 0.546
21 Stafford County 10.4 0.014 0.560
22 Eastern Shore Accomack County,
Northampton County
10.2 0.014 0.574
23 Franklin County 10.2 0.014 0.587
24 Washington County Bristol 9.0 0.012 0.599
25 Brunswick County 8.2 0.011 0.610
26 Mecklenburg County 8.2 0.011 0.621
27 Carroll County Galax 7.8 0.010 0.632
2 Manassas Park is listed here within Fairfax County because it was included in the Fairfax aggregate for sample selection, but it is technically in
Prince William County. This inaccuracy has a negligible impact on findings. Crashes and road lengths were added to Fairfax for sampling, but in the end no sites from Manassas Park were sampled, and therefore no data are collected from Manassas Park during this 5-year period.
- 5 -
28 Montgomery County Radford 7.8 0.010 0.642
29 Caroline County 7.8 0.010 0.653
30 Culpeper County 7.8 0.010 0.663
31 Wythe County 7.4 0.010 0.673
32 Halifax County 7.2 0.010 0.683
33 Rockbridge County Buena Vista, Lexington 7.0 0.009 0.692
34 Louisa County 6.6 0.009 0.701
35 Botetourt County 6.4 0.009 0.709
36 Dinwiddie County 6.4 0.009 0.718
37 Buchanan County 6.2 0.008 0.726
38 Amherst County 6.0 0.008 0.734
39 Russell County 6.0 0.008 0.742
40 Shenandoah County 6.0 0.008 0.750
41 King George County 5.8 0.008 0.758
42 Wise County Norton 5.6 0.008 0.766
43 James City County 5.6 0.008 0.773
44 Lee County 5.4 0.007 0.780
45 New Kent County 5.4 0.007 0.788
46 Orange County 5.4 0.007 0.795
47 Powhatan County 5.4 0.007 0.802
48 Warren County 5.4 0.007 0.809
49 Southampton County Franklin 5.2 0.007 0.816
50 Prince Edward County 5.2 0.007 0.823
51 Gloucester County 5.0 0.007 0.830
52 Goochland County 5.0 0.007 0.837
53 Nelson County 5.0 0.007 0.843
54 Patrick County 5.0 0.007 0.850
55 Pulaski County 5.0 0.007 0.857
56 Tazewell County 5.0 0.007 0.863
57 Isle of Wight County 4.8 0.006 0.870
58 Arlington County 4.4 0.006 0.876
59 Smyth County 4.4 0.006 0.882
60 Alleghany County Covington 4.2 0.006 0.887
61 Buckingham County 4.2 0.006 0.893
62 Nottoway County 4.2 0.006 0.898
63 Fluvanna County 4.0 0.005 0.904
64 Giles County 4.0 0.005 0.909
65 Amelia County 3.8 0.005 0.914
66 Charlotte County 3.8 0.005 0.919
67 Greensville County Emporia 3.6 0.005 0.924
68 Scott County 3.6 0.005 0.929

- 6 -
69 Westmoreland County 3.2 0.004 0.933
70 Page County 3.0 0.004 0.937
71 Appomattox County 2.8 0.004 0.941
72 King William County 2.8 0.004 0.945
73 Dickenson County 2.6 0.003 0.948
74 Essex County 2.6 0.003 0.952
75 Floyd County 2.6 0.003 0.955
76 Sussex County 2.6 0.003 0.959
77 Charles City County 2.4 0.003 0.962
78 Clarke County 2.4 0.003 0.965
79 Lancaster County 2.4 0.003 0.968
80 Lunenburg County 2.2 0.003 0.971
81 King and Queen County 2.0 0.003 0.974
82 Madison County 2.0 0.003 0.977
83 Cumberland County 1.8 0.002 0.979
84 Mathews County 1.8 0.002 0.982
85 Northumberland County 1.8 0.002 0.984
86 Grayson County 1.6 0.002 0.986
87 Greene County 1.6 0.002 0.988
88 Bath County 1.4 0.002 0.990
89 Bland County 1.4 0.002 0.992
90 Craig County 1.4 0.002 0.994
91 Middlesex County 1.4 0.002 0.996
92 Rappahannock County 1.0 0.001 0.997
93 Richmond County 1.0 0.001 0.998
94 Surry County 0.8 0.001 0.999
95 Highland County 0.4 0.001 1.000
Virginia Average 5-year
Fatal Count:
746.6
* Data are from fatalities recorded in the Virginia Department of Motor Vehicles’ database for
2011 – 2015. Shaded counties were eligible for selection.
3.1 Sample Size and Precision
A standard error of less than 2.5% on the seat belt use estimate is required by the Final Rule.
Since 2012 when the revised federal code for this survey was implemented, Virginia’s Annual
Seat Belt Use Study’s standard errors have been below this threshold with more than 10,000
vehicles observed each year. These observed sizes were obtained from 15 county aggregates and
8 – 16 road segments per county (136 segments overall). Therefore, because the current design
also includes 15 county aggregates and 136 road segments, it is expected to yield annually a
comparable vehicle sample, and the precision objective should be achieved. In the event the

- 7 -
precision objective is not met, additional observations would be made starting with sites having
the fewest observations, and new data would be added to existing valid data until the desired
precision is achieved. In 2019, the precision objective was met.
3.2 County Selection
Data
Vehicle Miles Traveled (VMT) in millions was used to weight the probability of counties being
sampled. Specifically, the team used a 5-year average VMT, obtained from the Virginia
Department of Transportation database (2011-2015), as our “measure of size” in a “probability
proportion to size” (PPS) sampling procedure. Simple random sampling (SRS) could have been
used, but that method could result in all counties coming from one region of the Commonwealth.
This was not desirable. Instead, PPS was deemed more desirable, with PPS strata sampling
chosen. The strata had approximately the same size definitions (see the following section).
County Ranking and Sampling
To ensure the team included a representative range of VMTs across Virginia, counties were
grouped into high, medium, and low VMT strata. The High VMT stratum was formed of
counties with at least 1001 million miles traveled on average each year. The Low VMT stratum
was formed of counties with fewer than 501 million miles average. The medium stratum was
categorized between those two groups. This categorization, which was deemed reasonable,
produced 19 “high”, 19 “medium”, and 18 “low” counties, a good balance of VMT clusters
across the Commonwealth. Then, within each VMT strata, five counties were selected via PPS
with average VMT as the weighting factor. This produced a group of 15 counties for
consideration.
Within each stratum, counties were selected with probability proportional to size with the MOS
being the average VMT from 2011 to 2015. Let 𝑔 = 1,2, … 𝐺 = 3 be the first stage strata, 𝑉𝑀𝑇𝑔𝑐
be the average VMT for county 𝑐 in stratum 𝑔, and 𝑉𝑀𝑇𝑔 = ∑ 𝑉𝑀𝑇𝑔𝑐 𝑎𝑙𝑙 𝑐 𝑖𝑛 𝑔 be the total
average VMT for all counties in first stage stratum 𝑔. Then PSU inclusion probability is: 𝜋𝑔𝑐 =
𝑛𝑔𝑉𝑀𝑇𝑔𝑐/𝑉𝑀𝑇𝑔; here 𝑛𝑔 is the PSU sample size for first stage stratum 𝑔𝑔 that was allocated. If a
county was selected with certainty (i.e., its MOS was equal to or exceeded 𝑉𝑀𝑇𝑔/𝑛𝑔), it was set
aside as a certainty selection and the probabilities of selection were recalculated for the
remaining counties in the stratum. This was repeated and the certainty selections were identified
successively until no county’s MOS was equal to or exceeded the recalculated 𝑉𝑀𝑇𝑔/𝑛𝑔.
The selection was completed using different seeds in the SAS® package (SAS® institute Inc.,
Cary NC, USA) version 9.3 software system.
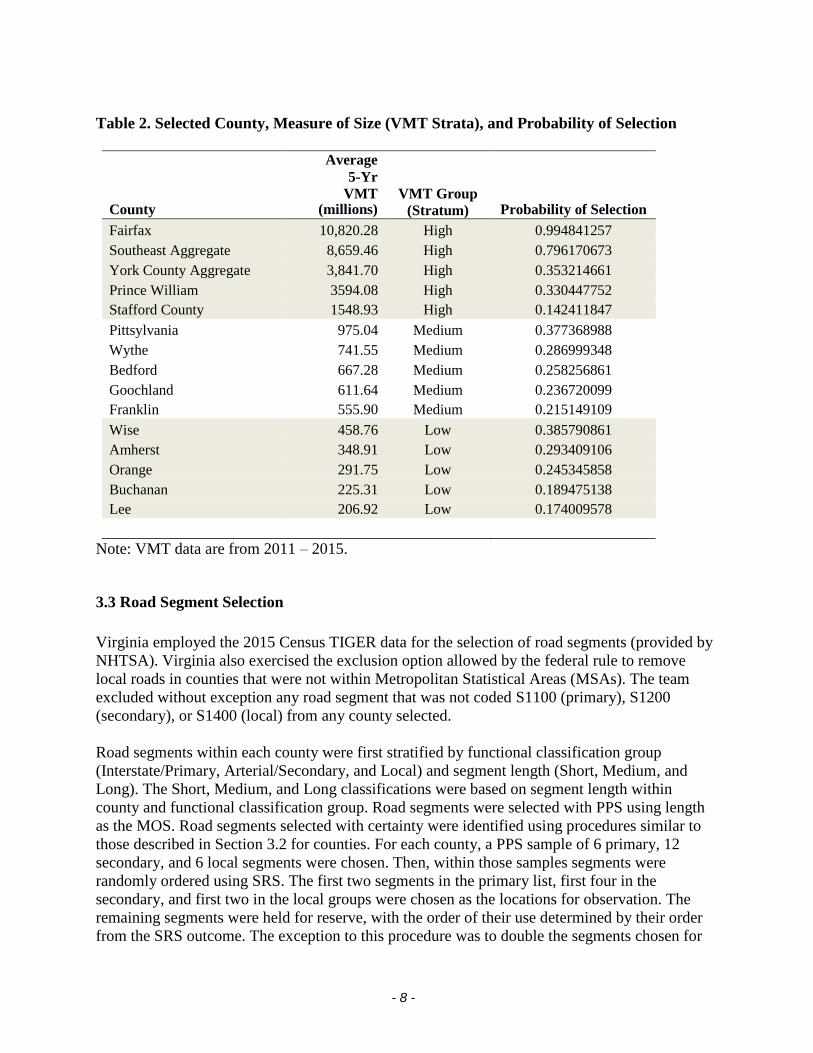
Table 2 shows the average 5-year VMTs, VMT Strata, and probability of selection for each of
the resulting 15 county aggregates sampled for observations.
- 8 -
Table 2. Selected County, Measure of Size (VMT Strata), and Probability of Selection
County
Average
5-Yr
VMT (millions)
VMT Group
(Stratum)
Probability of Selection
Fairfax 10,820.28 High 0.994841257
Southeast Aggregate 8,659.46 High 0.796170673
York County Aggregate 3,841.70 High 0.353214661
Prince William 3594.08 High 0.330447752
Stafford County 1548.93 High 0.142411847
Pittsylvania 975.04 Medium 0.377368988
Wythe 741.55 Medium 0.286999348
Bedford 667.28 Medium 0.258256861
Goochland 611.64 Medium 0.236720099
Franklin 555.90 Medium 0.215149109
Wise 458.76 Low 0.385790861
Amherst 348.91 Low 0.293409106
Orange 291.75 Low 0.245345858
Buchanan 225.31 Low 0.189475138
Lee 206.92 Low 0.174009578
Note: VMT data are from 2011 – 2015.
3.3 Road Segment Selection
Virginia employed the 2015 Census TIGER data for the selection of road segments (provided by
NHTSA). Virginia also exercised the exclusion option allowed by the federal rule to remove
local roads in counties that were not within Metropolitan Statistical Areas (MSAs). The team
excluded without exception any road segment that was not coded S1100 (primary), S1200
(secondary), or S1400 (local) from any county selected.
Road segments within each county were first stratified by functional classification group
(Interstate/Primary, Arterial/Secondary, and Local) and segment length (Short, Medium, and
Long). The Short, Medium, and Long classifications were based on segment length within
county and functional classification group. Road segments were selected with PPS using length
as the MOS. Road segments selected with certainty were identified using procedures similar to
those described in Section 3.2 for counties. For each county, a PPS sample of 6 primary, 12
secondary, and 6 local segments were chosen. Then, within those samples segments were
randomly ordered using SRS. The first two segments in the primary list, first four in the
secondary, and first two in the local groups were chosen as the locations for observation. The
remaining segments were held for reserve, with the order of their use determined by their order
from the SRS outcome. The exception to this procedure was to double the segments chosen for

- 9 -
two county aggregates: Fairfax and Southeast. The team doubled their selected and reserve
segments because these two county areas had more than double the average VMT of other
counties.
When a county did not have any segment classified as S1100 (and not all counties had
interstate/primary segments), then the assigned number of segments to that stratum was re-
allocated across the other segment types. For example, if a county had no S1100 segments, the
two segments needed for that stratum were re-allocated so that 5, instead of 4, S1200 segments
were sampled and 3, instead of 2, S1400 segments were selected.
For counties without S1400 roads (after removal for being in a non-Metropolitan Statistical
Area), the number of segments required was re-allocated to other strata available. One of the 2
needed S1400 segments was allocated to the S1100 stratum, and the second to the S1200
stratum. For counties that only had S1200 segments eligible for observation after applying the
exclusion option for non-MSAs, all needed segments were S1200s.
More detail about the segment selection is given in Section 5.2.
Appendix B presents the selected road segments within each county and their probabilities of
selection. Table 3 provides the number of segments by stratum for each county area, and the
total number of each segment type selected for each county. The procedure produced 136
segments to observe.
3.4 Reserve Sample
In the event that an original road segment was permanently unavailable, a reserve road segment
would be used. The reserve road segment sample consists of two additional road segments per
original road segment selected, resulting in a reserve sample of 272 road segments (136
segments for observation x 2 reserves for each = 272 total reserve sites). These reserve segments
were identified and selected using the procedures described above. Thus, replacement locations
are considered selected with PPS using road segment length as MOS by the same approach as the
primary locations, with the only difference being the SRS that determined order of selection:
primary or reserve/alternate. For the purposes of data weighting, the reserve road segment
inherits all probabilities of selection and weighting components up to and including the road
segment stage of selection from the original road segment actually selected. Probabilites and
weights for any subsequent stages of selection (e.g., the sampling of vehicles; actual segment
lengths) would be determined by the reserve road segment itself. (Note that additional reserve
sites would be sampled if, after initial segment screening prior to data collection, the collection
team discovers that the first selected locations are not viable and it has to move far down in the
reserve list; in all cases the team would have reserve samples ready to use in case of any
unforeseen circumstance, and such reserve sites would be chosen via the procedures above).
In preparing for 2017 - 2021 plan, we indeed needed to resample select counties’ road types as
the reserves were eliminated due to allowable exclusions. (This is one reason we scout all sites a
priori to data collection to ensure we have viable locations prior to collections, and viable

- 10 -
reserves for future years). In some cases we needed to use sites from the second sampling of
locations, and this created a need to adjust weighting of those locations. We followed the
mathematical suggestion provided by Thompson’s 2012 “Sampling” textbook in reference to the
multistage selection probability.3
In the sampling selection at the first stage, there were three counties whose sampled S1400 road
segments did not provide sufficient locations for collections, and required additional sampling.
Those three counties were Bedford, Fairfax, and the York Aggregate. A resampling at the second
stage was performed, removing the locations that were selected in the first sampling stage. The
selection probabilities were adjusted the following way per Thompson (2012). If 𝜋1represents the
highest selection in the first stage, then consider the selection probability in the second stage as
𝜋2, and then the adjusted selection probability is given as:
𝜋 = 1 − (1 − 𝜋1)(1 − 𝜋2).
Doing so, we still kept the eligible locations in stage 1 selection, avoided duplications, and
compensated for needing a second stage sampling.4
4.0 Data Collection
4.1 Site Selection
Road segments were mapped according to their latitude and longitude. The selected road
segment was identified by an intersection or interchange that occurred within or just beyond the
segment. If no intersection or interchange occurred within the segment, then any point on that
road was used for observation assuming it was (a) as close to the chosen segment as possible, (b)
within the boundaries of two intersecting roads, and (c) a safe place to park and observe. Data
collection sites were deterministically selected such that traffic was moving during the
observation period. Therefore, sites were assigned to locations in the segment which were at least
50 yards from any controlled intersections for the observed direction of travel. For interstate
highways or other limited access segments, data collection occurred on a ramp carrying traffic
that was exiting the roadway. The observed direction of travel was randomly assigned a priori
for each road segment. However, if advance scouting of each segment determined that the
randomly chosen direction could not be safely observed due to lack of shoulder space or lack of
other protective road space for the observer, and if such safety could not be found up- and
downstream on the road segment or in its adjacent segments as close to the sampled segment as
possible before a major intersection that would divert the segment’s traffic, then the team
collected data in the other direction of traffic at the segment if such safety conditions were met
there. It is standard for field research to protect observers exposed to roadside traffic for liability
reasons. Further, traffic moving in the opposite direction from the direction originally chosen by
random procedures was expected to be more representative of the segment than abandoning the
segment altogether for an alternate location. For some interstate locations, there was nowhere to
3 Sampling, by Steven K. Thompson, 2012, Wiley Series in Probability and Statistics, third edition. ISBN-13: 978-0470402313.
4 A second stage sampling was needed to obtain sufficient reserve locations for Bedford, Fairfax and York Counties at the S1400 level. Three
second-level sites are used: BED4007, FAI40013 and YC4009, respectively. These are also listed in the Appendix and noted. The adjustment to
selection probabilities follows the procedures provided above.

- 11 -
Table 3 - Roadway Functional Strata by County, Road Segments Population (N), Length in
Miles, and Number of Segments Selected (n)
Roadway Functional Strata
County Interstate/Primary
(S1100)
Arterial/Secondary
(S1200)
Local5
(S1400)
Total
N 0 1,270 8,826 10,096
Amherst Length 0 158.00 1176.76 1,334.76 N 0 5 3 8
N 26 2,030 18,572 20,604
Bedford4 Length .18 218.60 2,103.82 2,322.52
N 2 4 2 8
N 0 693 NA 693
Buchanan Length 0 82.71 NA 82.71 N 0 8 NA 8
N 1,294 5,307 60,194 66,795
Fairfax Length 161.12 460.64 4,401.45 5,023.21 N 4 8 4 16
N 0 1,371 19,934 21,305
Franklin Length 0 137.72 2,300.35 2,438.07 N 0 5 3 8
N 148 727 4,822 5,697
Goochland Length 48.06 99.37 759.73 907.16 N 2 4 2 8
N 0 1,582 NA 1,582 Lee Length 0 169.91 NA 169.91
N 0 8 NA 8
N 0 686 NA 686
Orange Length 0 99.60 NA 99.60 N 0 8 NA 8
N 0 3,006 NA 3,006
Pittsylvania Length 0 325.25 NA 325.25 N 0 8 NA 8
N 311 1,963 29,862 32,136
Prince William Length 60.29 186.86 2,451.57 2,698.72 N 2 4 2 8
N 1,043 8,996 76,734 86,773
Southeast Agg. Length 155.50 761.38 6,343.32 7,260.20 N 4 8 4 16
N 122 665 8,912 9,699
Stafford Length 31.15 68.31 1,039.02 1,138.48 N 2 4 2 8
N 0 1,372 NA 1,372
Wise Length 0 173.69 NA 173.69 N 0 8 NA 8
N 305 1,075 NA 1,380
Wythe Length 86.94 82.81 NA 169.75 N 3 5 NA 8
N 469 3,919 31,272 35,660
York County Agg. Length 89.82 291.03 2,388.10 2,768.95 N 2 4 2 8
5 Local roads (S1400s) excluded from county aggregates not identified as part of Metropolitan Statistical Area. 6 There were no S1100 reserve locations. If one or both of these sites were untenable, replacements would be pulled from S1200 (first) then
S1400 (second), using the first replacement chosen through the sampling process described elsewhere. An ANOVA test showed that there were
no significant differences in road segment length between S1100s and either S1200s or S1400s, giving support to this replacement plan (road segment length is an important weight used in the analyses). Indeed, one of the S1100s was not viable; a S1200 was selected as its replacement
giving Bedford 1 S1100, 5 S1200, and 2 S1400 sites actually observed. NHTSA representatives were consulted prior to the plan’s deployment.

- 12 -
stand in a way to ensure the segment was observed at a unique exit ramp (e.g., segments on
HOV lanes), creating logistic and safety issues to get those segments. These locations were
abandoned for alternates. The locations of the data collection sites were described on Site
Assignment Sheets for each county and maps that were developed to aid the Data Collectors and
QC Monitors in travelling to the assigned locations.
4.2 Training
The project team recruited and hired seven Data Collectors. It recruited and hired seven QC
Monitors, some of whom were also Data Collectors, in addition to the Project Director who
acted as QC. Each QC Monitor was available to check work of any Data Collector; their
assignments were randomly determined (to a site in county) and then coordinated to be travel
efficient. For example, a QC monitor may have been randomly assigned to visit Site A
unannounced, but then visit Site B immediately thereafter because it is nearby and travel
efficient.
Data Collectors and QC Monitors were recruited by the Project Director from students or non-
students depending on resources and local/regional partnerships. Preference was given to
individuals who had experience in field data collection. They must also have been able to stand
for long periods of time, work outdoors, and successfully complete the training program. Law
enforcement personnel were not used.
Data Collector and QC Monitor training was conducted in May before data collections began in
June. It included lecture, classroom, and field exercises. The syllabus is shown as Figure 1.
At the conclusion of the training, Data Collectors and QC Monitors were given a quiz to ensure
that they understand the survey terminology, the data collection protocols, and reporting
requirements.
QC Monitors were given additional training focused on their specific duties. These included
conducting unannounced site visits to each Data Collector and reviewing the field protocol
during the visit. QC Monitors were also available during the survey to respond to questions and
offer assistance to Data Collectors as needed. As mentioned above, it was possible that a QC
Monitor acted as a Data Collector at some points of the collection period, however a Data
Collector did not also act as Quality Monitor simultaneously for a given location.
In addition, there was an “on-call supervisor” assigned to each collection day. This individual
could have been any of the QC Monitors not in the field that day. The on-call supervisor
received check-ins from collectors, and made decisions to resolve weather and reserve site
questions as relevant. Collectors checked in regularly with the on-call supervisor to ensure that
schedules were met and assigned sites were being observed when they were expected to be.
These procedures were an augmentation to basic QC Monitor activities.
- 13 -
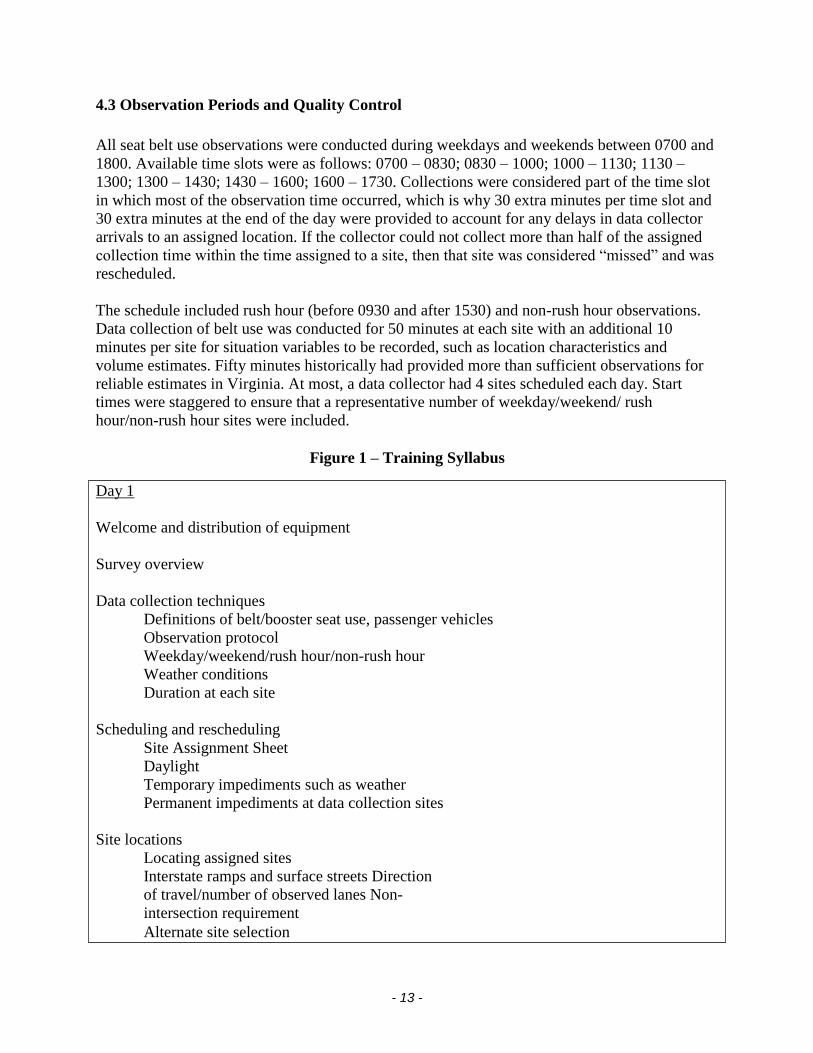
4.3 Observation Periods and Quality Control
All seat belt use observations were conducted during weekdays and weekends between 0700 and
1800. Available time slots were as follows: 0700 – 0830; 0830 – 1000; 1000 – 1130; 1130 –
1300; 1300 – 1430; 1430 – 1600; 1600 – 1730. Collections were considered part of the time slot
in which most of the observation time occurred, which is why 30 extra minutes per time slot and
30 extra minutes at the end of the day were provided to account for any delays in data collector
arrivals to an assigned location. If the collector could not collect more than half of the assigned
collection time within the time assigned to a site, then that site was considered “missed” and was
rescheduled.
The schedule included rush hour (before 0930 and after 1530) and non-rush hour observations.
Data collection of belt use was conducted for 50 minutes at each site with an additional 10
minutes per site for situation variables to be recorded, such as location characteristics and
volume estimates. Fifty minutes historically had provided more than sufficient observations for
reliable estimates in Virginia. At most, a data collector had 4 sites scheduled each day. Start
times were staggered to ensure that a representative number of weekday/weekend/ rush
hour/non-rush hour sites were included.
Figure 1 – Training Syllabus
Day 1
Welcome and distribution of equipment
Survey overview
Data collection techniques
Definitions of belt/booster seat use, passenger vehicles
Observation protocol
Weekday/weekend/rush hour/non-rush hour
Weather conditions
Duration at each site
Scheduling and rescheduling
Site Assignment Sheet
Daylight
Temporary impediments such as weather
Permanent impediments at data collection sites
Site locations
Locating assigned sites
Interstate ramps and surface streets Direction
of travel/number of observed lanes Non-
intersection requirement
Alternate site selection

- 14 -
Note that sufficient room was built into the schedule to allow for inclement weather. For
example, it was not uncommon that rain strong enough to dampen the datasheets occurred. At
that point, collectors were told to remove themselves to shelter and wait up to 15 minutes for the
weather to clear before resuming their collections. If the weather did clear, they continued
collections to obtain at least 50 minutes of observation. However, if the weather did not clear,
they worked with the “on call” supervisor assigned that day to determine if additional waiting
was possible without jeopardizing the remainder of the day (and be able to collect the remaining
sites within their assigned time periods). If they had to move on to the next site, then the
location was rescheduled. However, if at least half (i.e., 26 minutes or more) of data collection
occurred before the decision was made to move on to the next site due to weather, then that
location was considered complete and no rescheduling occurred. Eight sites were lost for rain-
related weather in 2019, but were made up during a following week on the same day of week
and time of day per protocol. In addition, one site was lost due to traffic back-ups preventing
the collector from reaching the site with enough time to complete the minimum minutes of
observation. That site, too, was made up during a following week on the same day of week and
time.
Maps showing the location of all observation sites in a county and Site Assignment Sheets were
provided to the Data Collectors and QC Monitors. These indicated the observed road name, the
crossroad included within the road segment (or nearest crossroad), assigned date, assigned time,
and direction of travel assigned. Sites within relatively close geographic proximity were
assigned as data collection clusters.
The first site within each cluster was assigned a random day and time for completion, and this
site became an “anchor site” around which the three others in the cluster were organized (each
cluster had four sites). Specifically, other sites within a cluster were assigned to the same day in
order to minimize travel costs and to time periods judiciously given travel time demands. Note
that if the first site was randomly chosen to be observed late in the day, the route organized to
collect data in the cluster may have “wrapped around” to the morning hours, such that the full
day was used. For example, if Site 1 was assigned to a start time of 1600, Site 2 was assigned to
an earlier time that same day, continuing on to the other sites in the cluster. It was possible
therefore, that Site 1 may be the last site observed in that actual day of collection depending on
Day 2
Data collection forms
Cover sheet
Recording observations
Recording alternate site information
In-field data-to-home-office reporting; rules for returning datasheets to the Project Director
Safety and security
Timesheet and expense reports
Field practice at ramps and surface streets

- 15 -
what time slot was assigned. It is also possible that time slots may not have been continuous
(every 90 minutes) if data collectors had a significant distance to travel to the next site. Travel
resources were managed to accomplish the demands of this design while being sensitive to
avoiding unnecessary costs. Time was allotted in the schedule, too, to allow data collectors to
obtain lunch among their collection commitments.
Data Collection
All passenger vehicles, including commercial vehicles weighing less than 10,000 pounds, were
eligible for observation. The data collection cover sheet and observation form are given in
Appendix C. The cover sheet was designed to allow for documentation of descriptive site
information, including: date, site location, site number, alternate site data, assigned traffic flow,
number of lanes available and observed, start and end times for observations, and weather
conditions. This cover form was completed by the Data Collector at each site.
The observation form was used to record seat belt use by drivers and front seat passengers. Other
variables of interest were recorded that have meaning to Virginia evaluations, again to use
resources efficiently. These variables included vehicle type, driver gender, and handheld mobile
phone use, but these variables were not included in calculating Virginia’s overall seat-belt use
rate. Additional observation forms could be used when more than 50 vehicles were observed at a
site, which was the maximum number that could be recorded per datasheet single page. The
forms were labeled 1 of 2, and 2 of 2, etc.
The data collector observed as many lanes of traffic as s/he could comfortably monitor while
attempting to collect complete data from vehicles chosen for belt use observations. To be
specific, for most sites we know from experience data collectors could observe all lanes and
choose a vehicle passing a fixed point, record observed data on the sheet, and look up to find the
next vehicle crossing that fixed point and to be selected for the second observation, etc. If
collectors were at a location that had a free-flowing volume, making it uncomfortable to
observe/monitor all lanes, then they had the choice to record an even amount of time for each
lane up to the 50 minutes of the observation interval. The datasheet in Appendix C showed
collectors how much time to observe each lane of traffic given the number of lanes. Clearly not
every vehicle could be observed at every site if the volume was too high or cars were following
too closely. But, these procedures produced sufficient n-size to obtain a reliable seat-belt
estimate. Only one direction of traffic was observed at any given site. This direction was pre-
determined (see Section 4.1).
Observations were made of all drivers and right front seat occupants. This included children
riding in booster seats. The only right front seat occupants excluded from this study were child
passengers who were traveling in child seats with harness straps. The basic codes in Table 4
were used to record seat belt use. These codes are those included in the datasheet shown in
Appendix C.

- 16 -
Table 4 - Seat Belt Use Codes and Definitions
Code Meaning Definition
Y Yes, belted The shoulder belt is in front of the person’s shoulder. Marked as “Y” on the datasheet.
N No, unbelted The shoulder belt is not in front of the person’s shoulder. Marked as “N” on the datasheet.
U Unknown It cannot reasonably be determined whether the driver or right front passenger is belted. Marked as “U” on the datasheet.
NP No passenger There is no right front passenger present. Marked as “NP” on the
datasheet in a special column. This is to ensure no confusion
between missing data and the notation that there were no data for the passenger to be recorded.
According to the codes and data procedures above, a right front passenger, restrained in a car
seat with harnesses would be coded as NP because collectors did not observe/record child-seat-
harnessed children in this study. Children in booster seats designed for use with regular seat
belts, who were in the outboard passenger seat, were passengers for observation.
Alternate Sites and Rescheduling
When a site was temporarily unavailable due to a crash, or inclement weather, data collection
was rescheduled for the same time of day and same day of week in the immediate future. In the
event that the site was permanently unworkable once collections began, then an alternate site,
selected as part of the reserve sample, was used as a permanent replacement (this happened
twice in 20197). The alternates for each site were clearly identified and listed on the Site
Assignment Sheet. Data Collectors were to pick the first alternative listed as it was chosen
randomly to be the first alternate. If the selected reserve was also permanently unworkable, then
the Data Collector was to use the next listed reserve site, and so forth. However, all such
decisions to move to a reserve site would have been made with the on-call supervisor, with that
supervisor having the final authority on the use of a reserve location. Note: All alternate sites
were vetted and screened before collections began; the team knew which reserve locations
could be used for permanent reasons if they arose. In fact, as noted in the Appendices, some
sites were deemed unusable before collections and alternate sites were chosen to be the new
permanent sites; those latter sites became the “original” sites to be used.
7 One location in Stafford County (STA1002) underwent construction in 2018, and in 2019 the new design rendered safe standing on the exit
ramp impossible. The data collector (with multiple years of experience) and the Project Director made the call to visit the first alternate site (STA1004), which had also undergone construction that rendered it unsafe to stand and collect. The second alternate (STA1005) was workable,
and data were collected at that location: STA1005 will be visited immediately in 2020, and if it is untenable then the 3rd alternate will be visited,
etc. In addition to Stafford, a site in Fairfax (FAI1002) was likewise under construction in 2019, creating the need to use its first alternative (FAI10010). In 2020, the original site will be revisited to check whether it can be used; if not, the alternate will be used and then if necessary
promoted to the primary location for 2021.

- 17 -
Quality Control Procedures
Each year the team plans to have the QC Monitor make unannounced visits to at least one data
collection site within each county aggregate. There are 15 county/aggregates, giving 15 sites for
the unannounced visits. This size exceeds the requirement of 5% sites being chosen at random
(minimum required = 6.8 or 7 sites). However, in 2019, a QC Monitor did not visit two of the
15 counties due to scheduling restraints. This meant we did 13 random visits, still nearly double
that required by code. However, we also spent time at second sites after the surprise visits to
ensure collectors were working well and to collect data to ensure primary collectors were seeing
what we trained them to see (another 13 sites were monitored in this latter manner).
During the surprise visits, the QC Monitor first evaluated the Data Collector’s performance
from a distance (if possible), and then worked alongside the Data Collector. The QC Monitor
ensured that the Data Collector was following all survey protocol including: being on time at
assigned sites, completing the cover sheet and observation forms, and making accurate
observations of seat belt use. The QC Monitor prepared a site visit report highlighting any
problems with data collection site locations and Data Collector performance. The Project
Director was responsible for reviewing these reports and making decisions regarding any
findings of concern.
In the event it was discovered that a Data Collector had falsified data, the Data Collector would
have been removed from the project. Another Data Collector would have replaced him/her,
returned to the falsified site, and collected new data. Further, new Data Collectors would have
revisited all sites proven to be or suspected to be falsified and recollect all data. No such
falsification was discovered in 2019.
At the end of each day, the Data Collector reported to the “on call” supervisor for the day the
number of sites completed, and the total number of data sheets collected. They did this via
email, text, or phone call. Previous experience assured the ability of collectors to do this
reporting remotely and then return the datasheets safely to the Project Director within 24 hours
of returning to home base. The Project Director and his staff reviewed the forms. If the rate of
overall seat-belt use unknowns exceeded 10% for any site (potentially leading to an overall
nonresponse rate of 10% or more), then the Project Director began preliminary plans to return to
that site to collect data for an additional period. However, if the overall unknown belt use rate
for the full project did not exceed 10%, then these return plans would not be implemented (the
rule only requires the unknown rate be less than 10% for the entire collection protocol).
Collectors would have returned to sites with the highest unknown rates for belt use for an
additional observation period, and continued this procedure until the overall unknown rate for
belt use for the full project fell below 10%. In 2019, these extra procedures were unnecessary;
the unknown rate was 7.9%.

- 18 -
5.0 Imputation, Estimation and Variance Estimation
5.0 Imputation
No imputation was performed on missing data.
5.1 Sampling Weights and Statistical Design
The following is a summary of the notations used in this section.
PSU level:
For this level, 𝑔 subscript was used for primary sampling units (PSU) strata of VMT as a
measure of size: 𝑔 goes from 1 to 3, for Low, Medium and High classes of VMT aggregated from years 2011 to 2016. A simple test was performed to show that there were exactly
significant differences among the strata. The authors used PPS design for each stratum.
Stratified sampling leads to estimates with smaller standard errors compared to a simple random
sampling.
There are 15 counties selected,
𝑐 is used for county PSU, 𝑐 goes from 1 to 15.
ℎ is for road segment strata or road type. We have 3 levels of road segments.
𝑖 is for road segment name: that is the category and the name of the road.
(ℎ, 𝑖) are nested within (𝑔, 𝑐). Such subscripts will be our variable identifier.
Because additional information is available, it was used to create a second stage sample by
drawing segment roads from the first stage sampling of the counties.
SSU level with road site:
𝑗 represents the time segment, time of day, and the day of the week.
𝑘 is for the road site direction. It has 4 levels: N, W, S, E
𝑙 for lane within road site type stratum and county
𝑚 represents the index for the number of vehicles
𝑛 represents the number of front seat occupants
𝐿 is for the road segment length in the 𝑔, 𝑐, ℎ, 𝑖 combination, we call it 𝐿𝑔𝑐ℎ𝑖. This is
available in the data set. But we will discretize it in 3 levels also for the selection of the
road types. So we will think of 𝐿𝑔𝑐ℎ𝑖 as the segment length in the 𝑔, 𝑐, ℎ, 𝑖 combination.
The sum of the road length over all the road segment names 𝑖𝑖 and road segment strata h, is
denoted as 𝐿𝑔𝑐. So 𝐿𝑔𝑐 = ∑ 𝐿𝑔𝑐ℎ𝑖ℎ𝑖 ∈𝑔𝑐 . And 𝐿𝑔 = ∑ 𝐿𝑔𝑐𝑐 ∈𝑔 .
The indices 𝑗, 𝑘, 𝑙, 𝑚, 𝑛 are nested within the index class 𝑔, 𝑐, ℎ , 𝑖, and 𝑌𝑔𝑐ℎ𝑖𝑘𝑙𝑚𝑛 is the observed
number of seat belts used (drivers and outboard front-seat passengers) from the

- 19 -
segment road of length 𝐿𝑔𝑐ℎ𝑖 described by its level,
𝑘th road site direction,
𝑙th lane,
𝑚th vehicle, and
𝑛th number of front seat occupants.
𝑌𝑔𝑐ℎ𝑖𝑘𝑙𝑚𝑛 takes values 0 or 1 or 2, because we cannot have more than 2 persons sitting in the
front seat of a vehicle or truck who are eligible for observation and wearing seat belts. So,
𝑌𝑔𝑐ℎ𝑖𝑘𝑙𝑚𝑛 is an indicator of the observed front-seat occupant (driver/passenger seat belt use
status), that is:
𝑌𝑔𝑐ℎ𝑖𝑗𝑘𝑙𝑚𝑛 = {2, if 2 persons are using the belts,
1, if 1 person is using the belt,0, otherwise.
And 𝑁𝑔𝑐ℎ𝑖𝑘𝑙𝑚𝑛 can be thought as the number of occupants (drivers and outboard front-seat
passengers) whose belt use was observed from 𝑖th road name, ℎth segment type, 𝑐th county and
𝑔th strata, and takes values 1 or 2, and is always greater or equal to 𝑌𝑔𝑐ℎ𝑖𝑘𝑙𝑚𝑛.
The second sampling units (SSU) were obtained using road segment lengths, and in a PPS
scheme. The goal was to select from each road type. Because there were at most 3 road types, the
design included all available road types in the county selected, and a PPS based on each road
type was applied on each county, after adjustment of the road segment length L as MOS. This
was accounted by classifying the road segment length into three class categories: Short, Medium,
and Long classes. This classification is effective since the strata were relatively homogeneous in
their sample sizes, and the clusters were based on the quantiles of the road segment length data.
For county aggregates in Metropolitan Statistical Areas, samples of sizes (6, 12, 6) from each
primary, secondary, and local segment class respectively, after adjustment for the three segment
length classes of low, medium, and high, were selected, and through a random mechanism were
assigned numbers to represent the order in which the segments would be chosen for observation.
The first two ordered segments in the primary road type, first 4 in the secondary, and first two in
the local were selected as the main segments to observe. The remaining segments in each road
type will be used for replacements. However, for the Southeast and Fairfax counties, instead of
samples of sizes (6, 12, 6) pulled to determine segments to observe, samples of sizes (12, 24, 12)
were pulled to result in 4 primary, 8 secondary, and 4 local segments chosen for observation,
with the remainder being replacements.
For county aggregates not in MSAs, and for whom local roads (S1400s) were excluded by
federal rule allowance, the same procedures were used to pull segments from primary (S1100)
and secondary (S1200) strata, with the allotment for local roads re-allocated across these other
road types. Therefore, for such counties that had S1100 and S1200 road types the samples were
(9, 15) with 3 primary (S1100) and 5 secondary (S1200) being selected as locations to observe,
with the remainder as reserve/alternates.

- 20 -
For any county without primary roads (S1100s), selection procedures distributed selected segment
allocations across remaining road strata. Specifically, if a county had no primary roads then a sample
of (15, 9) was selected from which 5 secondary (S1200) and 3 local (S1400) segments were sampled
for observation with the remainder being alternates. If such a county had only secondary roads
because the local roads were excluded in the non-MSA provision, then all sampled segments came
from the secondary segment strata; the sample was (24) with 8 being chosen for observation and
remainder being alternates.
The sum of all 𝑌𝑔𝑐ℎ𝑖𝑘𝑙𝑚𝑛 over all the 𝑘, 𝑙, 𝑚, 𝑛 within the 𝑔, 𝑐, ℎ, 𝑖 combination is called 𝑛𝑔𝑐ℎ𝑖. So
𝑛𝑔𝑐ℎ𝑖 can be thought as the number of belted occupants from 𝑖th road name, ℎth segment type, 𝑐th
county and 𝑔th strata.
And 𝑁𝑔𝑐ℎ𝑖 can be thought as the number of occupants (drivers and outboard front-seat passengers)
from 𝑖th road name, ℎth segment type, 𝑐th county and 𝑔th strata, that is:
𝑁𝑔𝑐ℎ𝑖 = ∑ 𝑁𝑔𝑐ℎ𝑖𝑘𝑙𝑚𝑛𝑘𝑙𝑚𝑛∈𝑔𝑐ℎ𝑖 .
In all, the following notations reflect all levels, strata, and weights to be considered in this design,
from the choice of counties and road segments through to the calculations of the seat-belt use rate.
𝑝 𝐿 𝑛 N
𝑝𝑔 𝐿𝑔 𝑁𝑔
𝑝𝑔𝑐 𝐿𝑔𝑐 𝑛𝑔𝑐
𝑝𝑔𝑐ℎ 𝐿𝑔𝑐ℎ 𝑛𝑔𝑐ℎ
𝑝𝑔𝑐ℎ𝑖 𝐿𝑔𝑐ℎ𝑖 𝑛𝑔𝑐ℎ𝑖 𝑁𝑔𝑐ℎ𝑖
For example, 𝐿𝑔𝑐ℎ𝑖 is the average of road segment lengths in 𝑔𝑡ℎ strata, 𝑐𝑡ℎ county, ℎ𝑡ℎ road type and
𝑖𝑡ℎ road segment. And 𝐿𝑔 is the average of road segment lengths in 𝑔𝑡ℎ strata, that is the average of
road lenghts 𝐿𝑔𝑐 for all 𝑐 counties in 𝑔𝑡ℎ PSU cluster for all observed roadways.
Under this stratified multistage sample design, the inclusion probability for each selected road
segment is the product of selection probabilities at two stages: 𝜋𝑔𝑐for county, 𝜋ℎ𝑖|𝑔𝑐 for road segment.
So the overall road segment inclusion probability is:
𝜋𝑔𝑐ℎ𝑖 = 𝜋𝑔𝑐𝜋ℎ𝑖|𝑔𝑐.
The sampling weight (design weight) for county 𝑔𝑐 is then:
𝑤𝑔𝑐 =1
𝜋𝑔𝑐.
The sampling weight (design weight) for road segment ℎ𝑖|𝑔𝑐 is:
𝑤ℎ𝑖|𝑔𝑐 =1
𝜋ℎ𝑖|𝑔𝑐.
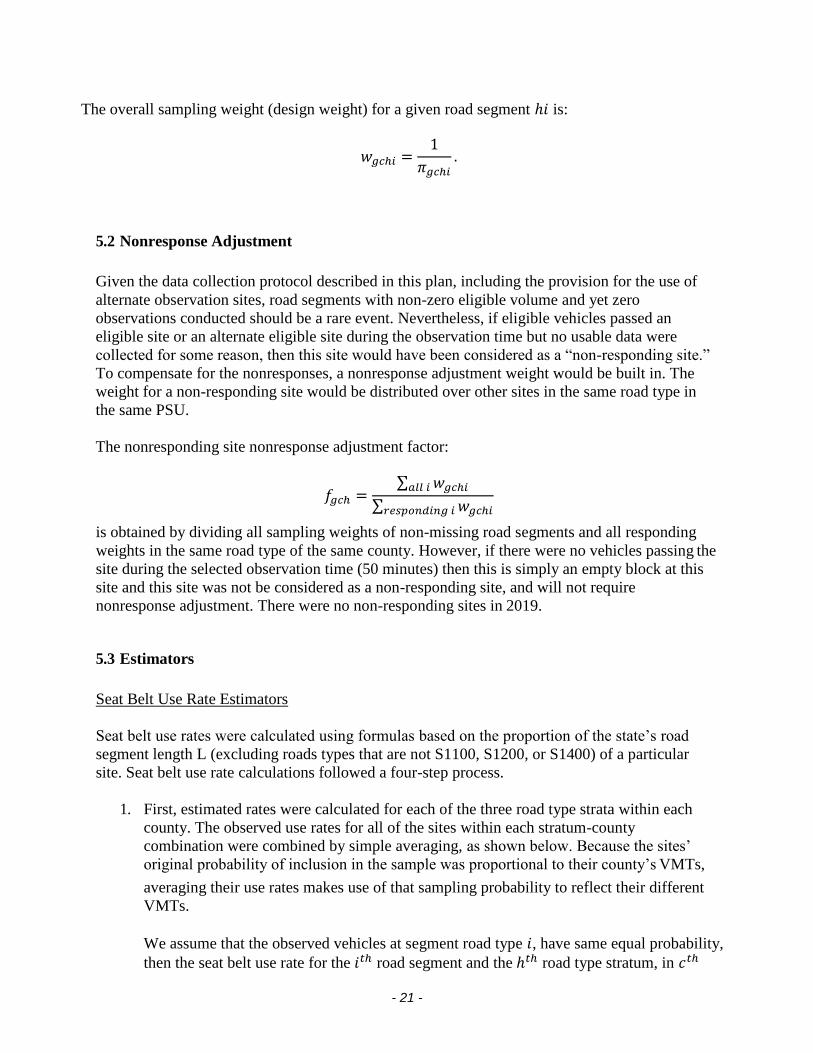
- 21 -
The overall sampling weight (design weight) for a given road segment ℎ𝑖 is:
𝑤𝑔𝑐ℎ𝑖 =1
𝜋𝑔𝑐ℎ𝑖.
5.2 Nonresponse Adjustment
Given the data collection protocol described in this plan, including the provision for the use of
alternate observation sites, road segments with non-zero eligible volume and yet zero
observations conducted should be a rare event. Nevertheless, if eligible vehicles passed an
eligible site or an alternate eligible site during the observation time but no usable data were
collected for some reason, then this site would have been considered as a “non-responding site.”
To compensate for the nonresponses, a nonresponse adjustment weight would be built in. The
weight for a non-responding site would be distributed over other sites in the same road type in
the same PSU.
The nonresponding site nonresponse adjustment factor:
𝑓𝑔𝑐ℎ =∑ 𝑤𝑔𝑐ℎ𝑖𝑎𝑙𝑙 𝑖
∑ 𝑤𝑔𝑐ℎ𝑖𝑟𝑒𝑠𝑝𝑜𝑛𝑑𝑖𝑛𝑔 𝑖
is obtained by dividing all sampling weights of non-missing road segments and all responding
weights in the same road type of the same county. However, if there were no vehicles passing the
site during the selected observation time (50 minutes) then this is simply an empty block at this
site and this site was not be considered as a non-responding site, and will not require
nonresponse adjustment. There were no non-responding sites in 2019.
5.3 Estimators
Seat Belt Use Rate Estimators
Seat belt use rates were calculated using formulas based on the proportion of the state’s road
segment length L (excluding roads types that are not S1100, S1200, or S1400) of a particular
site. Seat belt use rate calculations followed a four-step process.
1. First, estimated rates were calculated for each of the three road type strata within each
county. The observed use rates for all of the sites within each stratum-county
combination were combined by simple averaging, as shown below. Because the sites’
original probability of inclusion in the sample was proportional to their county’s VMTs,
averaging their use rates makes use of that sampling probability to reflect their different
VMTs.
We assume that the observed vehicles at segment road type 𝑖, have same equal probability,
then the seat belt use rate for the 𝑖𝑡ℎ road segment and the ℎ𝑡ℎ road type stratum, in 𝑐𝑡ℎ

- 22 -
county nested within 𝑔𝑡ℎ PSU cluster, denoted as 𝑝𝑔𝑐ℎ𝑖 is expressed as:
Formula 1:
𝑝𝑔𝑐ℎ𝑖 = ∑ 𝑌𝑔𝑐ℎ𝑖𝑘𝑙𝑚𝑛/𝑁𝑔𝑐ℎ𝑖
𝑘𝑙𝑚𝑛 ∈𝑔𝑐ℎ𝑖
=𝑛𝑔𝑐ℎ𝑖
𝑁𝑔𝑐ℎ𝑖,
where 𝑖𝑡ℎ road segment in ℎ𝑡ℎ road segment strata or road type, 𝑐𝑡ℎ county PSU and in the
𝑔𝑡ℎ PSU stratum and county,
𝑁𝑔𝑐ℎ𝑖 = number of occupants (drivers and outboard front-seat passengers) from 𝑖th road
name, ℎth segment type, 𝑐th county and 𝑔th strata.
2. Second, a county-by-county seat belt use rate, 𝑝𝑔𝑐, was obtained by combining county-
stratum seat belt use rates across strata within counties, weighted by the stratum’s relative
contribution to average county road segment length used as MOS:
Formula 2:
𝑝𝑔𝑐 =∑ 𝑤ℎ𝑖|𝑔𝑐𝐿𝑔𝑐ℎ𝑖𝑝𝑔𝑐ℎ𝑖ℎ𝑖 ∈𝑔𝑐
∑ 𝑤ℎ𝑖|𝑔𝑐𝐿𝑔𝑐ℎ𝑖ℎ𝑖 ∈𝑔𝑐,
where 𝐿𝑔𝑐ℎ𝑖 is the average of all road segment lengths in all 𝑘𝑡ℎ directions, in all 𝑙𝑡ℎ lanes for
the 𝑚𝑡ℎ vehicle nested 𝑐𝑡ℎ county nested within 𝑔𝑡ℎ VMT cluster, respectively8.
3. In the third step, weighted seat belt use rates for each VMT cluster were obtained by
combining and weighting the rates from the sampled counties in each VMT cluster by their
VMT average length values and probabilities of being selected:
Formula 3:
𝑝𝑔 =∑ 𝑤𝑔𝑐𝐿𝑔𝑐𝑝𝑔𝑐𝑖
∑ 𝑤𝑔𝑐𝐿𝑔𝑐𝑖,
where 𝐿𝑔𝑐 = the average length for cth county in gth PSU cluster for all three road types.
4. Finally, the statewide belt use rate was calculated by combining the cluster proportions
weighted by their proportion of statewide road length 𝐿:
8 The weight used in Formula 2 in section 5.4 reflects the nonresponse adjustment in section 5.3.
- 23 -
Formula 4:
𝑝 =∑ 𝐿𝑔 𝑝𝑔
3𝑔=1
∑ 𝐿𝑔3𝑔=1
,
where 𝐿𝑔 is the average of road segment lengths 𝐿𝑔𝑐 for all 𝑐 counties in 𝑔𝑡ℎ PSU cluster for
all observed roadways.
The result of Formula 4 is a weighted combination of the individual site seat belt use rates. This
estimator captures traffic volume and vehicle miles traveled through design weights (which will
include nonresponse adjustment factors as described in section 5.3, if any) at various stages and it
does not require knowledge of road segment specific VMT.
5.4 Variance Estimation
Standard error of estimate values is based on the total number of sites as 𝑛 = 136, estimated
through a jackknife approach (calculated with SAS® 9.3 software), based on the general formula:
�̂�𝑝 = [(𝑛 − 1)
𝑛 ∑(�̂�(𝑖) − �̂�)2
𝑛
𝑖=1
]
1/2
,
where �̂�𝑝 = standard deviation (standard error) of �̂� the estimated statewide seat belt use
proportion (equivalent to 𝑝 in the notation of formula 4, the overall weighted statewide belt
use rate),
𝑛 = the number of sites, i.e., 136,
and �̂�(𝑖) = the estimated statewide belt use proportion with site 𝑖 excluded from the
calculation.
The 95% confidence interval for 𝑝 is then obtained by adding and subtracting the estimate with the
margin of error 1.96�̂�𝑝 , that is: �̂� ± 1.96�̂�𝑝.
These values are reported for the overall statewide seat belt use rate.
These values are reported for the overall statewide seat belt use rate. In 2019, there were 136
sites (all of them) with non-zero observations; therefore n = 136 were available for variance
estimation.

- 24 -
6.0 Results
6.1 Overall Weighted State Rate
Overall, a weighted survey design sample of 16,629 vehicles from 136 of the 136 sites provided
known driver and/or front, outboard passenger belt use observations. In raw frequencies, there
were 20,485 occupants for whom belt use was known out of the sample of 22,244; of these
17,674 were belted. The “miss rate” or rate of “unknown” belt use (i.e., seeing an occupant but
not knowing whether he or she was buckled up) was only 7.9%, below the maximum 10%
allowed by the new federal code.
The 2019 weighted seat belt use rate, calculated with the approved methodology and
sample, was 85.4%. The unweighted use rate was 86.3% (the ratio between the raw number of
known belted occupants and the raw number of total occupants with known belt use). The latter
number does not account for the stratified random sampling used to choose the counties and road
segments (VMT levels, segment lengths, selection probabilities) under NHTSA approved
guidelines.
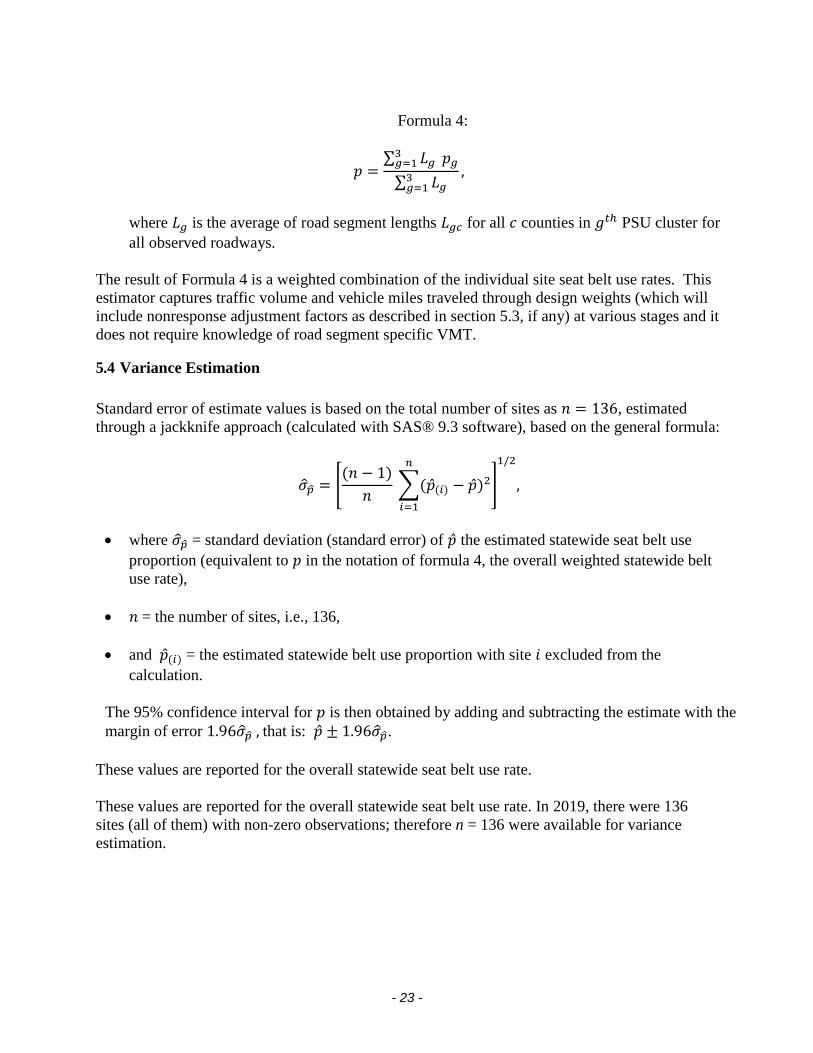
Hence the reportable number is 85.4%. This rate, and all others for Virginia calculated since
the 1980s, are given in Figure 2 (next page). However, note that the estimates for pre-2012, 2012
– 2016, and 2017 - 2019 were calculated with different guidelines and sampling strategies,
meaning a direct comparison among the three-time periods is to be cautiously undertaken.
The 95% confidence interval for the seat belt use rate was between 84.3% and 86.6%. The
error rate was 0.58%, well below the maximum 2.5% allowed by code.
6.2 Additional Data Comparisons—Descriptives
The following sections provide descriptive data to help further understand differences among the
observed occupants. These data are not mandated by federal code, but historically have provided
useful information to different groups interested in learning more about seat belt use patterns in
Virginia. The data are meant only to guide readers about patterns for comparison to past and
future reports.
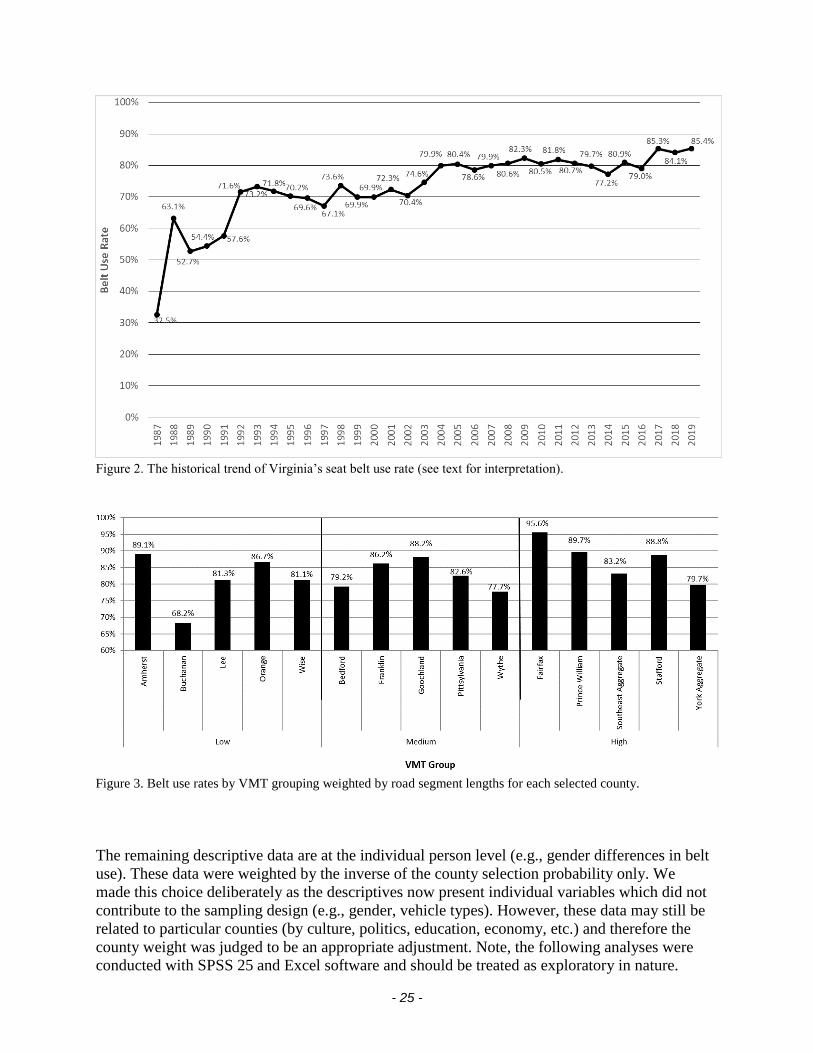
Each of these additional comparisons represented weighted data as well. Figure 3 shows the
comparisons among the 15 selected counties segregated by VMT group by road segment
lengths. In general, the high VMT group had higher belt use rates.
- 25 -
Figure 2. The historical trend of Virginia’s seat belt use rate (see text for interpretation).
Figure 3. Belt use rates by VMT grouping weighted by road segment lengths for each selected county.
The remaining descriptive data are at the individual person level (e.g., gender differences in belt
use). These data were weighted by the inverse of the county selection probability only. We
made this choice deliberately as the descriptives now present individual variables which did not
contribute to the sampling design (e.g., gender, vehicle types). However, these data may still be
related to particular counties (by culture, politics, education, economy, etc.) and therefore the
county weight was judged to be an appropriate adjustment. Note, the following analyses were
conducted with SPSS 25 and Excel software and should be treated as exploratory in nature.

- 26 -
First, we compared drivers and passengers by gender as well as by VMT grouping. Figure 4
provides the data. It was clear that women, regardless of seating position used their seat belts at
higher levels than men. Further, belt use rates for both occupant positions increased as the VMT
levels increased (across VMT groupings).
Another interesting comparison involves the role of road type. Figure 5 displays male vs. female
differences again by the three road types in this project. We found women had higher use than
men across all road types.
Finally, we inspected differences among vehicle types. Recall that we observed cars, pickup
trucks, SUVs, vans, and mini-vans. Figure 6 shows findings for vehicle type across VMT
groupings. Pickup and van occupants (with vans being more of the commercial vehicles
compared to minivans mostly used by family occupants) used belts less often than other vehicle
occupants.
Similarly, vehicle types had use rate differences when considering the two major road types of
interstate/expressways and secondary/arterials (Figure 7). Local roads are not considered here
because the sample sizes among vehicle types can be too low compared to sizes observed for the
other two road types to render appropriate estimates. Interstate/primary roads had higher use
across vehicle types; pickup and van occupants had lower use rates overall.
Figure 4. Belt use rate comparison between drivers and passengers by gender and by VMT.

- 27 -
Figure 5. Belt use by gender at the three sampled road types (local to be interpreted cautiously due to lower sample
sizes).
Figure 6. Belt use by vehicle type across VMT groups.

- 28 -
Figure 7. Belt use by vehicle type for two observed road types (note: local roads not included because of low sample
sizes limiting reliable comparisons).
7.0 Discussion
This was the third year of the current 5-year sampling plan required by the revised Uniform
Criteria approved by the National Highway Traffic Safety Administration. In 2019, more than
16,000 vehicles were observed. We met the requirements of small measurement error and small
unknown belt use recordings.
The 2019 belt use rate was 85.4%, the highest recorded in Virginia. The pattern of users and
non-users remains mostly consistent. Female belt use remained higher than that for men. Pickup
and van occupants continued to have lower belt use rates than rates for occupants in cars, SUVs,
and minivans. Counties in high VMT areas had higher observed rates, whereas low VMT
counties had the lowest observed rates. And, primary roads had more use than other types.
However, this year’s record-setting rate appeared to be the result of higher than usual belt use by
men, drivers in lower VMT areas, and perhaps to some extent drivers of pickup truck and vans
(compared to previous years’ surveys). Similarly, increased belt use rates along
arterial/secondary roads seemed to contribute to observed belt use record.

- 29 -
Appendix A: Brief Notes on Calculating the Virginia Seat Belt Use Rate (2017 - 2021)
The federally-approved protocol for calculating a point estimate of belt use requires the inclusion of the
probability of selected location or their inverse called weights. Weights are required in this case to
accurately represent the data disparities. For example, when sampling from any population, one must take
into account the fact that there may be important differences that could affect the data and therefore
should be taken into account. VMT differences are one example, and these differences could be stratified
before a sample is taken to ensure that we do not over- or under-sample different levels of VMTs. Using
VMTs then to stratify a sample and apply a VMT-based weight, as one example, allows us to reduce bias
and error in the parameter estimate of belt use. While unweighted use rates (overall, collapsed across
counties) can be useful indicators of belt use, they do not account for sampling designs. By not
accounting for sampling designs, unweighted rates can be misleading indicators of belt use. As in
previous years, a weight based on the inverse of the selection probabilities has been included.
Virginia’s sampling design is a multiple step process, and therefore has multiple weights. In the next
sections, this plan is outlined.
The federal rule requires the use of raw fatalities for sampling state areas to observe (aggregated over a
time period; VA uses 5 years). Specifically, counties/cities making up the top 85% of the fatalities must
be considered eligible for sampling.
Eligible counties were then categorized by high, medium, and low VMTs based on state data provided by
Richmond. These VMTs represent our primary sampling unit (PSU) used for weighting. Five counties
from each VMT stratum were sampled, and each county had a “probability of selection.” This probability
of selection was an important component of the weighting design.
Within each sampled county, 8 to 16 road segments were chosen. Eight segments were chosen from 13
counties, whereas 16 were chosen from Fairfax County and the Southeast Cities (the latter were
aggregated to form a “county” for historical purposes) given their VMTs. The segments were roughly
divided among three road types: primary/interstate; arterial/secondary; and local, and were
probabilistically sampled based on segment lengths. They represent our secondary sampling units (SSU).
The road types themselves have their probability of selection or weights. However, length of road
segment is also used along as an adjustment factor. In fact, road segment is used as another strata with
long, medium, and short classes. Data on segments and lengths were provided by NHTSA.
The weighted state rate is calculated in the following manner:
For each location, a score is first calculated for each vehicle observed: driver and/or passenger belted (0
to 2 maximum) and the total number of occupants recorded in that vehicle (0 to 2 maximum). An overall
rate is then calculated for the location.
A county score is then calculated by aggregating the county’s locations together and weighting by length
of road segments observed.
A VMT strata score is then calculated. To do this, counties within each VMT cluster (high, medium, and
low) are aggregated together, weighting for selection probability, average VMT, and probabilities of
selection.

- 30 -
The final, weighted state rate is calculated by combining the VMT clusters weighted within each cluster
and its proportion of road segment length.

Appendix B-1: List of Sampled Road Segments by County
Key for Unique Information (beyond that understood from segment datasets and general selection information):
Bold: Segments selected to be primary sites; non-bold: reserve. Italics sites selected as primary, but not viable per exclusion criteria.9
The main and reserve samples were selected simultaneously, and are reflected in “selection probability” and “order sort” probability, respectively. The exception to this is noted by sites and selection probabilities that are underlined; these were pulled in additional
samples required because the first pull did not generate sufficient observable locations.10
Class: Stratification by road segment length (lower, average, upper); used in PPS to wchoose segments within counties (see text).
Order Sort: Randomly generated rank to determine order that segments would be chosen; order generated within each road type.
Road Segment MOS/PSU information:
Each segment came from a County, the PSU, with the MOS based on the average 5-year VMT split into three categories (see Table 2
for selection probabilities for County). The segments were sampled with Segment Length (Miles) as the MOS. The Segment
selection probability, below, is based on segment length.
SEG
LENGTH SELECTION ORDER
COUNTY SITE_NO. TYPE TLID ROAD NAME LATITUDE LONGITUDE CLASS (MILES) PROBABILITY SORT
Amherst
AMH2001
S1200
638976325
State Rte 210
37.4143
-79.10811421
upper
0.362953704
0.018630486
0.03190685
Amherst AMH2002 S1200 613136788 Elon Rd 37.4676525 -79.137056 lower 0.026626779 0.018588336 0.23110997
Amherst AMH2003 S1200 159126300 Lexington Tpke 37.6112989 -79.07832311 lower 0.037295691 0.026036376 0.23116184
Amherst AMH2004 S1200 159128544 S Main St 37.5824439 -79.05594535 avera 0.101502114 0.009497938 0.28252432
Amherst AMH2005 S1200 159126083 S Amherst Hwy 37.4481715 -79.1201025 lower 0.027418003 0.019140695 0.35537302
9 Exclusion criteria are provided by the federal code governing sample selection; examples include private roads and cul-de-sacs, among others. 10 These selection probabilities are adjusted at the road type S1400 as 5.84*10-4, 4.24*10-4, and 3.74*10-4 for the sites Bed4007, Fai40013 and YC4009,
respectively. Note: these counties do not have listed alternate sites for S1400s in this document. Other counties below that do not have alternatives are those
requiring most of the first samples to be used to obtain sufficient primary sites. Additional alternates for counties in need have been selected and are available to
interested readers with the adjusted selection probabilities.
-31-
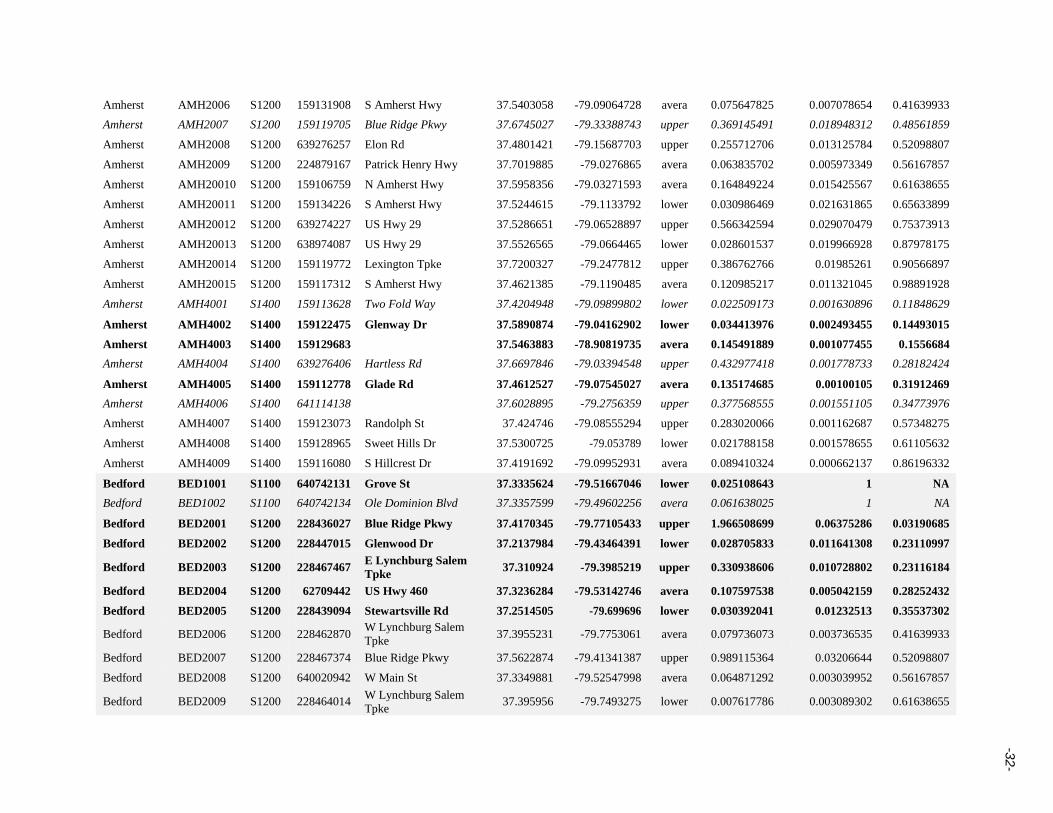
Amherst AMH2006 S1200 159131908 S Amherst Hwy 37.5403058 -79.09064728 avera 0.075647825 0.007078654 0.41639933
Amherst AMH2007 S1200 159119705 Blue Ridge Pkwy 37.6745027 -79.33388743 upper 0.369145491 0.018948312 0.48561859
Amherst AMH2008 S1200 639276257 Elon Rd 37.4801421 -79.15687703 upper 0.255712706 0.013125784 0.52098807
Amherst AMH2009 S1200 224879167 Patrick Henry Hwy 37.7019885 -79.0276865 avera 0.063835702 0.005973349 0.56167857
Amherst AMH20010 S1200 159106759 N Amherst Hwy 37.5958356 -79.03271593 avera 0.164849224 0.015425567 0.61638655
Amherst AMH20011 S1200 159134226 S Amherst Hwy 37.5244615 -79.1133792 lower 0.030986469 0.021631865 0.65633899
Amherst AMH20012 S1200 639274227 US Hwy 29 37.5286651 -79.06528897 upper 0.566342594 0.029070479 0.75373913
Amherst AMH20013 S1200 638974087 US Hwy 29 37.5526565 -79.0664465 lower 0.028601537 0.019966928 0.87978175
Amherst AMH20014 S1200 159119772 Lexington Tpke 37.7200327 -79.2477812 upper 0.386762766 0.01985261 0.90566897
Amherst AMH20015 S1200 159117312 S Amherst Hwy 37.4621385 -79.1190485 avera 0.120985217 0.011321045 0.98891928
Amherst AMH4001 S1400 159113628 Two Fold Way 37.4204948 -79.09899802 lower 0.022509173 0.001630896 0.11848629
Amherst AMH4002 S1400 159122475 Glenway Dr 37.5890874 -79.04162902 lower 0.034413976 0.002493455 0.14493015
Amherst AMH4003 S1400 159129683 37.5463883 -78.90819735 avera 0.145491889 0.001077455 0.1556684
Amherst AMH4004 S1400 639276406 Hartless Rd 37.6697846 -79.03394548 upper 0.432977418 0.001778733 0.28182424
Amherst AMH4005 S1400 159112778 Glade Rd 37.4612527 -79.07545027 avera 0.135174685 0.00100105 0.31912469
Amherst AMH4006 S1400 641114138 37.6028895 -79.2756359 upper 0.377568555 0.001551105 0.34773976
Amherst AMH4007 S1400 159123073 Randolph St 37.424746 -79.08555294 upper 0.283020066 0.001162687 0.57348275
Amherst AMH4008 S1400 159128965 Sweet Hills Dr 37.5300725 -79.053789 lower 0.021788158 0.001578655 0.61105632
Amherst AMH4009 S1400 159116080 S Hillcrest Dr 37.4191692 -79.09952931 avera 0.089410324 0.000662137 0.86196332
Bedford BED1001 S1100 640742131 Grove St 37.3335624 -79.51667046 lower 0.025108643 1 NA
Bedford BED1002 S1100 640742134 Ole Dominion Blvd 37.3357599 -79.49602256 avera 0.061638025 1 NA
Bedford BED2001 S1200 228436027 Blue Ridge Pkwy 37.4170345 -79.77105433 upper 1.966508699 0.06375286 0.03190685
Bedford BED2002 S1200 228447015 Glenwood Dr 37.2137984 -79.43464391 lower 0.028705833 0.011641308 0.23110997
Bedford BED2003 S1200 228467467 E Lynchburg Salem
Tpke 37.310924 -79.3985219 upper 0.330938606 0.010728802 0.23116184
Bedford BED2004 S1200 62709442 US Hwy 460 37.3236284 -79.53142746 avera 0.107597538 0.005042159 0.28252432
Bedford BED2005 S1200 228439094 Stewartsville Rd 37.2514505 -79.699696 lower 0.030392041 0.01232513 0.35537302
Bedford BED2006 S1200 228462870 W Lynchburg Salem
Tpke 37.3955231 -79.7753061 avera 0.079736073 0.003736535 0.41639933
Bedford BED2007 S1200 228467374 Blue Ridge Pkwy 37.5622874 -79.41341387 upper 0.989115364 0.03206644 0.52098807
Bedford BED2008 S1200 640020942 W Main St 37.3349881 -79.52547998 avera 0.064871292 0.003039952 0.56167857
Bedford BED2009 S1200 228464014 W Lynchburg Salem
Tpke 37.395956 -79.7493275 lower 0.007617786 0.003089302 0.61638655
-32-

Bedford BED20010 S1200 62709505 Peaks St 37.3541151 -79.53384492 upper 0.234897769 0.007615224 0.65633899
Bedford BED20011 S1200 62662736 W Lynchburg Salem
Tpke 37.3733425 -79.701865 lower 0.032158878 0.01304165 0.87978175
Bedford BED20012 S1200 228445418 Big Island Hwy 37.4708708 -79.45220312 avera 0.127748276 0.005986449 0.98891928
Bedford BED4001 S1400 62673596 River Falls Rd 37.2579535 -79.40137187 upper 0.270650595 0.000430428 0.11848629
Bedford BED4002 S1400 228447060 Bow Ln 37.4428953 -79.47941445 upper 0.497528864 0.000791243 0.14493015
Bedford BED4003 S1400 228443229 Happy Acres Dr 37.1578088 -79.68095658 lower 0.010964805 0.000256609 0.1556684
Bedford BED4004 S1400 228450246 37.417565 -79.73894823 avera 0.138449552 0.000363969 0.31912469
Bedford BED4005 S1400 228445267 Cove Creek Farm Rd 37.4796363 -79.30648103 lower 0.031130282 0.000728541 0.61105632
Bedford BED4006 S1400 62708686 Helm St 37.3255242 -79.51543849 avera 0.093603747 0.000246074 0.86196332
Bedford BED4007 S1400 62673187 Tolers Ferry Rd. 37.11128249 -79.5704253 upper 0.366987254 0.000583993 0.118486287
Buchanan BUC2001 S1200 74074054 State Rte 83 37.23234 -82.09957102 avera 0.017392701 0.076405575 0.03190685
Buchanan BUC2002 S1200 74077406 Riverside Dr 37.1627705 -81.88653094 upper 0.380177807 0.061612109 0.0396225
Buchanan BUC2003 S1200 74075717 Helen Henderson
Hwy 37.0830086 -82.08023395 upper 0.300048414 0.048626235 0.19359015
Buchanan BUC2004 S1200 74094954 US Hwy 460 37.1546686 -81.87691251 avera 0.139415915 0.03538261 0.23110997
Buchanan BUC2005 S1200 74077168 Riverside Dr 37.2054171 -81.97536847 avera 0.010465672 0.04597536 0.23116184
Buchanan BUC2006 S1200 74068516 Slate Creek Rd 37.3094977 -81.96515678 avera 0.084563987 0.021461643 0.28252432
Buchanan BUC2007 S1200 74088587 Riverside Dr 37.1678553 -81.90203047 avera 0.16579376 0.042077089 0.35537302
Buchanan BUC2008 S1200 74055917 Bike Rte 76 37.0933791 -82.12880863 upper 0.244450098 0.0396159 0.36011246
Buchanan BUC2009 S1200 74077234 Riverside Dr 37.1889943 -81.9517493 avera 0.062393041 0.015834839 0.41639933
Buchanan BUC20010 S1200 636662957 Riverside Dr 37.2862708 -82.12164991 upper 0.531787863 0.086182231 0.47711633
Buchanan BUC20011 S1200 74068957 Bike Rte 76 37.1090897 -82.15509272 upper 0.201219966 0.032609969 0.47869487
Buchanan BUC20012 S1200 74058579 Riverside Dr 37.1688909 -81.89436942 avera 0.019685046 0.086475771 0.48561859
Buchanan BUC20013 S1200 74051813 Riverside Dr 37.3097145 -82.142642 avera 0.013478764 0.059211778 0.52098807
Buchanan BUC20014 S1200 74053511 Riverside Dr 37.2777098 -82.09986255 avera 0.049526553 0.012569431 0.56167857
Buchanan BUC20015 S1200 74077295 Riverside Dr 37.1772712 -81.9461799 upper 0.242202656 0.039251677 0.57836555
Buchanan BUC20016 S1200 74052269 Riverside Dr 37.3551431 -82.19189574 avera 0.132946177 0.033740644 0.61638655
Buchanan BUC20017 S1200 74075718 Helen Henderson Hwy 37.0843895 -82.0824475 lower 0.005073726 0.022288716 0.65633899
Buchanan BUC20018 S1200 74081189 Helen Henderson Hwy 37.0741675 -82.05738456 upper 0.26442734 0.042853438 0.71992244
Buchanan BUC20019 S1200 74074612 Lovers Gap Rd 37.2189472 -82.10839374 avera 0.019764926 0.086826684 0.75373913
Buchanan BUC20020 S1200 74052634 Riverside Dr 37.3549016 -82.19054468 avera 0.023949375 0.105208832 0.80517307
-33-

Buchanan BUC20021 S1200 641113023 Riverside Dr 37.3134633 -82.14164077 upper 0.501399258 0.081257414 0.80579271
Buchanan BUC20022 S1200 74092667 Riverside Dr 37.1801489 -81.9452476 avera 0.168928672 0.042872704 0.87978175
Buchanan BUC20023 S1200 74054769 Riverside Dr 37.2354723 -82.04775463 avera 0.019707486 0.086574351 0.90566897
Buchanan BUC20024 S1200 640963910 Lovers Gap Rd 37.2210936 -82.14655385 avera 0.097045882 0.024629445 0.98891928
Fairfax FAI1001 S1100 76058263 I- 95 38.7933235 -77.1534825 lower 0.004202882 0.002923546 0.11006642
Fairfax FAI1002 S1100 618606286 I- 66 38.87736 -77.2752345 avera 0.022407082 0.015586481 0.11948539
Fairfax FAI1003 S1100 641379974 I- 395 38.7932355 -77.173542 avera 0.075915116 0.016550555 0.27892363
Fairfax FAI1004 S1100 215937207 I- 95 38.7950135 -77.144831 avera 0.028727194 0.019982783 0.36105045
Fairfax FAI1005 S1100 215935364 I- 395 38.79182 -77.1751495 lower 0.01353391 0.009414257 0.36951578
Fairfax FAI1006 S1100 619915918 I- 95 38.8027414 -77.10680076 upper 0.134894233 0.003937823 0.38503435
Fairfax FAI1007 S1100 75978202 I- 66 38.8928685 -77.2076815 avera 0.071722749 0.01563656 0.40091431
Fairfax FAI1008 S1100 76062245 I- 66 38.864775 -77.332146 avera 0.079851029 0.017408639 0.45462595
Fairfax FAI1009 S1100 638085763 I- 395 38.8159832 -77.13763602 avera 0.053061321 0.011568109 0.48203775
Fairfax FAI10010 S1100 634169002 I- 66 38.865758 -77.3253415 upper 0.355272276 0.010371083 0.90695158
Fairfax FAI10011 S1100 638089700 I- 495 38.8388074 -77.21915352 upper 0.202862207 0.005921939 0.93639148
Fairfax FAI10012 S1100 641096085 I- 95 38.8004736 -77.07660104 upper 0.116361069 0.003396804 0.96867874
Fairfax FAI2001 S1200 76032720 Columbia Pike 38.838299 -77.15416 avera 0.022352807 0.007538061 0.03190685
Fairfax FAI2002 S1200 76042013 Ox Rd 38.6890951 -77.25717277 upper 0.260634131 0.006463562 0.0396225
Fairfax FAI2003 S1200 215924856 Leesburg Pike 39.0038745 -77.351563 upper 0.208810202 0.005178361 0.19359015
Fairfax FAI2004 S1200 76062061 Fairfax County Pkwy 38.8583434 -77.38826794 avera 0.077720166 0.005438541 0.23110997
Fairfax FAI2005 S1200 76134853 Hillwood Ave 38.8733463 -77.15823858 avera 0.014036657 0.004733597 0.23116184
Fairfax FAI2006 S1200 624433709 Leesburg Pike 38.9474889 -77.25963607 avera 0.053758446 0.003761797 0.28252432
Fairfax FAI2007 S1200 638080358 Ox Rd 38.7846795 -77.32725857 avera 0.09234517 0.006461939 0.35537302
Fairfax FAI2008 S1200 638159569 Fairfax County Pkwy 38.9223868 -77.39595974 upper 0.151161616 0.003748713 0.36011246
Fairfax FAI2009 S1200 640095496 Chain Bridge Rd 38.8425263 -77.30896924 avera 0.044132107 0.003088185 0.41639933
Fairfax FAI20010 S1200 215975791 Dulles Access Rd 38.9431977 -77.28771058 upper 0.544081993 0.01349289 0.47711633
Fairfax FAI20011 S1200 215949747 Dulles Access Rd 38.9480429 -77.30518672 upper 0.118319681 0.002934253 0.47869487
Fairfax FAI20012 S1200 76036464 Centreville Rd 38.8133035 -77.4470745 avera 0.025728346 0.008676398 0.48561859
Fairfax FAI20013 S1200 638159285 Dulles Access Rd 38.9533065 -77.373943 avera 0.017500547 0.005901728 0.52098807
Fairfax FAI20014 S1200 76028001 Dranesville Rd 39.004225 -77.37479662 avera 0.040062845 0.002803435 0.56167857
Fairfax FAI20015 S1200 215942337 Arlington Blvd 38.8658496 -77.21103183 upper 0.150752033 0.003738555 0.57836555
-34-
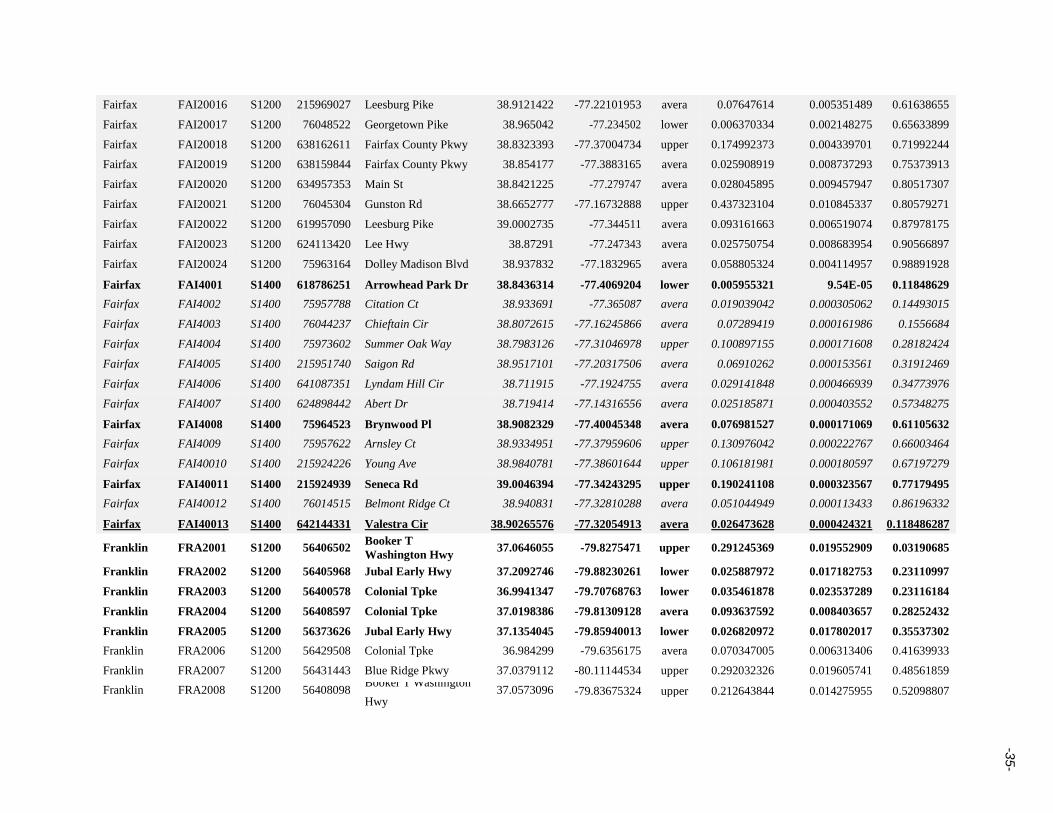
Hwy
-35-
Fairfax FAI20016 S1200 215969027 Leesburg Pike 38.9121422 -77.22101953 avera 0.07647614 0.005351489 0.61638655
Fairfax FAI20017 S1200 76048522 Georgetown Pike 38.965042 -77.234502 lower 0.006370334 0.002148275 0.65633899
Fairfax FAI20018 S1200 638162611 Fairfax County Pkwy 38.8323393 -77.37004734 upper 0.174992373 0.004339701 0.71992244
Fairfax FAI20019 S1200 638159844 Fairfax County Pkwy 38.854177 -77.3883165 avera 0.025908919 0.008737293 0.75373913
Fairfax FAI20020 S1200 634957353 Main St 38.8421225 -77.279747 avera 0.028045895 0.009457947 0.80517307
Fairfax FAI20021 S1200 76045304 Gunston Rd 38.6652777 -77.16732888 upper 0.437323104 0.010845337 0.80579271
Fairfax FAI20022 S1200 619957090 Leesburg Pike 39.0002735 -77.344511 avera 0.093161663 0.006519074 0.87978175
Fairfax FAI20023 S1200 624113420 Lee Hwy 38.87291 -77.247343 avera 0.025750754 0.008683954 0.90566897
Fairfax FAI20024 S1200 75963164 Dolley Madison Blvd 38.937832 -77.1832965 avera 0.058805324 0.004114957 0.98891928
Fairfax FAI4001 S1400 618786251 Arrowhead Park Dr 38.8436314 -77.4069204 lower 0.005955321 9.54E-05 0.11848629
Fairfax FAI4002 S1400 75957788 Citation Ct 38.933691 -77.365087 avera 0.019039042 0.000305062 0.14493015
Fairfax FAI4003 S1400 76044237 Chieftain Cir 38.8072615 -77.16245866 avera 0.07289419 0.000161986 0.1556684
Fairfax FAI4004 S1400 75973602 Summer Oak Way 38.7983126 -77.31046978 upper 0.100897155 0.000171608 0.28182424
Fairfax FAI4005 S1400 215951740 Saigon Rd 38.9517101 -77.20317506 avera 0.06910262 0.000153561 0.31912469
Fairfax FAI4006 S1400 641087351 Lyndam Hill Cir 38.711915 -77.1924755 avera 0.029141848 0.000466939 0.34773976
Fairfax FAI4007 S1400 624898442 Abert Dr 38.719414 -77.14316556 avera 0.025185871 0.000403552 0.57348275
Fairfax FAI4008 S1400 75964523 Brynwood Pl 38.9082329 -77.40045348 avera 0.076981527 0.000171069 0.61105632
Fairfax FAI4009 S1400 75957622 Arnsley Ct 38.9334951 -77.37959606 upper 0.130976042 0.000222767 0.66003464
Fairfax FAI40010 S1400 215924226 Young Ave 38.9840781 -77.38601644 upper 0.106181981 0.000180597 0.67197279
Fairfax FAI40011 S1400 215924939 Seneca Rd 39.0046394 -77.34243295 upper 0.190241108 0.000323567 0.77179495
Fairfax FAI40012 S1400 76014515 Belmont Ridge Ct 38.940831 -77.32810288 avera 0.051044949 0.000113433 0.86196332
Fairfax FAI40013 S1400 642144331 Valestra Cir 38.90265576 -77.32054913 avera 0.026473628 0.000424321 0.118486287
Franklin FRA2001 S1200 56406502 Booker T
Washington Hwy 37.0646055 -79.8275471 upper 0.291245369 0.019552909 0.03190685
Franklin FRA2002 S1200 56405968 Jubal Early Hwy 37.2092746 -79.88230261 lower 0.025887972 0.017182753 0.23110997
Franklin FRA2003 S1200 56400578 Colonial Tpke 36.9941347 -79.70768763 lower 0.035461878 0.023537289 0.23116184
Franklin FRA2004 S1200 56408597 Colonial Tpke 37.0198386 -79.81309128 avera 0.093637592 0.008403657 0.28252432
Franklin FRA2005 S1200 56373626 Jubal Early Hwy 37.1354045 -79.85940013 lower 0.026820972 0.017802017 0.35537302
Franklin FRA2006 S1200 56429508 Colonial Tpke 36.984299 -79.6356175 avera 0.070347005 0.006313406 0.41639933
Franklin FRA2007 S1200 56431443 Blue Ridge Pkwy 37.0379112 -80.11144534 upper 0.292032326 0.019605741 0.48561859
Franklin FRA2008 S1200 56408098 Booker T Washington
37.0573096 -79.83675324 upper 0.212643844 0.014275955 0.52098807
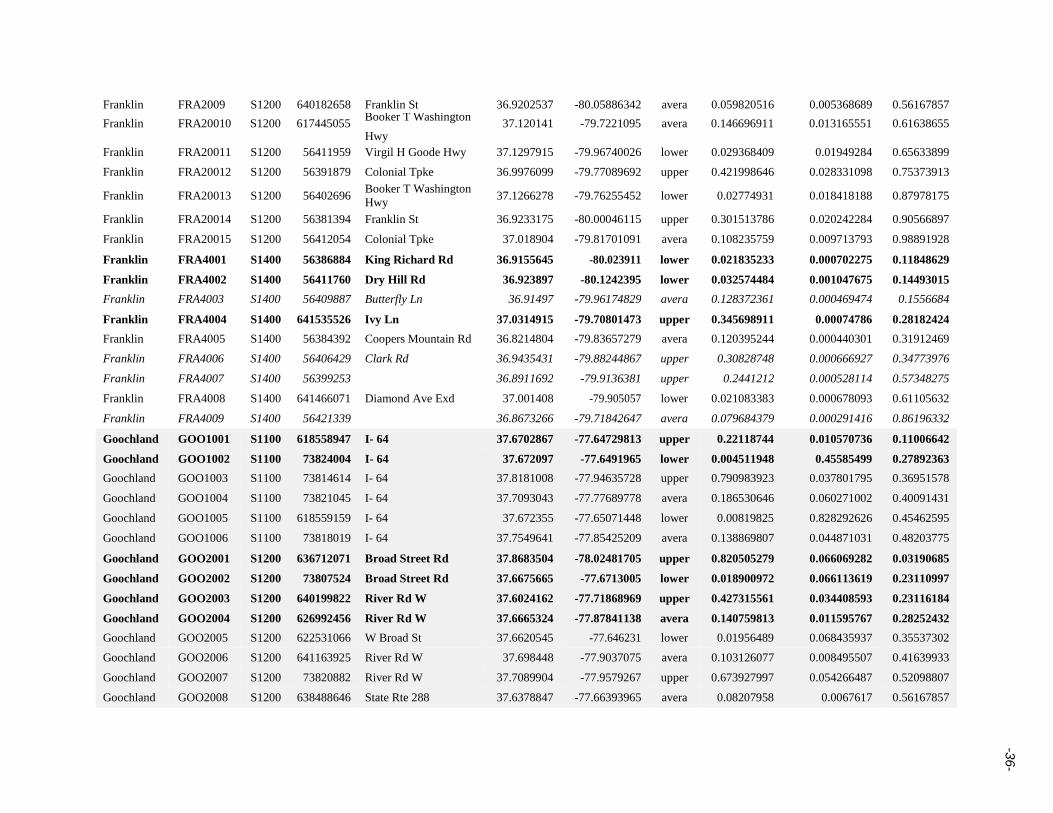
Franklin FRA2009 S1200 640182658 Franklin St 36.9202537 -80.05886342 avera 0.059820516 0.005368689 0.56167857
Franklin FRA20010 S1200 617445055 Booker T Washington
37.120141 -79.7221095 avera 0.146696911 0.013165551 0.61638655 Hwy
Franklin FRA20011 S1200 56411959 Virgil H Goode Hwy 37.1297915 -79.96740026 lower 0.029368409 0.01949284 0.65633899
Franklin FRA20012 S1200 56391879 Colonial Tpke 36.9976099 -79.77089692 upper 0.421998646 0.028331098 0.75373913
Franklin FRA20013 S1200 56402696 Booker T Washington
Hwy 37.1266278 -79.76255452 lower 0.02774931 0.018418188 0.87978175
Franklin FRA20014 S1200 56381394 Franklin St 36.9233175 -80.00046115 upper 0.301513786 0.020242284 0.90566897
Franklin FRA20015 S1200 56412054 Colonial Tpke 37.018904 -79.81701091 avera 0.108235759 0.009713793 0.98891928
Franklin FRA4001 S1400 56386884 King Richard Rd 36.9155645 -80.023911 lower 0.021835233 0.000702275 0.11848629
Franklin FRA4002 S1400 56411760 Dry Hill Rd 36.923897 -80.1242395 lower 0.032574484 0.001047675 0.14493015
Franklin FRA4003 S1400 56409887 Butterfly Ln 36.91497 -79.96174829 avera 0.128372361 0.000469474 0.1556684
Franklin FRA4004 S1400 641535526 Ivy Ln 37.0314915 -79.70801473 upper 0.345698911 0.00074786 0.28182424
Franklin FRA4005 S1400 56384392 Coopers Mountain Rd 36.8214804 -79.83657279 avera 0.120395244 0.000440301 0.31912469
Franklin FRA4006 S1400 56406429 Clark Rd 36.9435431 -79.88244867 upper 0.30828748 0.000666927 0.34773976
Franklin FRA4007 S1400 56399253 36.8911692 -79.9136381 upper 0.2441212 0.000528114 0.57348275
Franklin FRA4008 S1400 641466071 Diamond Ave Exd 37.001408 -79.905057 lower 0.021083383 0.000678093 0.61105632
Franklin FRA4009 S1400 56421339 36.8673266 -79.71842647 avera 0.079684379 0.000291416 0.86196332
Goochland GOO1001 S1100 618558947 I- 64 37.6702867 -77.64729813 upper 0.22118744 0.010570736 0.11006642
Goochland GOO1002 S1100 73824004 I- 64 37.672097 -77.6491965 lower 0.004511948 0.45585499 0.27892363
Goochland GOO1003 S1100 73814614 I- 64 37.8181008 -77.94635728 upper 0.790983923 0.037801795 0.36951578
Goochland GOO1004 S1100 73821045 I- 64 37.7093043 -77.77689778 avera 0.186530646 0.060271002 0.40091431
Goochland GOO1005 S1100 618559159 I- 64 37.672355 -77.65071448 lower 0.00819825 0.828292626 0.45462595
Goochland GOO1006 S1100 73818019 I- 64 37.7549641 -77.85425209 avera 0.138869807 0.044871031 0.48203775
Goochland GOO2001 S1200 636712071 Broad Street Rd 37.8683504 -78.02481705 upper 0.820505279 0.066069282 0.03190685
Goochland GOO2002 S1200 73807524 Broad Street Rd 37.6675665 -77.6713005 lower 0.018900972 0.066113619 0.23110997
Goochland GOO2003 S1200 640199822 River Rd W 37.6024162 -77.71868969 upper 0.427315561 0.034408593 0.23116184
Goochland GOO2004 S1200 626992456 River Rd W 37.6665324 -77.87841138 avera 0.140759813 0.011595767 0.28252432
Goochland GOO2005 S1200 622531066 W Broad St 37.6620545 -77.646231 lower 0.01956489 0.068435937 0.35537302
Goochland GOO2006 S1200 641163925 River Rd W 37.698448 -77.9037075 avera 0.103126077 0.008495507 0.41639933
Goochland GOO2007 S1200 73820882 River Rd W 37.7089904 -77.9579267 upper 0.673927997 0.054266487 0.52098807
Goochland GOO2008 S1200 638488646 State Rte 288 37.6378847 -77.66393965 avera 0.08207958 0.0067617 0.56167857
-36-
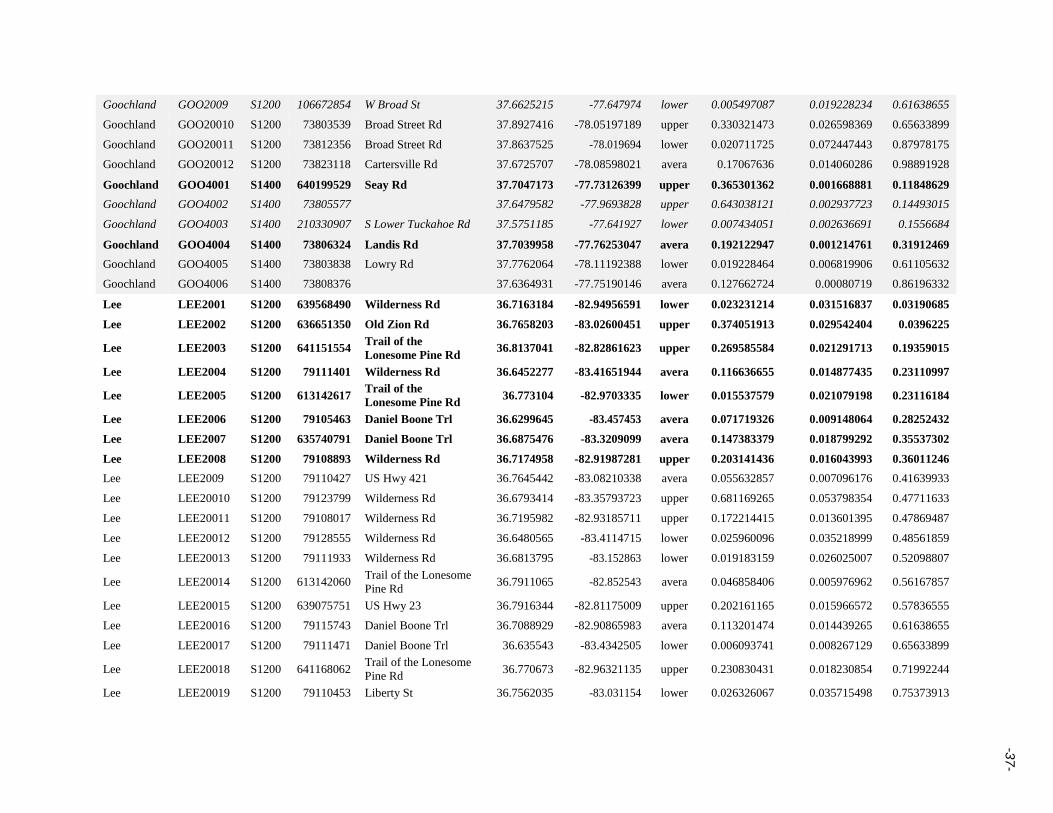
Goochland GOO2009 S1200 106672854 W Broad St 37.6625215 -77.647974 lower 0.005497087 0.019228234 0.61638655
Goochland GOO20010 S1200 73803539 Broad Street Rd 37.8927416 -78.05197189 upper 0.330321473 0.026598369 0.65633899
Goochland GOO20011 S1200 73812356 Broad Street Rd 37.8637525 -78.019694 lower 0.020711725 0.072447443 0.87978175
Goochland GOO20012 S1200 73823118 Cartersville Rd 37.6725707 -78.08598021 avera 0.17067636 0.014060286 0.98891928
Goochland GOO4001 S1400 640199529 Seay Rd 37.7047173 -77.73126399 upper 0.365301362 0.001668881 0.11848629
Goochland GOO4002 S1400 73805577 37.6479582 -77.9693828 upper 0.643038121 0.002937723 0.14493015
Goochland GOO4003 S1400 210330907 S Lower Tuckahoe Rd 37.5751185 -77.641927 lower 0.007434051 0.002636691 0.1556684
Goochland GOO4004 S1400 73806324 Landis Rd 37.7039958 -77.76253047 avera 0.192122947 0.001214761 0.31912469
Goochland GOO4005 S1400 73803838 Lowry Rd 37.7762064 -78.11192388 lower 0.019228464 0.006819906 0.61105632
Goochland GOO4006 S1400 73808376 37.6364931 -77.75190146 avera 0.127662724 0.00080719 0.86196332
Lee LEE2001 S1200 639568490 Wilderness Rd 36.7163184 -82.94956591 lower 0.023231214 0.031516837 0.03190685
Lee LEE2002 S1200 636651350 Old Zion Rd 36.7658203 -83.02600451 upper 0.374051913 0.029542404 0.0396225
Lee LEE2003 S1200 641151554 Trail of the
Lonesome Pine Rd 36.8137041 -82.82861623 upper 0.269585584 0.021291713 0.19359015
Lee LEE2004 S1200 79111401 Wilderness Rd 36.6452277 -83.41651944 avera 0.116636655 0.014877435 0.23110997
Lee LEE2005 S1200 613142617 Trail of the
Lonesome Pine Rd 36.773104 -82.9703335 lower 0.015537579 0.021079198 0.23116184
Lee LEE2006 S1200 79105463 Daniel Boone Trl 36.6299645 -83.457453 avera 0.071719326 0.009148064 0.28252432
Lee LEE2007 S1200 635740791 Daniel Boone Trl 36.6875476 -83.3209099 avera 0.147383379 0.018799292 0.35537302
Lee LEE2008 S1200 79108893 Wilderness Rd 36.7174958 -82.91987281 upper 0.203141436 0.016043993 0.36011246
Lee LEE2009 S1200 79110427 US Hwy 421 36.7645442 -83.08210338 avera 0.055632857 0.007096176 0.41639933
Lee LEE20010 S1200 79123799 Wilderness Rd 36.6793414 -83.35793723 upper 0.681169265 0.053798354 0.47711633
Lee LEE20011 S1200 79108017 Wilderness Rd 36.7195982 -82.93185711 upper 0.172214415 0.013601395 0.47869487
Lee LEE20012 S1200 79128555 Wilderness Rd 36.6480565 -83.4114715 lower 0.025960096 0.035218999 0.48561859
Lee LEE20013 S1200 79111933 Wilderness Rd 36.6813795 -83.152863 lower 0.019183159 0.026025007 0.52098807
Lee LEE20014 S1200 613142060 Trail of the Lonesome
Pine Rd 36.7911065 -82.852543 avera 0.046858406 0.005976962 0.56167857
Lee LEE20015 S1200 639075751 US Hwy 23 36.7916344 -82.81175009 upper 0.202161165 0.015966572 0.57836555
Lee LEE20016 S1200 79115743 Daniel Boone Trl 36.7088929 -82.90865983 avera 0.113201474 0.014439265 0.61638655
Lee LEE20017 S1200 79111471 Daniel Boone Trl 36.635543 -83.4342505 lower 0.006093741 0.008267129 0.65633899
Lee LEE20018 S1200 641168062 Trail of the Lonesome
Pine Rd 36.770673 -82.96321135 upper 0.230830431 0.018230854 0.71992244
Lee LEE20019 S1200 79110453 Liberty St 36.7562035 -83.031154 lower 0.026326067 0.035715498 0.75373913
-37-

Lee LEE20020 S1200 79106602 US Hwy 23 36.7842135 -82.817685 lower 0.028646035 0.038862903 0.80517307
Lee LEE20021 S1200 639567982 US Hwy 23 36.7642217 -82.82175545 upper 0.62654266 0.049483977 0.80579271
Lee LEE20022 S1200 79095646 Daniel Boone Trl 36.6957324 -83.27592469 avera 0.149162261 0.019026195 0.87978175
Lee LEE20023 S1200 79117889 Wilderness Rd 36.7037417 -82.97972918 lower 0.025989288 0.035258604 0.90566897
Lee LEE20024 S1200 79093817 Saint Charles Rd 36.7782048 -83.05889414 avera 0.082626802 0.010539353 0.98891928
Orange ORA2001 S1200 29887611 Zachary Taylor Hwy 38.3033175 -77.956217 lower 0.042837466 0.059669152 0.03190685
Orange ORA2002 S1200 29893313 Germanna Hwy 38.3407743 -77.74132977 upper 0.419404978 0.059573428 0.0396225
Orange ORA2003 S1200 29893039 Constitution Hwy 38.3136214 -77.77186659 upper 0.36275702 0.051526998 0.19359015
Orange ORA2004 S1200 29889177 Spotswood Trl 38.1837675 -78.29349596 avera 0.163743981 0.034895605 0.23110997
Orange ORA2005 S1200 29884689 Constitution Hwy 38.2582325 -78.001646 lower 0.030412442 0.042362091 0.23116184
Orange ORA2006 S1200 29879552 Caroline St 38.236914 -78.11161157 avera 0.109614447 0.023360019 0.28252432
Orange ORA2007 S1200 29891561 Zachary Taylor Hwy 38.3200295 -77.95593454 avera 0.202730458 0.043204043 0.35537302
Orange ORA2008 S1200 29878573 Constitution Hwy 38.2237762 -78.21711261 upper 0.298230903 0.042361532 0.36011246
Orange ORA2009 S1200 29902465 James Madison Hwy 38.2218587 -78.1245782 avera 0.084162486 0.017935932 0.41639933
Orange ORA20010 S1200 641044702 Constitution Hwy 38.2242937 -78.18449069 upper 0.636443474 0.090402169 0.47711633
Orange ORA20011 S1200 29888110 Constitution Hwy 38.24134 -78.13471135 upper 0.245473236 0.034867689 0.47869487
Orange ORA20012 S1200 29888805 Constitution Hwy 38.3257648 -77.72854815 lower 0.047536685 0.066214787 0.48561859
Orange ORA20013 S1200 29892573 James Madison Hwy 38.1921174 -78.13690352 lower 0.036889742 0.051384451 0.52098807
Orange ORA20014 S1200 29878358 Blue Ridge Tpke 38.1637978 -78.20283115 avera 0.075585862 0.016108161 0.56167857
Orange ORA20015 S1200 29892291 Germanna Hwy 38.330286 -77.73372115 upper 0.295856331 0.042024241 0.57836555
Orange ORA20016 S1200 29893293 Constitution Hwy 38.2436697 -78.07216274 avera 0.162369915 0.034602777 0.61638655
Orange ORA20017 S1200 29892632 Spotswood Trl 38.1800583 -78.29029305 lower 0.011427218 0.015917198 0.65633899
Orange ORA20018 S1200 29890602 Zachary Taylor Hwy 38.1556 -77.92847596 upper 0.321637207 0.045686227 0.71992244
Orange ORA20019 S1200 29889130 Blue Ridge Tpke 38.2018493 -78.21725087 lower 0.048192103 0.067127732 0.75373913
Orange ORA20020 S1200 29897721 Spotswood Trl 38.1456526 -78.20174596 lower 0.051303101 0.071461103 0.80517307
Orange ORA20021 S1200 613320626 Germanna Hwy 38.3415827 -77.74200695 upper 0.536693573 0.076233421 0.80579271
Orange ORA20022 S1200 29893784 Zachary Taylor Hwy 38.209943 -77.94495458 avera 0.203408524 0.043348546 0.87978175
Orange ORA20023 S1200 29897264 Germanna Hwy 38.3571863 -77.75764559 lower 0.048016301 0.066882853 0.90566897
Orange ORA20024 S1200 29898539 Constitution Hwy 38.2691925 -77.936459 avera 0.119753422 0.025520743 0.98891928
Pittsylvania PIT2001 S1200 56666990 Memorial Dr 36.5924221 -79.39979996 lower 0.033378697 0.014382406 0.03190685
Pittsylvania PIT2002 S1200 56628668 W Gretna Rd 36.9450919 -79.48446513 upper 0.333944563 0.015283052 0.0396225
-38-

William
William
William
William
William
William
-39-
Pittsylvania PIT2003 S1200 639776771 Memorial Dr 36.5799591 -79.42776684 upper 0.284294841 0.013010821 0.19359015
Pittsylvania PIT2004 S1200 56648651 S Boston Hwy 36.5809515 -79.3035235 avera 0.120399878 0.007303737 0.23110997
Pittsylvania PIT2005 S1200 56665770 Westover Dr 36.604767 -79.509079 lower 0.022908524 0.009870957 0.23116184
Pittsylvania PIT2006 S1200 56631708 US Hwy 29 36.7617505 -79.389487 avera 0.079049801 0.004795345 0.28252432
Pittsylvania PIT2007 S1200 56640334 US Hwy 29 36.7901144 -79.39377952 avera 0.150188031 0.009110756 0.35537302
Pittsylvania PIT2008 S1200 56601586 Martinsville Hwy 36.6365663 -79.66548545 upper 0.211139589 0.009662853 0.36011246
Pittsylvania PIT2009 S1200 56601975 Franklin Tpke 36.7331118 -79.55810004 avera 0.064002731 0.003882555 0.41639933
Pittsylvania PIT20010 S1200 56654252 US Hwy 29 37.0901779 -79.33238513 upper 0.810379504 0.03708721 0.47711633
Pittsylvania PIT20011 S1200 56668862 Central Blvd 36.5994246 -79.41653482 upper 0.17852501 0.008170239 0.47869487
Pittsylvania PIT20012 S1200 56630344 E Gretna Rd 36.970134 -79.120175 lower 0.036517855 0.015735024 0.48561859
Pittsylvania PIT20013 S1200 56647988 Martinsville Hwy 36.624093 -79.625192 lower 0.027952299 0.012044248 0.52098807
Pittsylvania PIT20014 S1200 56666483 Riverside Dr 36.5930527 -79.41457663 avera 0.057736707 0.003502443 0.56167857
Pittsylvania PIT20015 S1200 56631537 Callands Rd 36.8363615 -79.44273006 upper 0.210844689 0.009649357 0.57836555
Pittsylvania PIT20016 S1200 56668671 Memorial Dr 36.5879674 -79.41186904 avera 0.117582793 0.007132846 0.61638655
Pittsylvania PIT20017 S1200 226676300 Martinsville Hwy 36.604158 -79.5195755 lower 0.009281276 0.00399917 0.65633899
Pittsylvania PIT20018 S1200 56628348 W Gretna Rd 36.9540874 -79.39314496 upper 0.235554453 0.010780205 0.71992244
Pittsylvania PIT20019 S1200 56589041 Franklin Tpke 36.626662 -79.3881645 lower 0.037000484 0.015942982 0.75373913
Pittsylvania PIT20020 S1200 56631573 Main St 36.8279612 -79.39780939 lower 0.039997869 0.017234513 0.80517307
Pittsylvania PIT20021 S1200 56640625 Callands Rd 36.7897389 -79.6322809 upper 0.622485284 0.028488187 0.80579271
Pittsylvania PIT20022 S1200 56598387 Main St 36.831985 -79.39640875 avera 0.152488389 0.009250301 0.87978175
Pittsylvania PIT20023 S1200 56665044 S Boston Rd 36.580998 -79.3171625 lower 0.03653679 0.015743183 0.90566897
Pittsylvania PIT20024 S1200 613148594 Danville Expy 36.5456175 -79.43854515 avera 0.086175711 0.00522762 0.98891928
Prince PR1001
S1100 207154534 I- 95 38.5939562 -77.31580556 upper 0.35041009 0.012659327 0.11006642
Prince PR1002
S1100 207169922 I- 95 38.5800205 -77.323149 lower 0.005937401 0.023255326 0.27892363
Prince PR1003
S1100 207176374 I- 95 38.66864 -77.26690931 upper 0.720703849 0.026036995 0.36951578
Prince PR1004
S1100 207174223 I- 66 38.8218437 -77.67885354 avera 0.097861387 0.044312523 0.40091431
Prince PR1005
S1100 207148462 I- 66 38.8178125 -77.6400205 lower 0.012652902 0.04955828 0.45462595
Prince PR1006
S1100 207176990 I- 95 38.6696118 -77.25978465 avera 0.076332375 0.034563991 0.48203775

William
William
William
William
William
William
William
William
William
William
William
William
William
William
William
William
William
William
-40-
Prince PR2001
S1200 207141465 Prince William Pkwy 38.7605793 -77.5314893 upper 0.898776193 0.028764506 0.03190685
Prince PR2002
S1200 76529628 Prince William Pkwy 38.681209 -77.35995 lower 0.012118881 0.019641619 0.23110997
Prince PR2003
S1200 207159052 Lee Hwy 38.8039154 -77.58179377 upper 0.274591829 0.008788059 0.23116184
Prince PR2004
S1200 207177401 James Madison Hwy 38.8381635 -77.63477118 avera 0.077290945 0.005203746 0.28252432
Prince PR2005
S1200 619935094 Main St 38.553493 -77.33334 lower 0.01261957 0.020453109 0.35537302
Prince PR2006
S1200 207171330 James Madison Hwy 38.8196302 -77.63750768 avera 0.053866666 0.003626666 0.41639933
Prince PR2007
S1200 207166925 Dumfries Rd 38.7136805 -77.45861933 upper 0.531240853 0.017001875 0.52098807
Prince PR2008
S1200 207174419 Prince William Pkwy 38.7669795 -77.5349795 avera 0.0442043 0.002976131 0.56167857
Prince PR2009
S1200 207154816 Sudley Rd 38.852267 -77.5615665 lower 0.005344159 0.008661521 0.61638655
Prince PR20010 S1200 207152786 Main St 38.554894 -77.33394369 upper 0.192104759 0.006148136 0.65633899
Prince PR20011 S1200 207179591 Prince William Pkwy 38.709858 -77.409973 lower 0.013104946 0.021239779 0.87978175
Prince PR20012 S1200 76510150 Jefferson Davis Hwy 38.551427 -77.3335675 avera 0.091378602 0.006152222 0.98891928
Prince PR4001
S1400 76507780 Carrageen Dr 38.6612978 -77.40386283 upper 0.185325789 0.000270445 0.11848629
Prince PR4002
S1400 635411970 Vandor Ln 38.8022353 -77.51789401 upper 0.36465177 0.000532135 0.14493015
Prince PR4003
S1400 207169584
38.540206 -77.32656 lower 0.006698438 0.000488282 0.1556684
Prince PR4004
S1400 207164958 Sudley Manor Dr 38.7911273 -77.48446135 avera 0.097691488 0.000185441 0.31912469
Prince PR4005
S1400 76513942 Flowerree Ln 38.733696 -77.4723735 lower 0.013011647 0.000948483 0.61105632
Prince PR4006
S1400 634507164 Smoketown Rd 38.6523735 -77.303645 avera 0.063536806 0.000120608 0.86196332
Southeast SE1001 S1100 613347996 I- 664 36.893481 -76.426665 lower 0.005069974 0.004487068 0.11006642
Southeast SE1002 S1100 121771408 I- 464 36.7780965 -76.281336 avera 0.021470107 0.019001641 0.11948539
Southeast SE1003 S1100 638977323 I- 64 36.9172658 -76.26765271 avera 0.081952484 0.023130838 0.27892363
Southeast SE1004 S1100 638976348 I- 64 36.844786 -76.1963925 avera 0.030377714 0.02688512 0.36105045
Southeast SE1005 S1100 122151432 I- 264 36.8448535 -76.267721 lower 0.012703793 0.011243209 0.36951578
Southeast SE1006 S1100 639820800 I- 64 36.9487291 -76.26599051 upper 0.15460124 0.004520389 0.38503435
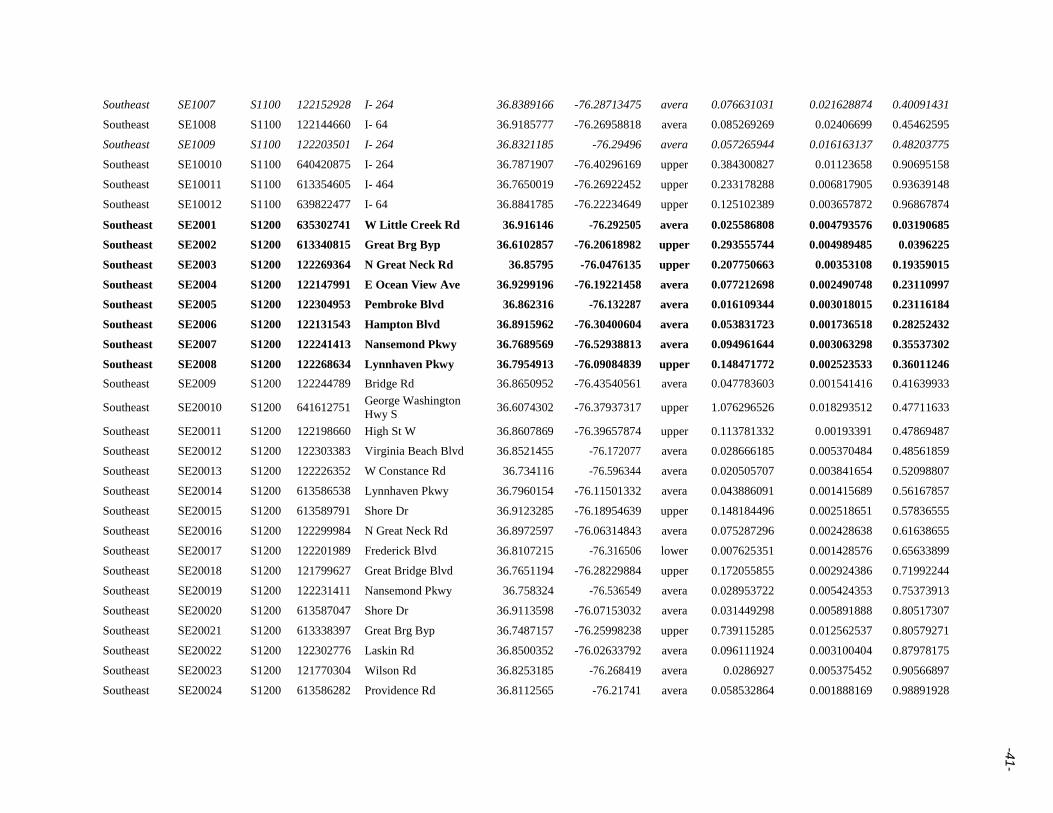
Southeast SE1007 S1100 122152928 I- 264 36.8389166 -76.28713475 avera 0.076631031 0.021628874 0.40091431
Southeast SE1008 S1100 122144660 I- 64 36.9185777 -76.26958818 avera 0.085269269 0.02406699 0.45462595
Southeast SE1009 S1100 122203501 I- 264 36.8321185 -76.29496 avera 0.057265944 0.016163137 0.48203775
Southeast SE10010 S1100 640420875 I- 264 36.7871907 -76.40296169 upper 0.384300827 0.01123658 0.90695158
Southeast SE10011 S1100 613354605 I- 464 36.7650019 -76.26922452 upper 0.233178288 0.006817905 0.93639148
Southeast SE10012 S1100 639822477 I- 64 36.8841785 -76.22234649 upper 0.125102389 0.003657872 0.96867874
Southeast SE2001 S1200 635302741 W Little Creek Rd 36.916146 -76.292505 avera 0.025586808 0.004793576 0.03190685
Southeast SE2002 S1200 613340815 Great Brg Byp 36.6102857 -76.20618982 upper 0.293555744 0.004989485 0.0396225
Southeast SE2003 S1200 122269364 N Great Neck Rd 36.85795 -76.0476135 upper 0.207750663 0.00353108 0.19359015
Southeast SE2004 S1200 122147991 E Ocean View Ave 36.9299196 -76.19221458 avera 0.077212698 0.002490748 0.23110997
Southeast SE2005 S1200 122304953 Pembroke Blvd 36.862316 -76.132287 avera 0.016109344 0.003018015 0.23116184
Southeast SE2006 S1200 122131543 Hampton Blvd 36.8915962 -76.30400604 avera 0.053831723 0.001736518 0.28252432
Southeast SE2007 S1200 122241413 Nansemond Pkwy 36.7689569 -76.52938813 avera 0.094961644 0.003063298 0.35537302
Southeast SE2008 S1200 122268634 Lynnhaven Pkwy 36.7954913 -76.09084839 upper 0.148471772 0.002523533 0.36011246
Southeast SE2009 S1200 122244789 Bridge Rd 36.8650952 -76.43540561 avera 0.047783603 0.001541416 0.41639933
Southeast SE20010 S1200 641612751 George Washington
Hwy S 36.6074302 -76.37937317 upper 1.076296526 0.018293512 0.47711633
Southeast SE20011 S1200 122198660 High St W 36.8607869 -76.39657874 upper 0.113781332 0.00193391 0.47869487
Southeast SE20012 S1200 122303383 Virginia Beach Blvd 36.8521455 -76.172077 avera 0.028666185 0.005370484 0.48561859
Southeast SE20013 S1200 122226352 W Constance Rd 36.734116 -76.596344 avera 0.020505707 0.003841654 0.52098807
Southeast SE20014 S1200 613586538 Lynnhaven Pkwy 36.7960154 -76.11501332 avera 0.043886091 0.001415689 0.56167857
Southeast SE20015 S1200 613589791 Shore Dr 36.9123285 -76.18954639 upper 0.148184496 0.002518651 0.57836555
Southeast SE20016 S1200 122299984 N Great Neck Rd 36.8972597 -76.06314843 avera 0.075287296 0.002428638 0.61638655
Southeast SE20017 S1200 122201989 Frederick Blvd 36.8107215 -76.316506 lower 0.007625351 0.001428576 0.65633899
Southeast SE20018 S1200 121799627 Great Bridge Blvd 36.7651194 -76.28229884 upper 0.172055855 0.002924386 0.71992244
Southeast SE20019 S1200 122231411 Nansemond Pkwy 36.758324 -76.536549 avera 0.028953722 0.005424353 0.75373913
Southeast SE20020 S1200 613587047 Shore Dr 36.9113598 -76.07153032 avera 0.031449298 0.005891888 0.80517307
Southeast SE20021 S1200 613338397 Great Brg Byp 36.7487157 -76.25998238 upper 0.739115285 0.012562537 0.80579271
Southeast SE20022 S1200 122302776 Laskin Rd 36.8500352 -76.02633792 avera 0.096111924 0.003100404 0.87978175
Southeast SE20023 S1200 121770304 Wilson Rd 36.8253185 -76.268419 avera 0.0286927 0.005375452 0.90566897
Southeast SE20024 S1200 613586282 Providence Rd 36.8112565 -76.21741 avera 0.058532864 0.001888169 0.98891928
-41-

Southeast SE4001 S1400 122237851 Great Fork Rd 36.5856605 -76.670177 lower 0.006834537 7.56E-05 0.11848629
Southeast SE4002 S1400 122128377 Jacob St 36.8435945 -76.26518505 avera 0.021749537 0.000240614 0.14493015
Southeast SE4003 S1400 122261900 80th St 36.905055 -75.99192 avera 0.073423895 0.000125544 0.1556684
Southeast SE4004 S1400 121789201 Still-Harbor Cir 36.7646026 -76.22321843 upper 0.104941206 0.000115245 0.28182424
Southeast SE4005 S1400 122309036 36.783729 -76.08062668 avera 0.069555001 0.000118929 0.31912469
Southeast SE4006 S1400 122296442 Halter Dr 36.7883677 -76.15262329 avera 0.032051893 0.000354589 0.34773976
Southeast SE4007 S1400 122283512 Essex Pond Quay 36.8120115 -76.10707724 avera 0.027786601 0.000307402 0.57348275
Southeast SE4008 S1400 122261495 36.9281243 -76.02348954 avera 0.077762466 0.000132962 0.61105632
Southeast SE4009 S1400 122257247 Air Rail Ave 36.8997452 -76.18633193 upper 0.144728431 0.000158939 0.66003464
Southeast SE40010 S1400 122264028 Baxter Rd 36.8258005 -76.146185 upper 0.11178053 0.000122756 0.67197279
Southeast SE40011 S1400 121791597 Saddlehorn Dr 36.6950512 -76.10500229 upper 0.24280472 0.000266645 0.77179495
Southeast SE40012 S1400 122192451 Loudoun Ave 36.8272 -76.3430215 avera 0.051887327 8.87E-05 0.86196332
Stafford STA1001 S1100 25569761 I- 95 38.4345447 -77.41649333 upper 0.43435972 0.030168376 0.11006642
Stafford STA1002 S1100 25571142 I- 95 38.3273195 -77.5016315 lower 0.005013219 0.067146071 0.27892363
Stafford STA1003 S1100 615457223 I- 95 38.4919301 -77.38664124 upper 1.020007946 0.070844468 0.36951578
Stafford STA1004 S1100 615454740 I- 95 38.4508898 -77.4087133 avera 0.138633132 0.125914891 0.40091431
Stafford STA1005 S1100 635808099 I- 95 38.3259491 -77.50139014 lower 0.018874818 0.252805635 0.45462595
Stafford STA1006 S1100 25576205 I- 95 38.381639 -77.452246 avera 0.094457812 0.085792227 0.48203775
Stafford STA2001 S1200 636653529 Kings Hwy 38.2550867 -77.37836448 upper 0.627910241 0.063937985 0.03190685
Stafford STA2002 S1200 638880177 Warrenton Rd 38.37369 -77.5316605 lower 0.015650619 0.055246328 0.23110997
Stafford STA2003 S1200 635808337 Warrenton Rd 38.4048403 -77.57992175 upper 0.302619631 0.030814738 0.23116184
Stafford STA2004 S1200 636655765 Jefferson Davis Hwy 38.5070346 -77.37256665 avera 0.103874324 0.014897554 0.28252432
Stafford STA2005 S1200 638662118 Warrenton Rd 38.361211 -77.5203205 lower 0.016071621 0.056732453 0.35537302
Stafford STA2006 S1200 25556913 White Oak Rd 38.3106795 -77.43862593 avera 0.067642327 0.009701196 0.41639933
Stafford STA2007 S1200 635809454 Warrenton Rd 38.3987483 -77.56049289 upper 0.421666893 0.042936919 0.52098807
Stafford STA2008 S1200 636653019 Cambridge St 38.3236587 -77.46863496 avera 0.05423177 0.007777868 0.56167857
Stafford STA2009 S1200 25578934 Warrenton Rd 38.3646475 -77.5217565 lower 0.007042336 0.024859285 0.61638655
Stafford STA20010 S1200 25582290 Warrenton Rd 38.4004048 -77.56598997 upper 0.234337991 0.023861848 0.65633899
Stafford STA20011 S1200 25571389 Warrenton Rd 38.333572 -77.479891 lower 0.016983567 0.059951601 0.87978175
Stafford STA20012 S1200 636822789 Kings Hwy 38.2705558 -77.42031508 avera 0.125291729 0.017969217 0.98891928
Stafford STA4001 S1400 636655896 Holly Corner Rd 38.3519888 -77.5859956 upper 0.274333461 0.000913473 0.11848629
-42-

Stafford STA4002 S1400 635808840 Stableside Ln 38.2868596 -77.37778941 upper 0.531921398 0.001771188 0.14493015
Stafford STA4003 S1400 25572121 Ferry Rd 38.296793 -77.4465665 lower 0.007243451 0.001595655 0.1556684
Stafford STA4004 S1400 632545602 Running Brook Ct 38.3732197 -77.32789094 avera 0.138740182 0.000646347 0.31912469
Stafford STA4005 S1400 25576609 Brooke Rd 38.3781355 -77.356652 lower 0.016748963 0.003689618 0.61105632
Stafford STA4006 S1400 25557057 Jefferson St 38.2947786 -77.43487119 avera 0.088649171 0.000412989 0.86196332
Wise WIS2001 S1200 641467079 Dungannon Rd 36.9299631 -82.45700313 avera 0.022729735 0.036017194 0.03190685
Wise WIS2002 S1200 225725104 Norton Coeburn Rd 36.9347953 -82.54371784 upper 0.447185309 0.027875833 0.0396225
Wise WIS2003 S1200 83457528 Orby Cantrell Hwy 37.0688079 -82.60045073 upper 0.347574692 0.021666486 0.19359015
Wise WIS2004 S1200 83467626 Laurel Ave 36.9583266 -82.47132124 avera 0.098449649 0.019541054 0.23110997
Wise WIS2005 S1200 225719919 Orby Cantrell Hwy 37.143085 -82.621357 avera 0.014436222 0.022875419 0.23116184
Wise WIS2006 S1200 83472775 Kentucky Ave SE 36.942024 -82.5924085 avera 0.06054492 0.012017428 0.28252432
Wise WIS2007 S1200 83437671 N Inman St 36.9090204 -82.7982549 avera 0.122785372 0.024371398 0.35537302
Wise WIS2008 S1200 225719703 Orby Cantrell Hwy 37.0455211 -82.60025143 upper 0.229918468 0.014332244 0.36011246
Wise WIS2009 S1200 83448053 Orby Cantrell Hwy 37.0000089 -82.59310779 avera 0.047159097 0.009360505 0.41639933
Wise WIS20010 S1200 83437321 Callahan Ave 36.9326155 -82.79762563 upper 1.064079292 0.06633066 0.47711633
Wise WIS20011 S1200 83468723 Cranes Nest Rd 37.0509612 -82.49526467 upper 0.162012088 0.010099218 0.47869487
Wise WIS20012 S1200 83437604 Callahan Ave 36.9251152 -82.79787406 avera 0.025553681 0.040491977 0.48561859
Wise WIS20013 S1200 83453094 E Main St 36.906222 -82.7815775 avera 0.017982382 0.028494611 0.52098807
Wise WIS20014 S1200 225716426 Kent Junction Rd 36.9211537 -82.74820963 avera 0.040497424 0.008038245 0.56167857
Wise WIS20015 S1200 83452234 Orby Cantrell Hwy 37.1549341 -82.6308987 upper 0.227640854 0.014190266 0.57836555
Wise WIS20016 S1200 613926228 US Hwy 58 Alt 36.9407812 -82.46380965 avera 0.094658692 0.018788595 0.61638655
Wise WIS20017 S1200 83467828 Bull Run Rd 36.929981 -82.382378 lower 0.006694586 0.01060814 0.65633899
Wise WIS20018 S1200 83473052 Norton Coeburn Rd 36.9392575 -82.6061288 upper 0.283731088 0.017686718 0.71992244
Wise WIS20019 S1200 613150452 Orby Cantrell Hwy 36.9427711 -82.6134743 avera 0.026051147 0.041280254 0.75373913
Wise WIS20020 S1200 83473214 Orby Cantrell Hwy 36.9389028 -82.61337767 avera 0.027560186 0.043671454 0.80517307
Wise WIS20021 S1200 225728547 State Rte 361 37.1140587 -82.54266619 upper 0.923656812 0.057577256 0.80579271
Wise WIS20022 S1200 83468169 Cranes Nest Rd 36.9780277 -82.47417669 avera 0.123792652 0.024571331 0.87978175
Wise WIS20023 S1200 225720369 US Hwy 58 Alt 36.9431293 -82.41947763 avera 0.025612727 0.04058554 0.90566897
Wise WIS20024 S1200 83450868 Laurel Ave 36.951003 -82.47105469 avera 0.067736779 0.013444924 0.98891928
Wythe WYT1001 S1100 47651907 I- 77 36.9458465 -80.9489035 avera 0.012956939 0.055103455 0.11006642
Wythe WYT1002 S1100 47666702 I- 77 36.9985803 -81.08593107 upper 0.437295696 0.016070476 0.11948539
-43-

Wythe WYT1003 S1100 47663240 I- 81 36.9676785 -80.849794 avera 0.119388135 0.077839822 0.27892363
Wythe WYT1004 S1100 47662941 I- 81 36.913678 -81.28315598 upper 0.584894851 0.021494697 0.36105045
Wythe WYT1005 S1100 47669774 I- 77 36.9449531 -80.95329475 avera 0.024166659 0.102776315 0.36951578
Wythe WYT1006 S1100 47666880 I- 77 36.9458538 -81.0468663 avera 0.110459486 0.072018436 0.40091431
Wythe WYT1007 S1100 47651964 I- 81 36.9468452 -80.89985445 lower 0.011789687 0.050139353 0.45462595
Wythe WYT1008 S1100 47641093 I- 77 36.947679 -81.05182714 avera 0.076747874 0.050038816 0.48203775
Wythe WYT1009 S1100 47669782 I- 81 36.9574447 -81.10748758 upper 0.657610077 0.024166958 0.96867874
Wythe WYT2001 S1200 47658436 W Lee Hwy 36.9294444 -81.18473588 upper 0.24956983 0.032970739 0.03190685
Wythe WYT2002 S1200 47657355 W Lee Hwy 36.901469 -81.31782 avera 0.021141323 0.020487991 0.23110997
Wythe WYT2003 S1200 47656402 Wysor Hwy 36.9241468 -80.79795427 avera 0.030075934 0.029146496 0.23116184
Wythe WYT2004 S1200 47644031 Sheffey School Rd 36.8855349 -80.99120395 avera 0.076097305 0.009558885 0.28252432
Wythe WYT2005 S1200 47657434 Grayson Tpke 36.9066245 -81.1082495 avera 0.022344886 0.02165436 0.35537302
Wythe WYT2006 S1200 47668258 W Lee Hwy 36.9421325 -81.14639059 avera 0.057539627 0.007227781 0.41639933
Wythe WYT2007 S1200 47652415 Fort Chiswell Rd 36.9219739 -80.93437267 upper 0.251333723 0.033203767 0.48561859
Wythe WYT2008 S1200 636652115 Fort Chiswell Rd 36.9033734 -80.91936501 upper 0.19469111 0.025720696 0.52098807
Wythe WYT2009 S1200 47645434 Wysor Hwy 36.9003995 -80.7948295 avera 0.04875338 0.006124106 0.56167857
Wythe WYT20010 S1200 47643371 E Main St 36.9516592 -81.07031617 avera 0.122773497 0.015422067 0.61638655
Wythe WYT20011 S1200 47638594 State Rte 100 36.918565 -80.8057745 avera 0.025708483 0.024914012 0.65633899
Wythe WYT20012 S1200 47652134 Fort Chiswell Rd 36.8890401 -80.90680318 upper 0.46172394 0.060998476 0.75373913
Wythe WYT20013 S1200 47656363 Wysor Hwy 36.8981755 -80.7921705 avera 0.024084073 0.023339801 0.87978175
Wythe WYT20014 S1200 47659258 Fort Chiswell Rd 36.8771893 -80.88761392 upper 0.256227569 0.033850294 0.90566897
Wythe WYT20015 S1200 47652036 Fort Chiswell Rd 36.936802 -80.9442685 avera 0.08933481 0.0112217 0.98891928
York YC1001 S1100 639791849 I- 664 36.9702104 -76.41724231 upper 0.376094544 0.009159609 0.11006642
York YC1002 S1100 223122166 I- 64 37.2609965 -76.64828 lower 0.009008519 0.010866545 0.27892363
York YC1003 S1100 639794272 I- 64 37.1553932 -76.53836645 upper 1.027219527 0.025017458 0.36951578
York YC1004 S1100 103816587 I- 64 37.0885105 -76.458455 avera 0.088344244 0.029257638 0.40091431
York YC1005 S1100 239687893 I- 64 37.02017 -76.3280695 avera 0.024825609 0.029945945 0.45462595
York YC1006 S1100 103805323 I- 64 37.0334387 -76.38330188 avera 0.065803023 0.02179249 0.48203775
York YC2001 S1200 638661489 George Washington
Memorial Hwy 37.208838 -76.51091774 upper 0.985410666 0.024551887 0.03190685
York YC2002 S1200 103760701 N Mallory St 37.036163 -76.3004565 avera 0.026011878 0.005969453 0.23110997
-44-

York YC2003 S1200 103820961 Jefferson Ave 37.092686 -76.486467 upper 0.215442676 0.005367838 0.23116184
York YC2004 S1200 103746512 Victoria Blvd 36.9964868 -76.39399698 avera 0.068836957 0.002435558 0.28252432
York YC2005 S1200 239687157 W Mercury Blvd 37.027536 -76.428305 avera 0.02701248 0.00619908 0.35537302
York YC2006 S1200 223115758 George Washington
Memorial Hwy 37.1342835 -76.4576845 avera 0.054119501 0.001914831 0.41639933
York YC2007 S1200 103771696 State Rte 132 37.2919753 -76.69276338 upper 0.426566574 0.010628071 0.52098807
York YC2008 S1200 103824053 Jefferson Ave 37.0264937 -76.44889927 avera 0.048913878 0.001730648 0.56167857
York YC2009 S1200 103821314 Jefferson Ave 37.109933 -76.4974155 lower 0.007692676 0.001765388 0.61638655
York YC20010 S1200 639736598 State Rte 199 37.3516959 -76.7342223 upper 0.158762557 0.00395563 0.65633899
York YC20011 S1200 223119989 State Rte 199 37.3526585 -76.7313775 avera 0.028161938 0.006462869 0.87978175
York YC20012 S1200 635294983 Pocahontas Trl 37.2366529 -76.63391531 avera 0.081808874 0.002894524 0.98891928
York YC4001 S1400 103746690 20th St 36.9813013 -76.40922993 upper 0.167058758 0.000251381 0.11848629
York YC4002 S1400 103796239 E Rochambeau Dr 37.3419804 -76.74422242 upper 0.354394143 0.000533272 0.14493015
York YC4003 S1400 103810746 37.037932 -76.327961 lower 0.010388742 0.000150234 0.1556684
York YC4004 S1400 103800452 Valentine Ct 37.0616717 -76.44618164 avera 0.088552486 0.000192366 0.31912469
York YC4005 S1400 103821472 Susan Constant Dr 37.1414557 -76.55159374 avera 0.027831744 0.00040248 0.61105632
York YC4006 S1400 103758686 Bridge St 37.0194474 -76.345264 avera 0.062138682 0.000134987 0.86196332
York YC4007 S1400 103823894 37.00073428 -76.41220373 upper .233466779 --- ---
York YC4008 S1400 225656496 Brigstock Cir. 37.08288832 -76.47076355 upper .249833184 --- ---
York YC4009 S1400 103759416 37.065229 -76.3288625 avera 0.016556269 0.000374444 0.155668397
-45-

Appendix B-2: List of Viable Observation Road Segments by County
Key for Unique Information (beyond that understood from segment datasets and general selection information):
Bold: Segments selected to be primary sites AND observed; non-bold: reserve sites. Note: this list contains only those sites that can
be observed per the selection process. Appendix B-1 is the comprehensive list of all sampled location, viable or not.
COUNTY
SITE_NO.
TYPE
TLID
ROAD NAME
PARKING
LATITUDE
PARKING
LONGITUDE
Amherst
AMH2001
S1200
638976325
State Rte 210
37.41539
-79.11067
Amherst AMH2002 S1200 613136788 Elon Rd 37.46671 -79.13572
Amherst AMH2003 S1200 159126300 Lexington Tpke 37.61117 -79.07817
Amherst AMH2004 S1200 159128544 S Main St 37.57525 -79.05710
Amherst AMH2005 S1200 159126083 S Amherst Hwy 37.45089 -79.12078
Amherst AMH2006 S1200 159131908 S Amherst Hwy 37.53960 -79.09106
Amherst AMH2008 S1200 639276257 Elon Rd 37.47630 -79.15395
Amherst AMH2009 S1200 224879167 Patrick Henry Hwy 37.70479 -79.02579
Amherst AMH20010 S1200 159106759 N Amherst Hwy 37.59739 -79.03345
Amherst AMH20011 S1200 159134226 S Amherst Hwy 37.52713 -79.10815
Amherst AMH20012 S1200 639274227 US Hwy 29 37.46301 -79.08595
Amherst AMH20013 S1200 638974087 US Hwy 29 37.55846 -79.06361
Amherst AMH20014 S1200 159119772 Lexington Tpke 37.72304 -79.24911
Amherst AMH20015 S1200 159117312 S Amherst Hwy 37.46075 -79.11918
Amherst AMH4002 S1400 159122475 Glenway Dr 37.58772 -79.03890
Amherst AMH4003 S1400 159129683 37.54910 -78.91945
Amherst AMH4005 S1400 159112778 Glade Rd 37.46116 -79.06973
Amherst AMH4007 S1400 159123073 Randolph St 37.42622 -79.08745
Amherst AMH4008 S1400 159128965 Sweet Hills Dr 37.53284 -79.05534
Amherst AMH4009 S1400 159116080 S Hillcrest Dr 37.41843 -79.09927
Bedford BED1001 S1100 640742131 Grove St 37.33339 -79.51684
-46-

Bedford BED2001 S1200 228436027 Blue Ridge Pkwy 37.42458 -79.75719
Bedford BED2002 S1200 228447015 Glenwood Dr 37.21397 -79.43506
Bedford BED2003 S1200 228467467 E Lynchburg Salem Tpke 37.30851 -79.39294
Bedford BED2004 S1200 62709442 US Hwy 460 37.33533 -79.54332
Bedford BED2005 S1200 228439094 Stewartsville Rd 37.25129 -79.69843
Bedford BED2006 S1200 228462870 W Lynchburg Salem Tpke 37.39591 -79.77227
Bedford BED2007 S1200 228467374 Blue Ridge Pkwy 37.55883 -79.42773
Bedford BED2008 S1200 640020942 W Main St 37.33515 -79.52606
Bedford BED2009 S1200 228464014 W Lynchburg Salem Tpke 37.39634 -79.74983
Bedford BED20010 S1200 62709505 Peaks St 37.35623 -79.53663
Bedford BED20011 S1200 62662736 W Lynchburg Salem Tpke 37.37189 -79.69977
Bedford BED20012 S1200 228445418 Big Island Hwy 37.46911 -79.45266
Bedford BED4006 S1400 62708686 Helm St 37.32584 -79.51612
Bedford BED4007 S1400 62673187 Tolers Ferry Rd. 37.11303 -79.57106
Buchanan BUC2001 S1200 74074054 State Rte 83 37.22950 -82.09997
Buchanan BUC2002 S1200 74077406 Riverside Dr 37.15832 -81.87849
Buchanan BUC2003 S1200 74075717 Helen Henderson Hwy 37.08461 -82.08317
Buchanan BUC2004 S1200 74094954 US Hwy 460 37.15527 -81.87717
Buchanan BUC2005 S1200 74077168 Riverside Dr 37.20464 -81.97242
Buchanan BUC2006 S1200 74068516 Slate Creek Rd 37.31128 -81.95975
Buchanan BUC2007 S1200 74088587 Riverside Dr 37.16795 -81.90265
Buchanan BUC2008 S1200 74055917 Bike Rte 76 37.09347 -82.12891
Buchanan BUC2009 S1200 74077234 Riverside Dr 37.19178 -81.95261
Buchanan BUC20010 S1200 636662957 Riverside Dr 37.28661 -82.12352
Buchanan BUC20011 S1200 74068957 Bike Rte 76 37.10991 -82.15656
Buchanan BUC20012 S1200 74058579 Riverside Dr 37.16889 -81.89449
Buchanan BUC20013 S1200 74051813 Riverside Dr 37.30972 -82.14266
Buchanan BUC20014 S1200 74053511 Riverside Dr 37.27733 -82.09974
Buchanan BUC20015 S1200 74077295 Riverside Dr 37.18149 -81.94531
Buchanan BUC20016 S1200 74052269 Riverside Dr 37.35422 -82.18932
Buchanan BUC20017 S1200 74075718 Helen Henderson Hwy 37.08461 -82.08317
-47-

Buchanan BUC20018 S1200 74081189 Helen Henderson Hwy 37.07383 -82.05650
Buchanan BUC20019 S1200 74074612 Lovers Gap Rd 37.21468 -82.11205
Buchanan BUC20020 S1200 74052634 Riverside Dr 37.35422 -82.18932
Buchanan BUC20021 S1200 641113023 Riverside Dr 37.30969 -82.14264
Buchanan BUC20022 S1200 74092667 Riverside Dr 37.17522 -81.94639
Buchanan BUC20023 S1200 74054769 Riverside Dr 37.23430 -82.04372
Buchanan BUC20024 S1200 640963910 Lovers Gap Rd 37.22076 -82.14787
Fairfax FAI1001 S1100 76058263 I- 95 38.79517 -77.13895
Fairfax FAI1002 S1100 618606286 I- 66 38.87030 -77.30592
Fairfax FAI1008 S1100 76062245 I- 66 38.86364 -77.34848
Fairfax FAI1009 S1100 638085763 I- 395 38.81574 -77.139731
Fairfax FAI10010 S1100 634169002 I- 66 38.86643 -77.31033
Fairfax FAI10011 S1100 638089700 I- 495 38.83677 -77.21880
Fairfax FAI10012 S1100 641096085 I- 95 38.80169 -77.07763
Fairfax FAI2001 S1200 76032720 Columbia Pike 38.83770 -77.15549
Fairfax FAI2002 S1200 76042013 Ox Rd 38.69358 -77.25571
Fairfax FAI2003 S1200 215924856 Leesburg Pike 39.005751 -77.354438
Fairfax FAI2004 S1200 76062061 Fairfax County Pkwy 38.85650 -77.38888
Fairfax FAI2005 S1200 76134853 Hillwood Ave 38.873562 -77.159116
Fairfax FAI2006 S1200 624433709 Leesburg Pike 38.94688 -77.25900
Fairfax FAI2007 S1200 638080358 Ox Rd 38.78222 -77.32749
Fairfax FAI2008 S1200 638159569 Fairfax County Pkwy 38.92297 -77.39560
Fairfax FAI2009 S1200 640095496 Chain Bridge Rd 38.84197 -77.30927
Fairfax FAI20012 S1200 76036464 Centreville Rd 38.81332 -77.44665
Fairfax FAI20013 S1200 638159285 Dulles Access Rd 38.95900 -77.44493
Fairfax FAI20014 S1200 76028001 Dranesville Rd 39.00388 -77.37466
Fairfax FAI20015 S1200 215942337 Arlington Blvd 38.86584 -77.21133
Fairfax FAI20016 S1200 215969027 Leesburg Pike 38.91193 -77.22126
Fairfax FAI20017 S1200 76048522 Georgetown Pike 38.96358 -77.23101
Fairfax FAI20018 S1200 638162611 Fairfax County Pkwy 38.83294 -77.37068
Fairfax FAI20019 S1200 638159844 Fairfax County Pkwy 38.85432 -77.38837
-48-

Fairfax FAI20020 S1200 634957353 Main St 38.84165 -77.28102
Fairfax FAI20021 S1200 76045304 Gunston Rd 38.66540 -77.16747
Fairfax FAI20022 S1200 619957090 Leesburg Pike 39.00020 -77.34378
Fairfax FAI20023 S1200 624113420 Lee Hwy 38.87322 -77.24759
Fairfax FAI20024 S1200 75963164 Dolley Madison Blvd 38.93750 -77.18369
Fairfax FAI4001 S1400 618786251 Arrowhead Park Dr 38.84465 -77.40588
Fairfax FAI4008 S1400 75964523 Brynwood Pl 38.90849 -77.40060
Fairfax FAI40011 S1400 215924939 Seneca Rd 39.00326 -77.34277
Fairfax FAI40013 S1400 642144331 Valestra Cir. 38.90266 -77.32056
Franklin FRA2001 S1200 56406502 Booker T Washington Hwy 37.06245 -79.82841
Franklin FRA2002 S1200 56405968 Jubal Early Hwy 37.20888 -79.88219
Franklin FRA2003 S1200 56400578 Colonial Tpke 36.99336 -79.71397
Franklin FRA2004 S1200 56408597 Colonial Tpke 37.02010 -79.81224
Franklin FRA2005 S1200 56373626 Jubal Early Hwy 37.13370 -79.85561
Franklin FRA2006 S1200 56429508 Colonial Tpke 36.98427 -79.63637
Franklin FRA2007 S1200 56431443 Blue Ridge Pkwy 37.03603 -80.10981
Franklin FRA2008 S1200 56408098 Booker T Washington Hwy 37.05317 -79.84113
Franklin FRA2009 S1200 640182658 Franklin St 36.91779 -80.06322
Franklin FRA20010 S1200 617445055 Booker T Washington Hwy 37.12040 -79.72210
Franklin FRA20011 S1200 56411959 Virgil H Goode Hwy 37.13065 -79.96889
Franklin FRA20012 S1200 56391879 Colonial Tpke 36.99598 -79.77052
Franklin FRA20013 S1200 56402696 Booker T Washington Hwy 37.12620 -79.76345
Franklin FRA20014 S1200 56381394 Franklin St 36.92311 -80.00095
Franklin FRA20015 S1200 56412054 Colonial Tpke 37.01922 -79.81533
Franklin FRA4001 S1400 56386884 King Richard Rd 36.91556 -80.02388
Franklin FRA4002 S1400 56411760 Dry Hill Rd 36.91732 -80.12637
Franklin FRA4004 S1400 641535526 Ivy Ln 37.03150 -79.70808
Franklin FRA4005 S1400 56384392 Coopers Mountain Rd 36.82225 -79.83571
Franklin FRA4008 S1400 641466071 Diamond Ave Exd 37.00116 -79.90488
Goochland GOO1001 S1100 618558947 I- 64 37.67153 -77.65241
Goochland GOO1002 S1100 73824004 I- 64 37.67089 -77.64575
-49-

Goochland GOO1003 S1100 73814614 I- 64 37.84287 -77.97970
Goochland GOO1004 S1100 73821045 I- 64 37.71065 -77.78046
Goochland GOO1005 S1100 618559159 I- 64 37.68250 -77.66609
Goochland GOO1006 S1100 73818019 I- 64 37.78221 -77.88609
Goochland GOO2001 S1200 636712071 Broad Street Rd 37.86373 -78.01954
Goochland GOO2002 S1200 73807524 Broad Street Rd 37.66758 -77.67227
Goochland GOO2003 S1200 640199822 River Rd W 37.60055 -77.71528
Goochland GOO2004 S1200 626992456 River Rd W 37.66839 -77.88136
Goochland GOO2005 S1200 622531066 W Broad St 37.65895 -77.63452
Goochland GOO2006 S1200 641163925 River Rd W 37.69889 -77.90878
Goochland GOO2007 S1200 73820882 River Rd W 37.70898 -77.95817
Goochland GOO2008 S1200 638488646 State Rte 288 37.66243 -77.65345
Goochland GOO20010 S1200 73803539 Broad Street Rd 37.88799 -78.04678
Goochland GOO20011 S1200 73812356 Broad Street Rd 37.86373 -78.01954
Goochland GOO20012 S1200 73823118 Cartersville Rd 37.67464 -78.08488
Goochland GOO4001 S1400 640199529 Seay Rd 37.70366 -77.72826
Goochland GOO4004 S1400 73806324 Landis Rd 37.70446 -77.76418
Goochland GOO4005 S1400 73803838 Lowry Rd 37.77732 -78.11069
Goochland GOO4006 S1400 73808376 37.63855 -77.75239
Lee LEE2001 S1200 639568490 Wilderness Rd 36.71693 -82.94869
Lee LEE2002 S1200 636651350 Old Zion Rd 36.76574 -83.02685
Lee LEE2003 S1200 641151554 Trail of the Lonesome Pine Rd 36.81777 -82.82590
Lee LEE2004 S1200 79111401 Wilderness Rd 36.64777 -83.41193
Lee LEE2005 S1200 613142617 Trail of the Lonesome Pine Rd 36.77042 -82.96538
Lee LEE2006 S1200 79105463 Daniel Boone Trl 36.62994 -83.45760
Lee LEE2007 S1200 635740791 Daniel Boone Trl 36.68830 -83.31812
Lee LEE2008 S1200 79108893 Wilderness Rd 36.71639 -82.92389
Lee LEE2009 S1200 79110427 US Hwy 421 36.76455 -83.08192
Lee LEE20010 S1200 79123799 Wilderness Rd 36.67929 -83.35614
Lee LEE20011 S1200 79108017 Wilderness Rd 36.71798 -82.93074
Lee LEE20012 S1200 79128555 Wilderness Rd 36.64777 -83.41193
-50-

Lee LEE20013 S1200 79111933 Wilderness Rd 36.68109 -83.15439
Lee LEE20014 S1200 613142060 Trail of the Lonesome Pine Rd 36.79121 -82.85239
Lee LEE20015 S1200 639075751 US Hwy 23 36.78806 -82.81514
Lee LEE20016 S1200 79115743 Daniel Boone Trl 36.70900 -82.90874
Lee LEE20017 S1200 79111471 Daniel Boone Trl 36.63541 -83.43406
Lee LEE20018 S1200 641168062 Trail of the Lonesome Pine Rd 36.77229 -82.96850
Lee LEE20019 S1200 79110453 Liberty St 36.75699 -83.02991
Lee LEE20020 S1200 79106602 US Hwy 23 36.78381 -82.81794
Lee LEE20021 S1200 639567982 US Hwy 23 36.76648 -82.82274
Lee LEE20022 S1200 79095646 Daniel Boone Trl 36.69613 -83.27224
Lee LEE20023 S1200 79117889 Wilderness Rd 36.70360 -82.98055
Lee LEE20024 S1200 79093817 Saint Charles Rd 36.78522 -83.05487
Orange ORA2001 S1200 29887611 Zachary Taylor Hwy 38.29823 -77.95664
Orange ORA2002 S1200 29893313 Germanna Hwy 38.34161 -77.74145
Orange ORA2003 S1200 29893039 Constitution Hwy 38.31432 -77.76955
Orange ORA2004 S1200 29889177 Spotswood Trl 38.17507 -78.28569
Orange ORA2005 S1200 29884689 Constitution Hwy 38.25799 -77.99879
Orange ORA2006 S1200 29879552 Caroline St 38.23585 -78.11151
Orange ORA2007 S1200 29891561 Zachary Taylor Hwy 38.29823 -77.95664
Orange ORA2008 S1200 29878573 Constitution Hwy 38.22378 -78.21938
Orange ORA2009 S1200 29902465 James Madison Hwy 38.224697 -78.122262
Orange ORA20010 S1200 641044702 Constitution Hwy 38.22879 -78.17644
Orange ORA20011 S1200 29888110 Constitution Hwy 38.23920 -78.14973
Orange ORA20012 S1200 29888805 Constitution Hwy 38.32220 -77.73404
Orange ORA20013 S1200 29892573 James Madison Hwy 38.18329 -78.14461
Orange ORA20014 S1200 29878358 Blue Ridge Tpke 38.20890 -78.21796
Orange ORA20015 S1200 29892291 Germanna Hwy 38.32684 -77.72993
Orange ORA20016 S1200 29893293 Constitution Hwy 38.24356 -78.09298
Orange ORA20017 S1200 29892632 Spotswood Trl 38.17507 -78.28569
Orange ORA20018 S1200 29890602 Zachary Taylor Hwy 38.15849 -77.92991
Orange ORA20019 S1200 29889130 Blue Ridge Tpke 38.20890 -78.21796
-51-

Orange ORA20020 S1200 29897721 Spotswood Trl 38.14451 -78.19378
Orange ORA20021 S1200 613320626 Germanna Hwy 38.34142 -77.74216
Orange ORA20022 S1200 29893784 Zachary Taylor Hwy 38.21195 -77.94527
Orange ORA20023 S1200 29897264 Germanna Hwy 38.35927 -77.76191
Orange ORA20024 S1200 29898539 Constitution Hwy 38.26949 -77.92793
Pittsylvania PIT2001 S1200 56666990 Memorial Dr 36.59208 -79.39989
Pittsylvania PIT2002 S1200 56628668 W Gretna Rd 36.94347 -79.49387
Pittsylvania PIT2003 S1200 639776771 Memorial Dr 36.58362 -79.42046
Pittsylvania PIT2004 S1200 56648651 S Boston Hwy 36.58076 -79.30535
Pittsylvania PIT2005 S1200 56665770 Westover Dr 36.60479 -79.50520
Pittsylvania PIT2006 S1200 56631708 US Hwy 29 36.76360 -79.38948
Pittsylvania PIT2007 S1200 56640334 US Hwy 29 36.79119 -79.39373
Pittsylvania PIT2008 S1200 56601586 Martinsville Hwy 36.63683 -79.66714
Pittsylvania PIT2009 S1200 56601975 Franklin Tpke 36.73184 -79.56121
Pittsylvania PIT20010 S1200 56654252 US Hwy 29 37.07982 -79.33559
Pittsylvania PIT20011 S1200 56668862 Central Blvd 36.60173 -79.41386
Pittsylvania PIT20012 S1200 56630344 E Gretna Rd 36.96964 -79.12079
Pittsylvania PIT20013 S1200 56647988 Martinsville Hwy 36.62473 -79.62936
Pittsylvania PIT20014 S1200 56666483 Riverside Dr 36.59306 -79.41495
Pittsylvania PIT20015 S1200 56631537 Callands Rd 36.83737 -79.44440
Pittsylvania PIT20016 S1200 56668671 Memorial Dr 36.59002 -79.40868
Pittsylvania PIT20017 S1200 226676300 Martinsville Hwy 36.60464 -79.52276
Pittsylvania PIT20018 S1200 56628348 W Gretna Rd 36.95411 79.39599
Pittsylvania PIT20019 S1200 56589041 Franklin Tpke 36.62713 -79.38889
Pittsylvania PIT20020 S1200 56631573 Main St 36.82755 -79.39803
Pittsylvania PIT20021 S1200 56640625 Callands Rd 36.79169 -79.63056
Pittsylvania PIT20022 S1200 56598387 Main St 36.83174 -79.39655
Pittsylvania PIT20023 S1200 56665044 S Boston Rd 36.58111 -79.31805
Pittsylvania PIT20024 S1200 613148594 Danville Expy 36.54505 -79.44147
Prince
William
PR1001
S1100
207154534
I- 95
38.62578
-77.29174
-52-

Prince
William Prince
PR1004 S1100 207174223 I- 66 38.85051 -77.78799
William PR1006 S1100 207176990 I- 95 38.66020 -77.27815
Prince
William PR2001 S1200 207141465 Prince William Pkwy 38.75631 -77.52878
Prince
William PR2002 S1200 76529628 Prince William Pkwy 38.68219 -77.36275
Prince
William PR2003 S1200 207159052 Lee Hwy 38.80327 -77.58427
Prince
William Prince
PR2004 S1200 207177401 James Madison Hwy 38.82860 -77.63391
William PR2005 S1200 619935094 Main St 38.55546 -77.33460
Prince
William PR2007 S1200 207166925 Dumfries Rd 38.71367 -77.45835 Prince
William PR2008 S1200 207174419 Prince William Pkwy 38.76868 -77.53609
Prince
William PR2009 S1200 207154816 Sudley Rd 38.85417 -77.56866 Prince
William PR20011 S1200 207179591 Prince William Pkwy 38.71220 -77.41256
Prince
William PR20012 S1200 76510150 Jefferson Davis Hwy 38.54911 -77.33401
Prince
William PR4003 S1400 207169584 38.53784 -77.32452
Prince
William Prince
PR4004 S1400 207164958 Sudley Manor Dr 38.79126 -77.48373
William PR4005 S1400 76513942 Flowerree Ln 38.73367 -77.47274
Prince
William PR4006 S1400 634507164 Smoketown Rd 38.65252 -77.30360
Southeast SE1001 S1100 613347996 I- 664 36.97152 -76.41763
Southeast SE1002 S1100 121771408 I- 464 36.77562 -76.27995
Southeast SE1004 S1100 638976348 I- 64 36.80970 -76.19630
Southeast SE1005 S1100 122151432 I- 264 36.84515 -76.25340
Southeast SE1006 S1100 639820800 I- 64 36.920316 -76.271165
Southeast SE1008 S1100 122144660 I- 64 36.90334 -76.25686
Southeast SE10010 S1100 640420875 I- 264 36.78761 -76.41512
Southeast SE10011 S1100 613354605 I- 464 36.77378 -76.27502
Southeast SE10012 S1100 639822477 I- 64 36.88214 -76.21812
-53-

Southeast SE2001 S1200 635302741 W Little Creek Rd 36.91607 -76.29292
Southeast SE2002 S1200 613340815 Great Brg Byp 36.58627 -76.19916
Southeast SE2003 S1200 122269364 N Great Neck Rd 36.85649 -76.04826
Southeast SE2004 S1200 122147991 E Ocean View Ave 36.92980 -76.19167
Southeast SE2005 S1200 122304953 Pembroke Blvd 36.86239 -76.13035
Southeast SE2006 S1200 122131543 Hampton Blvd 36.89202 -76.30356
Southeast SE2007 S1200 122241413 Nansemond Pkwy 36.76743 -76.53105
Southeast SE2008 S1200 122268634 Lynnhaven Pkwy 36.79535 -76.09148
Southeast SE2009 S1200 122244789 Bridge Rd 36.86488 -76.43638
Southeast SE20010 S1200 641612751 George Washington Hwy S 36.61419 -76.37507
Southeast SE20011 S1200 122198660 High St W 36.86063 -76.39633
Southeast SE20012 S1200 122303383 Virginia Beach Blvd 36.85307 -76.17365
Southeast SE20013 S1200 122226352 W Constance Rd 36.73394 -76.59652
Southeast SE20014 S1200 613586538 Lynnhaven Pkwy 36.79567 -76.11532
Southeast SE20015 S1200 613589791 Shore Dr 36.913146 -76.190652
Southeast SE20016 S1200 122299984 N Great Neck Rd 36.89637 -76.06194
Southeast SE20017 S1200 122201989 Frederick Blvd 36.81190 -76.31728
Southeast SE20018 S1200 121799627 Great Bridge Blvd 36.76506 -76.28222
Southeast SE20019 S1200 122231411 Nansemond Pkwy 36.75846 -76.53616
Southeast SE20020 S1200 613587047 Shore Dr 36.91135 -76.07266
Southeast SE20021 S1200 613338397 Great Brg Byp 36.73629 -76.24520
Southeast SE20022 S1200 122302776 Laskin Rd 36.85013 -76.02631
Southeast SE20023 S1200 121770304 Wilson Rd 36.82539 -76.26839
Southeast SE20024 S1200 613586282 Providence Rd 36.81152 -76.21600
Southeast SE4001 S1400 122237851 Great Fork Rd 36.58568 -76.67028
Southeast SE40010 S1400 122264028 Baxter Rd 36.82456 -76.14877
Southeast SE40011 S1400 121791597 Saddlehorn Dr 36.69500 -76.10508
Southeast SE40012 S1400 122192451 Loudoun Ave 36.82723 -76.34303
Stafford STA1002 S1100 25571142 I- 95 38.29822 -77.50714
Stafford STA1003 S1100 615457223 I- 95 38.46751 -77.40755
Stafford STA1004 S1100 615454740 I- 95 38.42226 -77.42371
-54-

Stafford STA1005 S1100 635808099 I- 95 38.37160 -77.45995
Stafford STA1006 S1100 25576205 I- 95 38.42078 -77.42162
Stafford STA2001 S1200 636653529 Kings Hwy 38.25711 -77.38941
Stafford STA2002 S1200 638880177 Warrenton Rd 38.37570 -77.53364
Stafford STA2003 S1200 635808337 Warrenton Rd 38.40160 -77.57192
Stafford STA2004 S1200 636655765 Jefferson Davis Hwy 38.50636 -77.37324
Stafford STA2006 S1200 25556913 White Oak Rd 38.31135 -77.43624
Stafford STA2007 S1200 635809454 Warrenton Rd 38.39225 -77.55310
Stafford STA2008 S1200 636653019 Cambridge St 38.32361 -77.46902
Stafford STA2009 S1200 25578934 Warrenton Rd 38.37016 -77.52746
Stafford STA20010 S1200 25582290 Warrenton Rd 38.39225 -77.55310
Stafford STA20011 S1200 25571389 Warrenton Rd 38.33520 -77.48109
Stafford STA20012 S1200 636822789 Kings Hwy 38.26901 -77.41985
Stafford STA4001 S1400 636655896 Holly Corner Rd 38.35176 -77.58601
Stafford STA4002 S1400 635808840 Stableside Ln 38.28716 -77.37782
Stafford STA4003 S1400 25572121 Ferry Rd 38.29610 -77.43735
Stafford STA4004 S1400 632545602 Running Brook Ct 38.37579 -77.33004
Stafford STA4005 S1400 25576609 Brooke Rd 38.37797 -77.35646
Stafford STA4006 S1400 25557057 Jefferson St 38.29494 -77.43656
Wise WIS2001 S1200 641467079 Dungannon Rd 36.93062 -82.45741
Wise WIS2002 S1200 225725104 Norton Coeburn Rd 36.93479 -82.54562
Wise WIS2003 S1200 83457528 Orby Cantrell Hwy 37.06287 -82.60058
Wise WIS2004 S1200 83467626 Laurel Ave 36.95800 -82.47127
Wise WIS2005 S1200 225719919 Orby Cantrell Hwy 37.14195 -82.62204
Wise WIS2006 S1200 83472775 Kentucky Ave SE 36.94215 -82.59219
Wise WIS2007 S1200 83437671 N Inman St 36.90877 -82.79687
Wise WIS2008 S1200 225719703 Orby Cantrell Hwy 37.04149 -82.60000
Wise WIS2009 S1200 83448053 Orby Cantrell Hwy 37.00021 -82.59338
Wise WIS20010 S1200 83437321 Callahan Ave 36.93217 -82.79723
Wise WIS20011 S1200 83468723 Cranes Nest Rd 37.05014 -82.49525
Wise WIS20012 S1200 83437604 Callahan Ave 36.92556 -82.79816
-55-

Wise WIS20014 S1200 225716426 Kent Junction Rd 36.91792 -82.75152
Wise WIS20015 S1200 83452234 Orby Cantrell Hwy 37.15490 -82.63322
Wise WIS20017 S1200 83467828 Bull Run Rd 36.92430 -82.37865
Wise WIS20018 S1200 83473052 Norton Coeburn Rd 36.93933 -82.60568
Wise WIS20019 S1200 613150452 Orby Cantrell Hwy 36.93816 -82.61625
Wise WIS20020 S1200 83473214 Orby Cantrell Hwy 36.93767 -82.61494
Wise WIS20021 S1200 225728547 State Rte 361 37.12061 -82.53996
Wise WIS20022 S1200 83468169 Cranes Nest Rd 36.98492 -82.47638
Wise WIS20023 S1200 225720369 US Hwy 58 Alt 36.94439 -82.42307
Wise WIS20024 S1200 83450868 Laurel Ave 36.95043 -82.47112
Wythe WYT1002 S1100 47666702 I- 77 36.97080 -81.06770
Wythe WYT1003 S1100 47663240 I- 81 36.99231 -80.79434
Wythe WYT1004 S1100 47662941 I- 81 36.91545 -81.27380
Wythe WYT1005 S1100 47669774 I- 77 36.94516 -80.94967
Wythe WYT1009 S1100 47669782 I- 81 36.95931 -81.09998
Wythe WYT2001 S1200 47658436 W Lee Hwy 36.93047 -81.18162
Wythe WYT2002 S1200 47657355 W Lee Hwy 36.90299 -81.31200
Wythe WYT2003 S1200 47656402 Wysor Hwy 36.93117 -80.79997
Wythe WYT2004 S1200 47644031 Sheffey School Rd 36.88255 -80.98961
Wythe WYT2005 S1200 47657434 Grayson Tpke 36.90798 -81.10577
Wythe WYT2006 S1200 47668258 W Lee Hwy 36.94089 -81.14927
Wythe WYT2007 S1200 47652415 Fort Chiswell Rd 36.92338 -80.93502
Wythe WYT2008 S1200 636652115 Fort Chiswell Rd 36.90677 -80.92509
Wythe WYT2009 S1200 47645434 Wysor Hwy 36.90204 -80.79880
Wythe WYT20010 S1200 47643371 E Main St 36.95162 -81.07036
Wythe WYT20011 S1200 47638594 State Rte 100 36.92010 -80.80293
Wythe WYT20012 S1200 47652134 Fort Chiswell Rd 36.88820 -80.90644
Wythe WYT20013 S1200 47656363 Wysor Hwy 36.89446 -80.79092
Wythe WYT20014 S1200 47659258 Fort Chiswell Rd 36.87600 -80.87897
Wythe WYT20015 S1200 47652036 Fort Chiswell Rd 36.93804 -80.94400
York YC1002 S1100 223122166 I- 64 37.30326 -76.68186
-56-

York YC1003 S1100 639794272 I- 64 37.11634 -76.50504
York YC1004 S1100 103816587 I- 64 37.08662 -76.45864
York YC1005 S1100 239687893 I- 64 37.02325 -76.32854
York YC1006 S1100 103805323 I- 64 37.04010 -76.39226
York
YC2001
S1200
638661489
George Washington Memorial
Hwy
37.20229
-76.49821
York YC2002 S1200 103760701 N Mallory St 37.03554 -76.30099
York YC2003 S1200 103820961 Jefferson Ave 37.09389 -76.48746
York YC2004 S1200 103746512 Victoria Blvd 36.99521 -76.39535
York YC2005 S1200 239687157 W Mercury Blvd 37.02757 -76.42899
York YC2006 S1200 223115758 George Washington Memorial Hwy 37.13496 -76.45717
York YC2007 S1200 103771696 State Rte 132 37.29501 -76.68851
York YC2008 S1200 103824053 Jefferson Ave 37.02683 -76.44895
York YC2009 S1200 103821314 Jefferson Ave 37.11071 -76.49771
York YC20011 S1200 223119989 State Rte 199 37.21123 -76.44023
York YC20012 S1200 635294983 Pocahontas Trl 37.24029 -76.64949
York YC4001 S1400 103746690 20th St 36.98136 -76.40919
York YC4009 S1400 103759416 37.06560 -76.32853
-57-
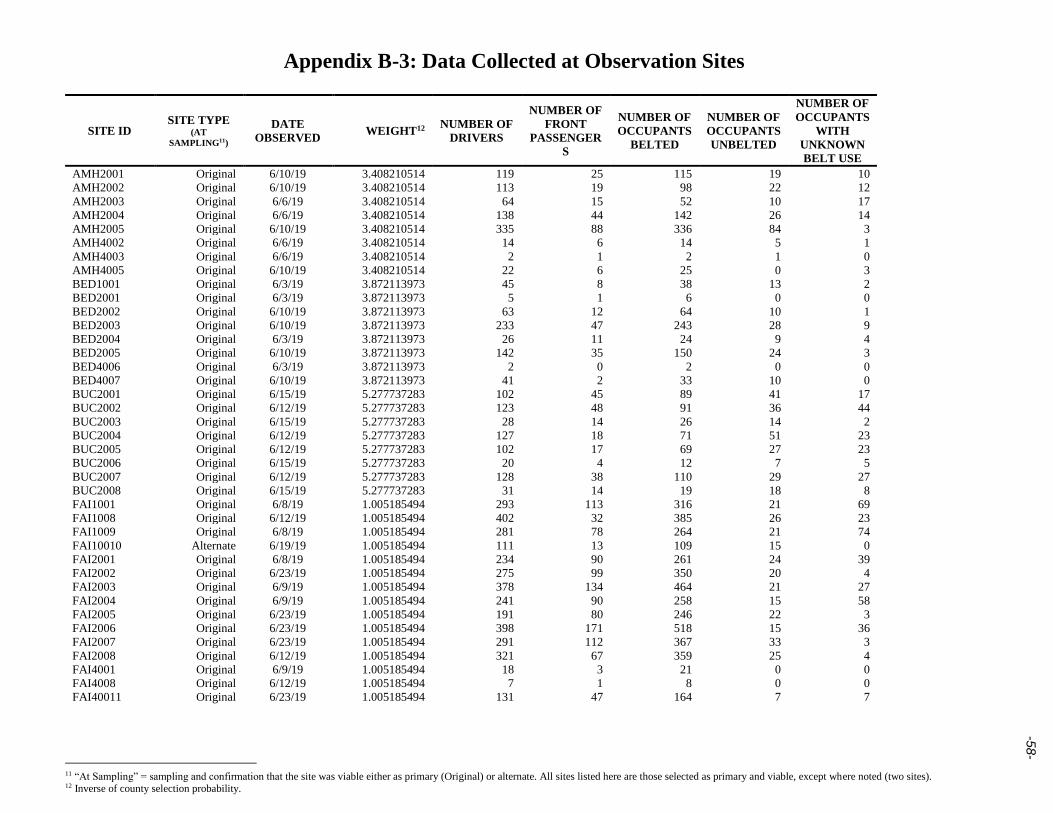
-58-
Appendix B-3: Data Collected at Observation Sites
11 “At Sampling” = sampling and confirmation that the site was viable either as primary (Original) or alternate. All sites listed here are those selected as primary and viable, except where noted (two sites). 12 Inverse of county selection probability.
SITE ID SITE TYPE
(AT
SAMPLING11)
DATE
OBSERVED WEIGHT12
NUMBER OF
DRIVERS
NUMBER OF
FRONT
PASSENGER
S
NUMBER OF
OCCUPANTS
BELTED
NUMBER OF
OCCUPANTS
UNBELTED
NUMBER OF
OCCUPANTS
WITH
UNKNOWN
BELT USE
AMH2001 Original 6/10/19 3.408210514 119 25 115 19 10
AMH2002 Original 6/10/19 3.408210514 113 19 98 22 12
AMH2003 Original 6/6/19 3.408210514 64 15 52 10 17
AMH2004 Original 6/6/19 3.408210514 138 44 142 26 14
AMH2005 Original 6/10/19 3.408210514 335 88 336 84 3
AMH4002 Original 6/6/19 3.408210514 14 6 14 5 1
AMH4003 Original 6/6/19 3.408210514 2 1 2 1 0
AMH4005 Original 6/10/19 3.408210514 22 6 25 0 3
BED1001 Original 6/3/19 3.872113973 45 8 38 13 2
BED2001 Original 6/3/19 3.872113973 5 1 6 0 0
BED2002 Original 6/10/19 3.872113973 63 12 64 10 1
BED2003 Original 6/10/19 3.872113973 233 47 243 28 9
BED2004 Original 6/3/19 3.872113973 26 11 24 9 4
BED2005 Original 6/10/19 3.872113973 142 35 150 24 3
BED4006 Original 6/3/19 3.872113973 2 0 2 0 0
BED4007 Original 6/10/19 3.872113973 41 2 33 10 0
BUC2001 Original 6/15/19 5.277737283 102 45 89 41 17
BUC2002 Original 6/12/19 5.277737283 123 48 91 36 44
BUC2003 Original 6/15/19 5.277737283 28 14 26 14 2
BUC2004 Original 6/12/19 5.277737283 127 18 71 51 23
BUC2005 Original 6/12/19 5.277737283 102 17 69 27 23
BUC2006 Original 6/15/19 5.277737283 20 4 12 7 5
BUC2007 Original 6/12/19 5.277737283 128 38 110 29 27
BUC2008 Original 6/15/19 5.277737283 31 14 19 18 8
FAI1001 Original 6/8/19 1.005185494 293 113 316 21 69
FAI1008 Original 6/12/19 1.005185494 402 32 385 26 23
FAI1009 Original 6/8/19 1.005185494 281 78 264 21 74
FAI10010 Alternate 6/19/19 1.005185494 111 13 109 15 0
FAI2001 Original 6/8/19 1.005185494 234 90 261 24 39
FAI2002 Original 6/23/19 1.005185494 275 99 350 20 4
FAI2003 Original 6/9/19 1.005185494 378 134 464 21 27
FAI2004 Original 6/9/19 1.005185494 241 90 258 15 58
FAI2005 Original 6/23/19 1.005185494 191 80 246 22 3
FAI2006 Original 6/23/19 1.005185494 398 171 518 15 36
FAI2007 Original 6/23/19 1.005185494 291 112 367 33 3
FAI2008 Original 6/12/19 1.005185494 321 67 359 25 4
FAI4001 Original 6/9/19 1.005185494 18 3 21 0 0
FAI4008 Original 6/12/19 1.005185494 7 1 8 0 0
FAI40011 Original 6/23/19 1.005185494 131 47 164 7 7

-59-
FAI40013 Original 6/8/19 1.005185494 12 0 10 1 1
FRA2001 Original 6/4/19 4.647939304 77 19 81 6 9
FRA2002 Original 6/4/19 4.647939304 101 21 105 8 9
FRA2003 Original 6/9/19 4.647939304 85 31 97 16 3
FRA2004 Original 6/9/19 4.647939304 162 74 204 29 3
FRA2005 Original 6/4/19 4.647939304 114 26 94 16 30
FRA4001 Original 6/9/19 4.647939304 6 2 5 3 0
FRA4002 Original 6/9/19 4.647939304 2 0 0 2 0
FRA4004 Original 6/4/19 4.647939304 4 2 5 1 0
GOO1001 Original 6/6/19 4.224398368 223 37 232 24 4
GOO1002 Original 6/6/19 4.224398368 408 28 403 15 18
GOO2001 Original 6/8/19 4.224398368 49 22 51 11 9
GOO2002 Original 6/6/19 4.224398368 203 47 197 38 15
GOO2003 Original 6/6/19 4.224398368 98 26 100 6 18
GOO2004 Original 6/8/19 4.224398368 75 34 82 18 9
GOO4001 Original 6/8/19 4.224398368 3 3 6 0 0
GOO4004 Original 6/8/19 4.224398368 1 0 0 1 0
LEE2001 Original 6/9/19 5.746810098 58 26 58 23 3
LEE2002 Original 6/16/19 5.746810098 80 40 101 16 3
LEE2003 Original 6/9/19 5.746810098 38 10 38 8 2
LEE2004 Original 6/16/19 5.746810098 90 55 109 35 1
LEE2005 Original 6/9/19 5.746810098 54 20 56 13 5
LEE2006 Original 6/16/19 5.746810098 12 7 10 9 0
LEE2007 Original 6/16/19 5.746810098 81 34 87 15 13
LEE2008 Original 6/9/19 5.746810098 45 6 38 8 5
ORA2001 Original 6/6/19 4.075878876 116 33 123 12 14
ORA2002 Original 6/6/19 4.075878876 272 62 272 23 39
ORA2003 Original 6/6/19 4.075878876 192 50 193 31 18
ORA2004 Original 6/5/19 4.075878876 115 22 94 25 18
ORA2005 Original 6/6/19 4.075878876 173 46 165 28 26
ORA2006 Original 6/5/19 4.075878876 204 61 206 44 15
ORA2007 Original 6/5/19 4.075878876 71 17 57 19 12
ORA2008 Original 6/5/19 4.075878876 65 22 70 9 8
PIT2001 Original 6/7/19 2.649926284 216 57 167 88 18
PIT2002 Original 6/15/19 2.649926284 48 22 55 14 1
PIT2003 Original 6/7/19 2.649926284 155 32 132 28 27
PIT2004 Original 6/8/19 2.649926284 214 111 226 70 29
PIT2005 Original 6/7/19 2.649926284 36 10 33 9 4
PIT2006 Original 6/15/19 2.649926284 293 111 354 46 4
PIT2007 Original 6/15/19 2.649926284 214 84 252 45 1
PIT2008 Original 6/7/19 2.649926284 215 33 177 36 35
PR1001 Original 6/4/19 3.026197013 235 29 231 22 11
PR1004 Original 6/5/19 3.026197013 58 10 53 8 7
PR2001 Original 6/5/19 3.026197013 379 59 371 37 30
PR2002 Original 6/4/19 3.026197013 209 38 192 25 30
PR2003 Original 6/5/19 3.026197013 112 17 109 7 13
PR2004 Original 6/5/19 3.026197013 276 67 285 30 28
PR4003 Original 6/4/19 3.026197013 156 29 145 31 9
PR4004 Original 6/4/19 3.026197013 35 7 38 4 0
SE1001 Original 6/7/19 1.256012101 22 5 19 8 0
SE1002 Original 6/10/19 1.256012101 154 25 135 37 7

-60-
SE1004 Original 6/10/19 1.256012101 158 14 140 26 6
SE1005 Original 6/4/19 1.256012101 119 21 101 32 7
SE2001 Original 6/4/19 1.256012101 196 29 158 57 10
SE2002 Original 6/10/19 1.256012101 191 39 209 10 11
SE2003 Original 6/7/19 1.256012101 331 14 292 37 16
SE2004 Original 6/4/19 1.256012101 247 49 242 47 7
SE2005 Original 6/7/19 1.256012101 94 21 89 26 0
SE2006 Original 6/4/19 1.256012101 169 34 156 27 20
SE2007 Original 6/9/19 1.256012101 85 21 56 23 27
SE2008 Original 6/7/19 1.256012101 208 44 202 38 12
SE4001 Original 6/9/19 1.256012101 28 12 26 10 4
SE40010 Original 6/7/19 1.256012101 194 35 182 39 8
SE40011 Original 6/10/19 1.256012101 4 1 5 0 0
SE40012 Original 6/9/19 1.256012101 2 1 1 2 0
STA1003 Original 6/6/19 7.021887723 327 64 319 41 31
STA1005 Alternate 6/11/19 7.021887723 115 22 120 17 0
STA2001 Original 6/11/19 7.021887723 254 52 279 25 2
STA2002 Original 6/6/19 7.021887723 300 92 319 44 29
STA2003 Original 6/6/19 7.021887723 264 41 222 47 36
STA2004 Original 6/6/19 7.021887723 215 54 224 22 23
STA4001 Original 6/11/19 7.021887723 8 0 7 1 0
STA4002 Original 6/11/19 7.021887723 1 0 1 0 0
WIS2001 Original 6/13/19 2.592077991 81 15 52 32 12
WIS2002 Original 6/13/19 2.592077991 141 33 125 36 13
WIS2003 Original 6/16/19 2.592077991 51 14 45 14 6
WIS2004 Original 6/13/19 2.592077991 64 16 40 33 7
WIS2005 Original 6/16/19 2.592077991 70 41 86 6 19
WIS2006 Original 6/16/19 2.592077991 20 5 11 12 2
WIS2007 Original 6/13/19 2.592077991 27 13 22 18 0
WIS2008 Original 6/16/19 2.592077991 175 98 208 18 47
WYT1002 Original 6/4/19 3.484328473 71 22 84 8 1
WYT1003 Original 6/4/19 3.484328473 5 1 4 2 0
WYT1004 Original 6/11/19 3.484328473 50 14 34 21 9
WYT2001 Original 6/11/19 3.484328473 78 25 69 24 10
WYT2002 Original 6/11/19 3.484328473 62 10 48 15 9
WYT2003 Original 6/4/19 3.484328473 71 21 73 19 0
WYT2004 Original 6/4/19 3.484328473 11 2 11 2 0
WYT2005 Original 6/11/19 3.484328473 68 27 61 22 12
YC1002 Original 6/8/19 2.83113956 152 50 138 23 41
YC1003 Original 6/8/19 2.83113956 223 97 248 6 66
YC2001 Original 6/8/19 2.83113956 206 33 139 25 75
YC2002 Original 6/3/19 2.83113956 113 14 101 16 10
YC2003 Original 6/8/19 2.83113956 282 111 347 30 16
YC2004 Original 6/3/19 2.83113956 114 28 94 34 14
YC4001 Original 6/3/19 2.83113956 10 3 4 9 0
YC4009 Original 6/3/19 2.83113956 45 1 36 8 2
TOTALS 136 (of 136) 459.0483252 17,613 4,631 17,674 2,811 1,759

-61-
Appendix C: Virginia Seat Belt Observation Forms – Cover Sheet
Date:
Site Identification:
Alternate Site Information:
Is this an alternate site? No Yes (Circle one)
If yes, please provide a reason for using an alternate site from the reserve list:
Site Description:
Site Start and End Time:
Site Location:
Site Number:
Light Rain Light Fog Clear Weather Conditions:
Assigned traffic flow: North South East West
Number of lanes observed:
Total number of lanes in this direction:
Start time for observations: am/pm
End time for observations: am/pm (Total observation period MUST last exactly 50 minutes)

-62-
__________________ __________________
State Summer Safety Belt Observation Form
Observer:
Date:
Day of Week:
Primary or Secondary: _
Start Time:
End Time:
Site Number:
Observed From:
Site:
Number of Lanes – Notes:
Volume 1: Volume 2:
Lane Vehicle Type Driver Passenger Driver Weather
C Car
T Truck
S SUV
V Van M Mini-Van
Gender Belt
Use
Gender Belt
Use
Not
Pres
Cell
Use
1 Clear/Sunny
2 Light Rain
3 Cloudy
4 Fog 5 Clear but Wet
1 C T S V M M F Y N U M F Y N U NP Y N
2 C T S V M M F Y N U M F Y N U NP Y N
3 C T S V M M F Y N U M F Y N U NP Y N
4 C T S V M M F Y N U M F Y N U NP Y N
5 C T S V M M F Y N U M F Y N U NP Y N
6 C T S V M M F Y N U M F Y N U NP Y N
7 C T S V M M F Y N U M F Y N U NP Y N
8 C T S V M M F Y N U M F Y N U NP Y N
9 C T S V M M F Y N U M F Y N U NP Y N
10 C T S V M M F Y N U M F Y N U NP Y N
11 C T S V M M F Y N U M F Y N U NP Y N
12 C T S V M M F Y N U M F Y N U NP Y N
13 C T S V M M F Y N U M F Y N U NP Y N
14 C T S V M M F Y N U M F Y N U NP Y N
15 C T S V M M F Y N U M F Y N U NP Y N
16 C T S V M M F Y N U M F Y N U NP Y N
17 C T S V M M F Y N U M F Y N U NP Y N
18 C T S V M M F Y N U M F Y N U NP Y N
19 C T S V M M F Y N U M F Y N U NP Y N
20 C T S V M M F Y N U M F Y N U NP Y N
Total Observation = 50 minutes
Observation Times per Lane if Congested
1 lane = 50 minutes 3 lanes = 16.5 minutes each 2 lanes =25 minutes each 4 lanes = 12.5 minutes each

-63-
Lane Vehicle Type Driver Passenger Driver Weather C Car T Truck
S SUV
V Van M Mini-Van
Gender Belt Use Gender Belt
Use
Not
Pres
Cell
Use
1 Clear/Sunny 2 Light Rain
3 Cloudy
4 Fog 5 Clear but Wet
21 C T S V M M F Y N U M F Y N U NP Y N
22 C T S V M M F Y N U M F Y N U NP Y N
23 C T S V M M F Y N U M F Y N U NP Y N
24 C T S V M M F Y N U M F Y N U NP Y N
25 C T S V M M F Y N U M F Y N U NP Y N
26 C T S V M M F Y N U M F Y N U NP Y N
27 C T S V M M F Y N U M F Y N U NP Y N
28 C T S V M M F Y N U M F Y N U NP Y N
29 C T S V M M F Y N U M F Y N U NP Y N
30 C T S V M M F Y N U M F Y N U NP Y N
31 C T S V M M F Y N U M F Y N U NP Y N
32 C T S V M M F Y N U M F Y N U NP Y N
33 C T S V M M F Y N U M F Y N U NP Y N
34 C T S V M M F Y N U M F Y N U NP Y N
35 C T S V M M F Y N U M F Y N U NP Y N
36 C T S V M M F Y N U M F Y N U NP Y N
37 C T S V M M F Y N U M F Y N U NP Y N
38 C T S V M M F Y N U M F Y N U NP Y N
39 C T S V M M F Y N U M F Y N U NP Y N
40 C T S V M M F Y N U M F Y N U NP Y N
41 C T S V M M F Y N U M F Y N U NP Y N
42 C T S V M M F Y N U M F Y N U NP Y N
43 C T S V M M F Y N U M F Y N U NP Y N
44 C T S V M M F Y N U M F Y N U NP Y N
45 C T S V M M F Y N U M F Y N U NP Y N
46 C T S V M M F Y N U M F Y N U NP Y N
47 C T S V M M F Y N U M F Y N U NP Y N
48 C T S V M M F Y N U M F Y N U NP Y N
49 C T S V M M F Y N U M F Y N U NP Y N
50 C T S V M M F Y N U M F Y N U NP Y N

-64-
This page intentionally left blank.


