
JANUARY 31, 2018
2018 SEMI-ANNUAL REPORT (UNAUDITED)
iShares Trust
� iShares Exponential Technologies ETF | XT | NASDAQ

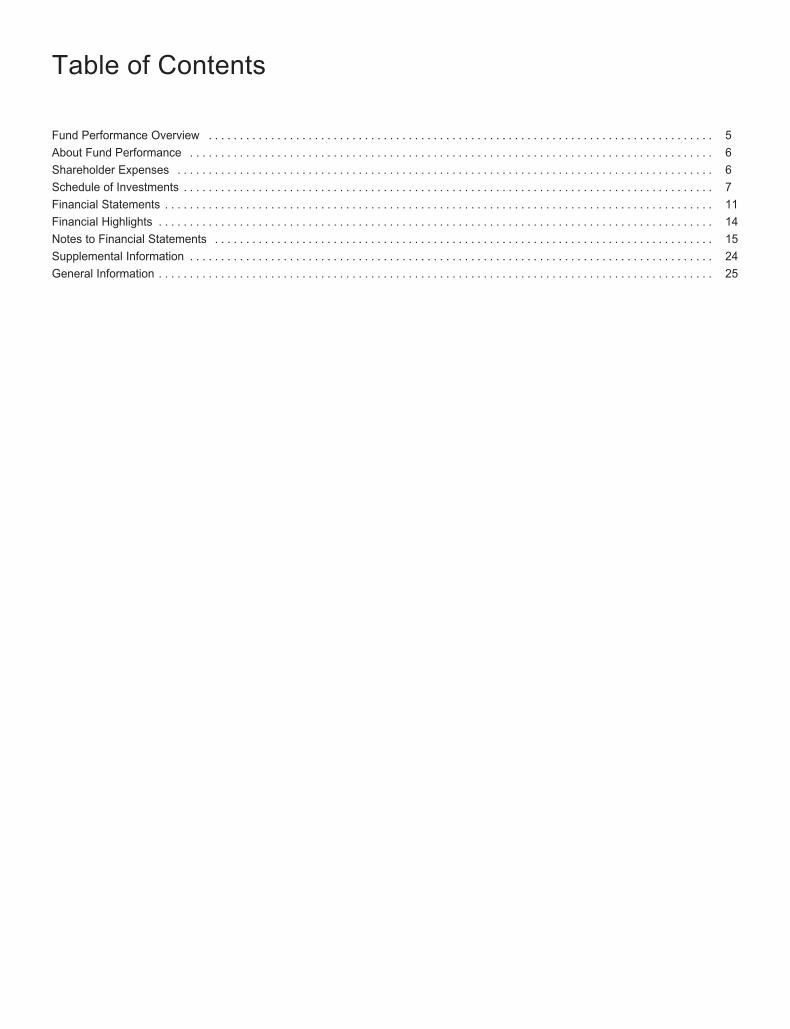
Table of Contents
Fund Performance Overview . . . . . . . . . . . . . . . . . . . . . . . . . . . . . . . . . . . . . . . . . . . . . . . . . . . . . . . . . . . . . . . . . . . . . . . . . . . . . . . . . 5
About Fund Performance . . . . . . . . . . . . . . . . . . . . . . . . . . . . . . . . . . . . . . . . . . . . . . . . . . . . . . . . . . . . . . . . . . . . . . . . . . . . . . . . . . . . 6
Shareholder Expenses . . . . . . . . . . . . . . . . . . . . . . . . . . . . . . . . . . . . . . . . . . . . . . . . . . . . . . . . . . . . . . . . . . . . . . . . . . . . . . . . . . . . . . 6
Schedule of Investments . . . . . . . . . . . . . . . . . . . . . . . . . . . . . . . . . . . . . . . . . . . . . . . . . . . . . . . . . . . . . . . . . . . . . . . . . . . . . . . . . . . . . 7
Financial Statements . . . . . . . . . . . . . . . . . . . . . . . . . . . . . . . . . . . . . . . . . . . . . . . . . . . . . . . . . . . . . . . . . . . . . . . . . . . . . . . . . . . . . . . . 11
Financial Highlights . . . . . . . . . . . . . . . . . . . . . . . . . . . . . . . . . . . . . . . . . . . . . . . . . . . . . . . . . . . . . . . . . . . . . . . . . . . . . . . . . . . . . . . . . 14
Notes to Financial Statements . . . . . . . . . . . . . . . . . . . . . . . . . . . . . . . . . . . . . . . . . . . . . . . . . . . . . . . . . . . . . . . . . . . . . . . . . . . . . . . . 15
Supplemental Information . . . . . . . . . . . . . . . . . . . . . . . . . . . . . . . . . . . . . . . . . . . . . . . . . . . . . . . . . . . . . . . . . . . . . . . . . . . . . . . . . . . . 24
General Information . . . . . . . . . . . . . . . . . . . . . . . . . . . . . . . . . . . . . . . . . . . . . . . . . . . . . . . . . . . . . . . . . . . . . . . . . . . . . . . . . . . . . . . . . 25

THIS PAGE INTENTIONALLY LEFT BLANK.

Fund Performance OverviewiSHARES® EXPONENTIAL TECHNOLOGIES ETFPerformance as of January 31, 2018
The iShares Exponential Technologies ETF (the “Fund”) seeks to track the investment results of an index composed of stocks
of developed and emerging market companies that create or use exponential technologies, as represented by the Morningstar®
Exponential Technologies IndexSM (the “Index”). The Fund invests in a representative sample of securities included in the Index
that collectively has an investment profile similar to the Index. Due to the use of representative sampling, the Fund may or may
not hold all of the securities that are included in the Index. For the six-month reporting period ended January 31, 2018, the total
return for the Fund was 15.98%, net of fees, while the total return for the Index was 16.35%.
Average Annual Total Returns Cumulative Total Returns
NAV MARKET INDEX NAV MARKET INDEX
1 Year 37.11% 36.94% 37.69% 37.11% 36.94% 37.69%
Since Inception 16.28% 16.30% 16.55% 54.28% 54.36% 55.09%
The inception date of the Fund was 3/19/15. The first day of secondary market trading was 3/23/15.
Certain sectors and markets performed exceptionally well based on market conditions during the one-year period. Achieving such exceptional returns involves the risk
of volatility and investors should not expect that such exceptional returns will be repeated.
Past performance is no guarantee of future results. Performance results do not reflect the deduction of taxes that a shareholder would pay on fund distributions or on
the redemption or sale of fund shares. See “About Fund Performance” on page 6 for more information.
Shareholder Expenses
Actual Hypothetical 5% Return
BeginningAccount Value
(8/1/17)
EndingAccount Value
(1/31/18)Expenses Paid
During Period a
BeginningAccount Value
(8/1/17)
EndingAccount Value
(1/31/18)Expenses Paid
During Period aAnnualized
Expense Ratio
$ 1,000.00 $ 1,159.80 $ 2.56 $ 1,000.00 $ 1,022.80 $ 2.40 0.47%
a Expenses are calculated using the Fund’s annualized expense ratio (as disclosed in the table), multiplied by the average account value for the period, multipliedby the number of days in the period (184 days) and divided by the number of days in the year (365 days). See “Shareholder Expenses” on page 6 for moreinformation.
ALLOCATION BY SECTOR
As of 1/31/18
Sector
Percentage of
Total Investments*
Health Care 32.05%
Information Technology 31.90
Industrials 14.23
Telecommunication Services 9.23
Financials 6.04
Consumer Discretionary 3.21
Materials 2.34
Energy 0.55
Real Estate 0.45
TOTAL 100.00%
TEN LARGEST COUNTRIES
As of 1/31/18
Country
Percentage of
Total Investments*
United States 62.06%
Germany 5.39
France 4.54
United Kingdom 3.91
Switzerland 3.89
Japan 3.37
Sweden 2.66
Netherlands 2.41
Denmark 2.39
Canada 2.02
TOTAL 92.64%
* Excludes money market funds.
F U N D P E R F O R M A N C E O V E R V I E W 5
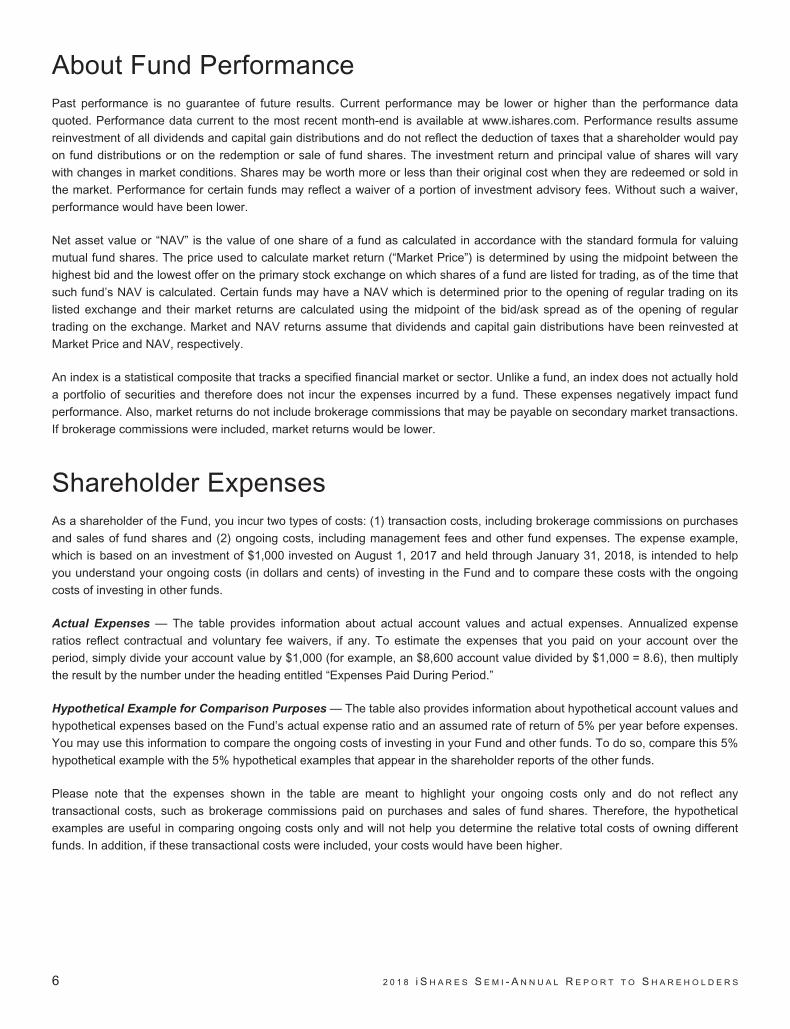
About Fund PerformancePast performance is no guarantee of future results. Current performance may be lower or higher than the performance data
quoted. Performance data current to the most recent month-end is available at www.ishares.com. Performance results assume
reinvestment of all dividends and capital gain distributions and do not reflect the deduction of taxes that a shareholder would pay
on fund distributions or on the redemption or sale of fund shares. The investment return and principal value of shares will vary
with changes in market conditions. Shares may be worth more or less than their original cost when they are redeemed or sold in
the market. Performance for certain funds may reflect a waiver of a portion of investment advisory fees. Without such a waiver,
performance would have been lower.
Net asset value or “NAV” is the value of one share of a fund as calculated in accordance with the standard formula for valuing
mutual fund shares. The price used to calculate market return (“Market Price”) is determined by using the midpoint between the
highest bid and the lowest offer on the primary stock exchange on which shares of a fund are listed for trading, as of the time that
such fund’s NAV is calculated. Certain funds may have a NAV which is determined prior to the opening of regular trading on its
listed exchange and their market returns are calculated using the midpoint of the bid/ask spread as of the opening of regular
trading on the exchange. Market and NAV returns assume that dividends and capital gain distributions have been reinvested at
Market Price and NAV, respectively.
An index is a statistical composite that tracks a specified financial market or sector. Unlike a fund, an index does not actually hold
a portfolio of securities and therefore does not incur the expenses incurred by a fund. These expenses negatively impact fund
performance. Also, market returns do not include brokerage commissions that may be payable on secondary market transactions.
If brokerage commissions were included, market returns would be lower.
Shareholder ExpensesAs a shareholder of the Fund, you incur two types of costs: (1) transaction costs, including brokerage commissions on purchases
and sales of fund shares and (2) ongoing costs, including management fees and other fund expenses. The expense example,
which is based on an investment of $1,000 invested on August 1, 2017 and held through January 31, 2018, is intended to help
you understand your ongoing costs (in dollars and cents) of investing in the Fund and to compare these costs with the ongoing
costs of investing in other funds.
Actual Expenses — The table provides information about actual account values and actual expenses. Annualized expense
ratios reflect contractual and voluntary fee waivers, if any. To estimate the expenses that you paid on your account over the
period, simply divide your account value by $1,000 (for example, an $8,600 account value divided by $1,000 = 8.6), then multiply
the result by the number under the heading entitled “Expenses Paid During Period.”
Hypothetical Example for Comparison Purposes — The table also provides information about hypothetical account values and
hypothetical expenses based on the Fund’s actual expense ratio and an assumed rate of return of 5% per year before expenses.
You may use this information to compare the ongoing costs of investing in your Fund and other funds. To do so, compare this 5%
hypothetical example with the 5% hypothetical examples that appear in the shareholder reports of the other funds.
Please note that the expenses shown in the table are meant to highlight your ongoing costs only and do not reflect any
transactional costs, such as brokerage commissions paid on purchases and sales of fund shares. Therefore, the hypothetical
examples are useful in comparing ongoing costs only and will not help you determine the relative total costs of owning different
funds. In addition, if these transactional costs were included, your costs would have been higher.
6 2 0 1 8 i S H A R E S S E M I - A N N U A L R E P O R T T O S H A R E H O L D E R S

Schedule of Investments (Unaudited)
iSHARES® EXPONENTIAL TECHNOLOGIES ETFJanuary 31, 2018
Security Shares Value
COMMON STOCKS — 99.79%
BELGIUM — 0.98%
Proximus SADP 238,898 $ 8,083,014
UCB SA 106,003 9,270,141
17,353,155
BRAZIL — 0.53%
TIM Participacoes SA 2,210,355 9,422,249
9,422,249
CANADA — 2.02%
Air Canadaa 417,400 8,134,682
BlackBerry Ltd.a,b 791,268 10,061,361
CGI Group Inc. Class Aa 164,964 9,466,084
WestJet Airlines Ltd. 392,399 7,871,329
35,533,456
CHINA — 0.61%
Ping An Insurance Group Co. of
China Ltd. Class H 903,500 10,702,526
10,702,526
DENMARK — 2.39%
DSV A/S 104,077 8,588,591
Genmab A/Sa 42,683 7,844,721
H Lundbeck A/S 168,817 8,635,545
Novo Nordisk A/S Class B 155,040 8,652,261
Novozymes A/S Class B 151,429 8,427,931
42,149,049
FRANCE — 4.53%
Airbus SE 76,926 8,864,330
Atos SE 56,852 8,994,572
BioMerieux 93,141 8,853,123
Bouygues SA 152,381 8,498,631
Capgemini SE 71,706 9,553,606
Orange SA 479,702 8,691,932
Sanofi 93,778 8,308,522
SCOR SE 203,011 9,117,082
STMicroelectronics NV 377,192 9,035,929
79,917,727
GERMANY — 5.38%
BASF SE 74,231 8,722,082
Bayer AG Registered 65,382 8,586,423
Deutsche Boerse AG 69,434 8,939,510
Deutsche Telekom AG Registered 452,321 7,959,142
Hannover Rueck SE 63,113 8,656,397
Infineon Technologies AG 302,213 8,813,443
Security Shares Value
Merck KGaA 77,292 $ 8,475,141
Muenchener Rueckversicherungs-
Gesellschaft AG in
Muenchen Registered 38,038 8,981,989
QIAGEN NVa 259,140 8,696,872
SAP SE 76,424 8,647,491
Telefonica Deutschland
Holding AG 1,653,640 8,384,293
94,862,783
INDIA — 1.30%
Infosys Ltd. ADR 647,426 11,660,142
Wipro Ltd. ADRb 2,061,037 11,315,093
22,975,235
ITALY — 0.47%
Telecom Italia SpA/Milanoa,b 9,227,993 8,336,737
8,336,737
JAPAN — 3.36%
Chugai Pharmaceutical Co. Ltd. 163,100 8,621,566
FANUC Corp. 40,200 10,855,160
Honda Motor Co. Ltd. 220,600 7,732,267
Mitsubishi Heavy Industries Ltd. 180,700 6,790,632
Takeda Pharmaceutical Co. Ltd. 148,200 8,709,660
Tokyo Electron Ltd. 48,500 9,090,834
Toyota Motor Corp. 109,900 7,531,052
59,331,171
NETHERLANDS — 2.40%
ASM International NV 122,764 8,864,015
ASML Holding NV 47,440 9,644,859
Koninklijke KPN NV 2,253,515 7,916,635
RELX NV 343,321 7,662,107
Wolters Kluwer NV 156,724 8,323,038
42,410,654
NORWAY — 0.48%
Telenor ASA 361,826 8,507,952
8,507,952
RUSSIA — 0.58%
Mobile TeleSystems PJSC ADR 838,277 10,176,683
10,176,683
SOUTH KOREA — 0.45%
Samsung Electronics Co. Ltd. 3,426 8,004,748
8,004,748
SPAIN — 0.99%
Grifols SA 281,096 9,073,046
S C H E D U L E O F I N V E S T M E N T S 7

Schedule of Investments (Unaudited) (Continued)
iSHARES® EXPONENTIAL TECHNOLOGIES ETFJanuary 31, 2018
Security Shares Value
Telefonica SA 808,077 $ 8,307,984
17,381,030
SWEDEN — 2.66%
Elekta AB Class B 961,555 9,210,949
Millicom International Cellular
SA SDR 128,770 9,631,724
Swedish Orphan Biovitrum ABa,b 604,868 10,665,761
Tele2 AB Class B 636,177 7,982,889
Telia Co. AB 1,865,075 9,391,268
46,882,591
SWITZERLAND — 3.88%
ABB Ltd. Registered 310,184 8,658,858
ams AGb 90,991 8,406,096
Kuehne + Nagel International
AG Registered 46,297 8,511,357
Lonza Group AG Registered 31,569 8,792,184
Novartis AG Registered 97,989 8,875,510
Roche Holding AG 32,723 8,076,907
Swiss Re AG 90,062 8,893,816
Swisscom AG Registered 14,968 8,186,028
68,400,756
TAIWAN — 0.95%
MediaTek Inc. 878,000 9,007,291
Taiwan Semiconductor
Manufacturing Co. Ltd. 878,000 7,681,803
16,689,094
UNITED KINGDOM — 3.90%
AstraZeneca PLC 128,159 8,905,575
BT Group PLC 2,306,416 8,378,350
GlaxoSmithKline PLC 469,972 8,824,548
London Stock Exchange
Group PLC 160,005 8,935,306
RELX PLC 363,009 8,042,662
Shire PLC 167,936 7,946,517
Sky PLC 608,873 9,169,331
Vodafone Group PLC 2,683,807 8,571,878
68,774,167
UNITED STATES — 61.93%
3D Systems Corp.a,b 855,315 8,758,426
3M Co. 33,864 8,482,932
Abbott Laboratories 146,731 9,120,799
AbbVie Inc. 85,371 9,580,334
Accenture PLC Class A 54,594 8,773,256
Adobe Systems Inc.a 46,399 9,268,664
Security Shares Value
Advanced Micro Devices Inc.a,b 804,184 $ 11,049,488
Agilent Technologies Inc. 122,673 9,007,878
Albemarle Corp. 63,121 7,043,672
Alexion Pharmaceuticals Inc.a 73,639 8,786,605
Allergan PLC 48,051 8,661,673
Alnylam Pharmaceuticals Inc.a 64,312 8,359,274
Alphabet Inc. Class Aa 7,600 8,984,872
Amazon.com Inc.a 6,587 9,557,012
AMETEK Inc. 112,961 8,618,924
Amgen Inc. 45,949 8,548,811
Amphenol Corp. Class A 90,833 8,426,577
Analog Devices Inc. 93,408 8,582,327
Apple Inc. 48,199 8,069,959
Applied Materials Inc. 157,525 8,448,066
Berkshire Hathaway Inc. Class Ba 41,360 8,866,757
Biogen Inc.a 25,471 8,859,069
BioMarin Pharmaceutical Inc.a 98,814 8,915,987
Bioverativ Inc.a 158,440 16,328,826
BlackRock Inc.c 15,434 8,670,821
Boeing Co. (The) 28,710 10,173,963
Boston Scientific Corp.a 318,545 8,906,518
Bristol-Myers Squibb Co. 131,867 8,254,874
Broadcom Ltd. 29,677 7,360,786
Cavium Inc.a 94,405 8,381,276
Celgene Corp.a 79,098 8,001,554
CH Robinson Worldwide Inc. 92,849 8,491,970
Charles River Laboratories
International Inc.a 78,312 8,257,217
Cisco Systems Inc. 214,482 8,909,582
CME Group Inc. 51,923 7,969,142
Cognizant Technology Solutions
Corp. Class A 142,596 11,119,636
Covanta Holding Corp. 546,099 8,928,719
CSRA Inc. 275,811 9,178,990
Cypress Semiconductor Corp. 542,934 9,387,329
Danaher Corp. 88,540 8,967,331
Dover Corp. 83,485 8,866,942
DowDuPont Inc. 114,506 8,654,363
DXC Technology Co. 86,596 8,620,632
Eaton Corp. PLC 106,183 8,916,187
eBay Inc.a 220,884 8,963,473
Eli Lilly & Co. 94,707 7,713,885
Emerson Electric Co. 124,337 8,980,862
Equinix Inc. 17,600 8,011,344
Exelixis Inc.a 307,654 9,324,993
8 2 0 1 8 i S H A R E S S E M I - A N N U A L R E P O R T T O S H A R E H O L D E R S

Schedule of Investments (Unaudited) (Continued)
iSHARES® EXPONENTIAL TECHNOLOGIES ETFJanuary 31, 2018
Security Shares Value
Facebook Inc. Class Aa 46,738 $ 8,734,865
First Solar Inc.a 126,754 8,514,066
General Electric Co. 460,333 7,443,585
Gilead Sciences Inc. 110,130 9,228,894
Hologic Inc.a 193,449 8,260,272
Honeywell International Inc. 52,193 8,333,656
Illumina Inc.a 37,520 8,728,653
Incyte Corp.a 85,421 7,712,662
Intel Corp. 185,825 8,945,616
Intercept Pharmaceuticals Inc.a,b 138,256 8,585,698
Intercontinental Exchange Inc. 112,841 8,332,179
International Business
Machines Corp. 52,632 8,615,858
Intuitive Surgical Inc.a 21,523 9,290,833
Ionis Pharmaceuticals Inc.a,b 153,228 8,047,535
IQVIA Holdings Inc.a 79,793 8,154,047
Jazz Pharmaceuticals PLCa 60,338 8,793,660
Johnson & Johnson 57,547 7,952,420
KLA-Tencor Corp. 77,679 8,529,154
Laboratory Corp. of
America Holdingsa 52,105 9,092,323
Lam Research Corp. 44,050 8,436,456
Marvell Technology Group Ltd. 367,674 8,577,834
Mastercard Inc. Class A 53,818 9,095,242
Maxim Integrated Products Inc. 156,405 9,540,705
Medtronic PLC 99,098 8,511,527
MercadoLibre Inc.b 29,291 11,338,546
Merck & Co. Inc. 150,447 8,913,985
Microchip Technology Inc. 93,113 8,866,220
Micron Technology Inc.a 193,665 8,467,034
Microsoft Corp. 99,724 9,474,777
Monsanto Co. 68,349 8,324,908
Myriad Genetics Inc.a 244,067 9,001,191
Nasdaq Inc. 101,589 8,219,566
Netflix Inc.a 43,230 11,685,069
NVIDIA Corp. 42,880 10,539,904
Oracle Corp. 169,624 8,750,902
PayPal Holdings Inc.a 109,893 9,376,071
Pfizer Inc. 235,915 8,738,292
PRA Health Sciences Inc.a 97,494 8,877,804
Qorvo Inc.a 114,216 8,197,282
QUALCOMM Inc. 124,117 8,470,985
Quest Diagnostics Inc. 82,630 8,743,907
Red Hat Inc.a 65,741 8,637,053
Regeneron Pharmaceuticals Inc.a 21,819 7,999,936
Security Shares Value
Rockwell Automation Inc. 42,097 $ 8,305,317
Roper Technologies Inc. 30,552 8,572,586
salesforce.com Inc.a 77,985 8,883,271
Schlumberger Ltd. 130,812 9,625,147
Seagate Technology PLC 205,258 11,330,242
Seattle Genetics Inc.a,b 141,305 7,390,252
Skyworks Solutions Inc. 84,414 8,205,885
Southwest Airlines Co. 131,294 7,982,675
Spirit AeroSystems Holdings Inc.
Class A 95,720 9,797,899
Splunk Inc.a 100,009 9,237,831
Sprint Corp.a,b 1,414,259 7,538,000
Stryker Corp. 53,867 8,854,657
T-Mobile U.S. Inc.a 127,705 8,313,596
Tableau Software Inc. Class Aa,b 113,790 8,740,210
TE Connectivity Ltd. 86,382 8,856,746
Tesla Inc.a,b 30,606 10,844,012
Texas Instruments Inc. 83,255 9,130,576
Thermo Fisher Scientific Inc. 43,612 9,773,885
United Continental Holdings Inc.a 128,710 8,729,112
United Technologies Corp. 65,908 9,095,963
United Therapeutics Corp.a,b 60,334 7,783,086
UnitedHealth Group Inc. 36,955 8,750,205
Varian Medical Systems Inc.a,b 71,989 9,178,598
Verizon Communications Inc. 161,595 8,737,442
Versum Materials Inc. 212,379 7,815,547
Vertex Pharmaceuticals Inc.a 58,245 9,719,343
Waters Corp.a 40,825 8,802,278
Western Digital Corp. 103,068 9,170,991
Xilinx Inc. 117,654 8,591,095
XPO Logistics Inc.a,b 105,629 9,975,603
Zoetis Inc. 112,829 8,657,369
1,092,583,168
TOTAL COMMON STOCKS
(Cost: $1,428,356,591) 1,760,394,931
SHORT-TERM INVESTMENTS — 3.86%
MONEY MARKET FUNDS — 3.86%
BlackRock Cash Funds:
Institutional, SL Agency Shares
1.59%c,d,e 66,623,564 66,636,888
S C H E D U L E O F I N V E S T M E N T S 9

Schedule of Investments (Unaudited) (Continued)
iSHARES® EXPONENTIAL TECHNOLOGIES ETFJanuary 31, 2018
Security Shares Value
BlackRock Cash Funds: Treasury,
SL Agency Shares 1,513,006 $ 1,513,006
1.28%c,d 68,149,894
TOTAL SHORT-TERM INVESTMENTS
(Cost: $68,141,155) 68,149,894
TOTAL INVESTMENTS IN
SECURITIES — 103.65% 1,828,544,825
(Cost: $1,496,497,746)
Value
Other Assets, Less Liabilities — (3.65)% $ (64,359,026)
NET ASSETS — 100.00% $1,764,185,799
ADR — American Depositary ReceiptsSDR — Swedish Depositary Receipts
a Non-income producing security.b All or a portion of this security is on loan.c Affiliate of the Fund.d Annualized 7-day yield as of period end.e All or a portion of this security was purchased with cash collateral received
from loaned securities.
Affiliates (Note 2)
Investments in issuers considered to be affiliates of the Fund during the six months ended January 31, 2018, for purposes of
Section 2(a)(3) of the 1940 Act were as follows:
Affiliated issuer
Sharesheld at
07/31/17Shares
purchasedShares
sold
Sharesheld at
01/31/18Value at01/31/18 Income
Net realizedgain (loss) a
Change inunrealized
appreciation(depreciation)
BlackRock Cash Funds: Institutional,SL Agency Shares 97,324,829 — (30,701,265)b 66,623,564 $66,636,888 $341,387c$ (9,188)$ (3,770)
BlackRock Cash Funds: Treasury,SL Agency Shares 1,364,915 148,091b — 1,513,006 1,513,006 9,336 — —
BlackRock Inc. 12,267 5,931 (2,764) 15,434 8,670,821 71,110 40,654 1,933,780
$76,820,715 $421,833 $ 31,466 $ 1,930,010
a Includes realized capital gain distributions from an affiliated fund, if any.b Net of purchases and sales.c Includes the Fund’s portion of securities lending income earned from the reinvestment of cash collateral from loaned securities, net of fees and other
payments to and from borrowers of securities, and less the collateral investment fees.
Fair Value Measurements
Various inputs are used in determining the fair value of financial instruments. For description of the input levels and information
about the Fund’s policy regarding valuation of financial instruments, see Note 1.
The following table summarizes the value of the Fund’s investments according to the fair value hierarchy as of January 31, 2018.
The breakdown of the Fund’s investments into major categories is disclosed in the Schedule of Investments above.
Level 1 Level 2 Level 3 Total
InvestmentsAssets
Common stocks $1,760,394,931 $ — $ — $1,760,394,931Money market funds 68,149,894 — — 68,149,894
Total $1,828,544,825 $ — $ — $1,828,544,825
See notes to financial statements.
10 2 0 1 8 i S H A R E S S E M I - A N N U A L R E P O R T T O S H A R E H O L D E R S
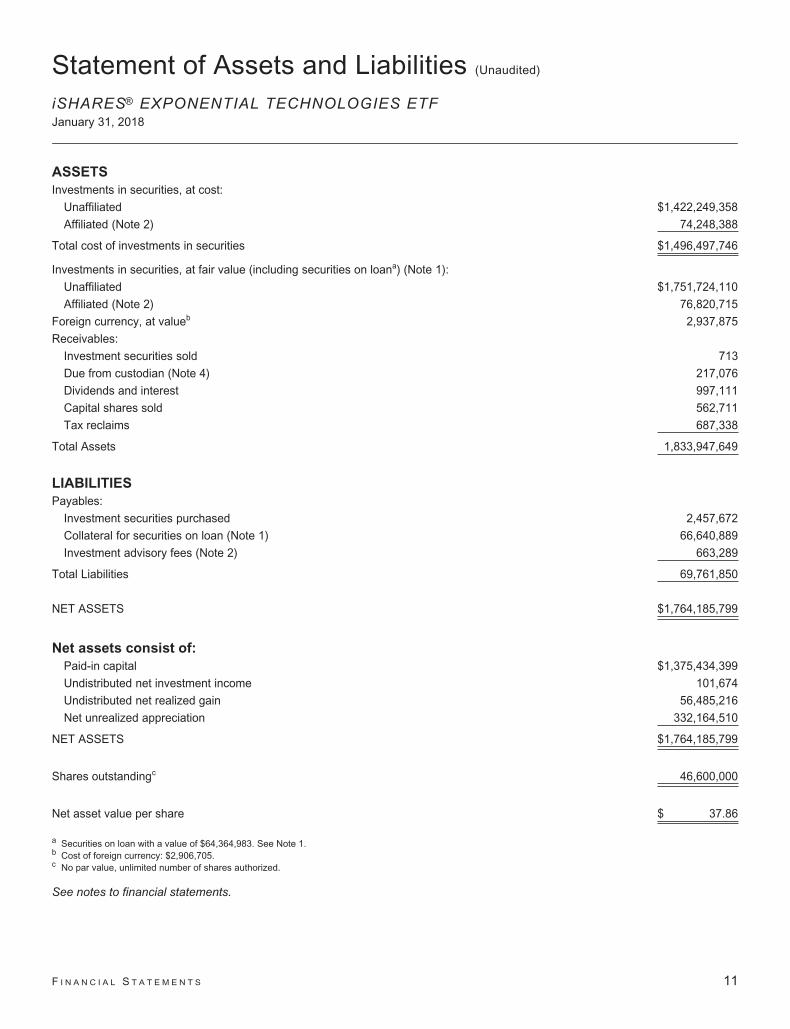
Statement of Assets and Liabilities (Unaudited)
iSHARES® EXPONENTIAL TECHNOLOGIES ETFJanuary 31, 2018
ASSETS
Investments in securities, at cost:
Unaffiliated $1,422,249,358
Affiliated (Note 2) 74,248,388
Total cost of investments in securities $1,496,497,746
Investments in securities, at fair value (including securities on loana) (Note 1):
Unaffiliated $1,751,724,110
Affiliated (Note 2) 76,820,715
Foreign currency, at valueb 2,937,875
Receivables:
Investment securities sold 713
Due from custodian (Note 4) 217,076
Dividends and interest 997,111
Capital shares sold 562,711
Tax reclaims 687,338
Total Assets 1,833,947,649
LIABILITIES
Payables:
Investment securities purchased 2,457,672
Collateral for securities on loan (Note 1) 66,640,889
Investment advisory fees (Note 2) 663,289
Total Liabilities 69,761,850
NET ASSETS $1,764,185,799
Net assets consist of:
Paid-in capital $1,375,434,399
Undistributed net investment income 101,674
Undistributed net realized gain 56,485,216
Net unrealized appreciation 332,164,510
NET ASSETS $1,764,185,799
Shares outstandingc 46,600,000
Net asset value per share $ 37.86
a Securities on loan with a value of $64,364,983. See Note 1.b Cost of foreign currency: $2,906,705.c No par value, unlimited number of shares authorized.
See notes to financial statements.
F I N A N C I A L S T A T E M E N T S 11
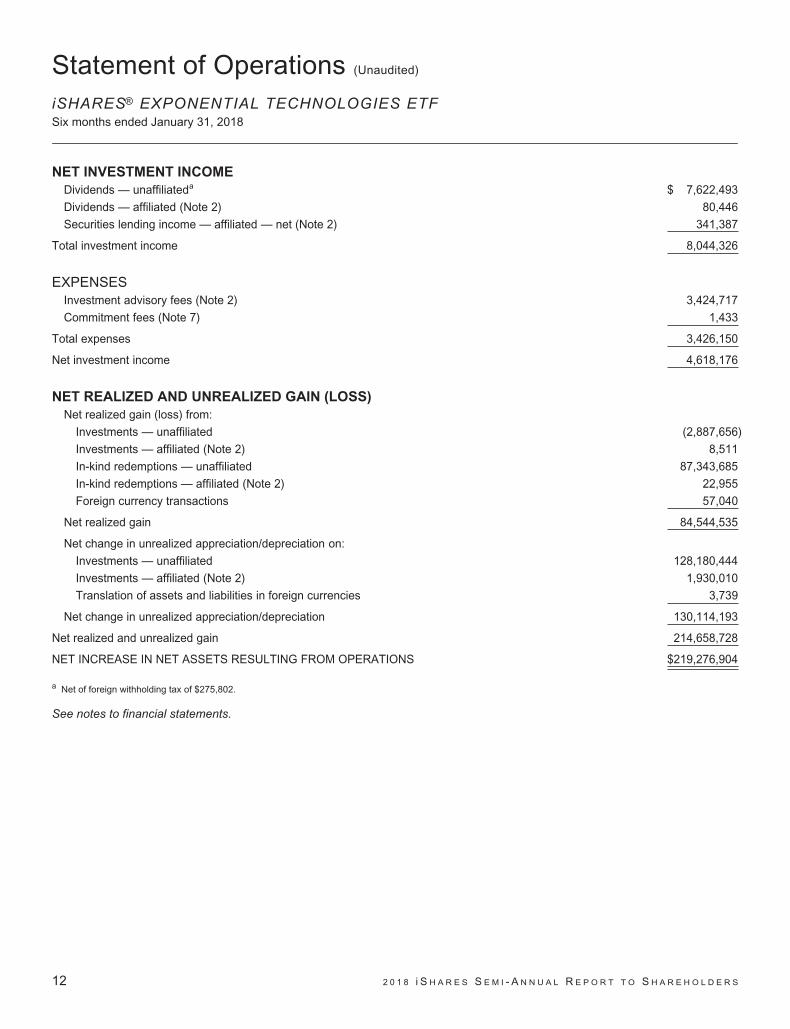
Statement of Operations (Unaudited)
iSHARES® EXPONENTIAL TECHNOLOGIES ETFSix months ended January 31, 2018
NET INVESTMENT INCOME
Dividends — unaffiliateda $ 7,622,493
Dividends — affiliated (Note 2) 80,446
Securities lending income — affiliated — net (Note 2) 341,387
Total investment income 8,044,326
EXPENSESInvestment advisory fees (Note 2) 3,424,717
Commitment fees (Note 7) 1,433
Total expenses 3,426,150
Net investment income 4,618,176
NET REALIZED AND UNREALIZED GAIN (LOSS)
Net realized gain (loss) from:
Investments — unaffiliated (2,887,656)
Investments — affiliated (Note 2) 8,511
In-kind redemptions — unaffiliated 87,343,685
In-kind redemptions — affiliated (Note 2) 22,955
Foreign currency transactions 57,040
Net realized gain 84,544,535
Net change in unrealized appreciation/depreciation on:
Investments — unaffiliated 128,180,444
Investments — affiliated (Note 2) 1,930,010
Translation of assets and liabilities in foreign currencies 3,739
Net change in unrealized appreciation/depreciation 130,114,193
Net realized and unrealized gain 214,658,728
NET INCREASE IN NET ASSETS RESULTING FROM OPERATIONS $219,276,904
a Net of foreign withholding tax of $275,802.
See notes to financial statements.
12 2 0 1 8 i S H A R E S S E M I - A N N U A L R E P O R T T O S H A R E H O L D E R S

Statements of Changes in Net AssetsiSHARES® EXPONENTIAL TECHNOLOGIES ETF
Six months endedJanuary 31, 2018
(Unaudited)Year ended
July 31, 2017
INCREASE (DECREASE) IN NET ASSETS
OPERATIONS:
Net investment income $ 4,618,176 $ 11,919,115
Net realized gain 84,544,535 45,671,153
Net change in unrealized appreciation/depreciation 130,114,193 173,123,800
Net increase in net assets resulting from operations 219,276,904 230,714,068
DISTRIBUTIONS TO SHAREHOLDERS:
From net investment income (4,606,425) (12,481,892)
Total distributions to shareholders (4,606,425) (12,481,892)
CAPITAL SHARE TRANSACTIONS:
Proceeds from shares sold 620,773,597 306,392,550
Cost of shares redeemed (218,798,209) (141,419,614)
Net increase in net assets from capital share transactions 401,975,388 164,972,936
INCREASE IN NET ASSETS 616,645,867 383,205,112
NET ASSETSBeginning of period 1,147,539,932 764,334,820
End of period $1,764,185,799 $1,147,539,932
Undistributed net investment income included in net assets at end of period $ 101,674 $ 89,923
SHARES ISSUED AND REDEEMEDShares sold 17,750,000 10,850,000
Shares redeemed (6,200,000) (5,250,000)
Net increase in shares outstanding 11,550,000 5,600,000
See notes to financial statements.
F I N A N C I A L S T A T E M E N T S 13

Financial HighlightsiSHARES® EXPONENTIAL TECHNOLOGIES ETF(For a share outstanding throughout each period)
Six months endedJan. 31, 2018
(Unaudited)Year ended
Jul. 31, 2017Year ended
Jul. 31, 2016
Period fromMar. 19, 2015a
toJul. 31, 2015
Net asset value, beginning of period $ 32.74 $ 25.95 $ 25.84 $ 25.49
Income from investment operations:
Net investment incomeb 0.11 0.38 0.41 0.18
Net realized and unrealized gainc 5.11 6.79 0.11 0.31
Total from investment operations 5.22 7.17 0.52 0.49
Less distributions from:
Net investment income (0.10) (0.38) (0.41) (0.14)
Total distributions (0.10) (0.38) (0.41) (0.14)
Net asset value, end of period $ 37.86 $ 32.74 $ 25.95 $ 25.84
Total return 15.98%d 27.80% 2.13% 1.91%d
Ratios/Supplemental data:
Net assets, end of period (000s) $1,764,186 $1,147,540 $764,335 $689,925
Ratio of expenses to average net assetse 0.47% 0.47% 0.36% 0.30%
Ratio of expenses to average net assets prior to waived feese n/a n/a 0.47% 0.47%
Ratio of net investment income to average net assetse 0.63% 1.32% 1.71% 1.90%
Portfolio turnover ratef 21%d 23% 28% 1%d
a Commencement of operations.b Based on average shares outstanding throughout each period.c The amounts reported for a share outstanding may not accord with the change in aggregate gains and losses in securities for the fiscal period due to the timing of
capital share transactions in relation to the fluctuating market values of the Fund’s underlying securities.d Not annualized.e Annualized for periods of less than one year.f Portfolio turnover rates exclude portfolio securities received or delivered in Creation Units but include portfolio transactions that are executed as a result of the Fund
processing capital share transactions in Creation Units partially for cash in U.S. dollars. Excluding such cash transactions, the portfolio turnover rates for thesix months ended January 31, 2018, the years ended July 31, 2017, July 31, 2016 and the period ended July 31, 2015 were 21%, 23%, 28% and 1%, respectively.See Note 4.
See notes to financial statements.
14 2 0 1 8 i S H A R E S S E M I - A N N U A L R E P O R T T O S H A R E H O L D E R S

Notes to Financial Statements (Unaudited)
iSHARES® EXPONENTIAL TECHNOLOGIES ETF
iShares Trust (the “Trust”) is registered under the Investment Company Act of 1940, as amended (the “1940 Act”), as an
open-end management investment company. The Trust was established as a Delaware statutory trust pursuant to an Agreement
and Declaration of Trust dated December 16, 1999.
These financial statements relate only to the following fund (the “Fund”):
iShares ETF
Diversification
Classification
Exponential Technologies Non-diversified
The investment objective of the Fund is to seek investment results that correspond generally to the price and yield performance,
before fees and expenses, of its underlying index. The investment adviser uses a “passive” or index approach to try to achieve
the Fund’s investment objective.
Pursuant to the Trust’s organizational documents, the Fund’s officers and trustees are indemnified against certain liabilities that
may arise out of the performance of their duties to the Fund. Additionally, in the normal course of business, the Fund enters into
contracts with service providers that contain general indemnification clauses. The Fund’s maximum exposure under these
arrangements is unknown as this would involve future claims that may be made against the Fund that have not yet occurred.
1. SIGNIFICANT ACCOUNTING POLICIES
The following significant accounting policies are consistently followed by the Fund in the preparation of its financial statements in
conformity with accounting principles generally accepted in the United States of America (“U.S. GAAP”). The preparation of
financial statements in conformity with U.S. GAAP requires management to make certain estimates and assumptions that affect
the reported amounts of assets and liabilities and disclosures of contingent assets and liabilities at the date of the financial
statements and the reported amounts of revenue and expenses during the reporting period. Actual results could differ from those
estimates. The Fund is considered an investment company under U.S. GAAP and follows the accounting and reporting guidance
applicable to investment companies.
SECURITY VALUATION
The Fund’s investments are valued at fair value each day that the Fund’s listing exchange is open and, for financial reporting
purposes, as of the report date should the reporting period end on a day that the Fund’s listing exchange is not open. U.S. GAAP
defines fair value as the price a fund would receive to sell an asset or pay to transfer a liability in an orderly transaction between
market participants at the measurement date. The BlackRock Global Valuation Methodologies Committee (the “Global Valuation
Committee”) provides oversight of the valuation of investments for the Fund. The investments of the Fund are valued pursuant to
policies and procedures developed by the Global Valuation Committee and approved by the Board of Trustees of the Trust (the
“Board”).
• Equity investments traded on a recognized securities exchange are valued at that day’s last reported trade price or the
official closing price, as applicable, on the exchange where the stock is primarily traded. Equity investments traded on a
recognized exchange for which there were no sales on that day are valued at the last traded price.
• Open-end U.S. mutual funds (including money market funds) are valued at that day’s published net asset value (“NAV”).
In the event that application of these methods of valuation results in a price for an investment which is deemed not to be
representative of the fair value of such investment or if a price is not available, the investment will be valued by the Global
N O T E S T O F I N A N C I A L S T A T E M E N T S 15

Notes to Financial Statements (Unaudited) (Continued)
iSHARES® EXPONENTIAL TECHNOLOGIES ETF
Valuation Committee, in accordance with policies approved by the Board. The fair valuation approaches that may be utilized by
the Global Valuation Committee to determine fair value include market approach, income approach and the cost approach. The
valuation techniques used under these approaches take into consideration inputs that include but are not limited to (i) attributes
specific to the investment; (ii) the principal market for the investment; (iii) the customary participants in the principal market for the
investment; (iv) data assumptions by market participants for the investment, if reasonably available; (v) quoted prices for similar
investments in active markets; and (vi) other inputs, such as future cash flows, interest rates, yield curves, volatilities, prepayment
speeds, loss severities, credit risks and/or default rates. Valuations based on such inputs are reported to the Board on a quarterly
basis.
The Global Valuation Committee employs various methods for calibrating valuation approaches for investments where an active
market does not exist, including regular due diligence of the Trust’s pricing vendors, a regular review of key inputs and
assumptions, transactional back-testing or disposition analysis to compare unrealized gains and losses to realized gains and
losses, reviews of missing or stale prices, reviews of large movements in market values, and reviews of market related activity.
Fair value pricing could result in a difference between the prices used to calculate the Fund’s NAV and the prices used by the
Fund’s underlying index, which in turn could result in a difference between the Fund’s performance and the performance of the
Fund’s underlying index.
Various inputs are used in determining the fair value of financial instruments. Inputs may be based on independent market data
(“observable inputs”) or they may be internally developed (“unobservable inputs”). These inputs to valuation techniques are
categorized into a fair value hierarchy consisting of three broad levels for financial reporting purposes as follows:
• Level 1 — Unadjusted quoted prices in active markets for identical assets or liabilities;
• Level 2 — Inputs other than quoted prices included within Level 1 that are observable for the asset or liability either directly
or indirectly, including quoted prices for similar assets or liabilities in active markets, quoted prices for identical or similar
assets or liabilities in markets that are not considered to be active, inputs other than quoted prices that are observable for
the asset or liability (such as exchange rates, financing terms, interest rates, yield curves, volatilities, prepayment speeds,
loss severities, credit risks and default rates) or other market-corroborated inputs; and
• Level 3 — Unobservable inputs for the asset or liability based on the best information available in the circumstances, to the
extent observable inputs are not available, including the Global Valuation Committee’s assumptions used in determining the
fair value of investments.
The hierarchy gives the highest priority to unadjusted quoted prices in active markets for identical assets or liabilities (Level 1
measurements) and the lowest priority to unobservable inputs (Level 3 measurements). Accordingly, the degree of judgement
exercised in determining fair value is greatest for instruments categorized in Level 3. The inputs used to measure fair value may
fall into different levels of the fair value hierarchy. In such cases, for disclosure purposes, the fair value hierarchy classification is
determined based on the lowest level input that is significant to the fair value measurement in its entirety. The fair value hierarchy
for the Fund’s investments is included in its schedule of investments.
Changes in valuation techniques may result in transfers in or out of an assigned level within the fair value hierarchy. In
accordance with the Trust’s policy, transfers between different levels of the fair value hierarchy are deemed to have occurred as
of the beginning of the reporting period. The categorization of values determined for financial instruments are based on the pricing
transparency of the financial instruments and are not necessarily an indication of the risks associated with investing in those
securities.
16 2 0 1 8 i S H A R E S S E M I - A N N U A L R E P O R T T O S H A R E H O L D E R S

Notes to Financial Statements (Unaudited) (Continued)
iSHARES® EXPONENTIAL TECHNOLOGIES ETF
SECURITY TRANSACTIONS AND INCOME RECOGNITION
Security transactions are accounted for on trade date. Realized gains and losses on investment transactions are determined
using the specific identification method. Dividend income and capital gain distributions, if any, are recognized on the ex-dividend
date, net of any foreign taxes withheld at source. Any taxes withheld that are reclaimable from foreign tax authorities as of
January 31, 2018 are reflected in tax reclaims receivable. Upon notification from issuers, some of the dividend income received
from a real estate investment trust may be re-designated as a return of capital or capital gain. Non-cash dividends, if any, are
recognized on the ex-dividend date and recorded as non-cash dividend income at fair value. Distributions received by the Fund
may include a return of capital that is estimated by management. Such amounts are recorded as a reduction of the cost of
investments or reclassified to capital gains. Interest income is accrued daily.
FOREIGN CURRENCY TRANSLATION
The accounting records of the Fund are maintained in U.S. dollars. Foreign currencies, as well as investment securities and other
assets and liabilities denominated in foreign currencies, are translated into U.S. dollars using prevailing market rates as quoted by
one or more data service providers. Purchases and sales of securities, income receipts and expense payments are translated into
U.S. dollars on the respective dates of such transactions.
The Fund does not isolate the effect of fluctuations in foreign exchange rates from the effect of fluctuations in the market prices of
securities. Such fluctuations are reflected by the Fund as a component of realized and unrealized gains and losses from
investments for financial reporting purposes. The Fund reports realized currency gains (losses) on foreign currency related
transactions as components of net realized gain (loss) for financial reporting purposes, whereas such components are generally
treated as ordinary income for U.S. federal income tax purposes.
FOREIGN TAXES
The Fund may be subject to foreign taxes (a portion of which may be reclaimable) on income, stock dividends, capital gains on
investments, or certain foreign currency transactions. All foreign taxes are recorded in accordance with the applicable foreign tax
regulations and rates that exist in the foreign jurisdictions in which the Fund invests. These foreign taxes, if any, are paid by the
Fund and are reflected in its statement of operations as follows: foreign taxes withheld at source are presented as a reduction of
income, foreign taxes on securities lending income are presented as a reduction of securities lending income, foreign taxes on
stock dividends are presented as “other foreign taxes”, and foreign taxes on capital gains from sales of investments and foreign
taxes on foreign currency transactions are included in their respective net realized gain (loss) categories. Foreign taxes payable
or deferred as of January 31, 2018, if any, are disclosed in the Fund’s statement of assets and liabilities.
DISTRIBUTIONS TO SHAREHOLDERS
Dividends and distributions paid by the Fund are recorded on the ex-dividend dates. Distributions are determined on a tax basis
and may differ from net investment income and net realized capital gains for financial reporting purposes. Dividends and
distributions are paid in U.S. dollars and cannot be automatically reinvested in additional shares of the Fund.
LOANS OF PORTFOLIO SECURITIES
The Fund may lend its investment securities to approved borrowers, such as brokers, dealers and other financial institutions. The
borrower pledges and maintains with the Fund collateral consisting of cash, an irrevocable letter of credit issued by an approved
bank, or securities issued or guaranteed by the U.S. government. The initial collateral received by the Fund is required to have a
value of at least 102% of the current value of the loaned securities for securities traded on U.S. exchanges and a value of at least
105% for all other securities. The collateral is maintained thereafter at a value equal to at least 100% of the current value of the
N O T E S T O F I N A N C I A L S T A T E M E N T S 17

Notes to Financial Statements (Unaudited) (Continued)
iSHARES® EXPONENTIAL TECHNOLOGIES ETF
securities on loan. The market value of the loaned securities is determined at the close of each business day of the Fund. Any
additional required collateral is delivered to the Fund and any excess collateral is returned by the Fund on the next business day.
During the term of the loan, the Fund is entitled to all distributions made on or in respect of the loaned securities but does not
receive interest income on securities received as collateral. Loans of securities are terminable at any time and the borrower, after
notice, is required to return borrowed securities within the standard time period for settlement of securities transactions.
Cash received as collateral for securities on loan may be reinvested in certain short-term instruments either directly on behalf of a
fund or through one or more joint accounts or money market funds, including those managed by BlackRock Fund Advisors
(“BFA”), the Fund’s investment adviser, or its affiliates. As of January 31, 2018, any securities on loan were collateralized by cash
and/or U.S. government obligations. Cash collateral received was invested in money market funds managed by BFA and is
disclosed in the schedule of investments. Any non-cash collateral received cannot be sold, re-invested or pledged by the Fund,
except in the event of borrower default. The securities on loan for the Fund are also disclosed in its schedule of investments. The
total value of any securities on loan as of January 31, 2018 and the total value of the related cash collateral are disclosed in the
statement of assets and liabilities. Income earned by the Fund from securities lending is disclosed in the statement of operations.
The risks of securities lending include the risk that the borrower may not provide additional collateral when required or may not
return the securities when due. To mitigate these risks, the Fund benefits from a borrower default indemnity provided by
BlackRock, Inc. (“BlackRock”). BlackRock’s indemnity allows for full replacement of securities loaned if the collateral received
does not cover the value of the securities loaned in the event of borrower default. The Fund could incur a loss if the value of an
investment purchased with cash collateral falls below the value of the loaned securities or if the value of an investment purchased
with cash collateral falls below the value of the original cash collateral received.
Securities lending transactions are entered into by the Fund under Master Securities Lending Agreements (“MSLA”) which
provide the right, in the event of default (including bankruptcy or insolvency) for the non-defaulting party to liquidate the collateral
and calculate a net exposure to the defaulting party or request additional collateral. In the event that a borrower defaults, the
Fund, as lender, would offset the market value of the collateral received against the market value of the securities loaned. The
value of the collateral is typically greater than that of the market value of the securities loaned, leaving the lender with a net
amount payable to the defaulting party. However, bankruptcy or insolvency laws of a particular jurisdiction may impose
restrictions on or prohibitions against such a right of offset in the event of an MSLA counterparty’s bankruptcy or insolvency.
Under the MSLA, the borrower can resell or re-pledge the loaned securities, and the Fund can reinvest cash collateral, or, upon
an event of default, resell or re-pledge the collateral.
18 2 0 1 8 i S H A R E S S E M I - A N N U A L R E P O R T T O S H A R E H O L D E R S

Notes to Financial Statements (Unaudited) (Continued)
iSHARES® EXPONENTIAL TECHNOLOGIES ETF
The following table is a summary of securities lending agreements which are subject to offset under an MSLA as of
January 31, 2018:
Counterparty
Market Value of
Securities on Loan
Cash Collateral
Received a
Net
Amount
BNP Paribas New York Branch $ 42,813 $ 42,813 $ —
Citigroup Global Markets Inc. 13,562,812 13,562,812 —
Credit Suisse Securities (USA) LLC 7,508,535 7,508,535 —
Deutsche Bank Securities Inc. 2,902,184 2,902,184 —
Goldman Sachs & Co. 4,218,800 4,218,800 —
HSBC Bank PLC 25,379 25,379 —
Jefferies LLC 134,451 134,451 —
JPMorgan Securities LLC 16,978,715 16,978,715 —
Merrill Lynch, Pierce, Fenner & Smith 11,856,346 11,856,346 —
Morgan Stanley & Co. LLC 2,014,289 2,014,289 —
National Financial Services LLC 125,348 125,348 —
Nomura Securities International Inc. 60,375 60,375 —
SG Americas Securities LLC 922,057 922,057 —
State Street Bank & Trust Company 2,317,271 2,317,271 —
UBS AG 1,695,608 1,695,608 —
$ 64,364,983 $ 64,364,983 $ —
a Collateral received in excess of the market value of securities on loan is not presented in this table. The total cash collateral received by the Fund isdisclosed in the Fund’s statement of assets and liabilities.
2. INVESTMENT ADVISORY AGREEMENT AND OTHER TRANSACTIONS WITH AFFILIATES
Pursuant to an Investment Advisory Agreement with the Trust, BFA manages the investment of the Fund’s assets. BFA is a
California corporation indirectly owned by BlackRock. Under the Investment Advisory Agreement, BFA is responsible for
substantially all expenses of the Fund, except (i) interest and taxes; (ii) brokerage commissions and other expenses connected
with the execution of portfolio transactions; (iii) distribution fees; (iv) the advisory fee payable to BFA; and (v) litigation expenses
and any extraordinary expenses (in each case as determined by a majority of the independent trustees).
For its investment advisory services to the Fund, BFA is entitled to an annual investment advisory fee of 0.47%, accrued daily and
paid monthly by the Fund, based on the average daily net assets of the Fund.
The U.S. Securities and Exchange Commission has issued an exemptive order which permits BlackRock Institutional Trust
Company, N.A. (“BTC”), an affiliate of BFA, to serve as securities lending agent for the Fund, subject to applicable conditions. As
securities lending agent, BTC bears all operational costs directly related to securities lending. The Fund is responsible for fees in
connection with the investment of cash collateral received for securities on loan in a money market fund managed by BFA,
however, BTC has agreed to reduce the amount of securities lending income it receives in order to effectively limit the collateral
investment fees the Fund bears to an annual rate of 0.04% (the “collateral investment fees”). Securities lending income is equal to
the total of income earned from the reinvestment of cash collateral, net of fees and other payments to and from borrowers of
securities, and less the collateral investment fees. The Fund retains a portion of securities lending income and remits the
remaining portion to BTC as compensation for its services as securities lending agent.
Pursuant to a securities lending agreement, the Fund retains 80% of securities lending income and the amount retained can
never be less than 70% of the total of securities lending income plus the collateral investment fees. Prior to January 1, 2018, the
N O T E S T O F I N A N C I A L S T A T E M E N T S 19

Notes to Financial Statements (Unaudited) (Continued)
iSHARES® EXPONENTIAL TECHNOLOGIES ETF
Fund retained 71.5% of securities lending income and the amount retained was not less than 65% of the total of securities lending
income plus the collateral investment fees.
In addition, commencing the business day following the date that the aggregate securities lending income plus the collateral
investment fees generated across all 1940 Act iShares exchange-traded funds (the “iShares ETF Complex”) in a given calendar
year exceeds the aggregate securities lending income generated across the iShares ETF Complex in the calendar year 2013, the
Fund, pursuant to a securities lending agreement, will retain for the remainder of that calendar year 85% of securities lending
income and the amount retained can never be less than 70% of the total of securities lending income plus the collateral
investment fees. Prior to January 1, 2018, the Fund would have retained for the remainder of that calendar year 75% of securities
lending income and the amount retained would not have been less than 65% of the total of securities lending income plus the
collateral investment fees.
For the six months ended January 31, 2018, the Fund paid to BTC securities lending agent services and collateral investment
fees in the amount of $124,379.
BlackRock Investments, LLC, an affiliate of BFA, is the distributor for the Fund. Pursuant to the distribution agreement, BFA is
responsible for any fees or expenses for distribution services provided to the Fund.
The Fund may invest its positive cash balances in certain money market funds managed by BFA or an affiliate. The income
earned on these temporary cash investments is included in “Dividends — affiliated” in the statement of operations.
The PNC Financial Services Group, Inc. is the largest stockholder of BlackRock and is considered to be an affiliate of the Fund
for 1940 Act purposes.
Certain trustees and officers of the Trust are also officers of BTC and/or BFA.
3. INVESTMENT PORTFOLIO TRANSACTIONS
Purchases and sales of investments (excluding in-kind transactions and short-term investments) for the six months ended
January 31, 2018, were $536,174,666 and $309,879,321, respectively.
In-kind purchases and sales (see Note 4) for the six months ended January 31, 2018, were $393,465,492 and $218,025,954,
respectively.
4. CAPITAL SHARE TRANSACTIONS
Capital shares are issued and redeemed by the Fund only in aggregations of a specified number of shares or multiples thereof
(“Creation Units”) at NAV. Except when aggregated in Creation Units, shares of the Fund are not redeemable. Transactions in
capital shares for the Fund are disclosed in detail in the statements of changes in net assets.
The consideration for the purchase of Creation Units of a fund in the Trust generally consists of the in-kind deposit of a
designated portfolio of securities and a specified amount of cash. Certain funds in the Trust may be offered in Creation Units
solely or partially for cash in U.S. dollars. Investors purchasing and redeeming Creation Units may pay a purchase transaction fee
and a redemption transaction fee directly to State Street Bank and Trust Company, the Trust’s administrator, to offset transfer and
other transaction costs associated with the issuance and redemption of Creation Units, including Creation Units for cash.
Investors transacting in Creation Units for cash may also pay an additional variable charge to compensate the relevant fund for
certain transaction costs (i.e., stamp taxes, taxes on currency or other financial transactions, and brokerage costs) and market
20 2 0 1 8 i S H A R E S S E M I - A N N U A L R E P O R T T O S H A R E H O L D E R S

Notes to Financial Statements (Unaudited) (Continued)
iSHARES® EXPONENTIAL TECHNOLOGIES ETF
impact expenses relating to investing in portfolio securities. Such variable charges, if any, are included in “Proceeds from shares
sold” in the statement of changes in net assets.
From time to time, settlement of securities related to in-kind contributions or in-kind redemptions may be delayed. In such cases,
securities related to in-kind contributions are reflected as “Due from custodian” and securities related to in-kind redemptions are
reflected as “Securities related to in-kind transactions” in the statement of assets and liabilities.
5. PRINCIPAL RISKS
In the normal course of business, the Fund invests in securities or other instruments and may enter into certain transactions, and
such activities subject the Fund to various risks, including, among others, fluctuations in the market (market risk) or failure of an
issuer to meet all of its obligations. The value of securities or other instruments may also be affected by various factors, including,
without limitation: (i) the general economy; (ii) the overall market as well as local, regional or global political and/or social
instability; (iii) regulation, taxation or international tax treaties between various countries; or (iv) currency, interest rate or price
fluctuations. The Fund’s prospectus provides details of the risks to which the Fund is subject.
BFA uses a “passive” or index approach to try to achieve the Fund’s investment objective following the securities included in its
underlying index during upturns as well as downturns. BFA does not take steps to reduce market exposure or to lessen the
effects of a declining market. Divergence from the underlying index and the composition of the portfolio is monitored by BFA.
MARKET RISK
Market risk arises mainly from uncertainty about future values of financial instruments influenced by price, currency and interest
rate movements. It represents the potential loss a fund may suffer through holding market positions in the face of market
movements. A fund is exposed to market risk by its investment in equity, fixed income and/or financial derivative instruments or
by its investment in underlying funds. The fair value of securities held by a fund may decline due to general market conditions,
economic trends or events that are not specifically related to the issuers of the securities including local, regional or global
political, social or economic instability or to factors that affect a particular industry or group of industries. The extent of a fund’s
exposure to market risk is the market value of the investments held as shown in the fund’s schedule of investments.
A diversified portfolio, where this is appropriate and consistent with a fund’s objectives, minimizes the risk that a price change of a
particular investment will have a material impact on the NAV of a fund. The investment concentrations within the Fund’s portfolio
are disclosed in its schedule of investments.
Investing in the securities of non-U.S. issuers involves certain considerations and risks not typically associated with securities of
U.S. issuers. Such risks include, but are not limited to: differences in accounting, auditing and financial reporting standards; more
substantial governmental involvement in the economy; higher inflation rates, greater social, economic and political uncertainties;
possible nationalization or expropriation of assets; less availability of public information about issuers; imposition of withholding or
other taxes; higher transaction and custody costs and delays in settlement procedures; and lower level of regulation of the
securities markets and issuers. Non-U.S. securities may be less liquid, more difficult to value, and have greater price volatility due
to exchange rate fluctuations. These and other risks are heightened for investments in issuers from countries with less developed
capital markets.
The economies and markets of European countries are often closely connected and interdependent, and events in one country in
Europe can have an adverse impact on other European countries. The European financial markets have experienced volatility
and adverse trends in recent years due to concerns about economic downturns or rising government debt levels in several
European countries. These events have adversely affected the exchange rate of the euro and may continue to significantly affect
European countries. The occurrence of terrorist incidents throughout Europe also could impact financial markets. In addition, the
N O T E S T O F I N A N C I A L S T A T E M E N T S 21

Notes to Financial Statements (Unaudited) (Continued)
iSHARES® EXPONENTIAL TECHNOLOGIES ETF
United Kingdom has voted to withdraw from the European Union. The referendum may introduce significant new uncertainties
and instability in the financial markets as the United Kingdom negotiates its exit from the European Union.
The United States and the European Union, along with the regulatory bodies of a number of countries including Japan, Australia,
Norway, Switzerland and Canada, have imposed economic sanctions, which consist of asset freezes and sectorial sanctions, on
certain Russian individuals and Russian corporate entities. Broader sanctions on Russia could also be instituted. These
sanctions, or even the threat of further sanctions, may result in the decline of the value and liquidity of Russian securities, a
weakening of the ruble or other adverse consequences to the Russian economy. Current or future sanctions may result in Russia
taking counter measures or retaliatory actions, which may further impair the value and liquidity of Russian securities. These
retaliatory measures may include the immediate freeze of Russian assets held by a fund.
CREDIT RISK
Credit risk is the risk that an issuer or guarantor of debt instruments or the counterparty to a financial transaction, including
derivatives contracts, repurchase agreements or loans of portfolio securities, is unable or unwilling to make timely interest and/or
principal payments or to otherwise honor its obligations. BFA and its affiliates manage counterparty credit risk by entering into
transactions only with counterparties that they believe have the financial resources to honor their obligations and by monitoring
the financial stability of those counterparties. Financial assets, which potentially expose a fund to issuer and counterparty credit
risks, consist principally of financial instruments and receivables due from counterparties. The extent of a fund’s exposure to
credit and counterparty risks with respect to those financial assets is approximated by their value recorded in its statement of
assets and liabilities.
6. INCOME TAX INFORMATION
The Fund is treated as an entity separate from the Trust’s other funds for federal income tax purposes. It is the policy of the Fund
to qualify as a regulated investment company by complying with the provisions applicable to regulated investment companies, as
defined under Subchapter M of the Internal Revenue Code of 1986, as amended, and to annually distribute substantially all of its
ordinary income and any net capital gains (taking into account any capital loss carryforwards) sufficient to relieve it from all, or
substantially all, federal income and excise taxes. Accordingly, no provision for federal income taxes is required.
For purposes of U.S. GAAP, in-kind redemptions are treated as sales of securities resulting in realized capital gains or losses to
the Fund. Because such gains or losses are not taxable to the Fund and are not distributed to existing Fund shareholders, the
gains or losses are reclassified from accumulated net realized gain (loss) to paid-in capital at the end of the Fund’s tax year.
These reclassifications have no effect on net assets or NAV per share.
The tax character of current year distributions will be determined at the end of the current fiscal year.
As of July 31, 2017, the Fund’s fiscal year-end, the Fund had non-expiring capital loss carryforwards in the amount of
$22,795,782 available to offset future realized capital gains.
The Fund may own shares in certain foreign investment entities, referred to, under U.S. tax law, as “passive foreign investment
companies.” The Fund may elect to mark-to-market annually the shares of each passive foreign investment company and would
be required to distribute to shareholders any such marked-to-market gains.
As of January 31, 2018, the cost of investments (including short positions and derivatives, if any) for federal income tax purposes
was $1,501,761,283. Net unrealized appreciation was $326,783,542, of which $354,224,999 represented gross unrealized
appreciation on securities and $27,441,457 represented gross unrealized depreciation on securities.
22 2 0 1 8 i S H A R E S S E M I - A N N U A L R E P O R T T O S H A R E H O L D E R S

Notes to Financial Statements (Unaudited) (Continued)
iSHARES® EXPONENTIAL TECHNOLOGIES ETF
Management has analyzed tax laws and regulations and their application to the Fund as of January 31, 2018, inclusive of the
open tax return years, and does not believe there are any uncertain tax positions that require recognition of a tax liability in the
Fund’s financial statements.
7. LINE OF CREDIT
The Fund, along with certain other iShares funds, is a party to a $275 million credit agreement with State Street Bank and Trust
Company, which expires on October 24, 2018. The Fund became a party to the credit agreement effective October 25, 2017. The
line of credit may be used for temporary or emergency purposes, including redemptions, settlement of trades and rebalancing of
portfolio holdings. The credit agreement has the following terms: a commitment fee of 0.20% per annum on the unused portion of
the credit agreement and interest at a rate equal to the higher of (a) the one-month LIBOR (not less than zero) plus 1.00% per
annum or (b) the U.S. Federal Funds rate (not less than zero) plus 1.00% per annum on amounts borrowed. The commitment fee
is allocated to each fund participating in the credit agreement based on each fund’s pro-rata share of the aggregate average daily
value of assets invested in local securities of certain foreign markets.
The Fund did not borrow under the credit agreement during the six months ended January 31, 2018.
8. LEGAL PROCEEDINGS
On June 16, 2016, investors (the “Plaintiffs”) in certain iShares funds (iShares Core S&P Small-Cap ETF, iShares Russell 1000
Growth ETF, iShares Core S&P 500 ETF, iShares Russell Mid-Cap Growth ETF, iShares Russell Mid-Cap ETF, iShares Russell
Mid-Cap Value ETF, iShares Select Dividend ETF, iShares Morningstar Mid-Cap ETF, iShares Morningstar Large-Cap ETF,
iShares U.S. Aerospace & Defense ETF and iShares U.S. Preferred Stock ETF) filed a putative class action lawsuit against
iShares Trust, BlackRock, Inc. and certain of its advisory affiliates, and certain directors/trustees and officers of the Funds
(collectively, “Defendants”) in California State Court. The lawsuit alleges the Defendants violated federal securities laws by failing
to adequately disclose in the prospectuses issued by the funds noted above the risks of using stop-loss orders in the event of a
‘flash crash’, such as the one that occurred on May 6, 2010. On September 18, 2017, the court issued a Statement of Decision
holding that the Plaintiffs lack standing to assert their claims. On October 11, 2017, the court entered final judgment dismissing all
of the Plaintiffs’ claims with prejudice. Plaintiffs have appealed the court’s decision.
9. SUBSEQUENT EVENTS
Management has evaluated the impact of all subsequent events on the Fund through the date the financial statements were
available to be issued and has determined that there were no subsequent events requiring adjustment or disclosure in the
financial statements.
N O T E S T O F I N A N C I A L S T A T E M E N T S 23
Supplemental Information (Unaudited)
iSHARES® EXPONENTIAL TECHNOLOGIES ETF
Section 19(a) Notices
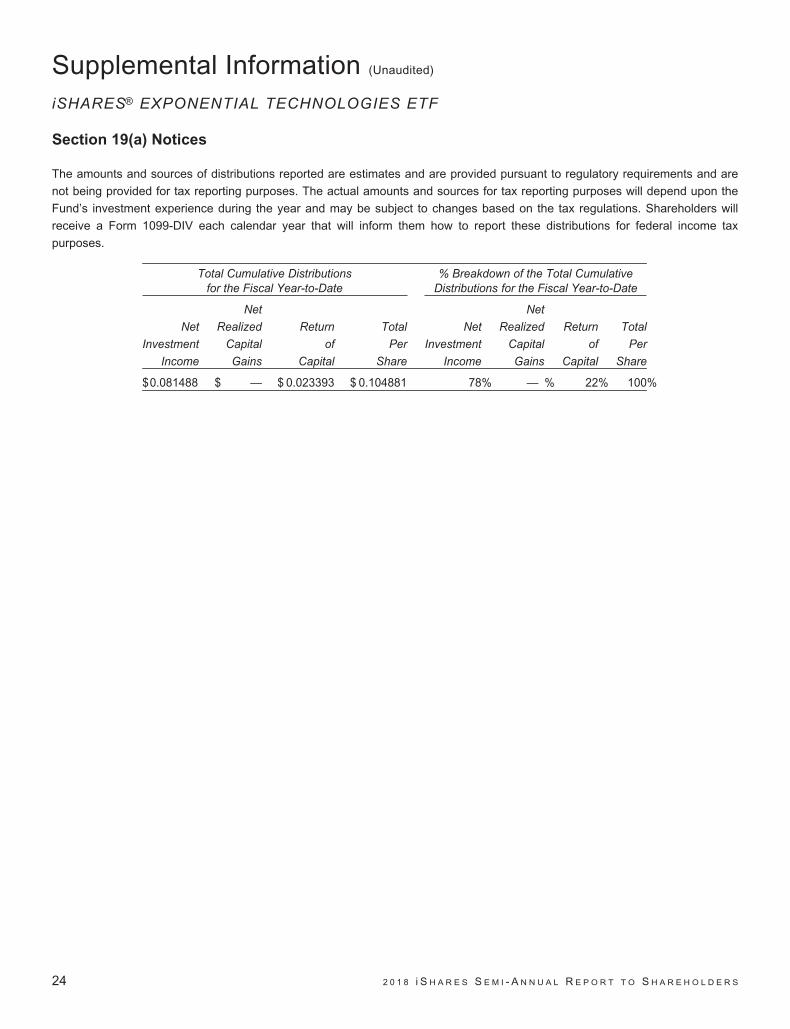
The amounts and sources of distributions reported are estimates and are provided pursuant to regulatory requirements and are
not being provided for tax reporting purposes. The actual amounts and sources for tax reporting purposes will depend upon the
Fund’s investment experience during the year and may be subject to changes based on the tax regulations. Shareholders will
receive a Form 1099-DIV each calendar year that will inform them how to report these distributions for federal income tax
purposes.
Total Cumulative Distributionsfor the Fiscal Year-to-Date
% Breakdown of the Total CumulativeDistributions for the Fiscal Year-to-Date
Net
Investment
Income
Net
Realized
Capital
Gains
Return
of
Capital
Total
Per
Share
Net
Investment
Income
Net
Realized
Capital
Gains
Return
of
Capital
Total
Per
Share
$0.081488 $ — $ 0.023393 $ 0.104881 78% — % 22% 100%
24 2 0 1 8 i S H A R E S S E M I - A N N U A L R E P O R T T O S H A R E H O L D E R S

General Information
Electronic Delivery
Shareholders can sign up for email notifications announcing that the shareholder report or prospectus has been posted on the
iShares website at www.iShares.com. Once you have enrolled, you will no longer receive prospectuses and shareholder reports
in the mail.
To enroll in electronic delivery:
• Go to www.icsdellivery.com.
• If your brokerage firm is not listed, electronic delivery may not be available. Please contact your brokerage-dealer or
financial advisor.
Householding
Householding is an option available to certain fund investors. Householding is a method of delivery, based on the preference of
the individual investor, in which a single copy of certain shareholder documents can be delivered to investors who share the same
address, even if their accounts are registered under different names. Please contact your broker-dealer if you are interested in
enrolling in householding and receiving a single copy of prospectuses and other shareholder documents, or if you are currently
enrolled in householding and wish to change your householding status.
Availability of Quarterly Schedule of Investments
The iShares Funds file their complete schedule of portfolio holdings with the SEC for the first and third quarters of each fiscal year
on Form N-Q. The iShares Funds’ Forms N-Q are available on the SEC’s website and may be reviewed and copied at the SEC’s
Public Reference Room in Washington, D.C. Information on the operation of the Public Reference Room may be obtained by
calling 1-800-SEC-0330. The iShares Funds also disclose their complete schedule of portfolio holdings on a daily basis on the
iShares website.
Availability of Proxy Voting Policies and Proxy Voting Records
A description of the policies and procedures that the iShares Funds use to determine how to vote proxies relating to portfolio
securities and information about how the iShares Funds voted proxies relating to portfolio securities during the most recent
twelve-month period ending June 30 is available without charge, upon request (1) by calling toll-free 1-800-474-2737; (2) on the
iShares website at www.iShares.com; and (3) on the SEC website at www.sec.gov.
G E N E R A L I N F O R M A T I O N 25

Notes:
26 2 0 1 8 i S H A R E S S E M I - A N N U A L R E P O R T T O S H A R E H O L D E R S


For more information visit www.iShares.com or call 1-800-iShares (1-800-474-2737)
This report is intended for the Fund’s shareholders. It may not be distributed to prospective investors unless it is preceded or accompanied by
the current prospectus.
Investing involves risk, including possible loss of principal.
The iShares Funds are distributed by BlackRock Investments, LLC (together with its affiliates, “BlackRock”).
The iShares Funds are not sponsored, endorsed, issued, sold or promoted by Morningstar, Inc., nor does this company make any representation regardingthe advisability of investing in the iShares Funds. BlackRock is not affiliated with the company listed above.
©2018 BlackRock, Inc. All rights reserved. iSHARES and BLACKROCK are registered trademarks of BlackRock, Inc. or its subsidiaries. All other marks arethe property of their respective owners.iS
-SA
R-7
01-0
118


