
MARKET OUTLOOK PT Trimegah Securities Tbk - www.trimegah.com 1
Global factors adding to uncertainty level...
Mr. Trump is entering US presidential office with a promise to expand
fiscal stimulus that may prompt the Fed to raise rates more often than
previously expected, and we continue to expect volatility in Europe next
year given elections in Germany and France. Higher expectation for US
growth and a stronger Dollar are usually negative for emerging markets
overall. Foreign investors have recorded USD851mn of net sell in Indo-
nesian equity in Nov with risk of another USD500mn—1bn if Fed indeed
indicates plans to be more aggressive.
...but domestic economy is actually better than six months ago
We track seven micro indicators and found recent economic momentum
more encouraging, raising our stance from neutral to slight positive. Our
proprietary survey (see p.63) also suggests that Indonesians plan to
spend more on property, autos and travelling although less on gadgets
and luxury items. A signal that economy is still recovering on a U-curve
trajectory.
JCI: downside to 5053 near-term, upside to 5964 by end-2017
With 4% downside and 14% upside from index level of 5246 (last clos-
ing before report publication) and a 27% expected earnings growth next
year should be able to cushion the downside, we remain cautious near-
term but more constructive medium-term, especially from end 1Q on-
ward.
Portfolio: tilting towards defensives and commodities for now
We populate our model portfolio with more defensives (MIKA, GGRM,
ROTI) and commodities (DOID, PTBA, PGAS). We also add WSKT (a low
beta construction company that has de-rated) and MAPI (attractive
bottom-up catalyst of Vietnam expansion).
2017 Indonesia market outlook Plenty of earnings growth ahead
2017 market outlook
5 December 2016
JCI Index Target:
JCI Index (as of 28 Nov16) 5,115
End-2016 5,053
1Q-2017 5,229
2Q-2017 5,598
End-2017 5,964
Sebastian Tobing
Rovandi
Trimegah research team
Trimegah’s model portfolio
Source: Trimegah Research, Bloomberg
Note: Given the time required to prepare the report, all index and stock prices in this report are as at end of 28 Nov 2016.
Top
picks
Price (Rp)
Mkt. Cap
TP Rec
EPS growth
P/E (x) EV/EBITDA
(x) P/BV (x)
Divd yield
Beta Upside
28-Nov (Rptrn) 2017 2017 2017 2017 2017 2yr
weekly
DOID 515 4.3 800 55% Buy 99% 4.4 3.4 1.6 0% 1.3
PTBA 11,550 26.6 16,000 39% Buy 125% 6.5 4.3 1.9 2% 1.6
PGAS 2,620 63.5 3,300 26% Buy 12% 9.1 6.0 1.3 3% 1.2
WSKT 2,270 30.8 2,910 28% Buy 81% 14.5 9.5 2.5 1% 0.6
MAPI 4,870 8.1 7,200 48% Buy 109% 16.0 6.2 2.2 0% 0.9
MIKA 2,580 37.2 3,000 16% Buy 11% 47.9 36.1 9.7 1% 0.4
GGRM 62,775 120.8 82,000 31% Buy 19% 15.3 10.0 2.8 4% 0.8
ROTI 1,455 7.4 1,900 31% Buy 22% 22.5 10.1 4.4 1% 0.9
Simple average 34% 60% 17.0 10.7 3.3 2% 0.96
Note: Given the time required to pre-
pare the report, all share prices in this
report are as at end of 28 Nov 2016.

PT Trimegah Securities Tbk - www.trimegah.com MARKET OUTLOOK 2
Table of contents
Economic outlook 3
- Global factors 3
- Indonesia's economy 7
Investment themes 12
Equity strategy 15
Sector and company pages 20
- Bank sector 20
- Automotive sector 50
- Consumer sector (staples, retail, healthcare) 60
- Telecommunication sector 100
- Media sector 120
- Construction sector 130
- Property sector 147
- Cement sector 172
- Coal sector 182
- Others (companies not in a specific sector) 200

PT Trimegah Securities Tbk - www.trimegah.com MARKET OUTLOOK 3
Global factors have raised uncertainty levels
Higher global interest rates is becoming a real concern
Mr. Trump’s win in US presidential election has changed US growth and global interest rate expectations over-
night. We are likely to see larger fiscal stimulus plan in the US (Trump has mentioned USD1trn stimulus plan or
6% of GDP), stronger USD, and higher yields. With upcoming fiscal stimulus and already rising inflation, expect
US Fed to accelerate its interest rate hike. We think expectation was for a 50bps increase next year before Mr.
Trump’s win, but there is higher likelihood of a 100bps increase now. US 10 year treasury yield has risen by
~400bps (basis points) to 2.3% and the US rate curve has steepened in the process with 10-2yr treasury yield
rising by 20bps to 1.2% since Mr. Trump’s win.
How high can US Fed rate go?
We think a 25bps US Fed rate increase in December to 75bps was already a high likelihood even if Mr. Trump
had not won the US presidential election. The question is, how much will the Fed increases its rate next year?
Currently Fed rate is at 0.5% with a –1.1% spread over inflation Versus 0.9% long-term spread (30 years histor-
ical average). Assuming the spread over inflation returns to its historical average, Fed rate should rise by 2.0%
to 2.5%. History suggests that Fed rate’s return to normalcy usually takes about two years or on average 25bps
per quarter. Note however, that inflation is also a moving statistic. US inflation swap forward currently stands at
2.5% (a hedging instrument that indicates market’s inflation expectation). If we use this as US inflation bench-
mark, we are looking at Fed rate rising by 2.9% (290 bps) to 3.4%. To put this in perspective, the last time Fed
rate was 3% was in March 2008 before global financial crisis hit its peak.
Figure 1. Fed rate and spread over inflation
Source: Bloomberg, Trimegah Research
Figure 2. Fed rate, inflation, and inflation swap forward
Source: Bloomberg, Trimegah Research
-3.0%
-2.0%
-1.0%
0.0%
1.0%
2.0%
3.0%
4.0%
5.0%
6.0%
2006 2007 2008 2009 2010 2011 2012 2013 2014 2015 2016
US Inflation Swap Forward US Inflation Fed Rate
-6.0%
-4.0%
-2.0%
0.0%
2.0%
4.0%
6.0%
8.0%
10.0%
12.0%
1986
1988
1990
1992
1994
1996
1998
2000
2002
2004
2006
2008
2010
2012
2014
Fed RateUS InflationFed spread over US inflation
-5.0%
-4.0%
-3.0%
-2.0%
-1.0%
0.0%
1.0%
2.0%
3.0%
4.0%
5.0%
6.0%
1986
1988
1990
1992
1994
1996
1998
2000
2002
2004
2006
2008
2010
2012
2014
Fed spread over US inflation
Average spread in last 30 years

PT Trimegah Securities Tbk - www.trimegah.com MARKET OUTLOOK 4
How does an accelerated interest rate hike in the US affect Indonesia?
In order to do an analysis with longer historical data, we use adjusted BI rate, which is calculated by assuming
same rate cut to BI rate as recent 7-days repo rate. Current adjusted BI rate is 6.0% (BI has cut by 50bps after
switching benchmark rate to 7-days repo rate). Based on latest inflation rate of 3.3%, BI real rate is at 2.7%
and the current spread over Fed real rate is at 3.8% versus average historical spread of 2.7%. This implies that
BI has room of 1.1% before having to increase its rate. It also means there is a risk of 0.9-1.8% increase in BI
rate based on our earlier calculation of a 2.0-2.9% risk of increase in Fed rate over the next two years.
Indonesia’s 10yr govt bond yield is currently 8.2% and US 10yr treasury at 2.4%, implying a 5.8% nominal
spread Vs. historical average of 5.1%. Indonesia’s real rate (taking into account current inflation) is 4.9% and
US at 0.8%, implying 4.1% real spread Vs. historical average of 1.3%. This implies that judging by nominal rate,
there is a risk we could see Indonesia’s 10yr bond yield rising to as high as 9.4% based on US inflation forward
swap currently at 2.5%. Judging by average historical real yield at only 1.3%, Indonesia’s 10yr bond yield could
be as low as 7.0%. The mid-point of the 7.0-9.4% range is 8.2%, exactly where current Indonesia’s 10yr bond
yield is.
Figure 3. BI adjusted real rate currently at 3.8% above Fed real rate Vs. 2.7% average
Source: Bloomberg, Trimegah Research
Figure 4. Indonesia’s nominal and real 10 yr govt bonds spread over US 10 year treasury bonds
Source: Bloomberg, Trimegah Research
-1.0%
0.0%
1.0%
2.0%
3.0%
4.0%
5.0%
6.0%
7.0%
2010 2011 2012 2013 2014 2015 2016
BI real rate spread over Fed real rate Average real spread
2.0%
4.0%
6.0%
8.0%
10.0%
12.0%
14.0%
2003
2004
2005
2006
2007
2008
2009
2010
2011
2012
2013
2014
2015
2016
Indo 10yr nominal spread over US treasury
Average nominal spread
-3.0%
-2.0%
-1.0%
0.0%
1.0%
2.0%
3.0%
4.0%
5.0%
6.0%
2010 2011 2012 2013 2014 2015 2016
Indo 10yr real spread over US treasury
Average real spread

PT Trimegah Securities Tbk - www.trimegah.com MARKET OUTLOOK 5
Indo govt bonds’ yield curve remains flat Vs. other countries steepening
We think it is also worth highlighting that Indonesia’s yield curve remains flat, up to the point that on some days
7yr bonds’ yield could be slightly higher than 10yr bonds. Other countries are already undergoing a steepening
yield curve process. Could Indonesia continue to break the global trend? We do not think so. The question is
whether the short and medium end of the curve falling or the long-end rising. We think there is still risk that the
long-end of the curve (or the 10yr) rising in the near-term.
Figure 5. Indonesia govt bonds’ yield curve currently compared to end-2013 and end-2010
Source: Bloomberg, Trimegah Research
3.0%
4.0%
5.0%
6.0%
7.0%
8.0%
9.0%
1yr 2yr 3yr 4yr 5yr 6yr 7yr 8yr 9yr 10yr
28-Nov-16 31-Dec-13 31-Dec-10

PT Trimegah Securities Tbk - www.trimegah.com MARKET OUTLOOK 6
Risk of IDR weakening against USD
Our interest rate analysis is based on spreads returning to historical averages, but as we could see in the charts,
there were significant deviations from averages. Interest rates could overshoot while finding a new equilibrium,
and so does exchange rate. Historically, US 10 yr treasury yield has a positive correlation with USDIDR spot.
USDIDR already depreciated throughout 2014-16 though, which may reduce the impact of a rapidly rising treas-
ury yield (from 1.5% to currently 2.4% in the last several months).
More charts below show that Indo’s 10yr nominal spread over US treasury and US 10-2yr treasury spread
(measure of steepness of interest rate curve in the US) also show positive correlation. These all suggest that
short-term financial capital flows still have significant effect on the Rupiah standing against USD. We think long-
term fundamentals (which really have not changed much) of Indonesia’s economy and the fact that Rupiah has
depreciated significantly in the past two years should alleviate the impact, but nonetheless we can not ignore the
risk of another 5% depreciation in Rupiah to ~14200 level.
Figure 6. US 10 yr treasury yield Vs. USDIDR
Source: Bloomberg, Trimegah Research
Figure 7. Indo’s 10 yr govt bond nominal spread
Vs. USDIDR
Source: Bloomberg, Trimegah Research
Figure 8. US treasury 10-2yr spread Vs. USDIDR
8000
9000
10000
11000
12000
13000
14000
15000
1.0%
1.5%
2.0%
2.5%
3.0%
3.5%
4.0%
4.5%
5.0%
5.5%
6.0%
2001
2002
2003
2004
2005
2006
2007
2008
2009
2010
2011
2012
2013
2014
2015
2016
US 10 yr treasury yield (LHS) USDIDR spot (RHS)
8000
9000
10000
11000
12000
13000
14000
15000
0.0%
2.0%
4.0%
6.0%
8.0%
10.0%
12.0%
14.0%
16.0%
18.0%
20.0%
2001
2003
2005
2007
2009
2011
2013
2015
Indonesia 10yr Govt bond nominal spreadover US treasury (LHS)
USDIDR (RHS)
8000
9000
10000
11000
12000
13000
14000
15000
-0.5%
0.0%
0.5%
1.0%
1.5%
2.0%
2.5%
3.0%
3.5%
2001
2002
2003
2004
2005
2006
2007
2008
2009
2010
2011
2012
2013
2014
2015
2016
US treasury 10-2yr spread (LHS)
USDIDR (RHS)

PT Trimegah Securities Tbk - www.trimegah.com MARKET OUTLOOK 7
Indonesia’s economy is still on a path of gradual recovery
Micro indicators are actually improving
We track seven micro indicators ranging from auto sales volume to banking system’s loan and deposit growth.
Compared to our last assessment in May16, three out of seven indicators have improved and the economic sig-
nal indicated by these factors has improved from “neutral” in May16 to currently “slight positive” (most of these
indicators latest data point is Oct16).
The big question of course, is whether a combination of likely higher interest rates and further Rupiah deprecia-
tion in the short-term could halt economic progress. Our recent conversations with the real sector (IDR revenue)
suggest they are still digesting the impact of Mr. Trump’s win and have not made significant changes to their
plans other than reviewing USD costs and capex. The nature of a potential further depreciation is also important.
A swift depreciation (and likely overshooting) would have a larger negative psychological and real effect than a
gradual depreciation.
We think rising interest rate is unlikely to have significant effect on loan growth and the economy either, espe-
cially as we see little risk of BI raising benchmark rate significantly. Indonesian banks only registered 3.8% YoY
loan growth year-to-date, far below 10.4% in 2015 and 11.6% in 2014.
Hence, despite risk of a depreciating Rupiah and rising interest rate, we still expect GDP growth of 5.1%, similar
to this year. There is upside risk if coal price remains at current level of USD90/ton versus our forecast of
USD75/ton for next year. Kalimantan and South Sumatra combined is 28% of Indonesia’s GDP but the ripple
effect can be larger than Kalimantan’s and South Sumatra’s contribution to Indonesia GDP suggests.
Figure 9. Micro indicators are improving
Source: Trimegah research
Economic indicators May-16 Nov-16
Auto sales volume Positive Positive
Property marketing sales Neutral Neutral
Cement consumption Negative Negative
Retail SSSG Neutral Neutral
Imports growth Negative Positive
SOE construction order book Neutral Positive
Loan and deposit growth Negative Negative
Overall Neutral Slight Positive

PT Trimegah Securities Tbk - www.trimegah.com MARKET OUTLOOK 8
Indicator #1: Auto sales momentum remain positive
The positive 4W sales volume momentum that started rebounding in Aug15 has continued its positive trajectory
and we remain upbeat on next year’s 4W volume, expecting ~10% growth, an improvement over this year’s 3%
growth pace (Jan-Oct YoY). 2W sales volume growth remains in negative territory, but at least has stopped
worsening. We are less optimistic on 2W volume as penetration has already reached 40% in 2W (versus 5% for
4W) and expect a structural change in marketing strategy whereby 2W distributors would focus more on increas-
ing ASP by launching higher-end new models (some of recent models are priced at IDR 50mn versus normally
~IDR 15mn).
We have also noticed higher volume of upper-end 4W, which signals higher propensity to spend by upper-end
consumers.
Figure 10. Indonesia 4W sales volume growth YoY
Source: Bloomberg, TRIM Research
Figure 11. Indonesia 2W sales volume growth YoY
Source: Bloomberg, TRIM Research
-60%
-40%
-20%
0%
20%
40%
60%
80%
100%
120%
0.0%
1.0%
2.0%
3.0%
4.0%
5.0%
6.0%
7.0%
8.0%
9.0%
10.0%
Aug-0
6
Dec-
06
Apr-
07
Aug-0
7
Dec-
07
Apr-
08
Aug-0
8
Dec-
08
Apr-
09
Aug-0
9
Dec-
09
Apr-
10
Aug-1
0
Dec-
10
Apr-
11
Aug-1
1
Dec-
11
Apr-
12
Aug-1
2
Dec-
12
Apr-
13
Aug-1
3
Dec-
13
Apr-
14
Aug-1
4
Dec-
14
Apr-
15
Aug-1
5
Dec-
15
Apr-
16
Aug-1
6
GDP YoY (LHS) Indo Car Sales YoY (RHS)
-60%
-40%
-20%
0%
20%
40%
60%
80%
100%
0.0%
2.0%
4.0%
6.0%
8.0%
10.0%
Au
g-0
7
Jun
-08
Ap
r-0
9
Feb
-10
De
c-10
Oct
-11
Au
g-1
2
Jun
-13
Ap
r-1
4
Feb
-15
De
c-15
Oct
-16
GDP YoY (LHS) Indo 2W sales volume growth YoY (RHS)

PT Trimegah Securities Tbk - www.trimegah.com MARKET OUTLOOK 9
Indicator #2: Cement growth momentum remains negative
After rising in June to August, cement domestic consumption 3M Average volume YoY growth slowed down in
September and October. Although cement companies are more optimistic on next year’s volume growth i.e. INTP
expects 5% domestic cement consumption growth next year Vs. 3% YoY growth year-to-date, we choose to be
conservative and maintain negative consumption.
Indicator #3: raising construction SOEs’ new contract growth momentum from neutral to positive
SOE construction companies’ new contract book has improved, currently over 150% growth versus slightly over
100% YoY growth in May (with negative momentum). Given higher base, we expect new contract value to be flat
next year, but total order book would still grow by 31% next year. Under finance minister Ms. Sri Mulyani, the
government has been more prudent and careful in spending, but we remain optimistic that government will stay
committed when it comes to infrastructure, which is the sort of productive spending that Ms. Sri Mulyani likes.
Figure 12. Cement domestic consumption 3M Average Volume and YoY growth
Source: Bloomberg, Trimegah research
Figure 13. Construction SOEs’ cumulative YoY growth
Source: Bloomberg, TRIM Research
Note: Data includes monthly data for PTPP, ADHI, and WSKT as WIKA has not published Oct16 new contract numbers
-10.0%
-5.0%
0.0%
5.0%
10.0%
15.0%
20.0%
25.0%
-
1,000
2,000
3,000
4,000
5,000
6,000
7,000
Mar-
11
Jul-11
Nov-1
1
Mar-
12
Jul-12
Nov-1
2
Mar-
13
Jul-13
Nov-1
3
Mar-
14
Jul-14
Nov-1
4
Mar-
15
Jul-15
Nov-1
5
Mar-
16
Jul-16
'000 tons3M Avg. Volume (LHS) 3M Avg. Volume YoY Growth (RHS)
0%
50%
100%
150%
200%
250%
300%
350%
400%
450%
2M
15
3M
15
4M
15
5M
15
6M
15
7M
15
8M
15
9M
15
10M
15
11M
15
12M
15
1M
16
2M
16
3M
16
4M
16
5M
16
6M
16
7M
16
8M
16
9M
16
10M
16

PT Trimegah Securities Tbk - www.trimegah.com MARKET OUTLOOK 10
Figure 15. Indonesia GDP versus Imports YoY growth
Source: Companies data, Trimegah research
Indicator # 4: ACES and RALS’ YoY SSSG momentum is neutral
Both RALS (Ramayana Dept Store), which target low to mid-end consumers, and ACES, which target higher end
consumers, show some signs of recovery. However, we still assign a neutral momentum for retail sector as
RALS’ recent strong SSSG could be driven by higher market share as management has improved its product of-
ferings. We also want to wait for 2-3 more months of further recovery in ACES before we are more confident in
calling for a retail recovery.
Indicator # 5: Monthly imports shows positive momentum
Monthly import is another statistic that historically has high correlation with GDP. Imports YoY growth is finally
rebounding and should reach positive YoY growth soon.
Figure 14. Retail stores (ACES and RALS)’ YoY growth (3months MA)
Source: Bloomberg, Trimegah research
-30
-20
-10
0
10
20
30
40
Mar-
10
Sep-1
0
Mar-
11
Sep-1
1
Mar-
12
Sep-1
2
Mar-
13
Sep-1
3
Mar-
14
Sep-1
4
Mar-
15
Sep-1
5
Mar-
16
Sep-1
6
%ACES (Ace Hardware) RALS (Ramayana Dept. Store)
-40%
-20%
0%
20%
40%
60%
80%
3.0%
3.5%
4.0%
4.5%
5.0%
5.5%
6.0%
6.5%
7.0%
Jun-09 Feb-10 Oct-10 Jun-11 Feb-12 Oct-12 Jun-13 Feb-14 Oct-14 Jun-15 Feb-16 Oct-16
GDP YoY (LHS) Imports YoY (RHS)
PT Trimegah Securities Tbk - www.trimegah.com MARKET OUTLOOK 11
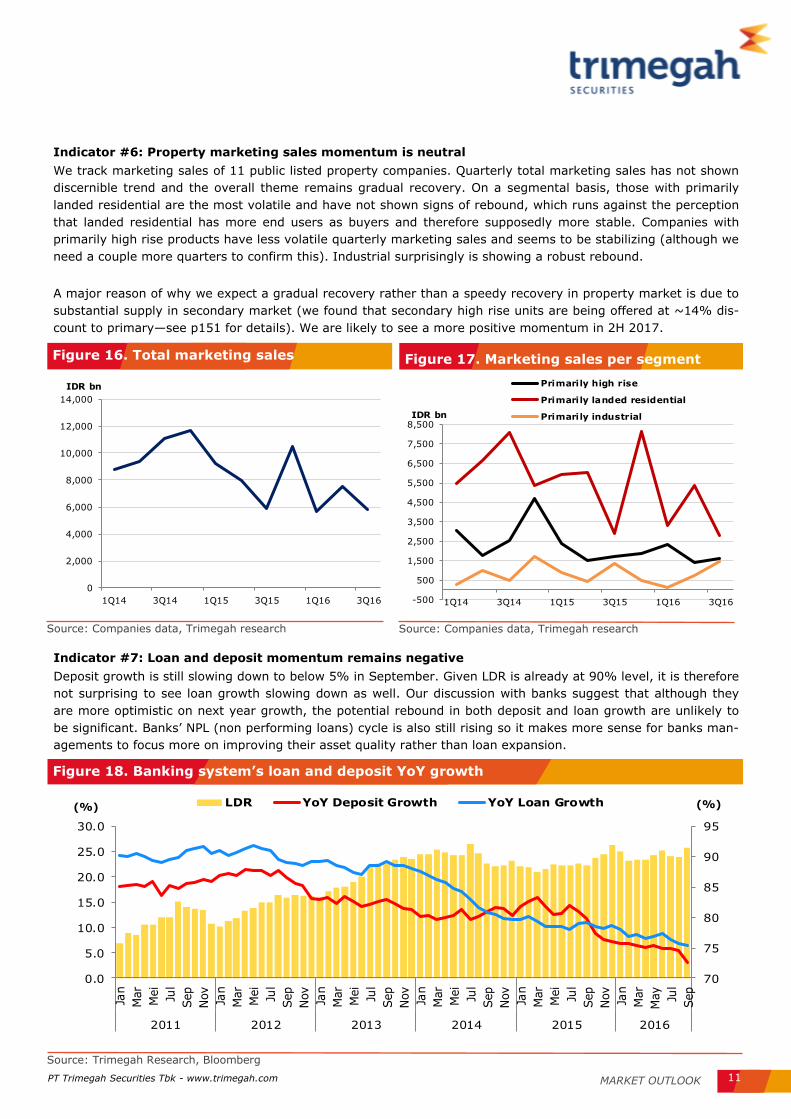
Figure 16. Total marketing sales
Indicator #6: Property marketing sales momentum is neutral
We track marketing sales of 11 public listed property companies. Quarterly total marketing sales has not shown
discernible trend and the overall theme remains gradual recovery. On a segmental basis, those with primarily
landed residential are the most volatile and have not shown signs of rebound, which runs against the perception
that landed residential has more end users as buyers and therefore supposedly more stable. Companies with
primarily high rise products have less volatile quarterly marketing sales and seems to be stabilizing (although we
need a couple more quarters to confirm this). Industrial surprisingly is showing a robust rebound.
A major reason of why we expect a gradual recovery rather than a speedy recovery in property market is due to
substantial supply in secondary market (we found that secondary high rise units are being offered at ~14% dis-
count to primary—see p151 for details). We are likely to see a more positive momentum in 2H 2017.
Source: Companies data, Trimegah research
Figure 17. Marketing sales per segment
Source: Companies data, Trimegah research
0
2,000
4,000
6,000
8,000
10,000
12,000
14,000
1Q14 3Q14 1Q15 3Q15 1Q16 3Q16
IDR bn
-500
500
1,500
2,500
3,500
4,500
5,500
6,500
7,500
8,500
1Q14 3Q14 1Q15 3Q15 1Q16 3Q16
IDR bn
Primarily high rise
Primarily landed residential
Primarily industrial
Figure 18. Banking system’s loan and deposit YoY growth
Indicator #7: Loan and deposit momentum remains negative
Deposit growth is still slowing down to below 5% in September. Given LDR is already at 90% level, it is therefore
not surprising to see loan growth slowing down as well. Our discussion with banks suggest that although they
are more optimistic on next year growth, the potential rebound in both deposit and loan growth are unlikely to
be significant. Banks’ NPL (non performing loans) cycle is also still rising so it makes more sense for banks man-
agements to focus more on improving their asset quality rather than loan expansion.
Source: Trimegah Research, Bloomberg
70
75
80
85
90
95
0.0
5.0
10.0
15.0
20.0
25.0
30.0
Jan
Mar
Mei
Jul
Sep
Nov
Jan
Mar
Mei
Jul
Sep
Nov
Jan
Mar
Mei
Jul
Sep
Nov
Jan
Mar
Mei
Jul
Sep
Nov
Jan
Mar
Mei
Jul
Sep
Nov
Jan
Mar
May
Jul
Sep
2011 2012 2013 2014 2015 2016
LDR YoY Deposit Growth YoY Loan Growth(%) (%)

PT Trimegah Securities Tbk - www.trimegah.com MARKET OUTLOOK 12
Four Investment themes for 2017
Theme 1: Companies with bottom-up catalysts
In a search for alpha, we have identified companies with secular earnings improvement that should alleviate the
volatility caused by changes in macro outlook. MAPI, DOID, and MPMX benefit from expected improvement in
operations and balance sheet while RALS benefits from expected improvement only. Of these, RALS and DOID
are turnaround stories that are already visible in recent quarterly results, while MAPI and MPMX are arguably
more forward-looking calls and should be less “crowded” trades.
Figure 19. Stocks with clear bottom-up catalysts
Source: Trimegah research, Bloomberg
Ticker Comment 2017 PE 2017 EPS
growth
2017
EV/EBITDA
2017EBITD
A growth
MAPI
We believe MAPI's expansion into Vietnam will be more suc-
cessful than market expects and it will be an important
growth driver for the company. Company has also been able
to reduce debt burden from 1.7 to 1.5 net debt to EBITDA.
18.5 123% 6.2 22%
RALS
RALS has undergone transformation in product line-up that
will still bear fruits in the coming years. We expect the com-
pany to add more celebrities related products and revamps
its kids' clothing line-up to drive sales next year.
15.3 22% 10 18%
DOID
DOID recently obtained sizable long-term contract that in-
creases its EBITDA backlog to ~USD1bn. Despite this year's
strong performance in share price, it is still trading at 3.4x
2017 EV/EBITDA, a 28% discount to closest competitor
UNTR.
4.5 99% 3.4 26%
MPMX
New management is focused on transforming the company
to increase cross-selling between divisions, reduce capex
and to be more cost efficient. We expect write-off for its
financing business to have peaked, something that is not yet
reflected in current share price.
9.7 21% 6.6 10%

PT Trimegah Securities Tbk - www.trimegah.com MARKET OUTLOOK 13
Figure 20. Net profit sensitivity for every 10% IDR depreciation in USD
Theme 2: Companies affected by USD depreciation
We perform a sensitivity analysis of all stocks under coverage, particularly impact to net profit for a 10% depre-
ciation in Rupiah against USD. As expected, most of those that are positively impacted by USD depreciations are
mining companies. PGAS’ profit is also quite sensitive to USD changes. Most of those negatively impacted are
either consumer, retail, or airline companies. Note that we already assume that consumer and retail companies
can pass on half of USD cost increase to its customers.
We include PGAS and DOID in our model portfolio. We also include ROTI more as the company has demonstrated
in the past that it was able to pass through most if not all of the cost increase. We include MAPI as we think the
company’s stock-specific expansion plan into Vietnam is very attractive and has larger impact overall.
Source: Trimegah research, Bloomberg
Figure 21. Potential upside to SOE dividends
Theme 3: More dividends from SOEs
We look at large-cap SOEs under our coverage that historically had given higher dividends. The banks (BBRI,
BBNI, and BMRI) have less room to pay higher dividend particularly if deposit growth is slower than their
planned loan growth, but BMRI management has indicated it is likely to pay slightly higher than the usual 30%.
There is significant upside in dividends from PTBA, PGAS, SMGR, and TLKM, in the order from largest to lowest
upside, based on respective companies’ FCF (Free Cash Flow = EBITDA—Capex) compared to current dividend
amount we assume in our financial models.
Source: Trimegah Research, Bloomberg
Ticker Rating
TP
(Target
Price)
Upside to
TP
Divd
yield
Current payout
ratio assump-
tion
Historical
high payout
ratio
Divd yield
assuming
historical
high
2017 FCF as
% of cur-
rent divi-
dend
PTBA Buy 16,000 39% 2.4% 35% 64% 4% 576%
SMGR Buy 11,300 30% 3.2% 40% 55% 4% 360%
PGAS Buy 3,300 26% 3.4% 40% 57% 6% 442%
BBRI Buy 11,900 14% 2.9% 30% 44% 4% NA
BBNI Buy 6,000 16% 2.7% 25% 35% 4% NA
TLKM Neutral 4,200 9% 4.0% 70% 70% 4% 234%
BMRI Neutral 10,500 3% 2.5% 40% 90% 6% NA
-28%
-22%
-20%
-18%
-16%
-13%
-11%
-8%
-7%
-6%
-5%
-4%
-2%
-2%
-2%
-1%
-1%
-1%
-1%
0%
0%
0%
0%
0%
0%
0%
0%
0%
0%
0%
0%
0%
0%
0%
0%
0%
0%
0%
0%
0%
0%
0%
0%
0%
0%
0%
0%
0%
0%
0%
0%
1% 4%
5% 1
0% 15%
16%
21%
23%33%
35%
38%
45%
-40%
-30%
-20%
-10%
0%
10%
20%
30%
40%
50%
ERA
AAIS
AIN
DF
GIA
AN
IPS
RO
TI
MAPI
EXC
LIC
BP
MD
LN
KLBF
TBIG
MN
CN
SM
GR
AC
ES
MM
LP
ISA
TIN
TP
BS
DE
SIL
OPW
ON
MPM
XSM
RA
WIK
AH
MSP
BK
SL
MIK
AAA
LI
BW
PT
LS
IPSIM
PSG
RO
PSAB
JPFA
MAIN
CPIN
JSM
RAC
ST
WS
BP
MTLA
MAR
IW
SKT
WTO
NM
PPA
DIL
DTLKM
PTPP
DM
AS
RA
LS
UN
VR
AD
HI
LPPF
GG
RM
AS
IIPTB
AAK
RA
AD
RO
PG
AS
ITM
GH
RUM
UN
TR
INCO
DO
ID
PT Trimegah Securities Tbk - www.trimegah.com MARKET OUTLOOK 14
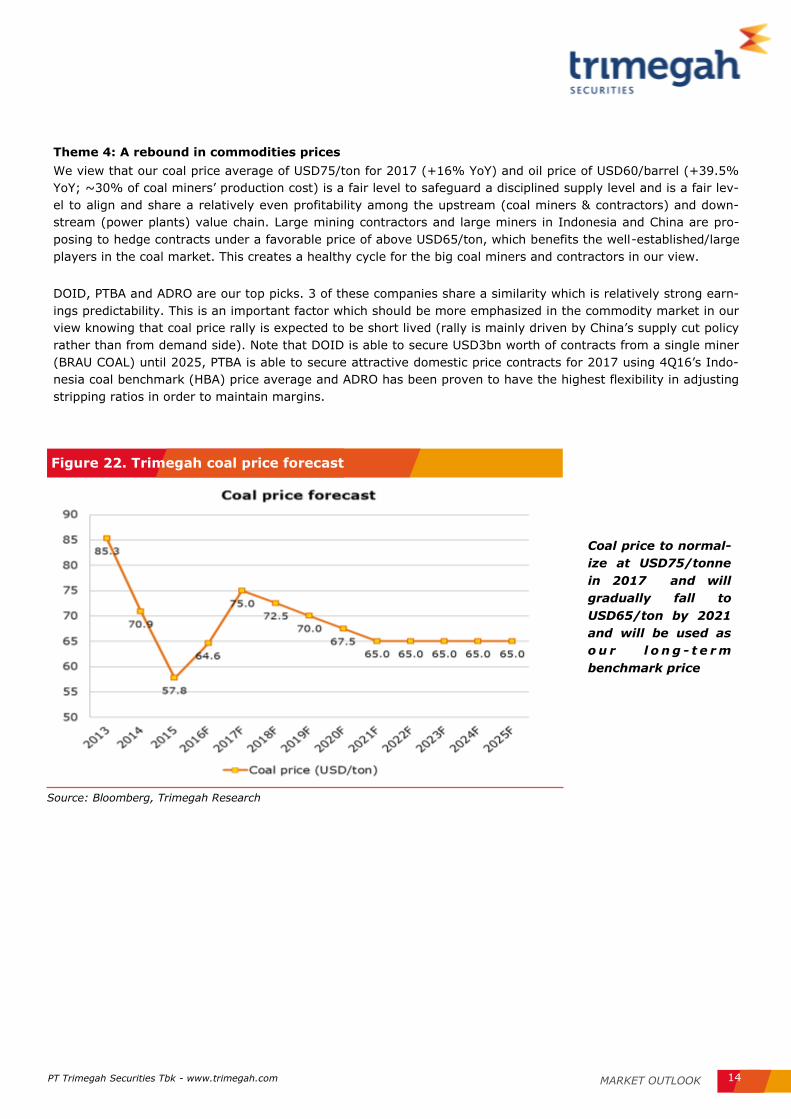
Theme 4: A rebound in commodities prices
We view that our coal price average of USD75/ton for 2017 (+16% YoY) and oil price of USD60/barrel (+39.5%
YoY; ~30% of coal miners’ production cost) is a fair level to safeguard a disciplined supply level and is a fair lev-
el to align and share a relatively even profitability among the upstream (coal miners & contractors) and down-
stream (power plants) value chain. Large mining contractors and large miners in Indonesia and China are pro-
posing to hedge contracts under a favorable price of above USD65/ton, which benefits the well-established/large
players in the coal market. This creates a healthy cycle for the big coal miners and contractors in our view.
DOID, PTBA and ADRO are our top picks. 3 of these companies share a similarity which is relatively strong earn-
ings predictability. This is an important factor which should be more emphasized in the commodity market in our
view knowing that coal price rally is expected to be short lived (rally is mainly driven by China’s supply cut policy
rather than from demand side). Note that DOID is able to secure USD3bn worth of contracts from a single miner
(BRAU COAL) until 2025, PTBA is able to secure attractive domestic price contracts for 2017 using 4Q16’s Indo-
nesia coal benchmark (HBA) price average and ADRO has been proven to have the highest flexibility in adjusting
stripping ratios in order to maintain margins.
Figure 22. Trimegah coal price forecast
Source: Bloomberg, Trimegah Research
Coal price to normal-
ize at USD75/tonne
in 2017 and will
gradually fall to
USD65/ton by 2021
and will be used as
o u r l o n g - t e r m
benchmark price

PT Trimegah Securities Tbk - www.trimegah.com MARKET OUTLOOK 15
Figure 23. Earnings growth per sector
JCI’s earnings growth to rebound in 2017
Based on our analysts’ bottom-up projections, we expect JCI to post a strong 27% earnings growth, driven by
commodities, construction, banks, and retail. Commodities is driven by expected rebound in commodities prices
and already assuming coal price to fall from current level of USD92/ton (Newcastle generic 1 month contract) to
average USD75/ton next year, which is still a 16% growth versus this year’s average coal price. Banks’ earnings
growth is driven by lower provisioning, which has caused a 2% earnings decline this year. Retail is driven by
earnings recovery in several companies i.e. MPPA, MAPI, ERAA, which have suffered this year.
Largest risk to our JCI earnings growth forecast lies with banks and commodities sectors, which are driven by
banks’ NPL and coal price, respectively. Banks’ earnings growth contributes 46% of JCI’s absolute earnings
growth and commodities sector’s earnings growth contributes 25% of JCI’s absolute earnings growth.
Source: Trimegah research, Bloomberg
-5%
5%10% 14% 16% 18%
24% 27% 27%31%
45%
68%
-10%
0%
10%
20%
30%
40%
50%
60%
70%
80%
Pro
pert
y
Cem
ent
Media
Consu
mer
sta
ple
s
Tele
com
Healthca
re
Auto
motive
JCI
Reta
il
Banks
Const
ruct
ion
Com
moditie
s
PT Trimegah Securities Tbk - www.trimegah.com MARKET OUTLOOK 16
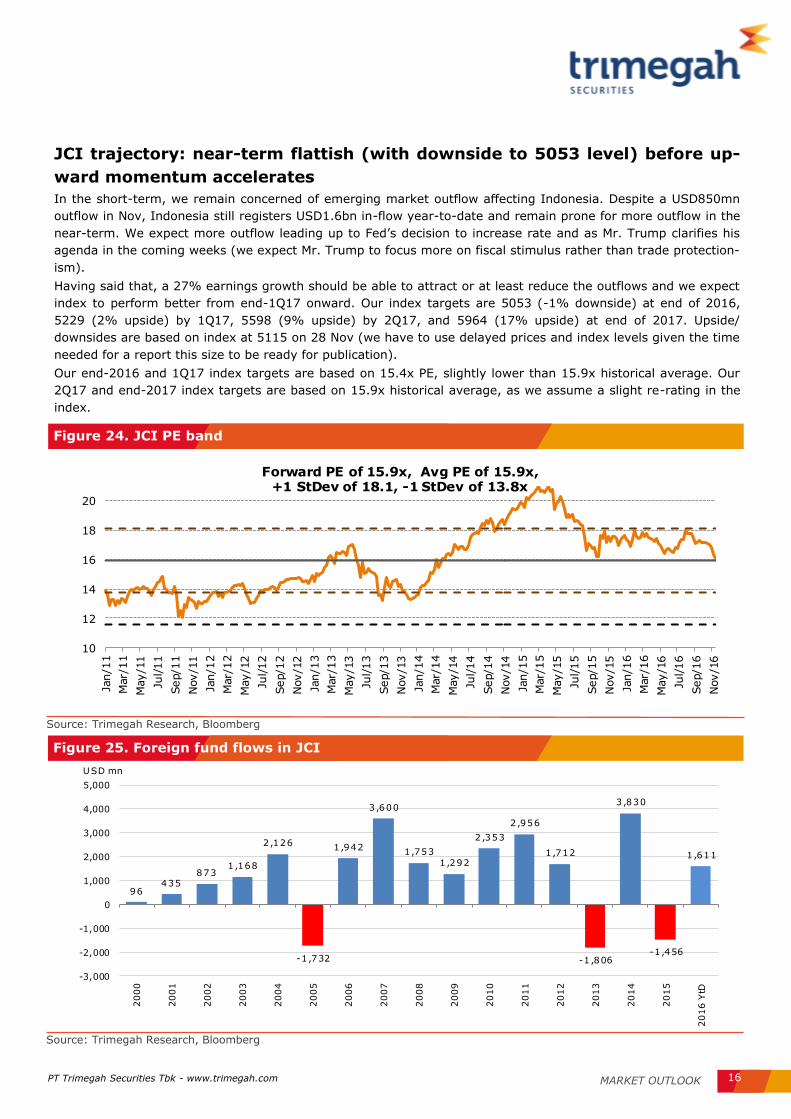
Figure 24. JCI PE band
JCI trajectory: near-term flattish (with downside to 5053 level) before up-
ward momentum accelerates
In the short-term, we remain concerned of emerging market outflow affecting Indonesia. Despite a USD850mn
outflow in Nov, Indonesia still registers USD1.6bn in-flow year-to-date and remain prone for more outflow in the
near-term. We expect more outflow leading up to Fed’s decision to increase rate and as Mr. Trump clarifies his
agenda in the coming weeks (we expect Mr. Trump to focus more on fiscal stimulus rather than trade protection-
ism).
Having said that, a 27% earnings growth should be able to attract or at least reduce the outflows and we expect
index to perform better from end-1Q17 onward. Our index targets are 5053 (-1% downside) at end of 2016,
5229 (2% upside) by 1Q17, 5598 (9% upside) by 2Q17, and 5964 (17% upside) at end of 2017. Upside/
downsides are based on index at 5115 on 28 Nov (we have to use delayed prices and index levels given the time
needed for a report this size to be ready for publication).
Our end-2016 and 1Q17 index targets are based on 15.4x PE, slightly lower than 15.9x historical average. Our
2Q17 and end-2017 index targets are based on 15.9x historical average, as we assume a slight re-rating in the
index.
Source: Trimegah Research, Bloomberg
Figure 25. Foreign fund flows in JCI
96435
8731,168
2,126
-1,732
1,942
3,600
1,753
1,292
2,353
2,956
1,712
-1,806
3,830
-1,456
1,611
-3,000
-2,000
-1,000
0
1,000
2,000
3,000
4,000
5,000
2000
2001
2002
2003
2004
2005
2006
2007
2008
2009
2010
2011
2012
2013
2014
2015
2016 Y
tD
USD mn
Source: Trimegah Research, Bloomberg
10
12
14
16
18
20
Jan/1
1
Mar/
11
May/1
1
Jul/11
Sep/1
1
Nov/1
1
Jan/1
2
Mar/
12
May/1
2
Jul/12
Sep/1
2
Nov/1
2
Jan/1
3
Mar/
13
May/1
3
Jul/13
Sep/1
3
Nov/1
3
Jan/1
4
Mar/
14
May/1
4
Jul/14
Sep/1
4
Nov/1
4
Jan/1
5
Mar/
15
May/1
5
Jul/15
Sep/1
5
Nov/1
5
Jan/1
6
Mar/
16
May/1
6
Jul/16
Sep/1
6
Nov/1
6
Forward PE of 15.9x, Avg PE of 15.9x, +1 StDev of 18.1, -1 StDev of 13.8x

PT Trimegah Securities Tbk - www.trimegah.com MARKET OUTLOOK 17
Figure 26. Trimegah’s model portfolio
Model portfolio
We think a portfolio that best captures the short-term risk of outflows or depreciating Rupiah and medium-term
bullish earnings growth outlook is a combination of: 1) Stocks that benefit or less affected by potential short-
term Rupiah depreciation or increase in yields, 2) Bottom-up picks with stock specific catalysts that should be
attractive long-term holdings despite macro turbulence, and 3) Low beta companies with relatively defensive
earnings. Hence, we populate our model portfolio with coal stocks with strong earnings growth (DOID, PTBA),
under-owned forgotten utilities with upstream oil holdings (PGAS), a cheap construction company with strong
growth and plenty of contracts secured (WSKT), a retail company with stock-specific turnaround story (MAPI),
three consumer companies with relatively lower beta and higher earnings growth compared to the sector (GGRM,
ROTI), and a healthcare company with very low beta and defensive earnings (MIKA).
We intentionally try to keep our portfolio beta lower than 1.0 and exclude cyclicals (although we prefer ASII to
banks among cyclicals) as we remain concerned over possibility of a rise in yield in the near-term. Currently Indo
govt yield is very flat with risk of long-end rising.
One notable exclusion from our model portfolio is TLKM, which despite market’s perception as a defensive stock,
we think would behave more as a beta stock now due to its valuation (8x 2017 EV/EBITDA, near historical high)
and risk of heightening competition among telecoms next year.
Source: Trimegah Research, Bloomberg
Top
picks
Price (Rp)
Mkt. Cap
TP Rec
EPS growth
P/E (x) EV/
EBITDA (x)
P/BV (x)
Divd yield
Beta
Upside
28-Nov (Rptrn) 2017 2017 2017 2017 2017 2yr
weekly
DOID 515 4.3 800 55% Buy 99% 4.4 3.4 1.6 0% 1.3
PTBA 11,550 26.6 16,000 39% Buy 125% 6.5 4.3 1.9 2% 1.6
PGAS 2,620 63.5 3,300 26% Buy 12% 9.1 6.0 1.3 3% 1.2
WSKT 2,270 30.8 2,910 28% Buy 81% 14.5 9.5 2.5 1% 0.6
MAPI 4,870 8.1 7,200 48% Buy 109% 16.0 6.2 2.2 0% 0.9
MIKA 2,580 37.2 3,000 16% Buy 11% 47.9 36.1 9.7 1% 0.4
GGRM 62,775 120.8 82,000 31% Buy 19% 15.3 10.0 2.8 4% 0.8
ROTI 1,455 7.4 1,900 31% Buy 22% 22.5 10.1 4.4 1% 0.9
Simple average 34% 60% 17.0 10.7 3.3 2% 0.96

PT Trimegah Securities Tbk - www.trimegah.com MARKET OUTLOOK 18
Figure 27. Sector weighting and valuations
Sectoral outlook on 2017
Bullish on coal
We have overweight on coal, supported by healthier coal price level of USD75/72.5/70 per tonne in 2017/18/19
as well as a new healthy and sustainable up-cycle era of the sector. This up-cycle era can be seen from stronger
2017-18 earnings growth, due to coal price recovery and better cost structure–due to low fuel cost, as fuel
makes up ~30% of mining cost. Additionally, we also see healthier supply side, as major companies are
providing conservative production plans. Our top picks are PTBA (Buy, TP IDR16,000), ADRO (Buy, TP
IDR2,000), DOID (Buy, TP IDR800).
Bullish on consumers (staples, retail, healthcare)
We also have overweight on consumers, with more inclination towards discretionary vs. staples, on the back of
higher confidence on consumer purchasing power next year. We believe higher consumer purchasing power is
supported by improvement on overall economic conditions (benign inflation, higher GDP growth, post tax
amnesty and rising commodity prices). Moreover, our belief is further reinforced by our proprietary survey,
which shows more aggressive spending outlook post tax amnesty. However, we are also aware of downside risk
in electricity subsidy removal and exchange rate volatility that might disrupt overall consumer spending. Hence,
we advise investors to look more through bottom-up approach rather than top-down, as reflected in our
preference for companies with higher sales growth, margin expansion, and undemanding valuation. Our top
picks thus include: MAPI (Buy, TP IDR7,200), RALS (Buy, TP IDR1,900), GGRM (Buy, TP IDR82,000).
We are less bullish on interest-rate sensitive sectors except automotive
We have neutral on banks on risk of higher interest rate risk and as NPL risk remains (likely to peak in 1H). We
are also neutral on property as we see only a gradual recovery in price momentum as there is still plenty of sup-
ply in the secondary market. The only exception is automotive, where we see lower risk to our earnings growth
relative to other interest-rate sensitive sectors. It also helps that the largest automotive company, ASII, is a
conglomerate with ~30% of its earnings contributed by commodities businesses.
Source: Trimegah Research, Bloomberg
Sector Weighting 2017 PE 2017 earnings
growth 2017 PBV
Banks Neutral 10.0 31% 1.5
Automotive Overweight 15.3 24% 2.5
Commodities Overweight 9.5 68% 1.5
Property Neutral 18.3 -5% 1.6
Construction Neutral 16.1 45% 2.0
Telecom Neutral 19.5 16% 3.8
Media Neutral 14.2 10% 2.3
Consumer staples Overweight 26.1 14% 7.1
Retail Overweight 17.4 27% 4.1
Healthcare Overweight 31.2 18% 5.7
Cement Neutral 13.9 5% 1.8
JCI 14.8 27% 2.5

PT Trimegah Securities Tbk - www.trimegah.com MARKET OUTLOOK 19
Neutral on construction
We have neutral on construction as macro outlook for 2017 seems to have mixed impact on infrastructure SOE.
We foresee budget cut for ministries that might adversely affect SOE contractors. However, looking at
government priority projects, we expect higher portion of oil refinery projects, which should benefit several
companies as these projects give higher gross margin. However, with current valuation, we view the stocks to be
cheap for the time being, as they are currently trading below their 3-years average PE, largely due to massive
foreign selloff caused by uncertainty on emerging market post-US election. We therefore screen our stocks over
their PE ratio, EV to new contract, and potential earnings growth, with WSKT (Buy, TP IDR2,910) and WIKA
(Buy, TP IDR2930) as our top picks.
Neutral on telecommunications and media
We have neutral on telecommunications, as we expect more competitive environment, resulting in prolonged
price war, though not to the extent of 2008-12 price war. Moreover, we also expect slower growth from cellular
business’ EBITDA, mainly due to lower margin. Tower industry outlook is also quite bleak, as we expect lower
demand due to possibility of network sharing regulation change. Likewise, we also have neutral on media as
despite expected higher revenue growth from consumer companies’ expected higher spending, we still assume
rather slow earnings growth. Our top pick for the sector is MARI (Buy, TP IDR1,100).
Neutral on cement
We have neutral on cement, as we expect lingering oversupply condition, potential demand growth slowdown,
prolonged decline in ASP, as well as increase in cost from rising coal price (coal composes ~16-20% of SMGR
and INTP’s COGS). However, the cement companies have put in place cost-efficiency measures, which have
enabled them to protect their market share as well as their margins. Furthermore, we expect slower rate of
decline of ASP in 2017, compared to 2016. Our top pick remains with SMGR (Buy, TP IDR11,300), as we believe
the company will outperform in terms of demand growth, due to it holding the largest market share in areas with
positive demand growth (outside Java).

PT Trimegah Securities Tbk - www.trimegah.com MARKET OUTLOOK 20
Bank Sector

MARKET OUTLOOK PT Trimegah Securities Tbk - www.trimegah.com 21
High risk-free rate environment. Downgrade the sector tactically into Neutral (prev: Overweight) The recent developments in the share price of JCI stocks made us realign-ing the strategy toward Indonesian banks stocks. We now assume higher
risk-free rate of 8% as in-line with the current 10-yr Indonesian govt bond yield (~8.3%). As a result, the target prices of banks under our coverage are cut, leaving 4 Buys, 3 Neutrals, and 5 Sells. We therefore downgraded the sector rating tactically into Neutral (prev: Overweight). But, there is an upside risk from higher coal price... Since our coal analyst expects USD75/ton coal price in 2017F, it is fair to
expect improvement in coal debtors’ repayment capability. Anecdotal evidence suggest increasing interest coverage ratios of several publicly listed coal firms, which is an early signs of the improvement in the system-wide NPL ratio, in our view. Our checks with BBNI and BNLI revealed some of their coal-related debtors that went NPL have started to repay the interests and instalments again. We therefore expect NPL ratio in all
banks to start gradually declining in 2017F onwards. ...and also rising consumer confidence The declining interest rate environment combined with low inflation and rising consumer confidence index should bode well with consumer loan growth. Historical data suggests positive correlation between consumer loan growth and consumer confidence index. The rising consumer confi-
dence is evidenced by our consumer team survey, revealing more buying appetite in the next 12 months, especially in property products. This, in our view, should lead to higher consumer loan growth. Our top picks now: BBNI, BBTN, and BNLI
We favor BBNI since it is now valued cheap and its asset quality is not as worse as we think. Besides, it is relatively under-owned now since nega-
tive sentiments surrounded the company post the announcement of it providing loans to VIVA (a Bakrie company). We view VIVA to be credit-worthy instead, since it showed an improvement in interest coverage ratio this year. BBTN is also favored for its high earnings visibility from govt public housing program. We think the potential impact from govt funding scheme change into 60:40 (vs. current 90:10) would be muted as BBTN
still have a room for 50bps TD rate cut. Lastly, we recommend to own BNLI as it is expected to benefit greatly from higher coal price.
Banks Tactical Downgrade to Neutral
Companies Data
TICKER
Price
(IDR) Mkt. Cap
TP Ups.
Rec. EPS Growth(%) ROE(%) P/BV (X)
28-Nov (IDR bn) (%) 2016 2017 2016 2017 2016 2017
BBRI 10,475 255,825 11,900 13.6 Buy (2.5) 7.3 18.6 17.5 1.9 1.7
BBNI 5,075 93,696 6,000 18.2 Buy 11.2 38.5 11.8 16.5 1.1 1.1
BBTN 1,600 16,775 1,850 15.6 Buy 29.5 19.2 12.6 13.4 0.9 0.8
BNLI 530 11,722 600 13.2 Buy NM NM (4.3) 7.1 0.5 0.5
BBCA 14,375 350,872 15,000 4.3 Neutral 5.8 15.1 18.3 18.0 3.4 2.9
BMRI 10,150 234,465 10,500 3.4 Neutral (28.1) 74.3 9.6 17.4 1.5 1.6
BNGA 785 19,531 800 1.9 Neutral 250.6 128.3 4.9 10.0 0.6 0.6
BDMN 3,290 31,218 2,000 (39.2) Sell 37.3 10.9 9.0 9.3 0.9 0.8
PNBN 720 17,163 700 (2.8) Sell 54.9 14.6 7.0 7.5 0.6 0.5
BJBR 1,515 14,543 1,100 (27.4) Sell 12.6 (14.9) 18.1 14.6 1.7 1.6
BTPN 2,740 15,842 2,600 (5.1) Sell 3.8 8.1 11.7 11.2 1.0 0.9
BJTM 505 7,472 420 (16.8) Sell 12.7 7.0 15.0 15.1 1.1 1.1
Angga Aditya Assaf
Neutral

PT Trimegah Securities Tbk - www.trimegah.com MARKET OUTLOOK 22
Source: Bloomberg. Companies. Trimegah Research
WHERE CAN WE SEEK UPSIDE RISKS? 1. Rising coal price to above USD75/tonne = potential mining NPL decline Figure 1 below depicts the clear inverse relationship between coal price and banking system’s NPL ratio. We can
infer from the graph that mining NPL should decline given the above USD100/tonne coal price. Figure 3 below illustrates anecdotal evidence showing 6 of 11 coal-related firms are showing improvement in repayment capabil-ity. Moreover, our channel checks to BBNI and BNLI also revealed that some mining debtors have shown im-provement in repayment capability. And according to our coal analyst, when the coal price is at USD60/tonne, 90% of publicly listed exporter coal miners report positive EBITDA. That said, if coal price drops but still above
USD60/tonne, we can expect insignificant decline in coal firms’ solvability. Our coal analyst expect USD75/tonne coal price in 2017F. Figure 2 below shows that BBRI owns the highest mining credit risk, followed by BNLI,
BDMN. and BBNI.
Figure 28. System’s mining NPL ratio
vs. coal price
Figure 29. Mining NPL to total NPL of
banks under our coverage (%. 9M16)
Source: Bloomberg. Trimegah Research
Figure 30. Publicly listed coal firms show an improvement in repayment capability..
Coal firms 9M15 Interest
Coverage (X)
9M16 Interest
Coverage (X) Remarks
ADRO 7.42 10.03 Improved
PTBA 14.20 11.90 Worsen
HRUM 4.17 15.55 Improved
TOBA 11.13 6.00 Worsen
UNTR 120.27 139.55 Improved
BYAN 0.11 0.51 Improved
INDY -0.54 -0.75 Worsen
KKGI 50.14 64.81 Improved
DEWA 5.00 1.29 Worsen
DOID 1.86 2.17 Improved
ITMG 180.69 137.43 Worsen
40.0
60.0
80.0
100.0
120.0
140.0
160.0
0.0
1.0
2.0
3.0
4.0
5.0
6.0
7.0
8.0
Dec-
08
Jun-0
9
Dec-
09
Jun-1
0
Dec-
10
Jun-1
1
Dec-
11
Jun-1
2
Dec-
12
Jun-1
3
Dec-
13
Jun-1
4
Dec-
14
Jun-1
5
Dec-
15
Jun-1
6
System's Mining NPL ratio (%)
Coal price (USD/MT, RHS)
20.0
13.8
11.310.3
3.62.6
1.20.6 0.3
0.0
5.0
10.0
15.0
20.0
25.0
BBRI BNLI BDMN BBNI BMRI BJTM BBCA BNGA BJBR

PT Trimegah Securities Tbk - www.trimegah.com MARKET OUTLOOK 23
Source: BI. OJK. Trimegah Research
WHERE CAN WE SEEK UPSIDE RISKS? … (CONT’D) 2. Rising CCI provides growth opportunity for consumer loans As illustrated in the Figure 4 and 5 below, we are seeing potential reversal in consumer loans growth from: 1)
rising consumer confidence index (CCI), and 2) declining interest rates: in general, consumer loans correlate negatively with benchmark interest rate during the past 3 years. Subsequently. Figure 6 complements the argu-ment that there will be potential uptick in vehicle loan growth given the recent uptick in 4W and 2W sales growth. Note that based on the graph presented, automotive sales growth tend to move ahead of vehicle loan growth.
102
104
106
108
110
112
114
116
118
Dec-1
5
Jan-1
6
Feb-1
6
Mar-
16
Apr-
16
May-1
6
Jun-1
6
Jul-
16
Aug-1
6
Sep-1
6
Oct-
16
Figure 31. Consumer Confidence Index
(CCI)
Figure 32. BI Rate vs. consumer loans
growth trend (%)
Source: Gaikindo. Trimegah Research
Figure 33. Auto sales growth trend vs. vehicle loan YoY growth
-15.0
-10.0
-5.0
0.0
5.0
10.0
15.0
20.0
25.0
30.0
35.0
5.5
6.0
6.5
7.0
7.5
8.0
Aug-12 Aug-13 Aug-14 Aug-15
BI Rate (LHS) Mortgage
Vehicles Multipurpose + others
-15.0
-10.0
-5.0
0.0
5.0
10.0
15.0
20.0
25.0
-30.0
-20.0
-10.0
0.0
10.0
20.0
30.0
Aug-1
2
Oct-
12
Dec-
12
Feb-1
3
Apr-
13
Jun-1
3
Aug-1
3
Oct-
13
Dec-
13
Feb-1
4
Apr-
14
Jun-1
4
Aug-1
4
Oct-
14
Dec-
14
Feb-1
5
Apr-
15
Jun-1
5
Aug-1
5
Oct-
15
Dec-
15
Feb-1
6
Apr-
16
Jun-1
6
4W sales YoY growth 2W sales YoY growth Vehicle loan growth (YoY, RHS))
PT Trimegah Securities Tbk - www.trimegah.com MARKET OUTLOOK 24
STOCKS TO PICK… BBNI (Buy, TP IDR5,900) Reason: share price had been under punishment in the recent months due to asset quality concerns and negative
market perception about loan to VIVA, a Bakrie company. However. our recent meeting with the management revealed that the majority of small and medium debtors are having collateral with >3x interest coverage, which should restore investors confidence. We therefore concur that BBNI may report good earnings momentum in the coming quarters, with valuation remains the cheapest among big cap banks. poising to outperform BMRI and
BBCA in the near-term. In addition, VIVA is fundamentally sound now as shown by 1.2x interest coverage ratio (vs. 0.9x in 9M15). Therefore, the weak share price is more sentiment-related than fundamental.
BBTN (Buy, TP IDR1,850) Reason: the company is expected to report ~20% EPS growth in 2017-18F on the back of the continuous govt public housing program. We have already accounted the potential funding change scheme into 60:40 but we believe the management would encounter the impact by cutting TD rate by 50bps. therefore less NIM concerns. Currently, BBTN trades at 0.8x 2017F PBV. undemanding enough for the stock that offers 13-14% ROE in the next couple of years (vs. 11.9% in 9M16).
BNLI (Buy, TP IDR600) Reason: We admit that this a quite exotic stock to pick. BNLI is relatively under-owned due to its asset quality
problems. However, we see BNLI’s earnings to start turning around in 2017F from gradual NPL improvement. Based on its latest disclosure, BNLI owns the highest mining credit risk among small banks. Therefore, the im-provement in coal price should have a positive impact toward earnings and share price. Our recent talk with the company suggests that some of its mining debtors have shown an improved repayment capability. Thus, we may
see more loan upgrades next year. We also tactically upgrade BBRI to Buy (TP: IDR11,900) as share price have weaken in the past few days, opening 13% potential upside to our TP. However, downside risks remain on govt to lower KUR lending rate to 7% while at the same time, there is a possibility of kitchen-sinking event as current CEO will depart in 1Q17—the same event occurred in BBNI and BMRI post CEO changes.
Risks to our call
1). Sharp increase in Fed Fund Rate (FFR). 2) tightening in liquidity. 3) coal price drop to below USD60/tonne level. and 4) any adverse macroeconomic changes.

MARKET OUTLOOK PT Trimegah Securities Tbk - www.trimegah.com 25
Investment Thesis:
Beneficiary of rising coal price
About 10% of BBNI’s NPL book comes from mining sector. The ex-pectation of coal price at USD75/tonne should then be very positive
for BBNI. In addition, the recent uptick in mortgage NPLs is ex-pected to reverse in the near-term since it was caused by commodi-
ty price downturn.
Asset quality may not be as risky as we think
The company’s latest quarterly disclosure reveals that the 96.9% of
medium debtors provide 100% collateral. Around 66% of medium debtors also have >3x interest coverage, therefore reducing credit risk concerns. In regards of corporate loans, BBNI provide loans selectively (i.e. to SOEs and private corporations with good financial performance). Moreover, negative sentiment about loan to VIVA is expectedly having muted impact toward BBNI credit risk as VIVA’s financial is now improved (EBITDA coverage 1.2x as of 9M16 vs.
0.9x as of 9M15, and ANTV has the highest viewership rating among local TV stations. according to Nielsen). This points out that the new management applies better lending practice.
Achieving 16-18% ROE (unadjusted for asset revaluation) in
2017-18F is very possible, with current valuation remains
attractive at ~1x 2017F PBV
Such ROE level would be achieved by: 1) higher net interest income from lower restructuring and declining cost of funds—our NIM fore-cast is now raised to 6% (prev: 5.8% as per company guidance) in
2017-18F—, and 2) normalizing credit cost at ~1% level due to waning credit risks from rising coal price and safer lending practice. Besides, valuation remains attractive at near 1x book value, ex-
pected to re-rate in the near-term along with better earnings-momentum.
Valuation: 2017F TP IDR6,000 (prev: IDR6,200)
The TP is derived by using Gordon Growth Model under the assumptions of 17.5% sustainable ROE (unadjusted for asset revaluation) (prev: 15.7%), 10% long-term growth rate, 15.8% cost of equity (prev: 14.8%), and 8% risk–free rate (prev: 6.8%). It implies 1.3x 2017F PBV.
Key investment risks:
Worsening macroeconomic situation. which could impair asset quali-
ty further.
Corporate actions that might have impact to the share price.
Regulatory risks. e.g.. single digit lending rate, capital charge on
domestic systemically important banks (DSIB).
Bank Negara Indonesia is the third
biggest state owned bank by asset size.
The Bank primarily lend to SMEs.
corporates and consumers.
Share Price Rp5,075
Sector Bank
Price Target Rp6,000 (18%)
Year end Dec 2014 2015 2016F 2017F 2018F
Net Profit (IDRbn) 10,783 9,067 10,085 13,968 17,722
EPS (IDR) 578 487 546 757 960
EPS Growth (%) 18.9 -15.7 12.2 38.5 26.9
DPS (IDR) 146 145 123 137 189
BVPS (IDR) 3,166 4,105 4,613 4,573 5,344
P/E (x) 10.6 10.2 9.3 6.7 5.3
P/BV (x) 1.9 1.2 1.1 1.1 0.9
ROE (%) 18.3 11.9 11.8 16.5 18.0
Div Yield (%) 2.9 2.9 2.4 2.7 3.7
Bank Negara Indonesia Outperform Candidate
BUY Rp6,000
Reuters Code BBNI.JK
Bloomberg Code BBNI.IJ
Issued Shares (m) 18,462
Mkt Cap (IDR bn) 93,696
Average Daily T/O 3-
months (IDR bn)
137.6
52-Wk range (IDR) 5,975 / 4,270
Indonesian Government 60%
Public 40%
EPS 16F 17F
Consensus (IDR) 569 679
TRIM vs Cons. (%) -4.8 11.1
Company Update
Stock Data
Major Shareholders
Consensus
Stock Price
Company Data
0.0
50.0
100.0
150.0
200.0
250.0
300.0
350.0
400.0
-
1,000
2,000
3,000
4,000
5,000
6,000
7,000
Nov-15 Mar-16 Jul-16
(Rpbn)Avg. 5 Day MA Trading Value (RHS) Price (LHS)

PT Trimegah Securities Tbk - www.trimegah.com MARKET OUTLOOK 26
Income Statement (IDRbn)
Year end Dec 2014 2015 2016F 2017F 2018F
Interest Income 33,750 36,895 42,043 47,072 54,597
Interest
Expense -10,989 -11,335 -12,631 -14,137 -16,247
NII 22,761 25,560 29,413 32,935 38,350
Non Interest
Income 8,987 9,698 9,858 10,561 12,100
Operating
Expense -14,760 -16,510 -18,334 -20,362 -22,545
PPOP 16,988 18,748 20,938 23,134 27,905
Loan Loss
Provision -3,642 -7,336 -8,194 -5,519 -5,581
Operating Profit 13,346 11,412 12,744 17,615 22,324
Profit
Before Tax 13,524 11,466 12,744 17,615 22,324
Tax Expense -2,695 -2,326 -2,585 -3,573 -4,528
Net Profit 10,783 9,067 10,085 13,968 17,722
EPS (IDR) 578 487 546 757 960
EPS Growth
(%) 18.9 -15.7 12.2 38.5 26.9
Dividend
Per Share (IDR) 146 145 123 137 189
Dividend
Growth (%) 28.3 -0.6 -15.2 11.2 38.5
Balance Sheet (IDRbn)
Year end Dec 2014 2015 2016F 2017F 2018F
Cash and
CA with BI 36,033 43,823 45,523 53,030 61,728
Interbank
Placement 19,023 42,416 68,440 66,329 80,534
Marketable
Securities 12,738 9,927 13,210 15,337 17,839
Government
Bonds 43,830 47,222 45,841 48,470 50,824
Loans-net 270,652 314,067 369,399 438,820 513,355
Net Fixed Assets 6,222 20,757 23,619 24,774 27,232
Other Assets 28,075 30,384 24,453 22,810 26,535
Total Assets 416,574 508,595 590,487 669,570 778,046
Total Earning
Assets 367,451 434,137 511,682 580,561 676,052
Deposit 314,669 371,366 436,907 507,590 590,363
Borrowings 11,212 22,524 23,619 26,783 31,122
Other Liabilities 15,268 18,838 22,600 25,858 30,233
Total Liabilities 341,149 412,728 483,126 560,231 651,717
Total
Shareholder's Equity
(unadjusted for asset
revaluation)
59,072 76,415 85,169 84,426 98,656
BVPS (IDR/Share,
unadjusted for asset
revaluation)
3,166 4,105 4,613 4,573 5,344
Key Ratio Analysis
Year end Dec 2014 2015 2016F 2017F 2018F
Earning Asset Yield (%) 9.5 9.2 8.9 8.6 8.7
Cost of Funds (%) 3.3 3.0 2.9 2.7 2.7
NIM (%) 6.4 6.4 6.2 6.0 6.1
ROE (%) 18.3 11.9 11.8 16.5 18.0
ROA (%) 2.7 2.0 1.8 2.2 2.4
Cost to Income Ratio (%) 46.5 46.8 46.7 46.8 44.7
Loan Growth (%) 10.8 17.5 18.6 18.8 16.9
Deposit Growth (%) 4.5 18.0 17.6 16.2 16.3
LDR (%) 88.2 87.8 88.5 90.5 91.0
LFR (%) 86.5 86.2 86.9 88.8 89.2
RRR (%) 8.2 8.7 7.0 7.0 7.0
CAR (%) 16.2 19.5 20.4 17.9 17.5
Asset/Equity (x) 7.1 6.7 6.9 7.9 7.9
Gross NPL (%) 2.0 2.7 3.3 3.2 3.1
Loan Loss Coverage (%) 128.2 138.2 137.4 140.4 141.0
Cost of Credit (%) 1.3 2.2 2.1 1.2 1.0
Interim Result (IDRbn)
3Q15 4Q15 1Q16 2Q16 3Q16
Total Loans (Gross) 307,122 326,105 326,744 350,327 379,337
Total Deposit 333,106 353,937 371,556 391,490 401,877
Total Asset 456,463 508,595 509,089 539,140 571,509
Net Interest Income 6,445 6,856 6,908 7,003 7,963
Net revenue 8,173 9,319 9,436 9,578 10,842
Operating profit 3,665 3,833 3,754 1,749 4,223
Net Profit 3,568 3,069 2,973 1,399 3,346
Capital History
Date
25-Nov-96 IPO @ Rp850
23-Dec-03 Reverse Stock
28-Dec-10 Additional shares HMETD

MARKET OUTLOOK PT Trimegah Securities Tbk - www.trimegah.com 27
Investment thesis:
Lowering 2016F EPS by 16% on rising NPL outlook in 4Q16.
Recently, CEO mentioned in the news that BMRI will raise FY16
provisioning estimates to IDR22trn (vs. our previous estimates of
IDR18.3trn). We also raised our 2016F NPL assumption to 4.2%
(prev: 3.9%) and write-off to IDR11trn (prev: IDR8.8trn) according-
ly as per company confirmation. As a result, our 2016F EPS esti-
mates is lowered by 16% and our 2017F TP is cut to IDR10,500.
Valuation: 2017F TP IDR10,500 (prev: IDR12,000)
The TP is derived by using Gordon Growth Model under the assumptions
of 17.7% sustainable ROE (unadjusted for asset revaluation) (prev:
15.3%), 10% long-term growth rate, 14.6% cost of equity (prev:
13.3%), and 8% risk–free rate (prev: 8%). Leaving only 3% potential
upside to our TP, we therefore downgrade BMRI’s rating into Neutral
(prev: Buy).
Key investment risks:
Worsening macroeconomic situation, which could impair asset quali-
ty further.
Corporate actions that might have impact to the share price. distrib-
uting special dividends, etc.
Regulatory risks. e.g., single digit lending rate, capital charge on
domestic systemically important banks (DSIB).
Bank Mandiri is Indonesia’s biggest
bank by assets. The state owned
bank is focused on wholesale and re-
tail lending and funding
Share Price Rp10,150
Sector Bank
Price Target Rp10,500 (3%)
Year end Dec 2014 2015 2016F 2017F 2018F
Net Profit (IDRbn) 19,872 20,335 14,625 25,485 30,638
EPS (IDR) 852 872 633 1,103 1,326
EPS Growth (%) 9.2 2.3 -27.4 74.3 20.2
DPS (IDR) 234 213 264 253 276
BVPS (IDR) 4,400 5,017 6,609 6,336 7,387
P/E (x) 12.7 10.6 16.0 9.2 7.7
P/BV (x) 2.4 1.8 1.5 1.6 1.4
ROE (%) 19.4 17.4 9.6 17.4 18.0
Div Yield (%) 2.3 2.1 2.6 2.5 2.7
Bank Mandiri Poor Earnings Momentum in the Near-term
NEUTRAL Rp10,500
Reuters Code BMRI.JK
Bloomberg Code BMRI.IJ
Issued Shares (m) 23,100
Mkt Cap (IDRbn) 234,465
Avg. Value Daily
3-month (IDRbn)
243.6
52-Wk range (IDR) 11,950 / 8,175
Indonesian Government 60%
Public 40%
EPS 16F 17F
Consensus (Rp) 739 927
TRIM vs Cons. (%) 1.0 16.1
Company Update
Stock Data
Major Shareholders
Consensus
Stock Price
Company Data
0.0
100.0
200.0
300.0
400.0
500.0
600.0
-
2,000
4,000
6,000
8,000
10,000
12,000
14,000
Nov-15 Mar-16 Jul-16
(Rpbn)Avg. 5 Day MA Trading Value (RHS) Price (LHS)

PT Trimegah Securities Tbk - www.trimegah.com MARKET OUTLOOK 28
Old New Changes (%)
2016F 2017F 2018F 2016F 2017F 2018F 2016F 2017F 2018F
Gross loans(%) 10.3 10.9 11.3 10.3 10.9 11.3 0.0 0.0 0.0
Deposits growth (%) 4.8 12.1 10.0 4.8 12.1 10.0 0.0 0.0 0.0
in IDR bn
Gross Loans 647,299 718,098 799,042 647,299 718,098 799,042 0.0 0.0 0.0
Deposits 676,387 709,287 791,513 676,387 709,287 791,513 0.0 0.0 0.0
Total Assets 910,063 998,877 1,104,640 910,063 996,070 1,077,115 0.0 -0.3 -2.5
in IDR bn
Net interest income 52,530 56,292 64,647 52,531 56,303 64,666 0.0 0.0 0.0
Non-interest income 20,460 23,691 25,986 20,892 24,284 26,455 2.1 2.5 1.8
Provisioning 18,332 10,842 8,913 22,371 10,958 9,561 22.0 1.1 7.3
Non-interest expenses 31,975 36,507 41,705 31,975 36,507 41,705 0.0 0.0 0.0
Net income 17,402 25,109 30,761 14,625 25,485 30,638 -16.0 1.5 -0.4
NIM (%) 6.5 6.3 6.5 6.5 6.4 6.7 0.0 0.1 0.2
ROE (%) 11.2 14.5 15.5 9.6 17.4 18.0 -1.6 2.9 2.4
LDR (%) 91.3 90.7 92.0 91.3 90.7 92.0 0.0 0.0 0.0
Gross NPL (%) 3.9 3.8 3.7 4.2 4.1 3.9 0.4 0.3 0.2
Credit Costs (%) 2.8 1.5 1.1 3.4 1.5 1.2 0.6 0.0 0.1
EPS (IDR) 746 1,076 1,318 633 1,103 1,326 -15.1 2.5 0.6
DPS (IDR) 261 298 269 264 253 276 1.0 -15.1 2.5
BVPS (IDR) 6,662 7,440 8,489 6,609 6,336 7,387 -0.8 -14.8 -13.0
Figure 34. Estimates revision
Source: Trimegah Research

PT Trimegah Securities Tbk - www.trimegah.com MARKET OUTLOOK 29
Income Statement (IDRbn)
Year end Dec 2014 2015 2016F 2017F 2018F
Interest Income 62,638 71,570 78,347 83,520 94,659
Interest
Expense -23,506 -26,207 -25,816 -27,217 -29,992
NII 39,132 45,363 52,531 56,303 64,666
Non Interest
Income 17,749 21,773 20,892 24,284 26,455
Operating
Expense -25,374 -28,755 -31,975 -36,507 -41,705
PPOP 31,507 38,382 41,448 44,080 49,416
Loan Loss
Provision -5,529 -12,043 -22,371 -10,958 -9,561
Operating Profit 25,978 26,339 19,078 33,123 39,855
Profit
Before Tax 26,008 26,369 18,992 33,095 39,786
Tax Expense -5,353 -5,217 -3,757 -6,548 -7,871
Net Profit 19,872 20,335 14,625 25,485 30,638
EPS (IDR) 852 872 633 1,103 1,326
EPS Growth
(%) 9.2 2.3 -27.4 74.3 20.2
Dividend
Per Share 234 213 264 253 276
Dividend
Growth (%) 17.4 -9.0 24.0 -4.1 8.9
Balance Sheet (IDRbn)
Year end Dec 2014 2015 2016F 2017F 2018F
Cash and
CA with BI 71,303 81,423 72,195 79,995 88,133
Interbank
Placement 70,101 47,473 82,956 83,030 102,638
Marketable
Securities 40,465 43,642 48,806 50,399 55,369
Government
Bonds 86,154 103,869 81,559 87,744 88,475
Loans-net 505,395 564,394 612,345 680,039 758,291
Net Fixed Assets 8,929 9,762 36,762 37,497 37,872
Other Assets 72,692 59,501 61,447 58,412 58,803
Total Assets 855,040 910,063 996,070 1,077,115 1,189,581
Total Earning
Assets 728,519 768,560 836,654 913,207 1,017,832
Deposit 636,382 676,387 709,287 791,513 868,988
Borrowings 24,227 33,765 35,762 36,535 40,690
Other Liabilities 89,586 80,420 95,934 100,279 106,847
Total Liabilities 750,195 790,572 840,983 928,327 1,016,526
Total
Shareholder's Equity
(unadjusted for
asset revaluation)
102,658 117,070 152,665 146,367 170,634
BVPS (IDR/Share,
unadjusted for asset
revaluation)
4,400 5,017 6,609 6,336 7,387
Key Ratio Analysis
Year end Dec 2014 2015 2016F 2017F 2018F
Earning Asset Yield (%) 9.2 9.6 9.8 9.5 9.8
Cost of Funds (%) 3.7 3.7 3.4 3.3 3.3
NIM (as calculated, in%) 5.8 6.1 6.5 6.4 6.7
ROE (%) 19.4 17.4 9.6 17.4 18.0
ROA (%) 2.3 2.2 1.5 2.4 2.6
Cost to Income Ratio (%) 44.6 42.8 43.5 45.3 45.8
Loan Growth (%) 12.0 12.2 10.3 10.9 11.3
Deposit Growth (%) 14.6 6.7 4.8 12.1 10.0
LDR (%) 82.2 86.7 91.3 90.7 92.0
LFR (%) 81.9 86.4 90.1 89.3 90.4
RRR (%) 8.7 9.0 7.0 7.0 7.0
CAR (%) 16.3 18.0 21.4 21.5 21.3
Asset/Equity (x) 8.3 7.8 6.5 7.4 7.0
Gross NPL (%) 2.2 2.6 4.2 4.1 3.9
Loan Loss Coverage (%) 157 145 128 129 132
Cost of credit (%) 1.0 2.0 3.4 1.5 1.2
Interim Result (IDRbn)
3Q15 4Q15 1Q16 2Q16 3Q16
Total Loans (Gross) 552,660 586,675 564,705 597,015 637,500
Total Deposit 602,656 622,332 655,063 691,359 690,507
Total Asset 905,759 910,063 906,739 971,444 975,163
Net Interest Income 11,252 12,911 12,331 11,912 14,413
Net revenue 17,512 19,086 17,225 17,525 20,163
Operating profit 5,800 7,455 5,071 4,390 6,501
Net Profit 4,658 5,752 3,817 3,263 4,933
Capital History
Date
14-Jul-03 IPO @ IDR675
01-Mar-11 Additional Share HMETD

MARKET OUTLOOK PT Trimegah Securities Tbk - www.trimegah.com 30
Investment thesis:
Current CEO is departing, kitchen-sinking event is possible
The company will replace its current CEO, Mr, Asmawi Syam, who will end his term at around 1Q17, Thus, there is a possibility of
kitchen-sinking event next year, as also occured in BBNI and BMRI, Despite its highest upside risk from rising coal price (BBRI’s mining
NPL accounts for 20% of total NPL book), market is likely to expect larger downgrades in 2017F. We conservatively raised our credit cost estimates by 60bps next year, translated into dropping ROE to 17.5%, There is further downside risk if turns out that 2017F NPL ratio is higher than our expectation (2.3%),
There is also a risk that KUR lending rate to be set at 7% (vs,
currently 9%)
With KUR interest subsidy budget being cut to IDR9,5trn while na-tion-wide disbursement target increased to IDR120trn (vs, this
year’s IDR100trn), there is NIM pressure risk in our view. We con-servatively forecasted lower NIM in 2017F (8.1%) from currently 8.3%. However, if govt stops KUR program in 2018F, then NIM will likely to go up again above 8.3% as we assume BBRI would return
to conventional micro loans as its main engine of growth.
Valuation: 2017F TP IDR11,900 (unchanged), tactical upgrade to Buy
The TP is derived by using Gordon Growth Model under the assumptions of 19.4% sustainable ROE (unadjusted for asset revaluation) (prev: 18%), 10% long-term growth rate, 15.8% cost of equity (prev: 14.6%),
and 8% risk–free rate (prev: 6.8%). Due to 14% potential upside to our
TP, we therefore upgrade BBRI rating into Buy (prev: Neutral).
Key investment risks:
Worsening macroeconomic situation, which could impair asset quali-
ty further,
Corporate actions that might have impact to the share price,
Regulatory risks, e,g,, single digit lending rate, capital charge on
domestic systemically important banks (DSIB),
BBRI is Indonesia’s biggest MSME lender
with the most extensive network of
branches and outlets throughout the
country, The bank also offers corporate
and consumer loans,
Share Price Rp10,475
Sector Bank
Price Target Rp11,900 (14%)
Year end Dec 2014 2015 2016F 2017F 2018F
Net Profit (IDRbn) 24,215 25,398 24,772 26,585 35,271
EPS (IDR) 983 1,030 1,014 1,089 1,444
EPS Growth (%) 13.6 4.9 -1.6 7.3 32.7
DPS (IDR) 258 258 298 304 272
BVPS (IDR) 3,959 4,578 5,453 6,237 7,409
P/E (x) 11.9 11.1 10.0 9.3 7.0
P/BV (x) 2.9 2.5 1.9 1.6 1.4
ROE (%) 24.8 22.5 18.6 17.5 19.5
Div Yield (%) 2.5 2.5 2.9 3.0 2.7
Bank Rakyat Indonesia Tactical Upgrade into Buy
BUY Rp11,900
Reuters Code BBRI,JK
Bloomberg Code BBRI,IJ
Issued Shares (m) 24,422
Mkt Cap (IDRbn) 255,825
Avg, Value Daily
3-month (IDRbn)
266.4
52-Wk range (IDR) 12,975 / 9,525
Indonesian Government 57.8%
Public 42.2%
EPS 16F 17F
Consensus (Rp) 1,037 1,173
TRIM vs Cons, (%) -2.3 -6.7
Company Update
Stock Data
Major Shareholders
Consensus
Stock Price
Company Data
0.0
100.0
200.0
300.0
400.0
500.0
600.0
700.0
-
2,000
4,000
6,000
8,000
10,000
12,000
14,000
Nov-15 Mar-16 Jul-16
(Rpbn)Avg. 5 Day MA Trading Value (RHS) Price (LHS)

PT Trimegah Securities Tbk - www.trimegah.com MARKET OUTLOOK 31
Income Statement (IDRbn)
Year end Dec 2014 2015 2016F 2017F 2018F
Interest Income 75,122 85,434 94,200 103,772 120,000
Interest
Expense -23,680 -27,154 -27,796 -29,412 -32,926
NII 51,442 58,280 66,404 74,361 87,074
Non Interest
Income 9,299 12,398 13,559 14,422 16,304
Operating
Expense -26,715 -31,265 -36,293 -41,579 -47,647
PPOP 34,026 39,413 43,670 47,203 55,731
Loan Loss
Provision -5,719 -8,900 -12,977 -13,191 -10,611
Operating Profit 28,307 30,513 30,693 34,012 45,120
Profit
Before Tax 30,804 32,494 31,693 34,012 45,120
Tax Expense -6,578 -7,083 -6,909 -7,414 -9,835
Net Profit 24,215 25,398 24,772 26,585 35,271
EPS (IDR) 983 1,030 1,014 1,089 1,444
EPS Growth
(%) 13.6 4.9 -1.6 7.3 32.7
Dividend
Per Share 258 258 298 304 272
Dividend
Growth (%) 14.4 0.0 15.6 2.2 -10.6
Balance Sheet (IDRbn)
Year end Dec 2014 2015F 2016F 2017F 2018F
Cash and
CA with BI 73,654 90,489 80,826 92,639 107,473
Interbank
Placement 62,035 49,835 80,420 119,277 169,703
Marketable
Securities 84,168 124,874 76,984 88,178 92,177
Government
Bonds 4,304 3,816 4,453 5,109 4,953
Loans-net 479,211 547,318 626,027 695,870 795,461
Net Fixed Assets 5,917 8,039 24,936 26,143 27,687
Other Assets 92,665 54,055 103,776 109,442 120,976
Total Assets 801,955 878,426 997,422 1,136,658 1,318,430
Total Earning
Assets 694,877 751,955 861,738 983,776 1,143,718
Deposit 622,322 668,995 763,458 874,676 1,016,078
Borrowings 24,987 35,480 42,168 47,018 49,510
Other Liabilities 56,909 60,823 58,330 62,344 71,598
Total Liabilities 704,218 765,299 863,956 984,038 1,137,186
Total
Shareholder's
Equity
(unadjusted for
asset revalua-
97,560 112,833 133,172 152,325 180,950
BVPS (IDR/
Share, unadjust-
ed for asset
revaluation)
3,959 4,578 5,453 6,237 7,409
Key Ratio Analysis
Year end Dec 2013 2014 2015F 2016F 2017F
Earning Asset Yield (%) 12.2 11.9 11.7 11.2 11.3
Cost of Funds (%) 3.9 3.9 3.6 3.3 3.2
NIM (%) 8.3 8.1 8.2 8.1 8.2
ROE (%) 24.8 22.5 18.6 17.5 19.5
ROA (%) 3.4 3.0 2.6 2.5 2.9
Cost to Income Ratio (%) 44.0 44.2 45.4 46.8 46.1
Loan Growth (%) 14.0 14.0 14.9 11.5 14.1
Deposit Growth (%) 23.4 7.5 14.1 14.6 16.2
LDR (%) 81.8 86.9 87.4 85.0 83.3
LFR (%) 76.8 80.6 80.8 78.7 77.6
RRR (%) 8.5 9.5 7.0 7.0 7.0
CAR (%) 18.3 20.6 20.9 21.2 19.7
Asset/Equity (x) 8.2 7.8 7.5 7.5 7.3
Gross NPL (%) 1.7 2.0 2.2 2.3 2.2
Loan Loss Coverage (%) 189.9 150.8 158.0 164.0 162.5
Cost of Credit (%) 1.2 1.6 2.0 1.8 1.3
Interim Result (IDRbn)
3Q15 4Q15 1Q16 2Q16 3Q16
Total Loans (Gross) 552,026 588,375 591,252 623,463 640,762
Total Deposit 635,948 668,995 658,736 683,739 694,843
Total Asset 802,299 878,426 864,939 907,843 931,693
Net Interest Income 15,125 15,379 15,843 17,096 17,119
Net revenue 18,480 20,021 19,898 21,605 21,189
Operating profit 7,816 9,861 7,737 7,837 7,734
Net Profit 6,471 6,981 6,245 5,930 6,775
Capital History
Date
10-Nov-03 IPO @ Rp875
11-Jan-11 Stock Split 1:2
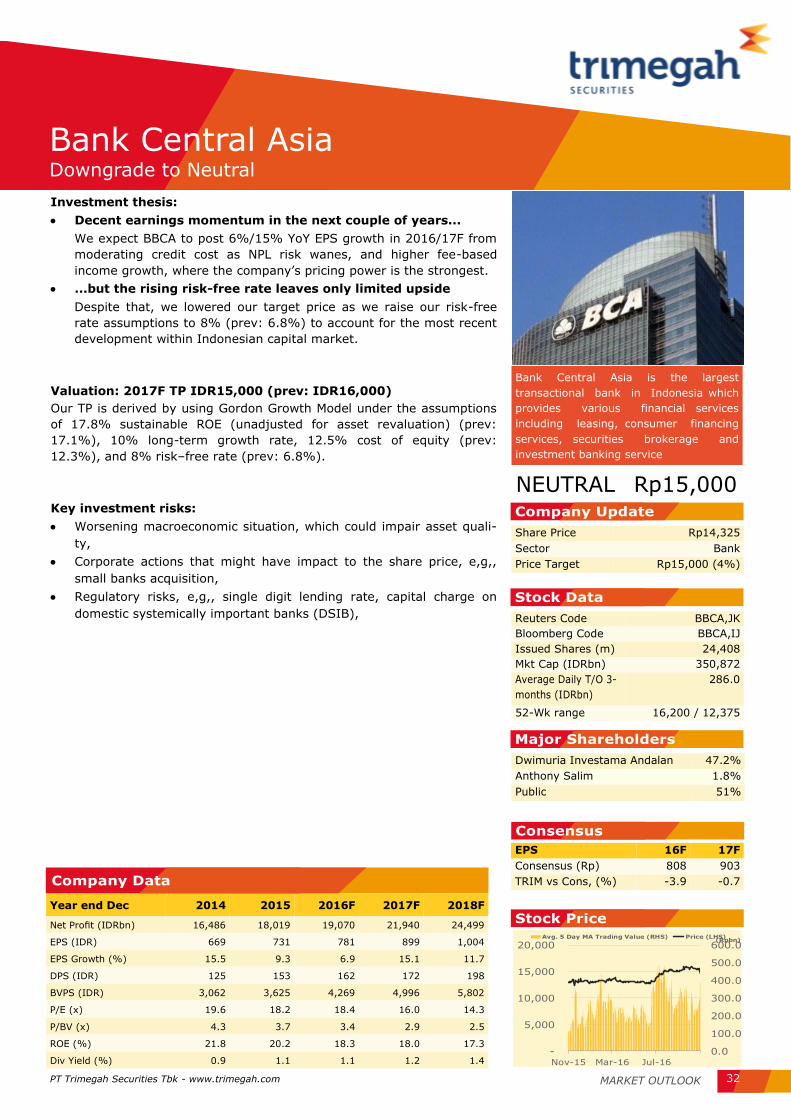
MARKET OUTLOOK PT Trimegah Securities Tbk - www.trimegah.com 32
Investment thesis:
Decent earnings momentum in the next couple of years...
We expect BBCA to post 6%/15% YoY EPS growth in 2016/17F from
moderating credit cost as NPL risk wanes, and higher fee-based
income growth, where the company’s pricing power is the strongest.
...but the rising risk-free rate leaves only limited upside
Despite that, we lowered our target price as we raise our risk-free
rate assumptions to 8% (prev: 6.8%) to account for the most recent
development within Indonesian capital market.
Valuation: 2017F TP IDR15,000 (prev: IDR16,000)
Our TP is derived by using Gordon Growth Model under the assumptions
of 17.8% sustainable ROE (unadjusted for asset revaluation) (prev:
17.1%), 10% long-term growth rate, 12.5% cost of equity (prev:
12.3%), and 8% risk–free rate (prev: 6.8%).
Key investment risks:
Worsening macroeconomic situation, which could impair asset quali-
ty,
Corporate actions that might have impact to the share price, e,g,,
small banks acquisition,
Regulatory risks, e,g,, single digit lending rate, capital charge on
domestic systemically important banks (DSIB),
Bank Central Asia is the largest
transactional bank in Indonesia which
provides various financial services
including leasing, consumer financing
services, securities brokerage and
investment banking service
Share Price Rp14,325
Sector Bank
Price Target Rp15,000 (4%)
Year end Dec 2014 2015 2016F 2017F 2018F
Net Profit (IDRbn) 16,486 18,019 19,070 21,940 24,499
EPS (IDR) 669 731 781 899 1,004
EPS Growth (%) 15.5 9.3 6.9 15.1 11.7
DPS (IDR) 125 153 162 172 198
BVPS (IDR) 3,062 3,625 4,269 4,996 5,802
P/E (x) 19.6 18.2 18.4 16.0 14.3
P/BV (x) 4.3 3.7 3.4 2.9 2.5
ROE (%) 21.8 20.2 18.3 18.0 17.3
Div Yield (%) 0.9 1.1 1.1 1.2 1.4
Bank Central Asia Downgrade to Neutral
NEUTRAL Rp15,000
Reuters Code BBCA,JK
Bloomberg Code BBCA,IJ
Issued Shares (m) 24,408
Mkt Cap (IDRbn) 350,872
Average Daily T/O 3-
months (IDRbn)
286.0
52-Wk range 16,200 / 12,375
Dwimuria Investama Andalan 47.2%
Anthony Salim 1.8%
Public 51%
EPS 16F 17F
Consensus (Rp) 808 903
TRIM vs Cons, (%) -3.9 -0.7
Company Update
Stock Data
Major Shareholders
Consensus
Stock Price
Company Data
0.0
100.0
200.0
300.0
400.0
500.0
600.0
-
5,000
10,000
15,000
20,000
Nov-15 Mar-16 Jul-16
(Rpbn)Avg. 5 Day MA Trading Value (RHS) Price (LHS)

PT Trimegah Securities Tbk - www.trimegah.com MARKET OUTLOOK 33
Income Statement (IDRbn)
Year end Dec 2014 2015 2016F 2017F 2018F
Interest Income 43,771 47,082 52,064 56,532 61,808
Interest
Expense -11,745 -11,213 -11,643 -11,950 -13,022
NII 32,027 35,869 40,421 44,583 48,786
Non Interest
Income 9,351 12,012 12,294 12,573 15,318
Operating
Expense -18,397 -21,718 -24,857 -27,985 -31,521
PPOP 22,981 26,162 27,858 29,171 32,583
Loan Loss
Provision -2,240 -3,505 -3,880 -1,588 -1,785
Operating Profit 20,741 22,657 23,978 27,583 30,798
Profit
Before Tax 20,741 22,657 23,978 27,583 30,798
Tax Expense -4,229 -4,621 -4,891 -5,626 -6,282
Net Profit 16,486 18,019 19,070 21,940 24,499
EPS (Rp) 669 731 781 899 1,004
EPS Growth
(%) 15.5 9.3 6.9 15.1 11.7
Dividend
Per Share 125 153 162 172 198
Dividend
Growth (%) 7.6 22.4 6.2 5.8 15.1
Balance Sheet (IDRbn)
Year end Dec 2014 2015 2016F 2017F 2018F
Cash and
CA with BI 58,453 55,624 54,904 59,677 65,537
Interbank
Placement 16,633 64,698 58,262 61,213 62,362
Marketable
Securities 47,245 24,930 29,968 29,937 29,939
Government
Bonds 29,018 30,143 30,489 33,178 36,443
Loans-net 339,859 378,616 419,332 471,972 535,997
Net Fixed Assets 8,845 9,712 16,510 17,336 18,203
Other Assets 53,103 30,649 38,944 41,980 45,990
Total Assets 553,156 594,373 648,410 715,292 794,471
Total Earning
Assets 514,906 554,966 599,232 662,361 737,213
Deposit 450,155 476,820 512,258 558,086 613,783
Borrowings 3,081 1,743 3,883 4,366 4,953
Other Liabilities 24,194 26,184 27,808 30,633 33,856
Total Liabilities 477,430 504,748 543,948 593,085 652,592
Total
Shareholder's Equity
(unadjusted for asset
revaluation)
75,488 89,369 104,206 121,951 141,623
BVPS (IDR/Share,
unadjusted for asset
revaluation)
3,062 3,625 4,269 4,996 5,802
Key Ratio Analysis
Year end Dec 2014 2015F 2016F 2017F 2018F
Earning Asset Yield (%) 8.9 8.8 9.0 9.0 8.8
Cost of Funds (%) 2.7 2.4 2.3 2.2 2.2
NIM (%) 6.5 6.7 7.0 7.1 7.0
ROE (%) 21.8 20.2 18.3 18.0 17.3
ROA (%) 3.1 3.1 3.1 3.2 3.2
Cost to Income Ratio (%) 44.5 45.4 47.2 49.0 49.2
Loan Growth (%) 11.0 11.9 11.3 12.4 13.4
Deposit Growth (%) 9.5 5.9 7.4 8.9 10.0
LDR (%) 77.0 81.3 84.2 86.9 89.7
LFR (%) 76.6 80.8 83.8 86.5 89.3
RRR (%) 8.6 7.9 7.0 7.0 7.0
CAR (%) 17.2 19.0 17.7 18.3 18.8
Asset/Equity (x) 7.3 6.7 6.2 5.9 5.6
Gross NPL (%) 0.6 0.7 1.4 1.3 1.2
Loan Loss Coverage (%) 324 322 201 206 209
Cost of Credit (%) 0.6 0.9 0.9 0.3 0.3
Interim Results (IDRbn)
3Q15 4Q15 1Q16 2Q16 3Q16
Total Loans 364,846 391,674 377,313 391,887 401,045
Total Deposit 462,252 476,820 473,629 493,774 496,547
Total Asset 584,444 594,373 603,427 626,176 660,145
Net Interest Income 9,085 9,613 9,745 9,959 10,147
Net revenue 11,815 13,406 12,827 13,299 13,532
Operating profit 6,040 5,820 5,655 6,394 6,951
Net Profit 4,827 4,651 4,507 5,069 5,551
Capital History
Date
31-May-00 IPO @ Rp1,400
28-Jan-08 Stock Split 1:2

MARKET OUTLOOK PT Trimegah Securities Tbk - www.trimegah.com 34
Investment thesis:
The company offers sustainable and rising ROE outlook
BBTN remains the beneficiary of govt public housing program. Due to the nation-wide large housing backlog, the company is expected to tap more subsidized mortgage loans as well as construction loans. Putting all of that into our model, BBTN is expected to reap 19-21% EPS growth and ~15% ROE in 2017-18F (unadjusted for asset reval-uation).
Risks about change in FLPP scheme priced-in
Govt already announced IDR15.6trn subsidized housing mortgage budget for 2017F, a 16% YoY increase from this year’s budget. However, there is a risk of funding scheme change into 60:40 (vs. current 90:10) which could have some NIM pressure risk for BBTN. But this would likely be offset by potential TD rate cut. Management stated that, given current balance sheet condition, there is a 50bps room of TD rate cut. Nonetheless, such risk has already been priced-in by the market.
Less budget risk in the future
BBTN guided to receive IDR5.3trn deferred subsidized mortgage facility (FLPP) budget from the govt by 4Q16. Such amount should’ve been disbursed in 2015. Management stated to engage in formal agreement to avoid similar situation from happening again in the future.
Valuation: 2017F TP IDR1,850 (prev: IDR2,200)
The TP is derived by using Gordon Growth Model under the assumptions of 16.1% sustainable ROE (unadjusted for asset revaluation) (prev: 14.1%), 5% long-term growth rate, 15.5% cost of equity (prev: 13.3%), and 8% risk–free rate (prev: 6.8%).
Key investment risks:
Worsening macroeconomic situation and rise in interest rates; these
would have impact on BBTN’s margins and asset quality.
Corporate actions that might have impact to the share price, e.g.,
the establishment of multifinance and insurance subsidiaries.
Regulatory risks, e.g., single digit lending rate, capital charge on
domestic systemically important banks (DSIB).
Govt intervention risks, e.g., adverse change in funding scheme,
budget cut, etc.
Bank Tabungan Negara is a state-owned
bank which focuses on providing mort-
gage loans. The bank also offers sharia
compliant banking products.
Share Price Rp1,600
Sector Bank
Price Target Rp1,850 (16%)
Year end Dec 2014 2015 2016F 2017F 2018F
Net Profit (IDRbn) 1,146 1,851 2,397 2,862 3,454
EPS (IDR) 108 175 229 273 329
EPS Growth (%) -27.0 62.0 30.7 19.4 20.7
DPS (IDR) 44 21 43 52 63
BVPS (IDR) 1,155 1,310 1,814 1,752 2,019
P/E (x) 11.2 7.4 7.0 5.9 4.9
P/BV (x) 1.0 1.0 0.9 0.9 0.8
ROE (%) 9.3 13.4 12.6 15.6 16.3
Dividend Yield (%) 2.8 1.3 2.7 3.2 3.9
Bank Tabungan Negara Rising ROE Outlook Offers Another Re-rating Event
BUY Rp1,850
Reuters Code BBTN.JK
Bloomberg Code BBTN.IJ
Issued Shares (m) 10,484
Mkt Cap (Rpbn) 16,775
Average Daily T/O 3-
months (IDR bn)
29.3
52-Wk range 2,100 / 1,125
Indonesian Goverment 60%
Public 40%
EPS 16F 17F
Consensus (Rp) 216 258
TRIM vs Cons. (%) 5.0 4.7
Company Update
Stock Data
Major Shareholders
Consensus
Stock Price
Company Data
0.0
20.0
40.0
60.0
80.0
100.0
120.0
140.0
-
500
1,000
1,500
2,000
2,500
Nov-15 Mar-16 Jul-16
(Rpbn)Avg. 5 Day MA Trading Value (RHS) Price (LHS)
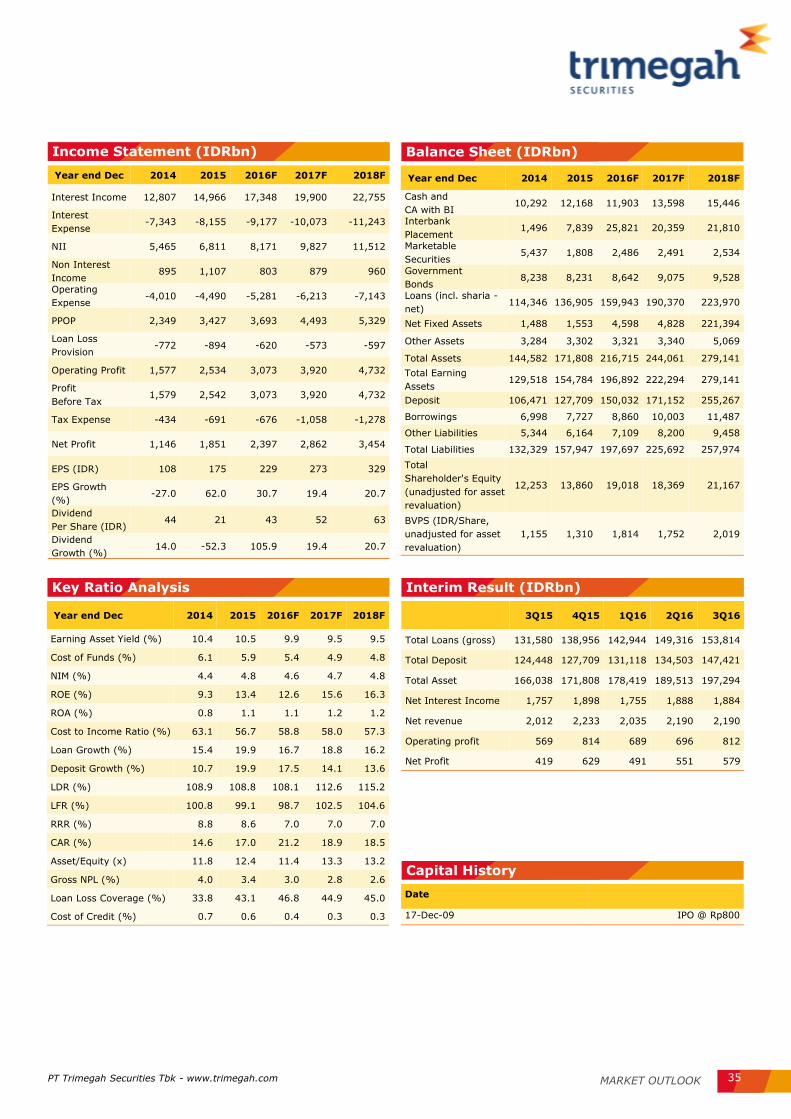
PT Trimegah Securities Tbk - www.trimegah.com MARKET OUTLOOK 35
Income Statement (IDRbn)
Year end Dec 2014 2015 2016F 2017F 2018F
Interest Income 12,807 14,966 17,348 19,900 22,755
Interest
Expense -7,343 -8,155 -9,177 -10,073 -11,243
NII 5,465 6,811 8,171 9,827 11,512
Non Interest
Income 895 1,107 803 879 960
Operating
Expense -4,010 -4,490 -5,281 -6,213 -7,143
PPOP 2,349 3,427 3,693 4,493 5,329
Loan Loss
Provision -772 -894 -620 -573 -597
Operating Profit 1,577 2,534 3,073 3,920 4,732
Profit
Before Tax 1,579 2,542 3,073 3,920 4,732
Tax Expense -434 -691 -676 -1,058 -1,278
Net Profit 1,146 1,851 2,397 2,862 3,454
EPS (IDR) 108 175 229 273 329
EPS Growth
(%) -27.0 62.0 30.7 19.4 20.7
Dividend
Per Share (IDR) 44 21 43 52 63
Dividend
Growth (%) 14.0 -52.3 105.9 19.4 20.7
Balance Sheet (IDRbn)
Year end Dec 2014 2015 2016F 2017F 2018F
Cash and
CA with BI 10,292 12,168 11,903 13,598 15,446
Interbank
Placement 1,496 7,839 25,821 20,359 21,810
Marketable
Securities 5,437 1,808 2,486 2,491 2,534
Government
Bonds 8,238 8,231 8,642 9,075 9,528
Loans (incl. sharia -
net) 114,346 136,905 159,943 190,370 223,970
Net Fixed Assets 1,488 1,553 4,598 4,828 221,394
Other Assets 3,284 3,302 3,321 3,340 5,069
Total Assets 144,582 171,808 216,715 244,061 279,141
Total Earning
Assets 129,518 154,784 196,892 222,294 279,141
Deposit 106,471 127,709 150,032 171,152 255,267
Borrowings 6,998 7,727 8,860 10,003 11,487
Other Liabilities 5,344 6,164 7,109 8,200 9,458
Total Liabilities 132,329 157,947 197,697 225,692 257,974
Total
Shareholder's Equity
(unadjusted for asset
revaluation)
12,253 13,860 19,018 18,369 21,167
BVPS (IDR/Share,
unadjusted for asset
revaluation)
1,155 1,310 1,814 1,752 2,019
Key Ratio Analysis
Year end Dec 2014 2015 2016F 2017F 2018F
Earning Asset Yield (%) 10.4 10.5 9.9 9.5 9.5
Cost of Funds (%) 6.1 5.9 5.4 4.9 4.8
NIM (%) 4.4 4.8 4.6 4.7 4.8
ROE (%) 9.3 13.4 12.6 15.6 16.3
ROA (%) 0.8 1.1 1.1 1.2 1.2
Cost to Income Ratio (%) 63.1 56.7 58.8 58.0 57.3
Loan Growth (%) 15.4 19.9 16.7 18.8 16.2
Deposit Growth (%) 10.7 19.9 17.5 14.1 13.6
LDR (%) 108.9 108.8 108.1 112.6 115.2
LFR (%) 100.8 99.1 98.7 102.5 104.6
RRR (%) 8.8 8.6 7.0 7.0 7.0
CAR (%) 14.6 17.0 21.2 18.9 18.5
Asset/Equity (x) 11.8 12.4 11.4 13.3 13.2
Gross NPL (%) 4.0 3.4 3.0 2.8 2.6
Loan Loss Coverage (%) 33.8 43.1 46.8 44.9 45.0
Cost of Credit (%) 0.7 0.6 0.4 0.3 0.3
Interim Result (IDRbn)
3Q15 4Q15 1Q16 2Q16 3Q16
Total Loans (gross) 131,580 138,956 142,944 149,316 153,814
Total Deposit 124,448 127,709 131,118 134,503 147,421
Total Asset 166,038 171,808 178,419 189,513 197,294
Net Interest Income 1,757 1,898 1,755 1,888 1,884
Net revenue 2,012 2,233 2,035 2,190 2,190
Operating profit 569 814 689 696 812
Net Profit 419 629 491 551 579
Capital History
Date
17-Dec-09 IPO @ Rp800

MARKET OUTLOOK PT Trimegah Securities Tbk - www.trimegah.com 36
Investment thesis:
The biggest beneficiary of rising coal price among small
banks in our universe
It is because of BNLI’s large mining NPL in its loan book—mining NPL
accounts for ~14% of total NPL book. Therefore, we expect BNLI to experience faster SML and NPL improvement than any other banks
under our coverage. Our recent meeting with the company revealed that there are some coal-related debtors that shows improvement in repayment capability, which a good sign in our view.
Good earnings momentum to start next year, expecting ~8%
ROE in 2017-18F
We expect BNLI to start reporting positive earnings in 2017F as we assume NPL ratio to decline faster from rising coal price. Our model says earnings will turn to IDR2trn next year along with ROE turna-round to ~7-8% in 2017-18F on the back of normalizing credit costs.
Valuation: 2017F TP IDR600 (prev: IDR700). Reiterate Buy
The TP is derived by using Gordon Growth Model under the assumptions
of 8.9% sustainable ROE, 5% long-term growth rate, 12.5% cost of equity (prev: 11.3%), and 8% risk–free rate (prev: 6.8%).
Key investment risks
Worsening macroeconomic situation and rise in interest rates; these
would have impact on BNLI’s margins and asset quality. Note that
BNLI’s SML loans is still high.
Corporate actions that might have impact to the share price, e.g.,
Standard Chartered Bank ownership divestment.
Regulatory risks, e.g., single digit lending rate, capital charge on
domestic systemically important banks (DSIB).
PT Bank Permata, Tbk provides
commercial and forex banking ser-
vices through a network of offices in
Indonesia.
Share Price Rp530
Sector Bank
Price Target Rp600 (13%)
Year end Dec 2014 2015 2016F 2017F 2018F
Net Profit (IDRbn) 1,587 247 -1,009 1,789 2,258
EPS (IDR) 134 21 -46 81 102
EPS Growth (%) -17.3 -84.3 -317.3 -277.2 26.2
DPS (IDR) 0 0 0 0 0
BVPS (IDR) 1,442 1,599 1,052 1,133 1,235
P/E (x) 10.5 35.0 -11.6 6.6 5.2
P/BV (x) 1.0 0.5 0.5 0.5 0.4
ROE (%) 9.3 1.3 -4.3 7.1 8.3
Div Yield (%) 0.0 0.0 0.0 0.0 0.0
Bank Permata Reiterate Buy
BUY Rp600
Reuters Code BNLI.JK
Bloomberg Code BNLI.IJ
Issued Shares (m) 22,117
Mkt Cap (IDR bn) 11,722
Avg. Value Daily
3 month (IDR bn) 6.9
52-Wk range (IDR) 1,180 / 540
PT Astra International Tbk 44.6%
Standard Chartered Bank 44.6%
Public 10.9%
EPS 16F 17F
Consensus (Rp) N/A N/A
TRIM vs Cons. (%) N/A N/A
Company Update
Stock Data
Major Shareholders
Consensus
Stock Price
Company Data
0.0
20.0
40.0
60.0
80.0
100.0
-
200
400
600
800
1,000
1,200
Nov-15 Mar-16 Jul-16
(Rpbn)Avg. 5 Day MA Trading Value (RHS) Price (LHS)

PT Trimegah Securities Tbk - www.trimegah.com MARKET OUTLOOK 37
Income Statement (IDRbn)
Year end Dec 2014 2015 2016F 2017F 2018F
Interest Income 15,547 16,131 14,712 14,094 14,302
Interest
Expense 10,117 9,934 8,602 7,695 7,479
NII 5,429 6,197 6,109 6,398 6,823
Non Interest
Income 1,990 2,153 2,044 1,960 2,209
Operating
Expense 4,195 4,378 4,487 4,763 4,913
PPOP 3,224 3,972 3,666 3,596 4,120
Loan Loss
Provision 1,178 3,678 4,960 1,302 1,225
Operating Profit 2,046 294 -1,294 2,294 2,895
Profit
Before Tax 2,046 294 -1,294 2,294 2,895
Tax Expense 459 46 -285 505 637
Net Profit 1,587 247 -1,009 1,789 2,258
EPS (IDR) 134 21 -46 81 102
EPS Growth
(%) -17.3 -84.3 -317.3 -277.2 26.2
Dividend
Per Share 0 0 0 0 0
Dividend
Growth (%) 0 0 0 0 0
Balance Sheet (IDRbn)
Year end Dec 2014 2015 2016F 2017F 2018F
Cash and
CA with BI 15,869 14,846 10,806 10,819 10,769
Interbank
Placement 1,396 8,291 15,652 8,519 8,416
Marketable
Securities 14,888 11,519 10,291 10,304 9,193
Government
Bonds 1,182 3,970 3,390 2,573 2,576
Loans-net 131,388 125,868 112,802 117,420 122,636
Net Fixed Assets 1,129 2,724 2,806 2,890 2,948
Other Assets 7,489 7,342 7,605 7,965 8,355
Total Assets 185,354 182,689 170,247 168,252 172,855
Total Earning
Assets 160,866 157,777 149,030 146,578 150,783
Deposit 148,006 145,461 128,643 128,802 131,327
Borrowings 10 0 0 0 0
Other Liabilities 8,927 7,517 5,378 5,426 5,544
Total Liabilities 168,271 163,877 146,988 143,203 145,548
Total
Shareholder's Equity 17,083 18,813 23,259 25,049 27,307
BVPS (IDR/Share) 1,442 1,599 1,052 1,133 1,235
Key Ratio Analysis
Year end Dec 2014 2015 2016F 2017F 2018F
Earning Asset Yield (%) 10.1 10.1 9.6 9.5 9.6
Cost of Funds (%) 6.7 6.3 5.8 5.8 5.5
NIM (%) 3.5 3.9 4.0 4.3 4.6
ROE (%) 9.3 1.3 -4.3 7.1 8.3
ROA (%) 0.9 0.1 -0.6 1.1 1.3
Cost to Income Ratio (%) 56.5 52.4 55.0 57.0 54.4
Loan Growth (%) 11.4 -2.9 -8.2 3.4 3.8
Deposit Growth (%) 11.2 -1.7 -11.6 0.1 2.0
LDR (%) 90.1 89.0 92.4 95.5 97.2
LFR (%) 89.3 88.6 90.5 93.7 95.3
RRR (%) 9.2 8.8 7.0 7.0 7.0
CAR (%) 15.2 15.0 18.6 20.0 21.0
Asset/Equity (x) 10.9 9.7 7.3 6.7 6.3
Gross NPL (%) 1.7 2.7 4.9 4.5 4.2
Loan Loss Coverage (%) 88.4 102.0 103.2 100.7 93.2
Cost of credit (%) 0.8 2.3 3.2 0.9 0.8
Interim Result (IDRbn)
3Q15 4Q15 1Q16 2Q16 3Q16
Total Loans 134,824 129,487 126,645 121,054 113,677
Total Deposit 150,892 145,461 136,779 139,115 130,326
Total Asset 194,487 182,689 174,722 181,509 171,029
Net Interest Income 1,706 1,512 1,474 1,461 1,547
Net revenue 2,005 2,098 2,067 1,983 2,071
Operating profit 73 -986 -562 -650 -595
Net Profit 101 -691 -376 -459 -398
Capital History
Date
17-Dec-09 IPO @ Rp800

MARKET OUTLOOK PT Trimegah Securities Tbk - www.trimegah.com 38
Investment thesis:
Earnings and ROE turnaround to continue in 2017F
We view BNGA’s earnings turnaround to continue until 2017F as its credit cost normalizes, trajecting its ROE to ~10% in the next couple
of years.
JCI re-inclusion: another upside risk for BNGA
Following the more stable daily trading volume, relatively less vola-tile share price now, and improved financial performance, we believe there is a high chance of BNGA being re-included in JCI. This, in our
view, would attract a wider range of investors and would drive valu-ation higher.
Valuation: 2017F TP IDR800 (prev: IDR950). Downgrade to Neu-tral
The TP is derived by using Gordon Growth Model under the assumptions
of 11.2% sustainable ROE (exclude asset revaluation) (prev: 10.7%), 5% long-term growth rate, 15.6% cost of equity (prev: 14.2%), and 8% risk–free rate (prev: 6.8%). Due to limited potential upside to our new TP, we downgrade the rating into Neutral (prev: Buy).
Risks to our call
Worsening macroeconomic situation; these would have impact on
BNGA’s asset quality, in particular.
Corporate actions that might have impact to the share price.
Regulatory risks, e.g., single digit lending rate, capital charge on
domestic systemically important banks (DSIB).
PT Bank CIMB Niaga Tbk operates in individual and
private banking, merchant and corporate banking,
regional banking, and investment services. The Bank
also provides financial services such as leasing,
factoring, stock broking, underwriting, insurance,
investment management through its subsidiaries.
Share Price Rp785
Sector Bank
Price Target Rp800 (2%)
Year end Dec 2014 2015 2016F 2017F 2018F
Net Profit (IDR bn) 2,342 428 1,500 3,424 4,186
EPS (IDR) 93 17 60 138 168
EPS Growth (%) -45 -82 254 128 22
DPS (IDR) 0 0 0 0 0
BVPS (IDR) 1,132 1,141 1,237 1,375 1,543
P/E (x) 9.0 35.0 13.0 5.7 4.7
P/BV (x) 0.7 0.5 0.6 0.6 0.5
ROE (%) 8.2 1.5 4.9 10.0 10.9
Div Yield (%) 0.0 0.0 0.0 0.0 0.0
CIMB Niaga Downgrade to Neutral
NEUTRAL Rp800
Reuters Code BNGA.JK
Bloomberg Code BNGA.IJ
Issued Shares (m) 24,880
Mkt Cap (IDR bn) 19,531
Avg. Value Daily
3 month (IDR bn) 23.7
52-Wk range (IDR) 1,090 / 480
CIMB Group Sdn Bhd, Malaysia 92.5%
Public 7.5%
EPS 16F 17F
Consensus (Rp) N/A N/A
TRIM vs Cons. (%) N/A N/A
Company Update
Stock Data
Major Shareholders
Consensus
Stock Price
Company Data
0.0
20.0
40.0
60.0
80.0
100.0
-
200
400
600
800
1,000
1,200
Nov-15 Mar-16 Jul-16
(Rpbn)Avg. 5 Day MA Trading Value (RHS) Price (LHS)

PT Trimegah Securities Tbk - www.trimegah.com MARKET OUTLOOK 39
Income Statement (IDRbn)
Year end Dec 2014 2015 2016F 2017F 2018F
Interest Income 20,813 22,319 20,967 20,743 21,320
Interest
Expense 10,123 10,932 9,999 10,003 9,570
NII 10,689 11,386 10,968 10,740 11,750
Non Interest
Income 4,282 4,050 4,261 4,866 5,560
Operating
Expense 6,830 7,683 7,091 7,170 7,529
PPOP 6,425 6,035 6,249 6,263 7,282
Loan Loss
Provision 3,466 5,343 4,269 1,697 1,700
Operating Profit 2,958 692 1,980 4,566 5,582
Profit
Before Tax 3,200 570 2,000 4,566 5,582
Tax Expense 856 142 500 1,141 1,395
Net Profit 2,342 428 1,500 3,424 4,186
EPS (Rp) 93 17 60 138 168
EPS Growth
(%) -45 -82 254 128 22
Dividend
Per Share 0 0 0 0 0
Dividend
Growth (%) 0 0 0 0 0
Balance Sheet (IDRbn)
Year end Dec 2014 2015 2016F 2017F 2018F
Cash and
CA with BI 22,591 21,193 17,744 18,673 20,247
Interbank
Placement 3,027 5,884 7,338 10,066 9,701
Marketable
Securities 10,826 9,822 8,919 9,387 10,178
Government
Bonds 11,484 16,050 12,487 13,141 14,249
Loans-net 163,623 163,683 164,542 172,769 190,046
Net Fixed Assets 2,485 3,362 6,541 6,737 6,939
Other Assets 2,157 2,542 3,399 3,558 3,794
Total Assets 233,162 238,849 237,044 250,842 272,206
Total Earning
Assets 204,429 208,646 206,315 218,782 238,172
Deposit 174,723 178,533 178,390 187,731 203,555
Borrowings 8,815 6,685 6,016 6,136 6,259
Other Liabilities 10,337 9,855 9,687 10,220 10,784
Total Liabilities 204,715 210,170 206,265 216,638 233,816
Total
Shareholder's Equity
(unadjusted for asset
revaluation)
28,448 28,679 30,780 34,204 38,390
BVPS (IDR/Share,
unadjusted for asset
revaluation)
1,132 1,141 1,237 1,375 1,543
Key Ratio Analysis
Year end Dec 2014 2015 2016F 2017F 2018F
Earning Asset Yield (%) 10.5 10.8 10.1 9.8 9.3
Cost of Funds (%) 5.4 5.5 5.0 5.0 4.5
NIM (%) 5.4 5.5 5.3 5.1 5.1
ROE (%) 8.2 1.5 4.9 10.0 10.9
ROA (%) 1.0 0.2 0.6 1.4 1.5
Cost to Income Ratio (%) 51.5 56.0 53.2 53.4 50.8
Loan Growth (%) 12.2 0.0 0.5 5.0 10.0
Deposit Growth (%) 6.7 2.2 -0.1 5.2 8.4
LDR (%) 93.6 91.7 92.2 92.0 93.4
LFR (%) 90.6 89.4 90.2 90.0 91.4
RRR (%) 8.4 8.2 6.5 6.5 6.5
CAR (%) 15.4 16.2 17.5 19.1 19.6
Asset/Equity (x) 8.2 8.3 7.7 7.3 7.1
Gross NPL (%) 4.0 3.8 4.2 4.1 3.9
Loan Loss Coverage (%) 84.4 107.3 108.7 112.4 116.3
Cost of credit (%) 1.8 2.6 2.1 0.8 0.7
Interim Result (IDRbn)
3Q15 4Q15 1Q16 2Q16 3Q16
Total Loans 172,222 177,537 171,021 175,336 174,084
Total Deposit 185,716 178,533 172,739 179,292 178,668
Total Asset 244,285 238,849 231,667 239,385 237,123
Net Interest Income 2,978 2,862 2,837 2,976 3,073
Net revenue 3,532 3,476 3,555 3,724 3,566
Operating profit 165 241 399 652 540
Net Profit 89 163 269 467 563
Capital History
Date
15-Jan-90 IPO @ IDR9,900
08-Sep-90 1:3 Rights @ IDR8,000
24-Jan-14 Additional Shares without HMETD

MARKET OUTLOOK PT Trimegah Securities Tbk - www.trimegah.com 40
Investment thesis:
Improving NPL outlook...
We view PNBN as the bank with conservative lending strategy, pre-
serving asset quality. With positive NPL momentum in 9M16 (NPL
ratio down to 2.7% from previously 2.8% in 6M16), we expect stabi-
lizing NPL ratio within 2.6-2.7% this year before declining gradually
in the following years given more favorable macro conditions, i.e.,
rising coal price, stable IDR and inflation, and rising consumer confi-
dence.
...and to benefit from declining interest rates
Given its current low CASA (~39%), we view PNBN to reap benefit
from declining benchmark interest rate. From a historical perspec-
tive, PNBN’s NIM hovered within 4.5%-5% range during low interest
rate period (2010-12). During that period also, PNBN’s CASA was
above 50%.
Expect ROE turnaround to ~8% in 2017-18F, but at current
valuation, it is already priced-in
We expect PNBN to report 55/15% EPS growth in 2017/18F, leading
ROE to 7.5/8.1% in the respective years on 1) much lower provi-
sioning expense from improving NPLs and 2) rising NIM to ~5%.
Despite that, we view the turnaround to be already priced-in by the
market as our new TP implies limited upside.
Valuation: 2017F TP IDR700 (prev: IDR900), downgrade to Sell
The TP is derived by using Gordon Growth Model under the assumptions
of 8.6% sustainable ROE, 5% long-term growth rate, 12% cost of equity
(prev: 10.8%), and 8% risk–free rate (prev: 6.8%). It implies 0.6x
2017F PBV. Due to negative potential upside, we downgrade PNBN’s
rating into Sell (prev: Neutral).
Key investment risks
Worsening macroeconomic situation and rise in interest rates; these
would have impact on PNBN’s margins and asset quality.
Corporate actions that might have impact to the share price, e.g.,
potential sale of ANZ stake.
Regulatory risks, e.g., single digit lending rate, capital charge on
domestic systemically important banks (DSIB).
PT Bank Pan Indonesia Tbk provides
commercial banking and foreign
exchange services in Indonesia and
overseas
Share Price Rp720
Sector Bank
Price Target Rp700 (-3%)
Year end Dec 2014 2015 2016F 2017F 2018F
Net Profit (IDR bn) 2,367 1,407 2,179 2,497 2,934
EPS (IDR) 98 58 91 105 123
EPS Growth (%) 4.7 -40.6 56.5 14.6 17.5
DPS (IDR) 0 0 0 0 0
BVPS (IDR) 864 1,177 1,298 1,402 1,526
P/E (x) 11.9 14.0 7.9 6.9 5.9
P/BV (x) 1.3 0.7 0.6 0.5 0.5
ROE (%) 11.4 5.0 7.0 7.5 8.1
Div Yield (%) 0.0 0.0 0.0 0.0 0.0
Bank Pan Indonesia Downgrade to Sell
SELL Rp700
Reuters Code PNBN.JK
Bloomberg Code PNBN.IJ
Issued Shares (m) 23,838
Mkt Cap (IDR bn) 17,163
Avg. Value Daily
3-month (IDR bn) 7.9
52-Wk range (IDR) 1,090 / 560
PT Panin Financial Tbk 46.04%
Vortraint No. 1103 PTY Limited 38.82%
Public 15.14%
EPS 16F 17F
Consensus (Rp) 85 99
TRIM vs Cons. (%) 6.0 5.5
Company Update
Stock Data
Major Shareholders
Consensus
Stock Price
Company Data
0.0
10.0
20.0
30.0
40.0
50.0
60.0
-
200
400
600
800
1,000
1,200
Nov-15 Mar-16 Jul-16
(Rpbn)Avg. 5 Day MA Trading Value (RHS) Price (LHS)
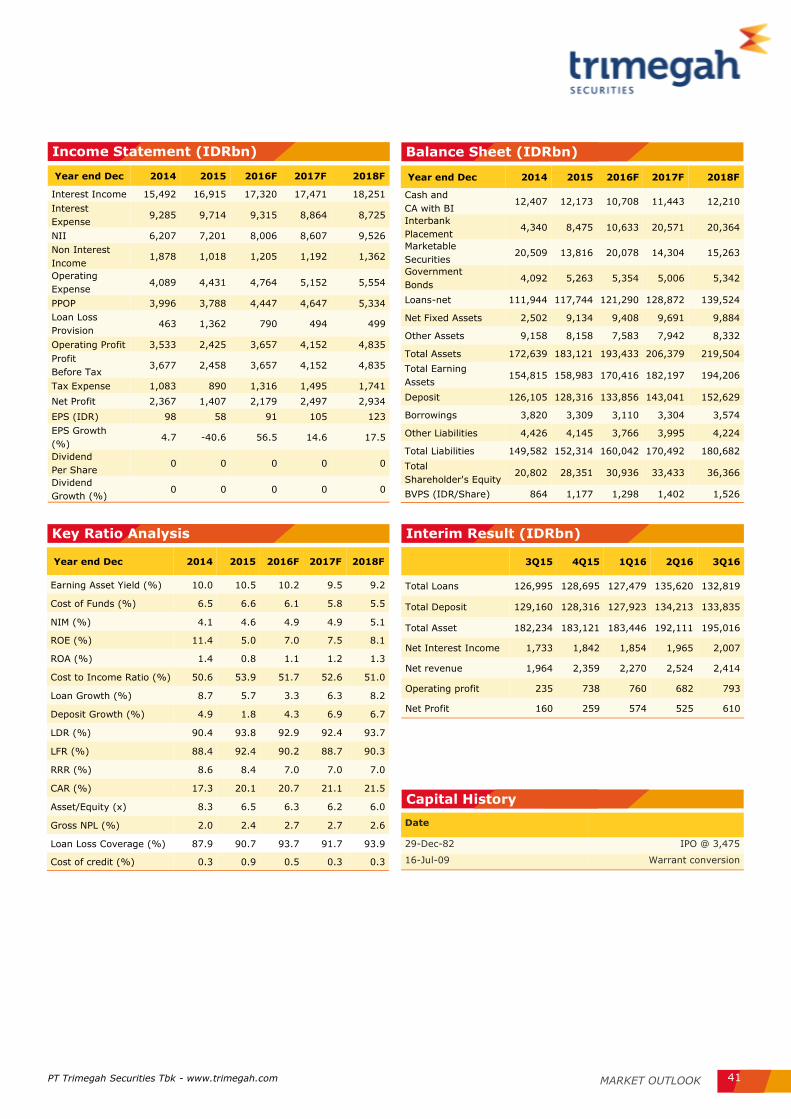
PT Trimegah Securities Tbk - www.trimegah.com MARKET OUTLOOK 41
Income Statement (IDRbn)
Year end Dec 2014 2015 2016F 2017F 2018F
Interest Income 15,492 16,915 17,320 17,471 18,251
Interest
Expense 9,285 9,714 9,315 8,864 8,725
NII 6,207 7,201 8,006 8,607 9,526
Non Interest
Income 1,878 1,018 1,205 1,192 1,362
Operating
Expense 4,089 4,431 4,764 5,152 5,554
PPOP 3,996 3,788 4,447 4,647 5,334
Loan Loss
Provision 463 1,362 790 494 499
Operating Profit 3,533 2,425 3,657 4,152 4,835
Profit
Before Tax 3,677 2,458 3,657 4,152 4,835
Tax Expense 1,083 890 1,316 1,495 1,741
Net Profit 2,367 1,407 2,179 2,497 2,934
EPS (IDR) 98 58 91 105 123
EPS Growth
(%) 4.7 -40.6 56.5 14.6 17.5
Dividend
Per Share 0 0 0 0 0
Dividend
Growth (%) 0 0 0 0 0
Balance Sheet (IDRbn)
Year end Dec 2014 2015 2016F 2017F 2018F
Cash and
CA with BI 12,407 12,173 10,708 11,443 12,210
Interbank
Placement 4,340 8,475 10,633 20,571 20,364
Marketable
Securities 20,509 13,816 20,078 14,304 15,263
Government
Bonds 4,092 5,263 5,354 5,006 5,342
Loans-net 111,944 117,744 121,290 128,872 139,524
Net Fixed Assets 2,502 9,134 9,408 9,691 9,884
Other Assets 9,158 8,158 7,583 7,942 8,332
Total Assets 172,639 183,121 193,433 206,379 219,504
Total Earning
Assets 154,815 158,983 170,416 182,197 194,206
Deposit 126,105 128,316 133,856 143,041 152,629
Borrowings 3,820 3,309 3,110 3,304 3,574
Other Liabilities 4,426 4,145 3,766 3,995 4,224
Total Liabilities 149,582 152,314 160,042 170,492 180,682
Total
Shareholder's Equity 20,802 28,351 30,936 33,433 36,366
BVPS (IDR/Share) 864 1,177 1,298 1,402 1,526
Key Ratio Analysis
Year end Dec 2014 2015 2016F 2017F 2018F
Earning Asset Yield (%) 10.0 10.5 10.2 9.5 9.2
Cost of Funds (%) 6.5 6.6 6.1 5.8 5.5
NIM (%) 4.1 4.6 4.9 4.9 5.1
ROE (%) 11.4 5.0 7.0 7.5 8.1
ROA (%) 1.4 0.8 1.1 1.2 1.3
Cost to Income Ratio (%) 50.6 53.9 51.7 52.6 51.0
Loan Growth (%) 8.7 5.7 3.3 6.3 8.2
Deposit Growth (%) 4.9 1.8 4.3 6.9 6.7
LDR (%) 90.4 93.8 92.9 92.4 93.7
LFR (%) 88.4 92.4 90.2 88.7 90.3
RRR (%) 8.6 8.4 7.0 7.0 7.0
CAR (%) 17.3 20.1 20.7 21.1 21.5
Asset/Equity (x) 8.3 6.5 6.3 6.2 6.0
Gross NPL (%) 2.0 2.4 2.7 2.7 2.6
Loan Loss Coverage (%) 87.9 90.7 93.7 91.7 93.9
Cost of credit (%) 0.3 0.9 0.5 0.3 0.3
Interim Result (IDRbn)
3Q15 4Q15 1Q16 2Q16 3Q16
Total Loans 126,995 128,695 127,479 135,620 132,819
Total Deposit 129,160 128,316 127,923 134,213 133,835
Total Asset 182,234 183,121 183,446 192,111 195,016
Net Interest Income 1,733 1,842 1,854 1,965 2,007
Net revenue 1,964 2,359 2,270 2,524 2,414
Operating profit 235 738 760 682 793
Net Profit 160 259 574 525 610
Capital History
Date
29-Dec-82 IPO @ 3,475
16-Jul-09 Warrant conversion

MARKET OUTLOOK PT Trimegah Securities Tbk - www.trimegah.com 42
Investment thesis:
NPL was worse than expected, but already priced-in
BJTM continued to report rising NPL to ~4.9% as of 9M16 as it has
seen deteriorating commercial and SME loans. At the same time, the
company needs to raise its coverage ratio to maintain prudency,
therefore leading to potential worsening earnings momentum in the
coming quarters. We therefore raise our NPL and provisioning esti-
mates accordingly to align with their quarterly trends. As the result,
BJTM’s ROE is expected to hover at around 15% for 2016-18F. How-
ever, we view such risks are already priced-in by the market.
BJTM’s selling point for now: its high dividend yield
Despite moderating fundamental, BJTM remains an attractive invest-
ment choice for those who seek for dividends. We forecast 8.9%
dividend yield in 2017F, higher than 10-yr govt bond yield of ~7%.
It is logical to assume higher dividend amount each year as along
with the increasing East Java Municipal’s budget.
Valuation: 2017F TP IDR420 (prev: IDR500). Downgrade to Sell.
The TP is derived by using Gordon Growth Model under the assumptions
of 13.7% sustainable ROE, 5% long-term growth rate, 14.8% cost of
equity, and 8% risk–free rate (prev: 13.3%). Due to negative potential
upside, we therefore downgrade the BJTM’s rating into Sell (prev: Neu-
tral).
Key Investment risks:
Adverse macroeconomic situations which could impact loans, deposit
growth as well as asset quality.
Regulatory risks, e.g., single digit lending rate, etc.
Intervention risks, i.e., any intervention from East Java govt on
BJTM’s business.
Corporate actions that might add another volatility to the share
price.
PT Bank Pembangunan Daerah Jawa
Timur Tbk is a full service bank in
Indonesia based in Surabaya, East
Java.
Share Price Rp505
Sector Bank
Price Target Rp420 (-17%)
Year end Dec 2014 2015 2016F 2017F 2018F
Net Profit (IDRbn) 939 885 997 1,066 1,152
EPS (IDR) 63 59 67 72 78
EPS Growth (%) 13.9 -5.8 13.6 7.0 8.1
DPS (IDR) 41 41 43 44 45
BVPS (IDR) 405 422 449 478 511
P/E (x) 8.0 8.5 7.5 7.0 6.5
P/BV (x) 1.2 1.2 1.1 1.1 1.0
ROE (%) 15.5 14.0 15.0 15.1 15.3
Div Yield (%) 8.0 8.0 8.6 8.7 8.9
BPD Jawa Timur Downgrade to Sell
SELL Rp420
Reuters Code BJTM.JK
Bloomberg Code BJTM.IJ
Issued Shares (m) 14,796
Mkt Cap (IDRbn) 7,472
Avg. Value Daily
3-month (IDRbn)
23.8
52-Wk range (IDR) 720 / 404
Govt of East Java Province 51.46%
Govt of City/Regents 28.54%
Public 20.00%
EPS 16F 17F
Consensus (Rp) 68 77
TRIM vs Cons. (%) -7.4 -11.7
Company Update
Stock Data
Major Shareholders
Consensus
Stock Price & Value
Company Data
0.0
20.0
40.0
60.0
80.0
100.0
120.0
140.0
160.0
180.0
-
100
200
300
400
500
600
700
800
Aug-15 Oct-15 Dec-15 Feb-16 Apr-16 Jun-16
(Rpbn)Avg. 5 Day MA Trading Value (RHS) Price (LHS)

PT Trimegah Securities Tbk - www.trimegah.com MARKET OUTLOOK 43
Income Statement (IDRbn)
Year end Dec 2014 2015 2016F 2017F 2018F
Interest Income 4,084 4,704 5,025 5,549 6,207
Interest
Expense -1,203 -1,580 -1,550 -1,674 -1,899
NII 2,881 3,124 3,474 3,876 4,308
Non Interest
Income 373 339 504 572 672
Operating
Expense -1,399 -1,667 -2,004 -2,409 -2,859
PPOP 1,855 1,796 1,974 2,039 2,122
Loan Loss
Provision -504 -599 -553 -519 -479
Operating Profit 1,351 1,197 1,421 1,521 1,643
Profit
Before Tax 1,376 1,261 1,421 1,521 1,643
Tax Expense -437 -377 -425 -454 -491
Net Profit 939 885 997 1,066 1,152
EPS (Rp) 63 59 67 72 78
EPS Growth
(%) 13.9 -5.8 13.6 7.0 8.1
Dividend
Per Share 41 41 43 44 45
Dividend
Growth (%) 2.2 0.0 6.7 1.0 2.9
Balance Sheet (IDRbn)
Year end Dec 2014 2015 2016F 2017F 2018F
Cash and
CA with BI 1,889 2,112 2,362 2,629 2,956
Interbank
Placement 3,326 3,024 4,129 4,815 5,539
Marketable
Securities 2,811 3,918 4,276 4,803 5,404
Government
Bonds 533 1,584 1,555 1,528 1,474
Loans-net 25,544 27,424 30,067 33,544 37,597
Net Fixed Assets 321 339 356 374 393
Other Assets 3,574 4,403 3,773 4,142 4,556
Total Assets 37,998 42,804 46,519 51,835 57,919
Total Earning
Assets 32,620 36,449 40,547 45,222 50,556
Deposit 30,419 34,411 38,345 43,069 48,467
Borrowings 919 1,471 843 940 1,050
Other Liabilities 617 626 680 758 847
Total Liabilities 31,954 36,508 39,868 44,766 50,364
Total
Shareholder's Equity 6,044 6,295 6,651 7,069 7,555
BVPS (Rp/Share) 405 422 449 478 511
Key Ratio Analysis
Year end Dec 2014 2015 2016F 2017F 2018F
Earning Asset Yield (%) 13.5 13.6 13.1 12.9 13.0
Cost of Funds (%) 4.1 4.7 4.1 4.0 4.1
NIM (%) 6.9 6.9 6.7 6.7 6.7
ROE (%) 15.5 14.0 15.0 15.1 15.3
ROA (%) 2.6 2.2 2.2 2.2 2.1
Cost to Income Ratio (%) 43.0 48.1 50.4 54.2 57.4
Loan Growth (%) 18.6 8.5 9.9 11.4 11.7
Deposit Growth (%) 16.6 13.1 11.4 12.3 12.5
LDR (%) 86.5 83.0 81.9 81.3 80.8
LFR (%) 86.1 82.6 81.4 80.8 80.2
RRR (%) 9.4 9.8 7.0 7.0 7.0
CAR (%) 22.2 21.2 19.8 18.6 17.5
Asset/Equity (x) 6.3 6.8 7.0 7.3 7.7
Gross NPL (%) 3.4 4.3 4.9 4.8 4.6
Loan Loss Coverage (%) 72.3 81.0 74.8 74.3 71.5
Cost of Credit (%) 1.9 2.1 1.8 1.5 1.2
Interim Result (IDRbn)
3Q15 4Q15 1Q16 2Q16 3Q16
Total Loans (gross) 29,236 28,449 28,798 29,276 29,625
Total Deposit 43,754 34,264 41,506 40,302 41,166
Total Asset 52,093 42,804 49,145 48,061 50,155
Net Interest Income 831 720 845 1,137 557
Net revenue 908 892 869 1,229 642
Operating profit 246 277 439 671 642
Net Profit 172 188 313 248 275
Capital History
Date
12-Jul-12 IPO @ IDR430

MARKET OUTLOOK PT Trimegah Securities Tbk - www.trimegah.com 44
Investment thesis:
Rising competition and asset quality risk in SME segment
As BTPN ventures to new iSME segment, we view the company
might face both rising asset quality risk and fierce competition.
Adding with pensioners loan market matures, eroded margins and
credit cost are the apparent risks that BTPN should face in the near
to medium-term.
Earnings to remain soft from continuing investments in BTPN
WoW!
As per company guidance, earnings are likely to remain soft in near-
term since BTPN is focusing on developing BTPN WoW!, an initiative
to improve funding strength. We think BTPN WoW may translate into
better CASA ratio in the next 2-3 years.
Valuation: 2017F TP IDR2,600 (prev: IDR3,000)
The TP is derived from Gordon Growth Methodology (GGM) under the
assumptions of: 11.4% sustainable ROE, 5% long-term growth rate,
12.5% cost of equity (prev: 11.3%), and 8% risk-free rate (prev:
6.8%). Due to negative potential upside, we downgrade BTPN’s rating
into Sell (Prev: Neutral).
Key investment risks:
Higher-than-expected loan growth
Lower-than-expected NPL formations in non-pensioners loans
Softening competition in SME lending market
Market illiquidity
PT Bank Tabungan Pensiunan Nasional
Tbk is a financial institution that special-
izes in funding and lending. It offers
accounts in deposits and savings, pen-
sion loans, SME loans, and other financial
products.
Share Price Rp2,740
Sector Bank
Price Target Rp2,600 (-5%)
Year end Dec 2014 2015 2016F 2017F 2018F
Net Profit (Rpbn) 1,885 1,753 1,820 1,967 2,096
EPS (Rp) 320 291 315 340 362
EPS Growth (%) -12.6 -9.1 8.1 8.1 6.5
DPS (Rp) 0 0 0 0 0
BVPS (Rp) 2,063 2,381 2,697 3,037 3,400
P/E (x) 8.6 9.4 8.7 8.1 7.6
P/BV (x) 1.3 1.2 1.0 0.9 0.8
ROE (%) 15.6 12.6 11.7 11.2 10.7
Div Yield (%) 0.0 0.0 0.0 0.0 0.0
Bank Tabungan Pensiunan Nasional Downgrade to Sell
SELL Rp2,600
Reuters Code BTPN.JK
Bloomberg Code BTPN.IJ
Issued Shares (m) 5,782
Mkt Cap (IDRbn) 15,842
Average Daily T/O 3-
month (IDR bn)
0.5
52-Wk range 3,100 / 2,000
Sumitomo Mitsui Banking Corp 40.0%
Summit Global Capital Man. B.V. 20.0%
TPG Nusantara S.a.r.l 8.4%
Public & Others 31.6%
EPS 16F 17F
Consensus (Rp) 309 356
TRIM vs Cons. (%) 0.6 -5.7
Company Update
Stock Data
Major Shareholders
Consensus
Stock Price
Company Data
0.0
5.0
10.0
15.0
20.0
25.0
30.0
-
500
1,000
1,500
2,000
2,500
3,000
3,500
Nov-15 Feb-16 May-16 Aug-16
(Rpbn)Avg. 5 Day MA Trading Value (RHS) Price (LHS)

PT Trimegah Securities Tbk - www.trimegah.com MARKET OUTLOOK 45
Income Statement (IDRbn)
Year end Dec 2014 2015 2016F 2017F 2018F
Interest Income 12,293 13,004 14,090 15,254 16,457
Interest
Expense -5,252 -5,308 -5,415 -5,817 -6,398
NII 7,041 7,696 8,675 9,437 10,059
Non Interest
Income 740 706 782 940 1,301
Operating
Expense -4,480 -5,156 -5,964 -6,837 -7,812
PPOP 3,300 3,246 3,493 3,540 3,547
Loan Loss
Provision -744 -786 -968 -810 -638
Operating Profit 2,557 2,460 2,525 2,730 2,909
Profit
Before Tax 2,544 2,433 2,526 2,730 2,909
Tax Expense -659 -680 -706 -763 -813
Net Profit 1,885 1,753 1,820 1,967 2,096
EPS (Rp) 320 291 315 340 362
EPS Growth
(%) -12.6 -9.1 8.1 8.1 6.5
Dividend
Per Share 0 0 0 0 0
Dividend
Growth (%) 0.0 0.0 0.0 0.0 0.0
Balance Sheet (IDRbn)
Year end Dec 2014 2015 2016F 2017F 2018F
Cash and
CA with BI 5,758 6,127 5,870 6,653 7,544
Interbank
Placement 6,713 6,209 12,820 18,564 23,574
Marketable
Securities 4,734 4,930 5,284 5,223 5,917
Government
Bonds 0 0 0 0 0
Loans-net 52,101 58,710 63,633 70,226 77,218
Net Fixed Assets 730 876 964 1,060 1,113
Other Assets 4,978 4,187 4,709 4,078 4,627
Total Assets 66,038 71,015 84,115 96,327 109,330
Total Earning
Assets 75,015 81,040 93,280 105,805 119,994
Deposit 51,364 57,475 66,056 74,620 84,533
Borrowings 3,903 2,766 3,217 3,547 3,892
Other Liabilities 7,686 6,875 8,412 10,076 11,911
Total Liabilities 62,954 67,116 77,685 88,243 100,337
Total
Shareholder's Equity 12,061 13,924 15,595 17,562 19,658
BVPS (Rp/Share) 2,063 2,381 2,697 3,037 3,400
Key Ratio Analysis
Year end Dec 2014 2015F 2016F 2017F 2018F
Earning Asset Yield (%) 19.3 19.0 18.2 16.9 16.0
Cost of Funds (%) 8.4 7.8 7.6 7.1 6.9
NIM (%) 11.0 11.2 11.2 10.5 9.8
ROE (%) 15.6 12.6 11.7 11.2 10.7
ROA (%) 2.5 2.2 2.0 1.9 1.7
Cost to Income Ratio (%) 57.6 61.4 63.1 65.9 68.8
Loan Growth (%) 12.6 12.6 8.6 10.2 9.7
Deposit Growth (%) 0.5 11.9 14.9 13.0 13.3
LDR (%) 102.4 103.1 97.4 95.1 92.1
RRR (%) 9.6 8.7 7.0 7.0 7.0
CAR (%) 25.3 23.8 25.3 24.6 24.9
Asset/Equity (x) 6.2 5.8 6.0 6.0 6.1
Gross NPL (%) 0.7 0.7 0.8 0.8 0.6
Loan Loss Coverage (%) 139.1 131.8 132.1 131.6 128.8
Cost of Credit (%) 1.4 1.3 1.5 1.1 0.8
Interim Result (IDRbn)
3Q15 4Q15 1Q16 2Q16 3Q16
Total Loans 57,577 59,262 59,975 62,377 63,327
Total Deposit 59,103 60,273 61,714 65,316 63,880
Total Asset 80,113 81,040 83,552 86,671 86,089
Net Interest Income 1,028 1,995 2,032 2,218 2,266
Net revenue 1,185 2,169 2,205 2,391 2,362
Operating profit 465 552 609 697 697
Net Profit 367 327 429 489 481
Capital History
Date
12-Mar-08 IPO @ 2,850
15-Mar-12 Additional listing without RI

MARKET OUTLOOK PT Trimegah Securities Tbk - www.trimegah.com 46
Share Price Rp1,515
Sector Bank
Price Target Rp1,100(-27%)
Year end Dec 2014 2015 2016F 2017F 2017F
Net Profit (IDRbn) 1,116 1,377 1,551 1,319 1,294
EPS (IDR) 115 142 162 137 135
EPS Growth (%) -18.7 23.4 13.8 -14.9 -1.9
DPS (IDR) 78 72 86 92 96
BVPS (IDR) 726 795 894 939 978
P/E (x) 6.3 5.3 9.4 11.0 11.2
P/BV (x) 1.0 0.9 1.7 1.6 1.5
ROE (%) 15.9 17.9 18.1 14.6 13.8
Div Yield (%) 5.2 4.7 5.7 6.1 6.4
BPD Jawa Barat & Banten Maintain Sell on Valuation, Downside Risks
SELL Rp1,100
Reuters Code BJBR.JK
Bloomberg Code BJBR.IJ
Issued Shares (m) 9,599
Mkt Cap (IDRbn) 14,543
Average Daily T/O 3-
month (IDR bn)
23.1
52-Wk range 1,760 / 700
Government of West Java Province 61.9%
Government of Banten Province 13.1%
Public 25%
EPS 16F 17F
Consensus (Rp) 167 185
TRIM vs Cons. (%) -3.9 -26.5
Company Update
Stock Data
Major Shareholders
Consensus
Stock Price
Company Data
0.0
20.0
40.0
60.0
80.0
100.0
120.0
140.0
160.0
-
500
1,000
1,500
2,000
Nov-15 Mar-16 Jul-16
(Rpbn)Avg. 5 Day MA Trading Value (RHS) Price (LHS)
Investment thesis:
Demanding valuation
BJBR now trades at ~1.5x 2017F PBV, still relatively expensive compare to its historical. We concur high valuation was due to BJBR
having a bulk of recovery income, which we expect it to support earnings growth in the next 2-3 years. This already reflected in its
valuation—last month BJBR even traded at 1.9x book, premium over BMRI. Such valuation portends a derating event since there is a rising asset quality risk at the subsidiary level.
No significant fundamental improvement at the bank-level,
sharia faces rising asset quality risks
Aside from recovering NPLs (which is unsustainable, in our view), there are no changes in BJBR’s business-as-usual activities. At the subsidiary level, sharia NPL rose due to downgrades in commercial loans. This might result in a weaker earnings momentum in the coming quarters as BJBR must restore its consolidated coverage
ratio to >70% to maintain prudency.
Valuation: 2017F TP IDR1,100 (prev: IDR1,300)
Our IDR1,100 target price in 2017F is derived by using Gordon Growth Model under the assumptions of 14.5% sustainable ROE, 5% long-term growth rate, 15% cost of equity (prev: 13.8%), 8% risk–free rate
(prev: 6.8%), and IDR2.2trn unsustainable recovery income.
Risks to our call
Slower-than-expected NPL recoveries.
Adverse macroeconomic situations which could impact loans, de-
posit growth as well as asset quality
Regulatory risks, e.g., single digit lending rate, etc
Corporate actions (e.g., rights issue, buying an insurance company,
etc) might add another risk to the share price.
Intervention risks, i.e., any intervention from West Java govt on
BJBR’s business.
BPD Jawa Barat & Banten is a bank
headquartered in Bandung, West
Java. The bank offers commercial
banking products.
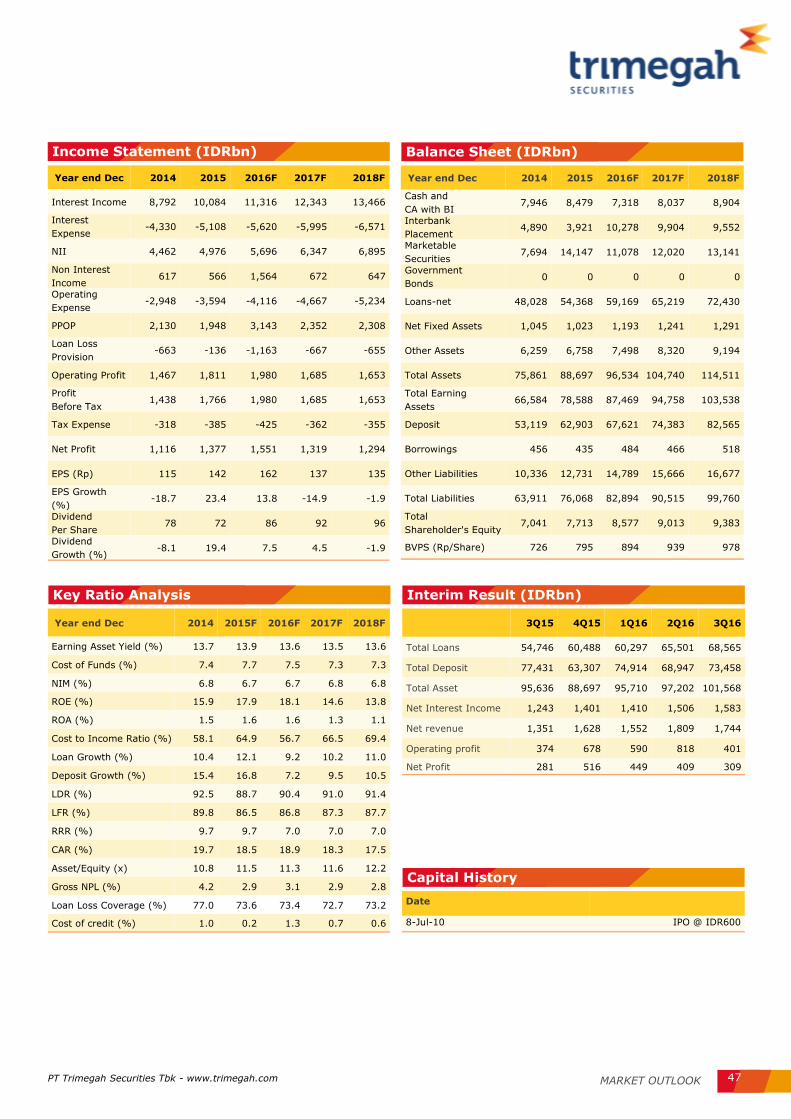
PT Trimegah Securities Tbk - www.trimegah.com MARKET OUTLOOK 47
Income Statement (IDRbn)
Year end Dec 2014 2015 2016F 2017F 2018F
Interest Income 8,792 10,084 11,316 12,343 13,466
Interest
Expense -4,330 -5,108 -5,620 -5,995 -6,571
NII 4,462 4,976 5,696 6,347 6,895
Non Interest
Income 617 566 1,564 672 647
Operating
Expense -2,948 -3,594 -4,116 -4,667 -5,234
PPOP 2,130 1,948 3,143 2,352 2,308
Loan Loss
Provision -663 -136 -1,163 -667 -655
Operating Profit 1,467 1,811 1,980 1,685 1,653
Profit
Before Tax 1,438 1,766 1,980 1,685 1,653
Tax Expense -318 -385 -425 -362 -355
Net Profit 1,116 1,377 1,551 1,319 1,294
EPS (Rp) 115 142 162 137 135
EPS Growth
(%) -18.7 23.4 13.8 -14.9 -1.9
Dividend
Per Share 78 72 86 92 96
Dividend
Growth (%) -8.1 19.4 7.5 4.5 -1.9
Balance Sheet (IDRbn)
Year end Dec 2014 2015 2016F 2017F 2018F
Cash and
CA with BI 7,946 8,479 7,318 8,037 8,904
Interbank
Placement 4,890 3,921 10,278 9,904 9,552
Marketable
Securities 7,694 14,147 11,078 12,020 13,141
Government
Bonds 0 0 0 0 0
Loans-net 48,028 54,368 59,169 65,219 72,430
Net Fixed Assets 1,045 1,023 1,193 1,241 1,291
Other Assets 6,259 6,758 7,498 8,320 9,194
Total Assets 75,861 88,697 96,534 104,740 114,511
Total Earning
Assets 66,584 78,588 87,469 94,758 103,538
Deposit 53,119 62,903 67,621 74,383 82,565
Borrowings 456 435 484 466 518
Other Liabilities 10,336 12,731 14,789 15,666 16,677
Total Liabilities 63,911 76,068 82,894 90,515 99,760
Total
Shareholder's Equity 7,041 7,713 8,577 9,013 9,383
BVPS (Rp/Share) 726 795 894 939 978
Key Ratio Analysis
Year end Dec 2014 2015F 2016F 2017F 2018F
Earning Asset Yield (%) 13.7 13.9 13.6 13.5 13.6
Cost of Funds (%) 7.4 7.7 7.5 7.3 7.3
NIM (%) 6.8 6.7 6.7 6.8 6.8
ROE (%) 15.9 17.9 18.1 14.6 13.8
ROA (%) 1.5 1.6 1.6 1.3 1.1
Cost to Income Ratio (%) 58.1 64.9 56.7 66.5 69.4
Loan Growth (%) 10.4 12.1 9.2 10.2 11.0
Deposit Growth (%) 15.4 16.8 7.2 9.5 10.5
LDR (%) 92.5 88.7 90.4 91.0 91.4
LFR (%) 89.8 86.5 86.8 87.3 87.7
RRR (%) 9.7 9.7 7.0 7.0 7.0
CAR (%) 19.7 18.5 18.9 18.3 17.5
Asset/Equity (x) 10.8 11.5 11.3 11.6 12.2
Gross NPL (%) 4.2 2.9 3.1 2.9 2.8
Loan Loss Coverage (%) 77.0 73.6 73.4 72.7 73.2
Cost of credit (%) 1.0 0.2 1.3 0.7 0.6
Interim Result (IDRbn)
3Q15 4Q15 1Q16 2Q16 3Q16
Total Loans 54,746 60,488 60,297 65,501 68,565
Total Deposit 77,431 63,307 74,914 68,947 73,458
Total Asset 95,636 88,697 95,710 97,202 101,568
Net Interest Income 1,243 1,401 1,410 1,506 1,583
Net revenue 1,351 1,628 1,552 1,809 1,744
Operating profit 374 678 590 818 401
Net Profit 281 516 449 409 309
Capital History
Date
8-Jul-10 IPO @ IDR600

MARKET OUTLOOK PT Trimegah Securities Tbk - www.trimegah.com 48
Investment thesis:
Potential NIM squeeze due to SME lending competition and
“single digit lending rates”
Due to shifting in loan mix toward SME from previously mass market
segments, NIM is expected to be at risk from rising competition and
asset quality risks. Several other big banks have implemented <10%
SME lending rate.
ROE depends on how much opex efficiencies the company can
make
BDMN is still undergoing a restructuring process, which we view may
take a while before translating into higher revenue growth. It all
comes down to how much operating efficiencies BDMN can make in
the near to medium-term in order to maintain ROE.
Valuation: 2017F TP IDR2,000 (prev: IDR2,300), reiterate Sell
The TP derived from Gordon Growth Methodology (GGM) under the
assumptions of: 9.8% sustainable ROE, 5% long-term growth rate,
14.8% cost of equity (prev: 13.3%), and 8% risk-free rate (prev:
6.8%).
Key investment risks:
Higher-than-expected loan growth.
Lower-than-expected NPL and special mentions
Potential M&A activity
Illiquidity in the stock market
PT Bank Danamon Indonesia Tbk pro-
vides general banking services. The bank’
s head office is located in Jakarta with
branch offices throughout Indonesia.
Share Price Rp3,290
Sector Bank
Price Target Rp2,000 (-39%)
Year end Dec 2014 2015F 2016F 2017F 2018F
Net Profit (IDRbn) 2,604 2,393 3,286 3,643 4,222
EPS (IDR) 272 250 346 384 445
EPS Growth (%) -35.6 -8.1 38.7 10.9 15.9
DPS (IDR) 127 81 76 104 115
BVPS (IDR) 3,381 3,540 3,847 4,127 4,456
P/E (x) 16.7 12.8 9.5 8.6 7.4
P/BV (x) 1.3 0.9 0.9 0.8 0.7
ROE (%) 8.0 7.1 9.0 9.3 10.0
Div Yield (%) 3.8 2.5 2.3 3.2 3.5
Bank Danamon Remains a Sell at Our Counter
SELL Rp2,000
Reuters Code BDMN.JK
Bloomberg Code BDMN.IJ
Issued Shares (m) 9,489
Mkt Cap (IDRbn) 31,218
Avg. Value Daily
3 month (IDRbn)
9.5
52-Wk range (IDR) 4,220 / 2,665
Asia Financial (Ina)Pte.Ltd. 67.4%
Public 32.6%
EPS 16F 17F
Consensus (Rp) 332 379
TRIM vs Cons. (%) -9.0 -16.9
Company Update
Stock Data
Major Shareholders
Consensus
Stock Price & Value
Company Data
0.0
5.0
10.0
15.0
20.0
25.0
30.0
35.0
-
1,000
2,000
3,000
4,000
5,000
Nov-15 Mar-16 Jul-16
(Rpbn)Avg. 5 Day MA Trading Value (RHS) Price (LHS)

PT Trimegah Securities Tbk - www.trimegah.com MARKET OUTLOOK 49
Income Statement (IDRbn)
Year end Dec 2014 2015F 2016F 2017F 2018F
Interest Income 22,991 22,421 21,301 21,350 21,923
Interest
Expense -9,312 -8,772 -8,218 -8,192 -8,446
NII 13,680 13,648 13,083 13,158 13,477
Non Interest
Income 4,763 4,608 4,696 4,871 5,204
Operating
Expense -10,394 -9,231 -8,892 -8,798 -8,907
PPOP 8,049 9,025 8,887 9,231 9,775
Loan Loss
Provision -3,986 -5,082 -4,404 -4,272 -4,045
Operating Profit 4,063 3,944 4,482 4,959 5,730
Profit
Before Tax 3,554 3,282 4,482 4,959 5,730
Tax Expense -871 -812 -1,121 -1,240 -1,433
Net Profit 2,604 2,393 3,286 3,643 4,222
EPS (Rp) 272 250 346 384 445
EPS Growth
(%) -35.6 -8.1 38.7 10.9 15.9
Dividend
Per Share 127 81 76 104 115
Dividend
Growth (%) 0.7 -35.6 -7.2 37.3 10.9
Balance Sheet (IDRbn)
Year end Dec 2014 2015F 2016F 2017F 2018F
Cash and
CA with BI 13,125 12,239 10,412 10,630 10,958
Interbank
Placement 14,533 21,849 28,880 34,907 39,555
Marketable
Securities 8,888 6,392 6,945 7,104 7,330
Government
Bonds 6,605 6,916 7,068 7,228 7,457
Loans-net 106,77
4 99,483 98,580 99,360 102,455
Net Fixed Assets 2,490 2,559 2,764 2,985 3,224
Other Assets 43,406 38,620 38,961 39,858 40,786
Total Assets 195,82
1
188,05
7
193,61
0
202,07
3 211,764
Total Earning
Assets 30,145 28,010 26,520 27,093 27,794
Deposit 116,49
5
115,14
2
115,76
0
118,40
9 122,174
Borrowings 14,497 13,086 13,662 14,307 15,042
Other Liabilities 32,182 25,615 27,406 29,916 31,979
Total Liabilities 163,17
4
153,84
3
156,82
7
162,63
3 169,195
Total
Shareholder's Equity 32,409 33,932 36,500 39,158 42,286
BVPS (Rp/Share) 3,381 3,540 3,847 4,127 4,456
Key Ratio Analysis
Year end Dec 2014 2015F 2016F 2017F 2018F
Earning Asset Yield (%) 14.2 13.8 13.0 12.5 12.2
Cost of Funds (%) 6.5 6.1 5.9 5.8 5.8
NIM (%) 8.4 8.4 8.0 7.7 7.5
ROE (%) 8.0 7.1 9.0 9.3 10.0
ROA (%) 1.3 1.3 1.7 1.8 2.0
Cost to Income Ratio (%) 56.4 50.6 50.0 48.8 47.7
Loan Growth (%) 3.6 -6.1 -0.8 0.7 2.9
Deposit Growth (%) 6.7 -1.2 0.5 2.3 3.2
LDR (%) 94.1 89.3 88.1 86.8 86.5
LFR (%) 85.3 82.4 81.6 80.5 80.9
RRR (%) 8.8 8.3 7.0 7.0 7.0
CAR (%) 17.9 17.9 20.0 20.6 20.0
Asset/Equity (x) 6.0 5.5 5.3 5.2 5.0
Gross NPL (%) 2.4 3.3 3.3 3.2 2.9
Loan Loss Coverage (%) 104.4 99.4 101.1 104.2 106.5
Cost of Credit (%) 3.6 4.9 4.3 4.2 3.8
Interim Result (IDRbn)
3Q15 4Q15 1Q16 2Q16 3Q16
Total Loans (gross) 103,232 129,367 125,846 124,922 121,596
Total Deposit 114,053 116,776 111,088 104,461 102,200
Total Asset 196,012 188,057 179,334 174,859 174,686
Net Interest Income 3,592 3,455 3,394 3,408 3,445
Net revenue 4,550 4,742 4,361 4,677 4,573
Operating profit 897 1,289 1,107 1,268 1,066
Net Profit 690 498 814 921 782
Capital History
Date
6-Dec-89 IPO @ Rp. 12.000
7-Sep-11 Additional Share HMETD

PT Trimegah Securities Tbk - www.trimegah.com MARKET OUTLOOK 50
Automotive Sector

MARKET OUTLOOK PT Trimegah Securities Tbk - www.trimegah.com 51
Channel check findings: recovery on all level is confirmed
We believe auto recovery is confirmed for all auto-related sectors (auto
financing, rental, distribution and spare parts). We had recent visits to
Astra Otoparts (AUTO IJ), Assa Rent (ASSA IJ) and BFI Finance (BFIN IJ).
These players are in the OEM components, auto rental and financing
sectors. All of them confirmed that revenue and net profit growth is clear-
ly visible for 2017 deriving from auto recovery on sales volume, healthy
margins and decline in cost of funds. Capex growth is a mixed bag (2017
AUTO capex decline, ASSA capex grow and BFIN relatively flat) as the
auto industry chain still face overcapacity challenge from over expansion
in the auto boom period back in 2010-12.
Competition remains but relatively healthier
We believe 4W manufacturing companies are aware of the competition
coming from 2 key brands mid 2017 which are Mitsubishi XM (7-seater
MPV) and China’s Wuling (MPV brand selling at very cheap price). This
should set a well-balanced expectation of supply/demand for next year
and would keep inventory at a minimum level from wholesales to dealers.
This also implies no massive 4W price discounts in 2017 in our view.
Commodity rally should have a positive impact to 4W/2W sector
Coal price rallied by ~+100% YTD, CPO +18% YTD, Nickel +28% YTD,
Tin +40% YTD. We see small scale coal miners ramping up production
over the past 1 month. This should improve the economy of mining-
related areas such as Kalimantan & Sumatra and would indirectly have a
positive impact to auto demand especially for the 2W sector in our view.
ASII has a well-balanced mix of growth
We remain positive for ASII’s 2017 outlook due to lower interest rate,
tamed inflation and positive effect from commodity recovery. For ASII’s
auto business, we believe ASII is able to sustain overall 4W margins
despite the flood in cheap LCGCs due to higher ASP hike for the premium
cars. We also expect ASII would book 2W ASP growth several years
ahead due to the 2W market trend for larger exposure of premium scoot-
ers. We have a BUY for ASII with TP of IDR9,200. We also provide sever-
al small cap options worthwhile to consider for long-term investments
such as MPMX and NIPS given both have attractive earnings growth and
valuations are undemanding. MPMX is a business restructuring play via
enhanced cost efficiencies, business optimization and synergies. Whereas
NIPS is suitable for investors seeking for strong business growth.
Automotive Sector A Well-Balanced Growth Mix
Willinoy Sitorus
Sandro Sirait
Overweight
Ticker Price
Market cap
TP Ups. Call EPS growth
(%) P/E (x) EV/EBITDA (x) P/BV (x) ROAE (%)
(IDR) (IDR bn) (ID) (%) 2016 2017 2016 2017 2016 2017 2016 2017 2016 2017
ASII 7,825 316,784 9,200 17.6 BUY 14.1 24.4 19.2 15.4 12.2 10.6 2.8 2.6 15.5 17.4
MPMX 810 3,615 950 17.3 BUY 8.1 20.8 11.7 9.7 7.6 6.6 0.6 0.6 6.5 7.4
NIPS 470 769 570 21.3 BUY 79.0 58.7 12.7 8.0 8.0 6.1 1.0 0.9 7.9 11.2

PT Trimegah Securities Tbk - www.trimegah.com MARKET OUTLOOK 52
Figure 35. Domestic 4W sales volume and growth, 2013-18F
Source: Gaikindo, Trimegah research
1,230 1,2081,013 1,078
1,1861,286
10.2%
-1.8%
-16.1%
6.4%
10.0%8.5%
-20.0%
-15.0%
-10.0%
-5.0%
0.0%
5.0%
10.0%
15.0%
0
500
1,000
1,500
2,000
2,500
2013 2014 2015 2016F 2017F 2018F
Domestic 4W sales volume
Domestic 4W sales volume growth (RHS)
('000 units)Expect 4W industry sales
volume to book 7.7%
CAGR from 2015 to 2018
Source: CEIC, Trimegah research
Figure 36. 2W penetration rate is a relatively
mature market as compared to 4W
Figure 37. 4W penetration rate is relatively
less mature market compared to 2W
Source: CEIC, Trimegah research
61.168.8
76.484.7
93.099.7
26%28%
31%34%
37%39%
0%
5%
10%
15%
20%
25%
30%
35%
40%
45%
0
20
40
60
80
100
120
140
2010 2011 2012 2013 2014 2015
Registered 2W 2W penetration rate (RHS)
(m units)
8.9 9.510.4
11.512.6
13.43.7%
3.9%4.3%
4.6%
5.0%5.3%
1.0%
1.5%
2.0%
2.5%
3.0%
3.5%
4.0%
4.5%
5.0%
5.5%
0
2
4
6
8
10
12
14
16
18
20
2010 2011 2012 2013 2014 2015
Registered 4W 4W penetration rate (RHS)
(m units)
Figure 38. 4W and 2W YoY growth diver- Figure 39. 2W:4W sales volume ratio
9%
-7%
-30%
-25%
-20%
-15%
-10%
-5%
0%
5%
10%
15%
4W domestic sales vol. growth
2W domestic sales vol. growth
6.4
6.1 6.1 6.0
7.1
6.4
6.6
5.7
6.5
6.9
6.7
5.65.5
5.3
5.6
5.9
6.2
6.5
6.8
7.1
2W:4W ratio
Source: AISI, Trimegah research Source: Gaikindo, Trimegah research

PT Trimegah Securities Tbk - www.trimegah.com MARKET OUTLOOK 53
Figure 40. GDP growth and 4W/2W growth Figure 41. Inflation and 4W/2W growth
Source: Gaikindo, AISI, BPS Source: Gaikindo, AISI, BPS
4.5%
4.8%
5.0%
5.3%
5.5%
5.8%
-30.0%
-25.0%
-20.0%
-15.0%
-10.0%
-5.0%
0.0%
5.0%
10.0%
15.0%
Jun-13
Aug-13
Oct-
13
Dec-13
Feb-14
Apr-
14
Jun-14
Aug-14
Oct-
14
Dec-14
Feb-15
Apr-
15
Jun-15
Aug-15
Oct-
15
Dec-15
Feb-16
Apr-
16
Jun-16
4W growth 2W growth GDP growth (RHS)
3.0%
4.0%
5.0%
6.0%
7.0%
8.0%
9.0%
-30.0%
-25.0%
-20.0%
-15.0%
-10.0%
-5.0%
0.0%
5.0%
10.0%
15.0%
Jun-13
Aug-13
Oct-
13
Dec-13
Feb-14
Apr-14
Jun-14
Aug-14
Oct-
14
Dec-14
Feb-15
Apr-15
Jun-15
Aug-15
Oct-
15
Dec-15
Feb-16
Apr-16
Jun-16
4W growth 2W growth Inflation, YoY (RHS)
Source: Gaikindo, Trimegah research
24,724
8,446
2,774
-23,330
25,067
-26,421
6,020
-22,797
5,061
-1,987
1,218
-30,000
-20,000
-10,000
0
10,000
20,000
30,000
1Q142Q143Q144Q141Q152Q153Q154Q151Q162Q16 Jul' -Aug'
16
WS - RS
(units) Massive price
discounts
Price
discounts
Massive price
discounts
The 4W industry has
relative healthy in-
ventory level over the
past 3 quarters given
narrower gap be-
tween wholesales and
retail/dealer sales
level
Figure 42. Quarterly residual of wholesales to retail/dealer

MARKET OUTLOOK PT Trimegah Securities Tbk - www.trimegah.com 54
Well positioned from the 4W industry’s growth mix
We see that ASII is poised to benefit from the 4W industry’s rise in LCGC
and rise in high-end/luxury cars (> IDR400m/unit). We believe ASII’s
LCGCs such as Toyota Calya/Daihatsu Sigra would be a backbone of
ASII’s 4W volume growth (LCGC contributes 23% of ASII’s 8M16 sales
volume) and ASII’s high-end/luxury cars such as Toyota Fortuner, Al-
phard and BMW (7% of 8M16 sales volume) would help reduce any over-
all value distortions on ASII’s top line and 4W margins. Over the past 3-
years, ASII’s largest threat has been Honda. Now, we do not expect this
market share war going on with Honda to linger given Honda’s current
limited production capacity (running >90% utilisation rate). Given indus-
try’s utilization improvements and a healthy economic expectations, we
do not expect any over pile 4W inventories at dealer level that would give
any severe price discounts in the next 2 years at least.
We expect ASII to reap good 2W returns despite mature industry
2015-18 2W industry sales may just book a mere ~3% CAGR sales, yet
we expect Astra’s dominancy in the 2W market to linger. Astra’s (Honda
brand) 2W market share rose from only 53% 5 years ago back in 2011 to
72% in 8M16 gradually eating Yamaha, Suzuki and Kawasaki’s market
share. In 2017-18, we expect ASII to maintain its market share in the
scooter segment at around ~78% level albeit higher price/unit sales mix
driven by the soon-to-be-launched completely knock-down (CKD) premi-
um scooter, PCX 150 (currently overpriced at ~IDR39m/unit but price is
expected to decline as soon as the CKD version is released to compete
with the popular Yamaha NMAX). Also we expect ASII’s rising market
share in the sports bike segment to continue knowing that the launch of
Honda CBR150R in 1H16 was well accepted in the market bringing ASII’s
sports bike market share to 45% in 1H16 vs 34% in 2015.
Maintain our earnings and TP
We like ASII due to its position as a bellwether to the market, beneficiary
of low interest rate environment, visible earnings recovery and is poised
to benefit from the long-term auto growth dynamics. We maintain our
current earnings and SOTP based TP of IDR9,200. ASII is currently trad-
ing at 15.4x 2017 P/E.
Astra International Well Positioned For Growth
BUY Rp9,200
Reuters Code MPPA.JK
Bloomberg Code MPPA.IJ
Issued Shares (m) 5,378
Mkt Cap (Rpbn) 15,973
Average Daily Trading
Value
USD 9.3mn
52-Wk range Rp3,500 / Rp1,720
Jardine Cycle & Carriage Ltd 50.11%
Public 49.9%
Company Update
Stock Data
Major Shareholders
Stock Price Companies Data
Willinoy Sitorus
Astra International (ASII) is the top 5 JCI largest company by market cap. Through its subsidiaries, ASII operates in the automotive, heavy equipment, financial, plantation and infrastructure sector.
Share Price Rp7,825
Sector Automotive
Price Target Rp9,200 (18%)
Reuters Code ASII.JK
Bloomberg Code ASII.IJ
Issued Shares 40,484
Mkt Cap. (Rpbn) 316,784
Avg. Value Daily 6
Month (Rpbn)
289.6
52-Wk range 8875 / 5700
Year end Dec 2014 2015 2016F 2017F 2018F
Revenue (IDRbn) 201,701 184,196 198,801 225,061 258,530
Net Profit (IDRbn) 19,191 14,464 16,500 20,530 23,660
EPS Growth (%) -1.2 -24.6 14.1 24.4 15.2
Core profit (IDRbn) 18,783 16,209 14,681 17,887 20,209
Core EPS Growth (%) 8.5 -13.7 -9.4 21.8 13.0
P/E (x) 16.5 21.9 19.2 15.4 13.4
P/BV (x) 3.3 3.1 2.8 2.6 2.3
Div. Yield (%) 2.8 3.0 2.2 2.6 3.2
EV/EBITDA 13.3 12.8 12.2 10.6 9.5
Consensus
Core EPS 16E 17E
Consensus (Rp) 396 467
TRIM vs. Cons. (%) 3.0% 8.5%
0.0
100.0
200.0
300.0
400.0
500.0
600.0
0
1000
2000
3000
4000
5000
6000
7000
8000
9000
10000
Nov-15 Jan-16 Mar-16 May-16 Jul-16 Sep-16 Nov-16
(Rpbn)Avg. 5 Day MA Trading Value (RHS)Series1

PT Trimegah Securities Tbk - www.trimegah.com MARKET OUTLOOK 55
Income Statement (IDRbn) Balance Sheet (IDRbn)
Cash Flow (IDRbn)
Interim results
Year end Dec 2014 2015 2016F 2017F 2018F
Revenue 201,701 184,196 198,801 225,061 258,530
Revenue growth 4.0% -8.7% 7.9% 13.2% 14.9%
Gross Profit 38,809 36,710 37,053 43,276 48,697
Opr. Profit 20,163 17,212 16,845 20,018 22,678
EBITDA 27,588 28,107 28,480 32,460 35,727
EBITDA growth 11.8% 1.9% 1.3% 14.0% 10.1%
Net int. inc./(exp) 151 145 87 137 204
Gain/(loss) Forex -126 -291 -511 -13 -14
Assoc. earnings 6,245 4,467 4,356 5,543 5,946
Other inc./(exp.) 625 -1,903 2,829 3,386 4,396
Pre-tax profit 27,058 19,630 23,606 29,070 33,210
Pre-tax growth -1.7% -27.5% 20.3% 23.1% 14.2%
Tax 4,927 4,017 5,085 6,288 7,058
Minority Int. 2,940 1,149 2,021 2,253 2,492
Extra. items 0 0 0 0 0
Net profit 19,191 14,464 16,500 20,530 23,660
Net profit growth -1.2% -24.6% 14.1% 24.4% 15.2%
Year end Dec 2014 2015 2016F 2017F 2018F
Cash 20,902 27,102 13,493 17,060 22,500
Receivables - net 54,759 53,005 53,974 61,103 70,190
Inventory 16,986 18,337 16,849 18,936 21,858
Other curr asset 4,594 6,717 6,717 6,717 6,717
Current assets 97,241 105,161 91,032 103,817 121,264
Net fixed asset 61,336 58,545 56,810 55,268 50,120
Other non curr.
asset 77,450 81,729 83,385 90,135 98,214
Non-current as-
sets 138,786 140,274 140,194 145,403 148,334
Total asset 236,027 245,435 231,227 249,220 269,598
ST debt 37,421 36,202 10,000 10,000 10,000
Other curr. liab. 36,820 40,040 38,291 40,621 43,882
Current liabilities 74,241 76,242 48,291 50,621 53,882
LT debt 32,651 34,447 34,447 34,447 34,447
Other LT Liab 8,948 8,213 8,213 8,213 8,213
Non-curr. liabili-
ties 41,599 42,660 42,660 42,660 42,660
Total liabilities 115,840 118,902 90,951 93,281 96,542
Minority interest 24,693 24,490 28,820 32,038 35,555
Sh. equity 95,494 102,043 111,456 123,901 137,501
Total liab. & equity 236,027 245,435 231,227 249,220 269,598
Year end Dec 2014 2015 2016F 2017F 2018F
Net profit 19,191 14,464 16,500 20,530 23,660
Depr. / amort. 7,425 10,895 11,635 12,442 13,049
Chg in working cap -3,460 1,500 -1,230 -6,887 -8,747
Others -8,193 -569 652 -4,305 -5,487
CF operations 14,963 26,290 27,557 21,780 22,475
Capex -9,917 -8,104 -9,900 -10,900 -7,900
Others 353 563 -2,307 -2,446 -2,592
CF investing -9,564 -7,541 -12,207 -13,346 -10,492
Net change in debt 5,675 577 -26,202 0 0
Equity raised 17,697 0 0 0 0
Dividends -8,739 -9,404 -7,087 -8,085 -10,060
Others -18,678 -4,580 4,300 3,218 3,517
CF financing -4,045 -13,407 -
28,989 -4,867 -6,543
Net cash flow 1,354 5,342 -
13,639 3,568 5,439
Others 994 1,032 61 0 0
Cash at BoY 18,555 20,728 27,072 13,493 17,060
Cash at EoY 20,902 27,102 13,493 17,060 22,500
Year end Dec 2Q15 3Q15 4Q15 1Q16 2Q16
Sales 47,318 45,672 46,019 41,887 46,321
Gross Profit 9,357 9,345 9,447 7,973 8,874
Opr. Profit 4,953 5,260 5,827 3,855 4,619
Net profit 4,060 3,945 2,467 3,112 4,004
Gross Margins (%) 19.8% 20.5% 20.5% 19.0% 19.2%
Op. Margins (%) 10.5% 11.5% 12.7% 9.2% 10.0%
Net Margins (%) 8.6% 8.6% 5.4% 7.4% 8.6%
Year end Dec 2014 2015 2016F 2017F 2018F
Profitability
Gross Margin (%) 19.2 19.9 18.6 19.2 18.8
Opr Margin (%) 10.0 9.3 8.5 8.9 8.8
EBITDA Margin (%) 13.7 15.3 14.3 14.4 13.8
Net Margin (%) 9.5 7.9 8.3 9.1 9.2
ROAE (%) 21.4 14.6 15.5 17.4 18.1
ROAA (%) 8.5 6.0 6.9 8.5 9.1
Stability
Current ratio (x) 1.3 1.4 1.9 2.1 2.3
Net Debt to Equity
(x) 0.5 0.4 0.3 0.2 0.2
Net Debt to EBITDA
(x) 1.8 1.5 1.1 0.8 0.6
Interest Coverage
(x) 14.7 12.6 12.0 15.0 17.3
Efficiency
Receivables (days) 37 39 36 36 36
Inventory (days) 35 44 40 36 35
A/P (days) 40 49 44 40 40
Key Ratio Analysis
Capital History
Date
4-Apr-90 IPO price @ IDR14,850
16-Dec-93 1:5 rights @ IDR13,850
5-Jun-12 1:10 stock split

MARKET OUTLOOK PT Trimegah Securities Tbk - www.trimegah.com 56
Auto battery spin off should provide better focus
Back in Jun’ 16, NIPS did a spin-off for its auto-battery under the name,
PT. Nipress Energi Otomotif as a separate division from its industrial
battery. This would allow higher-focus (both auto & industrial batteries
have different business structure model) as to maximize battery produc-
tion capacity which is currently running at ~40% utilization rate. The spin
-off is NIPS’ fresh start in boosting long-term market share to 40% in the
auto industry from current 18%. Note GS Yuasa (competitor) currently
holds 70% market share. With its collaboration with Johnson Control
(world’s largest battery producer with 33% market share), NIPS is confi-
dent that its NS maintenance-free battery product (launched in 3Q15)
would become a success as it is the only auto-battery product providing
18 months guarantee with accessible guarantee claims across Indonesia.
Light capex post-industrial battery capacity expansion
Due to sluggish industrial battery demand (1H16 industrial battery sales
volume only reached 64.9k units, down 41.9% YoY), NIPS decides to
temporarily halt its new additional 344k industrial battery plant opera-
tions (the plant is already completed and just need a bit of light capex to
kick-start). We expect the new industrial battery plant to start operating
by 4Q16 before seeing strong 2017 revenue growth from this segment in
2017 and higher margins (industrial battery have ~3%-5% higher gross
margin compared to auto battery). We expect NIPS 2016-18 capex to be
light after NIPS’ hefty ~IDR400bn capex over the past 2 years (2014-
15). Hence, we expect a strengthening balance sheet as net debt equity
would drop from 1.0x in 2015 to 0.52x in 2017.
BUY with TP of IDR570
We use a DCF-based TP with 11.6% WACC and 2% terminal growth rate.
NIPS is currently trading at 7.8x/6.3x 2017-18 P/E. Key earnings growth
for 2017 (+58.7% YoY) is the increase in industrial battery sales which
have higher margin mix.
Nipress Valuably Cheap
BUY Rp570
Reuters Code MPPA.JK
Bloomberg Code MPPA.IJ
Issued Shares (m) 5,378
Mkt Cap (Rpbn) 15,973
Average Daily Trading
Value
USD 9.3mn
52-Wk range Rp3,500 / Rp1,720
PT Trinitan International 26.43%
PT RDPT Nikko Indonesia 16.82%
PT. Tritan Adhitama Nugraha 16.34%
Ferry Joedianto R. Tandiono 5.33%
Public 35.1%
Company Update
Stock Data
Major Shareholders
Stock Price
Companies Data
Willinoy Sitorus
Nipress manufactures auto (4W and 2W) and industrial batteries. The company distributes its product domestically and internationally, indcluding Europe, Asia, Middle East, Africa, and South America.
Share Price Rp470
Sector Automotive
Price Target Rp570 (21%)
Reuters Code NIPS.JK
Bloomberg Code NIPS.IJ
Issued Shares 1,635
Mkt Cap. (Rpbn) 769
Avg. Value Daily 6
Month (Rpbn)
0.0
52-Wk range 610 / 380
Year end Dec 2014 2015 2016F 2017F 2018F
Sales (Rpbn) 1,016 988 1,251 1,516 1,759 Net Profit (Rpbn) 50 31 60 96 120 Core Profit (Rpbn) 69 69 70 127 160 EPS (Rp) 33 21 37 59 73 Core EPS (Rp) 47 46 43 78 98 EPS Growth (28.9) (38.3) 79.0 58.7 25.3
BVPS (Rp) 392 410 465 522 589 P/E (x) 14.0 22.8 12.7 8.0 6.4 Core P/E (x) 10.1 10.2 10.9 6.0 4.8 P/BV (x) 1.2 1.1 1.0 0.9 0.8 EV/ EBITDA (x) 7.7 11.4 8.0 6.1 5.1
Consensus
Core EPS 16E 17E
Consensus (Rp) na na
TRIM vs. Cons. (%) na na
0.0
0.1
0.1
0.2
0.2
0.3
0.3
0.4
0.4
0.5
0
100
200
300
400
500
600
700
Nov-15 Jan-16 Mar-16 May-16 Jul-16 Sep-16 Nov-16
(Rpbn)Avg. 5 Day MA Trading Value (RHS)Series1

PT Trimegah Securities Tbk - www.trimegah.com MARKET OUTLOOK 57
Income Statement (IDRbn) Balance Sheet (IDRbn)
Cash Flow (IDRbn)
Interim results
Year end Dec 2014 2015 2016F 2017F 2018F
Revenue 1,016 988 1,251 1,516 1,759
% growth 11.5 (2.8) 26.6 21.2 16.0
Gross Profit 181 183 207 274 318
Opr Profit 105 85 130 168 195
EBITDA 128 112 159 199 227
% growth 38.2 (12.5) 41.2 25.6 14.1
Int inc/(exp) -37 -43 -49 -40 -35
Other inc/(exp) -37 -43 -49 -40 -35
Pre-tax Profit 67 42 81 128 160
Tax -18 -11 -20 -32 -40
Minority Int. 0 0 0 0 0
Extra. Items 0 0 0 0 0
Net Profit 50 31 60 96 120
% growth 46.9 (38.3) 96.9 58.7 25.3
Year end Dec 2014 2015 2016F 2017F 2018F
Cash and Deposits 33 40 28 19 7
Other Curr. Assets 638 661 698 873 1,013
Net Fixed Assets 530 836 842 849 850
Other Assets 5 10 10 10 10
Total Assets 1,207 1,548 1,579 1,752 1,880
ST Debt 299 429 390 351 316
Other Current Liab 220 241 140 223 219
LT Debt 17 194 144 114 84
Other LT Liabs 70 61 61 61 61
Minority Interest 0 0 1 1 1
Total Liabilities 625 939 749 763 694
SH. Equity 582 609 760 853 963
Net Debt/(cash) 283 583 506 446 393
Net Working Capital 152 32 196 318 485
Year end Dec 2014 2015 2016F 2017F 2018F
EBIT 105 85 130 168 195
Depr/Amort 23 28 29 31 32
Chg in Working
Capital 52 -2 -137 -92 -144
Others -198 -248 0 0 0
CF's from oprs -18 -138 21 107 83
Capex -185 -256 -35 -50 -40
Others 0 203 0 0 0
CF's from investing -185 -53 -35 -50 -40
Net change in debt -144 307 -89 -69 -65
Others 366 -101 91 3 10
CF's from financing 222 206 2 -66 -56
Net cash flow 19 14 -12 -9 -12
Cash at BoY 7 33 40 28 19
Cash at EoY 33 40 28 19 7
2Q15 3Q15 4Q15 1Q16 2Q16
Sales 217 259 241 280 231
Gross Profit 36 48 51 48 37
Operating Profit 22 30 26 30 22
Net Profit 7 -26 35 20 8
Gross Mar. (%) 16.5 18.7 21.3 17.0 15.8
Opr Margins (%) 10.1 11.7 10.9 10.7 9.7
Net Margins (%) 3.3 (9.9) 14.4 7.1 3.6
Year end Dec 2014 2015 2016F 2017F 2018F
Profitability
Gross Margins (%) 17.8 18.5 16.6 18.1 18.1
Op Margins (%) 10.3 8.6 10.4 11.1 11.1
EBITDA Margins (%) 12.6 11.4 12.7 13.1 12.9
Net Margins (%) 4.9 3.1 4.8 6.3 6.8
ROE (%) 8.5 5.0 7.9 11.2 12.5
ROA (%) 4.1 2.0 3.8 5.5 6.4
Stability
Current ratio (x) 1.3 1.0 1.4 1.6 1.9
Net Debt/Equity (x) 0.49 0.96 0.67 0.52 0.41
Int Coverage (x) 2.8 2.0 2.6 4.2 5.6
Efficiency
A/P days 92 106 46 63 54
A/R days 116 118 100 107 108
Inventory days 98 112 90 95 97
Key Ratio Analysis
Capital History
Date
Jul’ 91 IPO @ IDR5,000
Jan’ 14 Rights issue @ IDR300

MARKET OUTLOOK PT Trimegah Securities Tbk - www.trimegah.com 58
Low hanging-fruit business synergies
We expect MPMX would cross-sell its auto financing business to its 2W
distribution customers in East Java (market share of more than 75%
there). It is worth noting that its 2W distribution only use ~1% of MPM
Finance for customers purchasing 2Ws via installments. With Synergy
with an online transportation company, MPM Rental segment would be
able to fully utilize idle cars in the pool ensuring maximum 4W asset
deployment.
Unlock value from divestment of its financing business
Should MPM Finance is being divested (most probably in 1H17), this
would de-leverage MPMX consolidated balance sheet position to be below
1x and would also reduce the cost of funds for MPMX’s other business
segments.
Numerous cost efficiency attempts
Since the beginning of this year, MPMX has been implementing an auto-
matic write-off for its financing business shown from increasing provision
expense (+40% YoY in 1H16). The system ensures that YTD2016 new
financing loans of IDR2.8trn (out of total IDR4.8trn loan outstanding) is
healthy and would gradually reduce provision expenses going forward.
Furthermore, MPMX new blending factory (expected to commence in
2H17) would reduce dependency on MPMX’s expensive blending out-
source facilities going forward. Lastly, MPMX plans to have its own 2W
warehouse to reduce any major rental expenses. The new warehouse is
expected to be completed by 2Q17.
BUY with TP of IDR950
In calculating our SOP based TP, we use DCF-based approach for MPMX's
non-financing segments (auto distribution, oil lubricant, car rental, insur-
ance) and use 0.39x 2017 P/BV target for MPM Finance (53% discount to
peers' 1-year trailing P/BV). MPMX is currently trading at 9.6x/8.0x 2016-
2017 P/E with 2016 P/BV of only 0.5x, undemanding in our view.
Mitra Pinasthika Mustika Upside From Business Restructuring
BUY Rp950
Reuters Code MPPA.JK
Bloomberg Code MPPA.IJ
Issued Shares (m) 5,378
Mkt Cap (Rpbn) 15,973
Average Daily Trading
Value
USD 9.3mn
52-Wk range Rp3,500 / Rp1,720
PT Saratoga Investama Sedaya 34.2%
Morning light Investment 15.3%
Nugraha Eka Kencana 14.4%
Claris Investments 6.8%
Public 29.3%
Company Update
Stock Data
Major Shareholders
Stock Price
Companies Data
Sandro H. Sirait
Mitra Pinasthika Mustika is an automotive-related company catering to the 4W/2W distribution segment, auto components (lubricant oil), 4W rental and financing related business.
Share Price Rp815
Sector Automotive
Price Target Rp950 (+17%)
Reuters Code MPMX.JK
Bloomberg Code MPMX.IJ
Issued Shares 4,463
Mkt Cap. (Rpbn) 3,615
Avg. Value Daily 6
Month (Rpbn)
0.9
52-Wk range 810 / 378
Year end Dec 2014 2015 2016F 2017F 2018F
Revenue (IDRbn) 16,076 16,640 17,179 18,235 19,373
Net profit (IDRbn) 487 285 308 372 455
EPS (IDR) 109 64 69 83 102
EPS growth (%) -7.5 -41.5 8.1 20.8 22.2
P/E (x) 7.4 12.7 11.7 9.7 8.0
P/B (x) 0.7 0.7 0.6 0.6 0.6
EV/EBITDA (x) 7.2 8.1 7.6 6.6 5.9
Div. yield (%) 0.0 0.0 0.8 0.9 1.0
Consensus
Core EPS 15E 16E
Consensus (Rp) na na
TRIM vs Cons. (%) - -
0.0
0.5
1.0
1.5
2.0
2.5
3.0
0
100
200
300
400
500
600
700
800
900
Nov-15 Jan-16 Mar-16 May-16 Jul-16 Sep-16 Nov-16
(Rpbn)Avg. 5 Day MA Trading Value (RHS)Series1

PT Trimegah Securities Tbk - www.trimegah.com MARKET OUTLOOK 59
Income Statement (IDRbn) Balance Sheet (IDRbn)
Cash Flow (IDRbn)
Interim results
Key Ratio Analysis
Capital History
Date
29-May-13 IPO @ 1,500
Year end Dec 2014 2015 2016F 2017F 2018F
Revenue 16,076 16,640 17,179 18,235 19,373
Gross profit 2,314 2,299 2,465 2,695 2,914
Opr. profit 868 713 723 825 962
EBITDA 1,275 1,138 1,194 1,312 1,430
Growth (%) 3.3% -10.8% 5.0% 9.9% 9.0%
Net int. inc/(Exp) (174) (216) (181) (169) (161)
Share in NI of associ-
ates 5 4 4 5 5
Pre-tax profit 699 501 546 660 806
Tax 186 194 211 255 311
Minority int. 26 23 27 33 40
Extra. Items 0 0 0 0 0
Reported net profit 487 285 308 372 455
Growth (%) -7.5% -41.5% 8.1% 20.8% 22.2%
Year end Dec 2014 2015 2016F 2017F 2018F
Cash and equivalents 1,422 1,484 1,702 2,133 2,427
Other current asset 4,779 4,971 5,518 5,382 5,567
Net fixed asset 3,214 3,351 3,519 3,553 3,606
Other non-curr. asset 4,535 4,675 4,190 4,241 4,300
Total asset 13,950 14,480 14,929 15,308 15,900
ST debt 2,769 2,329 2,377 2,433 2,433
Other curr liab 1,438 1,720 1,762 1,683 1,782
LT debt 4,271 4,825 4,852 4,852 4,852
Other LT liab 212 266 273 280 287
Total liabilities 8,690 9,140 9,263 9,246 9,352
Minority interest 722 749 795 850 918
Shareholders equity 4,539 4,591 4,871 5,212 5,629
Total liab. & equity 13,950 14,480 14,929 15,309 15,900
Year end Dec 2014 2015 2016F 2017F 2018F
Net profit 487 285 308 372 455
Depr / Amort 156 166 273 290 270
Chg in work. cap (474) 48 (216) (230) (67)
Others (559) 397 (290) 286 (19)
CF from op. (390) 896 76 719 639
Capex (727) (303) (441) (324) (324)
Others (276) (262) 485 (51) (59)
CF from investing (1,003) (565) 44 (375) (383)
Net change in debt 1,454 100 75 55 0
Changes in capital 0 0 0 0 0
Others 258 (369) 23 32 38
CF from financing 1,712 (269) 98 87 38
Others 0 0 0 0 0
Net cash flow 319 62 218 431 294
Cash at BoY 1,103 1,422 1,484 1,702 2,133
Cash at EoY 1,422 1,484 1,702 2,133 2,427
Year end Dec 2014 2015 2016F 2017F 2018F
Profitability
Gross margin 14.4% 13.8% 14.4% 14.8% 15.0%
Op. margin 5.4% 4.3% 4.2% 4.5% 5.0%
EBITDA margin 7.9% 6.8% 7.0% 7.2% 7.4%
Net margin 3.0% 1.7% 1.8% 2.0% 2.3%
ROAE 11.2% 6.2% 6.5% 7.4% 8.4%
ROAA 3.9% 2.0% 2.1% 2.5% 2.9%
Stability
Current ratio (x) 1.5 1.6 1.7 1.8 1.9
Net debt/equity (x) 1.1 1.1 1.0 0.8 0.7
Net debt/EBITDA (x) 4.4 4.9 4.6 3.9 3.4
Interest coverage (x) 3.1 2.2 2.8 3.2 3.6
Efficiency
A/R turnover (days) 16 20 20 20 20
Inv. turnover (days) 14 18 21 23 23
A/P turnover (days) 21 25 27 24 22
Year end Dec 2Q15 3Q15 4Q15 1Q16 2Q16
Revenue 4,280 4,008 4,451 4,143 4,739
Gross Profit 597 556 575 601 664
Opr. Profit 213 223 70 167 235
Net profit 117 104 (51) 72 108
Gross Margins (%) 14.0% 13.9% 12.9% 14.5% 14.0%
Opr. Margins (%) 5.0% 5.6% 1.6% 4.0% 5.0%
Net Margins (%) 2.7% 2.6% -1.2% 1.7% 2.3%

PT Trimegah Securities Tbk - www.trimegah.com MARKET OUTLOOK 60
Consumer Sector

MARKET OUTLOOK PT Trimegah Securities Tbk - www.trimegah.com 61
Consumer Sector Shop ‘til you drop!
Companies Data
Higher confidence on consumer purchasing power next year
We believe consumer purchasing power should continue to improve
gradually next year which is in line with the improvement on overall
economic conditions (benign inflation, higher GDP growth, post tax
amnesty, and rising commodity prices). However, we are cautious to-
ward electricity subsidy removal and volatility in exchange rate that
might disrupt overall consumer spending. Despite the mixed signals, we
view some consumer companies still able to outperform their competi-
tors through innovation and better operations.
Trimegah’s proprietary survey: more aggressive spending out-
look post–tax amnesty
Key highlights: 1) More aggressive spending next year (see page 63)
particularly on the intention to purchase property/do renovation as well
on travelling, 2) Majority of the respondents prefer to purchase using
credit card than cash, 3) Disposable incomes will be used for the pur-
chase of groceries, travelling, and fashion apparels, 4) Majority of the
respondents still prefer shopping in specialty stores, followed by depart-
ment stores and online retailers. Additional highlights: Out of our top 10
most preferred fashion brands, 5 are operated under MAPI with Zara
topping the survey.
Our top picks…
We are being more constructive towards discretionary stocks vs. sta-
ples—but, advise investors to look more through bottom-up approach
rather than top-bottom. We like companies that offer to do things better
going forward, and thus have 1) higher sales growth, 2) margin expan-
sion, and 3) undemanding valuation. Hence, our top 3 picks are MAPI
(Buy, TP IDR7,200), RALS (Buy, TP IDR1,900), and GGRM (Buy,
TP IDR82,000). MAPI and RALS both offer transformational strategy
that enables them to boost sales growth going forward coupled with
expanding margin from better inventory turnover and merchandise mix.
GGRM will have a stronger earnings growth in the coming years, in our
view, as they still have room for more upside in price increase—not to
mention their undemanding valuation.
Christy Halim
Kevie Aditya
Patricia Gabriela
Overweight
TICKER
Price
(IDR) Mkt. Cap
TP Ups.
Rec. EPS Growth(%) EV/EBITDA (x) Div. yield (%) PE (x)
28-Nov (IDR bn) (%) 2016 2017 2016 2017 2016 2017 2016 2017 Staples
INDF 7,325 64,317 9,200 25.6 Buy 34.9 19.1 17.5 14.7 6.7 6.6 2.3 3.2
ICBP 8,350 97,377 9,200 10.2 Neutral 24.0 10.3 25.9 23.5 16.6 14.8 1.5 1.9
GGRM 62,775 120,785 82,000 30.6 Buy 3.4 19.0 18.2 15.3 11.6 10.0 4.1 3.9
HMSP 3,870 450,151 4,300 11.1 Buy 17.8 10.1 36.9 33.5 27.5 24.9 2.3 2.7
KLBF 1,400 65,625 1,800 28.6 Buy 14.2 18.8 28.4 23.9 18.7 15.7 1.5 1.8
ROTI 1,455 7,365 1,900 30.6 Buy -1.6 21.6 27.4 22.5 12.7 10.1 0.7 0.9
AISA 1,870 6,019 2,300 23.0 Buy 62.6 25.5 11.6 9.3 6.1 5.4 0.9 1.1
UNVR 40,100 305,963 44,000 9.7 Neutral 11.7 15.3 46.8 40.6 32.5 28.3 2.1 2.5
Retail
RALS 1,145 8,125 1,900 65.9 Buy 35.8 21.7 18.6 15.3 12.3 10.0 2.6 3.4
MAPI 4,870 8,084 7,200 47.8 Buy 468.9 122.5 41.1 18.5 7.6 6.2 0.1 0.3
LPPF 14,250 41,580 20,000 40.4 Buy 17.1 15.5 20.0 17.3 13.9 11.9 3.0 3.5
ERAA 605 1,755 800 32.2 Buy 8.9 17.5 7.1 6.1 7.2 6.3 3.3 4.2
ACES 845 14,492 950 12.4 Buy 10.8 14.3 24.9 21.8 17.2 14.9 2.0 2.5
MPPA 1,700 9,143 1,500 (11.8) Sell -57.7 241.6 111.5 32.6 18.2 11.3 1.9 1.8
Healthcare
MIKA 2,580 37,227 3,000 16.3 Buy 23.9 10.7 53.5 48.3 41.3 36.4 1.0 1.2
SILO 10,400 13,531 10,800 3.8 Neutral 51.2 54.4 112.9 73.1 20.5 16.2 0.1 0.1

PT Trimegah Securities Tbk - www.trimegah.com MARKET OUTLOOK 62
Our story next year...
We are optimistic that consumer purchasing power continue to improve gradually next year—in line with the im-
proving on overall economic conditions. Some factors that we believe will drive consumer purchasing power:
1) Benign inflation.
Our macro economist predicts that inflation will increase slightly to 4.0% in 2017F (vs 3.5% in 2016F). The
increase is still in moderate level, in our view, as the value is still lower than 10-years average at 6.1%.
2) Improvement on real GDP growth.
3Q16 real GDP growth came in at 5.0% YoY, slightly below consensus of 5.1%. While private consumption
growth is reported slightly lower to 5.0% in 3Q16 from 5.1% in 2Q16 on the back of shifting post Lebaran
period, we continue to think private consumption will be the main growth factor to GDP growth on the back
of stable inflation and interest rate. We expect GDP growth to remain at 5.1% in 2017F (pretty much similar
to this year).
3) Post tax amnesty effect.
We view that consumers will have more confident in spending their money post tax amnesty, as they have
less concern on their expenses. Our discussions with Nielsen suggested that prior to tax amnesty, wholesal-
ers/retailers prefer not to stock up excessive inventory to prevent tax officers scrutiny. Post tax amnesty,
however, we expect wholesalers/retailers to have higher confidence on inventory stock up, that would trans-
late to higher sales volume next year.
4) Rising commodity prices.
The recent rise in coal price is expected to significantly boost overall consumption on coal areas, particularly
in Kalimantan and South Sumatera, in our view. Purchasing power has been low in those particular areas in
the past few years and is reflected in retailers’ negative SSSG. However, lately we have been seeing improve-
ments in retailers’ SSSG in those particular areas which are expected to continue to next year—as we expect
small miners to resume their production next year. At the same time, the resilient palm oil and rubber prices
will also support rural household purchasing power.
All of the above factors, we believe, will promote a better story for consumer by next year. Not only staples, we
view that discretionary items will as well benefited on the back of better purchasing power. That being said, com-
panies will have more confidence in adjusting its prices without significantly affecting volumes.
Retailers: Inventory trending down = margin expansion on hand!
Due to bad consumer purchasing power last year, many retailers are stuck with inventory problems—which re-
sulted in massive discounts from the end of last year. This year, as we see inventory stabilizing to retailers’ opti-
mum level, we expect margin to further expand.
Figure 43. Inventory turnover days
143
159
134
128
137135
124
120
125
130
135
140
145
150
155
160
40
60
80
100
120
140
160
180
200
220
240
3M15 6M15 9M15 FY15 3M16 6M16 9M16
Average RALS ACES LPPF MAPI MPPA
Source: TRIM Research

PT Trimegah Securities Tbk - www.trimegah.com MARKET OUTLOOK 63
Trimegah’s proprietary survey: expect an increase in purchasing power next year
We did a survey on consumer’s purchasing power and managed to collect 100 respondents across different areas
including Jakarta, Tangerang, Medan, Surabaya etc. to get a better sense of consumer’s purchasing power.
Some interesting results that we found throughout our survey: 1) Most of our respondents plan to be more ag-
gressive in terms of their spending next year particularly on the intention to purchase property/do renovation as
well on travelling, 2) Majority of the respondents (52% of respondents) are less worried of their credit card bill-
ing as they prefer to purchase using credit card than cash, 3) When they have some extra money, the top three
shopping priority includes groceries (19%), travelling (19%), and fashion apparels (18%), 4) Specialty stores is
still preferred the most by our respondents as a place to shop their fashion apparels.
Figure 44. Survey: Our respondents’ spending pattern
Source: TRIM Research
-
20
40
60
80
100
Buy a
property/do
renovation
Purchase
new/used
vehicle
Purchase
life/health
insurance
Travelling
(overseas)
Purchase new
gadget
Purchase
luxury items
Past 12 months Next 12 months
It is also interesting to note that despite the boom of e-commerce shopping, it is only ranked third (24% of re-
spondents) in terms of shopping location preference—lagging behind specialty stores (34%) and department
stores (27%). This is in-line with what we’ve found on the ground, wherein companies with both online and of-
fline stores mentioned that sales through their e-commerce platforms are still relatively very small. Hence, we
believe fashion retailers like MAPI, LPPF, and RALS will still do well in the near future.
We also see that among the fashion apparels brands, Zara (operated under MAPI IJ) still topped the survey with
31% votes—double the percentage for its closest competitors H&M (16%) and Uniqlo (14%).
Source: TRIM Research
Figure 7. Age range of respondents Figure 45. Survey: Shopping priority
19%
18%
15%
13%
3%
13%
19%
Groceries
Fashion
Smartphones
Electronics
Cigs
Vitamins
Travelling
Figure 46. Survey: Most favored apparel
brands
Source: TRIM Research
4%
18%
9%
4%
3%
4%4%4%
16%
35%
Forever21
H&M
M&S
Mango
Massimo Dutti
Nike
Pull n Bear
The Executive

PT Trimegah Securities Tbk - www.trimegah.com MARKET OUTLOOK 64
Some cost pressure are on the board, but minor impact
Despite of the optimism that remains on the overall consumer purchasing power, we noted some cost pressure
that might affect both companies and consumers. These cost pressure include: 1) The recently announced na-
tional minimum wage (UMR) for next year which, on average, lower than last year’s, 2) The likelihood of electrici-
ty subsidy removal, and 3) Soft commodity prices that started to crawling up.
1) Minimal increase in minimum wage (UMR) next year
Company: The minimal increase of 9.1% on minimum wage will impact salaries and wages expenses on
consumer companies, in a positive way as the increase is lower than last year’s at 11.1%. We see retailers
will be positively impacted the most as huge portion of their salaries and wages expenses are linked to mini-
mum wage.
Consumer: The minimal increase of minimum wage indeed raises concern on the buying power of middle-
lower income customers—and in turn, its effect towards retailers targeting those segment. However, we
note that the rising minimum wage is still 5.1% above the expected inflation, thus we remain opti-
mistic on consumer’s purchasing power next year. Please be reminded that there is also a rise in non-taxable
income, which is positive for middle-lower income customers.
2) Electricity subsidy removal
The government is planning to remove electricity subsidy on households with 900VA, in which around
18.7mn households will be affected by this. We view that this could become one of the risks that can hamper
growth prospects of companies. Note that the removal of this subsidy will cost the household additional of
IDR92,600/month for electricity expenses (from previous billing of IDR75,000/month based on average con-
sumption of 124kWh/month). From the consumer point of view, such significant increase in the amount of
electricity bill that needs to be paid will eventually affect the overall consumer spending power, yet we are
expecting some of it can be offset through the increase in minimum wage.
3) Recovery of soft commodity prices
In addition, we see that some of the soft commodity prices have started crawling up. While this might not
significantly impacting retailers and healthcare companies, we believe consumer staples companies are im-
pacting the most. Even though CPO, sugar, and skim milk prices has started to rise, we have not seen the
impact in 3Q16 yet due to inventories. We view that it will start impacting from 4Q16 onwards which then will
translate into higher costs and could affect overall margins. While this might not be affecting much to the big
consumer names with strong pricing power, the smaller ones though will be more impacted since they need
to bear some of these cost by themselves. At the same time, higher product costs will affect overall consum-
er buying power.
4) Volatility of exchange rate
As some of the consumer companies under our coverage have high exposure towards exchange rate, we be-
lieve a volatility on exchange rate post Trump effect will definitely disrupt their profitability. Though some of
these companies are able to pass on their USD cost, but the question remains: will they be able to pass
100% of their increased cost without affecting consumer demand.

PT Trimegah Securities Tbk - www.trimegah.com MARKET OUTLOOK 65
Our top picks...
We believe consumer’s purchasing power will remain strong across all consumer segments, thus being more con-
structive towards discretionary stocks vs. staples—although not ignoring selected names in staples universe that
deserve re-rating, eg; GGRM. Why discretionary? We are expecting larger room for sales growth and margin ex-
pansion to take place within the discretionary names (thanks to normalized inventory level, see page 62), not to
mention that the latter has been lagging behind the staples names throughout the last few years—thus the unde-
manding valuation.
Nevertheless, we advise investors to look more through bottom-up approach rather than top-bottom—in simple
words, the companies that do things better going forward than they are in the few years back. We also apply the
following categories to choose our top picks: 1) Higher sales growth, 2) Further margin expansion, and 3)
Undemanding valuation, with >30% upside to our TP.
MAPI (BUY, TP IDR7,200, 50% ups.)
Two of MAPI’s main growth engine for next year: 1) Rapid expansion of its F&B division (esp. Starbucks) and 2)
Expansion of Inditex brands (eg; Zara) to Vietnam, in which we expect at least IDR1bn sales per day with only 1
store opened, 3-4x more than Zara Indonesia’ sales. Besides, we also see margin improvements on the back of
1) Inventory getting back to optimum level of ~160 days, means less discounting and 2) Disposal of non-
performing brands (eg; Burger King, Domino’s Pizza), and 3) Lowered interest expenses from deals with CVC and
GA.
RALS (BUY, TP IDR1,900, 58% ups.)
We see that RALS’ transformation has successfully bring fresh air to the company, shown by the positive data
points this year – we expect 5.0% SSSG until the end of this year (after a series of negative SSSG last year) and
the rise of Direct Purchase products (which provide better margins). We expect the trend to continue next year,
coupled with rising coal price which gives the largest benefit for RALS among all retailers—note that 1) RALS’
outer Java SSSG is strongly related to commodity prices, and 2) Outer Java area contributed 39.1% to RALS’
total sales in 10M16!
GGRM (BUY, TP IDR82,000, 30% ups.)
We view that GGRM deserves a re-rating as it offers: 1) a healthier FCF coupled with a toned down capex going
forward, 2) a stronger earnings growth in 2017-18F as GGRM still have room for more upside in price increase
(company has been conservative in increasing its price this year), and 3) a really attractive valuation which
should not be ignored. GGRM currently trades at 15x 2017F PE and offers 19/20% earnings growth in 2017/18F
(vs HMSP at 33x 2017F PE with 10/15% earnings growth).

MARKET OUTLOOK PT Trimegah Securities Tbk - www.trimegah.com 66
Indofood Sukses Makmur Opportunity to participate in the growing ICBP
Indofood is a well-established company
and a leading player in each business
category in which it operates from pro-
duction of raw materials to consumer
products in the market.
Share Price Rp7,325
Sector Consumer
Price Target Rp9,200(+26%)
BUY Rp9,200
Reuters Code INDF.JK
Bloomberg Code INDF.IJ
Issued Shares 8,780
Mkt Cap. (Rpbn) 64,317
Avg. Value Daily 6 Month (Rpbn)
84.1
52-Wk range 9200 / 4840
CAB Holdings Ltd, Seychelles 50.1%
Anthoni Salim 0.02%
Public 49.9%
EPS 16F 17F
Consensus (Rp) 456 511
TRIM vs Cons. (%) 1.8% -2.4%
Company Update
Stock Data
Major Shareholders
Consensus
Stock Price
Christy Halim
9M16 results: above expectations on forex gain!
In 9M16, INDF reported 5% higher revenue YoY to Rp49.9tn—in line
with our estimates at 75% (below consensus at 71%), while net profit jumped 93% YoY to Rp3.2tn— above ours and consensus estimates at
83% and 82%, respectively. The significant increase on net profit is mainly on the back of the occurrence of forex gain in 9M16. Note that INDF experienced forex loss of Rp 1.8tn in 9M15.
CBP performance to remain strong going forward…
We expect its listed subsidiary, ICBP, to continue delivering strong per-formance with higher growth coming from its each division, particularly dairy, snack foods, and beverages. Despite of minimal noodles’ volume growth due to its high penetration, noodles will continue to become ICBP’s backbone. Higher contribution from ICBP will provide margin improvement to INDF. We revised up volume growth of dairy division to
15% (from 11%), reflecting its strong volume growth YTD.
Maintain Bogasari’s EBIT margin this year
We expect Bogasari to continue deliver soft performance in 4Q16 on lower ASP with minimal volume growth. In 9M16, ASP was 2% lower while volume grew 4% YoY. We lowered our ASP assumption by 2% this year as we expect ASP to remain stable until the end of the year. How-
ever, with the lower wheat prices and Bogasari being the market leader, we maintain EBIT margin for Bogasari at 8% in 2016E.
Agribusiness remain a challenge in 4Q16
We view its agribusiness division continue to remain a challenge in 4Q16 on the back of lower-than-expected production volume. We revised
down our CPO production estimates to –20% in 2016E (from previously –10%) - in line with the company’s guidance. At the same time, we adjusted upwards our ASP assumption for CPO by ~18% in 2016E and 23% in 2017E as we increased our CPO price assumption to RM2,600 in 2016E and RM2,700 in 2017F. Nevertheless, we remain optimistic for its performance in 2017F supported by production recovery and higher CPO price.
Reiterate BUY with TP Rp9,200
We tweaked our estimates to be in line with the 9M16 financial results as well as the changed in company’s guidance, resulting in 3.9% earn-ings upgrade in 2016E and 5.3% in 2017F. We also rollover our valua-
tion to 2017F EPS and lowered EV/EBITDA multiple for ICBP, thus we obtain our new TP of Rp9,200 (from Rp10,300), implying 18.5x FY17F
P/E with 15% estimated earnings growth over the next two years. Cur-rently, INDF trades at 14.7x 2017E P/E. Maintain BUY!
Year end Dec 2014 2015 2016F 2017F 2018F
Sales 63,594 64,062 66,873 71,527 77,290
Core net profit 3,861 2,724 3,675 4,378 4,878
Core EPS (Rp) 440 310 419 499 556
Core EPS Growth 54.3% -29.4% 34.9% 19.1% 11.4%
DPS (Rp) 147 201 169 232 249
BVPS (Rp) 2,859 3,106 3,401 3,667 3,974
P/E (x) 16.7 23.6 17.5 14.7 13.2
Div Yield (%) 1.7% 2.4% 2.0% 2.7% 2.9%
Companies Data

PT Trimegah Securities Tbk - www.trimegah.com MARKET OUTLOOK 67
Income Statement (Rpbn)
Year end Dec 2014 2015 2016F 2017F 2018F
Revenue 63,594 64,062 66,873 71,527 77,290
Revenue growth (%) 14.3% 0.7% 4.4% 7.0% 8.1%
Gross profit 17,129 17,258 19,224 20,716 22,477
Opr profit 7,320 7,363 8,494 9,270 10,130
EBITDA 9,787 9,811 11,433 11,718 13,857
EBITDA growth (%) 19.5% 0.2% 16.5% 2.5% 18.3%
Net income/exp -860 -2,067 -1,368 -1,450 -1,398
Gain/ (loss) forex 80 244 0 0 0
Other income/(exp) 135 -92 567 569 571
Pre-tax profit 6,340 4,962 7,188 7,882 8,794
Tax -1,856 -1,730 -2,038 -2,326 -2,601
Minority interest -1,288 -742 -1,074 -1,178 -1,314
Extra items 0 0 0 0 0
Reported net profit 3,942 2,968 4,076 4,378 4,878
Core net profit 3,861 2,724 3,675 4,378 4,878
Growth (%) 54.2% -29.4% 34.9% 19.1% 11.4%
Dividend per share 147 201 169 232 249
Growth (%) -43.1% 36.1% -15.7% 37.3% 7.4%
Dividend payout ratio 52% 45% 50% 50% 50%
Balance Sheet (Rpbn)
Year end Dec 2014 2015 2016F 2017F 2018F
Cash and equivalents 14,158 13,076 10,305 10,096 12,184
Other curr asset 26,857 29,741 16,314 17,176 18,475
Net fixed asset 21,982 25,096 27,524 28,288 28,794
Other asset 23,081 23,876 34,650 37,017 39,471
Total asset 86,077 91,832 88,793 92,577 98,924
ST debt 5,070 5,972 5,972 5,972 5,972
Other curr liab 17,589 19,136 13,165 12,920 14,570
LT debt 16,838 16,894 16,894 16,894 16,894
Other LT Liab 6,306 6,708 5,974 6,486 7,180
Minority interest 15,170 15,852 16,926 18,104 19,418
Total Liabilities 45,803 48,710 42,005 42,271 44,615
Shareholders Equity 25,104 27,269 29,862 32,201 34,891
Net debt / (cash) (12,739) (14,471) (17,243) (17,452) (15,363)
Total cap employed 63,418 66,724 69,656 73,686 78,383
Net Working capital 9,268 10,605 3,149 9,268 9,268
Debt 26,896 27,547 27,547 27,547 27,547
Cash Flow (Rpbn)
Year end Dec 2014 2015 2016F 2017F 2018F
Operating profit 7,320 7,363 8,494 9,270 10,130
Depr/Amort 1,324 1,790 1,678 1,936 2,194
Chg in non-cash working 1,687 (909) (907) (1,101) 160
Others (1,062) (4,030) (4,418) (4,892) (5,252)
CF's from operations 9,269 4,214 4,848 5,212 7,232
Capex (1,792) (5,397) (5,453) (4,183) (4,331)
Others (8,371) (269) 265 (626) (577)
CF's from investing (10,163
)
(5,666) (5,188) (4,809) (4,908)
Net change in debt (1,669) (1,259) (1,484) (2,038) (2,189)
Others 3,072 1,119 (1,061) 1,312 1,840
CF's from financing 1,403 (141) (2,545) (727) (349)
Net cash flow 509 (1,593) (2,885) (323) 1,975
Cash at BoY 13,519 14,040 13,076 10,305 10,096
Cash at EoY 14,158 13,076 10,305 10,096 12,184
Free Cash Flow (893) (1,452) (340) 403 2,324
Key Ratio Analysis
Year end Dec 2014 2015 2016F 2017F 2018F
Profitability
Gross Margin (%) 26.9% 26.9% 28.7% 29.0% 29.1%
Opr Margin (%) 11.5% 11.5% 11.5% 11.5% 11.5%
EBITDA Margin (%) 15.4% 15.3% 17.1% 16.4% 17.9%
Core Net Margin (%) 6.1% 4.3% 5.5% 6.1% 6.3%
ROAE (%) 16.5% 11.3% 14.3% 14.1% 14.5%
ROAA (%) 4.8% 3.3% 4.5% 4.8% 5.1%
Stability
Current ratio (x) 1.8 1.7 1.4 1.4 1.5
Net Debt to Equity (x) 0.5 0.5 0.6 0.5 0.4
Net Debt to EBITDA (x) 1.3 1.5 1.5 1.5 1.1
Interest Coverage (x) 4.7 2.8 4.2 4.6 5.0
Efficiency
A/P (days) 39 39 38 39 39
A/R (days) 27 27 28 27 27
Inventory (days) 64 62 65 64 63
Interim Result (Rpbn)
3Q15 4Q15 1Q16 2Q16 3Q16
Sales 14,929 16,498 16,516 17,568 15,782
Gross Profit 3,915 4,391 4,614 5,186 4,762
Opr. Profit 1,574 1,938 1,879 2,135 1,918
Net profit (47) 1,284 1,086 1,145 1,009
Gross Margins (%) 26.2% 26.6% 27.9% 29.5% 30.2%
Opr Margins (%) 10.5% 11.7% 11.4% 12.2% 12.2%
Net Margins (%) -0.3% 7.8% 6.6% 6.5% 6.4%
Capital History
Date
14-July-94 IPO@Rp6,200

MARKET OUTLOOK PT Trimegah Securities Tbk - www.trimegah.com 68
Indofood CBP Sukses Makmur Continuous strong foothold ahead
Christy Halim
Listed in 2010, ICBP is an established
market-leading producer of packaged
food products, with a diverse product
range.
Share Price Rp8,350
Sector Consumer
Price Target Rp9,200(+10%)
NEUTRAL Rp9,200
Reuters Code ICBP.JK
Bloomberg Code ICBP.IJ
Issued Shares 11,662
Mkt Cap. (Rpbn) 97,377
Avg. Value Daily 6 Month (Rpbn)
46.1
52-Wk range 10275 / 5663
PT Indofood Sukses Makmur Tbk 80.5%
Public 19.5%
EPS 16F 17F
Consensus (Rp) 311 352
TRIM vs Cons. (%) 3.5% -0.8%
Company Update
Stock Data
Major Shareholders
Consensus
Stock Price
Companies Data
Christy Halim
Companies Data
Year end Dec 2014 2015 2016F 2017F 2018F
Sales 30,022 31,741 34,484 37,014 40,174
Net Profit 2,645 3,001 3,764 4,150 4,503
EPS (Rp) 227 257 323 356 386
EPS Growth 18.9% 13.5% 25.4% 10.3% 8.5%
DPS (Rp) 51% 46% 50% 50% 50%
BVPS (Rp) 1,171 1,325 1,519 1,714 1,922
P/E (x) 36.8 32.5 25.9 23.5 23.7
Div Yield 2.0% 2.1% 1.3% 1.7% 1.8%
9M16: A good set of result
ICBP reported total net profit of Rp2.8tn (+16% YoY) on the back of 10%
higher revenue YoY to Rp26.5tn—relatively in line with our estimates, formed 77% each to revenue and net profit (vs 74% of revenue and 79% of
net profit to consensus). Margins improved across the board, thanks to lower raw material prices and manageable opex. However, ICBP reported weaker growth in 3Q16, mainly due to Lebaran seasonality as consumer purchasing power tend to soften post Lebaran period.
What to expect in 4Q16?
While ICBP continues to benefit from the lower soft commodity prices thus far, we have seen some of the commodity prices’ has gone up. YTD, sugar prices has increased 55%, CPO 28%, and skim milk 20%. We believe these will affect the company’s earnings and overall margins in 4Q16 despite of the strengthening in exchange rate by 1% QoQ and
5% YoY in 3Q16.
ICE CREAM: something to look on next year!
While its dairy division continues to perform well on both SCM and liquid categories, ICBP plans to expand its dairy business by putting more focus on its ice cream products starting next year. ICBP recently launched Espessia ice cream with five new flavours and Nusantara ice
cream with two flavours under the brand of Indoeskrim. ICBP will in-vests more in freezers and expands its distribution networks to better penetrate their products to the market.
Dairy’s performance to remain strong
Following the strong volume growth of dairy up to 9M16, we revised up
our volume growth forecasts to 15% (from previously 11%) - in line with the recent changed in company’s guidance. Dairy’s EBIT margin is also revised upwards to 12.8% (from previously 10.7%) in 2016F. As such, we expect dairy division to deliver strong performance in 4Q16 despite of the rising skim milk prices. On the other hand, the company lowered its volume growth on food seasonings to 1-3% (from 2-5%) while maintaining its EBIT margin at 4-6%.
Maintain NEUTRAL with lower TP Rp9,200
We tweaked our forecasts to better reflect the 9M16 financial results and adjust the recent changed in company’s guidance, resulting with ~2%
earnings upgrade in 2016F and 6% in 2017E. We now peg our TP to 25.9x 2017E which is the 5-year average forward +1 STD as we believe that its future potential growth has been priced in and prefer its parent
company, INDF IJ, at a cheaper valuation. As such, our TP is lowered to Rp9,200 (from Rp10,300). Currently, ICBP trades at 23.5x 2017E P/E.

PT Trimegah Securities Tbk - www.trimegah.com MARKET OUTLOOK 69
Income Statement (Rpbn) Balance Sheet (Rpbn)
Cash Flow Key Ratio Analysis
Interim Results Capital History
Date
10-Oct-10 IPO @ Rp5,395
27-Jul-16 Stock split 1:2 ratio
Year end Dec 2014 2015 2016F 2017F 2018F
Revenue 30,022 31,741 34,484 37,014 40,174
Revenue Growth (%) 19.6% 5.7% 8.6% 7.3% 8.5%
Gross Profit 8,100 9,619 10,720 11,540 12,523
Opr. Profit 3,185 3,992 4,734 5,144 5,481
EBITDA 3,919 4,558 5,533 6,046 6,507
EBITDA Growth (%) 17.6% 16.3% 21.4% 9.3% 7.6%
Net Int Inc/(Exp) 175 175 144 147 171
Gain/(loss) Forex 115 -35 0 0 0
Other Inc/(Exp) 36 56 139 206 281
Pre-tax Profit 3,445 4,010 4,878 5,291 5,652
Tax -871 -1,086 -1,219 -1,323 -1,413
Minority Int. 71 78 94 102 109
Extra. Items 0 0 0 0 0
Reported Net Profit 2,645 3,001 3,753 4,070 4,348
Core Net Profit 2,530 3,036 3,753 4,070 4,348
Growth (%) 1.0% 20.0% 23.6% 8.5% 6.8%
Dividend per share 193 206 129 161 175
Growth (%) 10% 7% -38% 25% 8%
Dividend payout ratio 51% 46% 50% 50% 50%
Year end Dec 2014 2015 2016F 2017F 2018F
Cash and equivalents 7,343 7,658 7,333 8,477 9,410
Other curr asset 6,279 6,304 6,598 7,100 7,808
Net fixed asset 5,809 6,556 8,606 9,850 10,995
Other asset 5,598 6,043 6,162 6,776 7,567
Total asset 25,029 26,561 28,699 32,203 35,780
ST debt 805 719 694 739 717
Other curr liab 5,403 5,283 5,377 5,958 6,531
LT debt 1,590 1,432 1,220 1,526 1,774
Other LT Liab 2,647 2,740 2,674 2,950 3,305
Minority interest 929 932 1,026 1,129 1,238
Total Liabilities 10,445 10,174 9,965 11,173 12,328
Shareholders Equity 13,656 15,455 17,707 19,901 22,214
Net (debt) / cash 3,937 4,788 4,429 5,174 5,801
Total cap employed 18,821 20,558 22,628 25,506 28,532
Net Working capital 875 1,021 1,221 1,142 1,277
Debt 3,406 2,869 2,904 3,303 3,609
Year end Dec 2014 2015 2016F 2017F 2018F
Core Net Profit 2,530 3,036 3,753 4,070 4,348
Depr / Amort 473 549 655 755 855
Chg. in non-cash Working
Cap 670 -442 -200 79 -135
Others 72 378 0 0 0
CF's from oprs 3,861 3,486 4,208 4,905 5,068
Capex -1,500 -1,391 -2,706 -2,000 -2,000
Others -250 -657 -119 -614 -792
CF's from investing -1,750 -2,047 -2,824 -2,614 -2,792
Net change in debt -544 -1,242 -1,737 -1,525 -1,809
Others 257 -23 -65 276 355
CF's from financing -286 -1,265 -1,803 -1,249 -1,454
Net cash flow 1,824 173 -419 1,042 823
Cash at BoY 5,379 7,226 7,657 7,333 8,477
Cash at EoY 7,343 7,657 7,333 8,477 9,410
Free Cashflow 2,361 2,095 1,502 2,905 3,068
Year end Dec 2014 2015 2016F 2017F 2018F
Profitability
Gross Margin 27.0% 30.3% 31.1% 31.2% 31.2%
Opr Margin 10.6% 12.6% 13.7% 13.9% 13.6%
EBITDA Margin 13.1% 14.4% 16.0% 16.3% 16.2%
Core Net Margin 8.4% 9.6% 10.9% 11.0% 10.8%
ROAE 20.5% 20.6% 22.6% 21.6% 20.6%
ROAA 11.4% 11.6% 13.6% 13.4% 12.8%
Stability
Current ratio (x) 2.2 2.3 2.3 2.3 2.4
Net Debt to Equity (x) -0.3 -0.3 -0.3 -0.3 -0.3
Net Debt to EBITDA (x) -1.0 -1.1 -0.8 -0.9 -0.9
Interest Coverage (x) 14.4 14.4 20.5 20.7 19.8
Efficiency
A/P (days) 43 43 40 42 42
A/R (days) 33 36 35 34 35
Inventory (days) 47 44 42 43 44
Year end Dec 3Q15 4Q15 1Q16 2Q16 3Q16
Sales 7,545 7,645 8,922 9,253 8,296
Gross Profit 2,315 2,227 2,809 2,951 2,700
Operating Profit 1,004 796 1,332 1,406 1,232
Net Profit 706 557 945 1,034 853
Gross Margins 30.7% 29.1% 31.5% 31.9% 32.5%
Opr Margins 13.3% 10.4% 14.9% 15.2% 14.8%
Net Margins 9.4% 7.3% 10.6% 11.2% 10.3%

MARKET OUTLOOK PT Trimegah Securities Tbk - www.trimegah.com 70
Gudang Garam A promising company with an undemanding valua-tion
Patricia Gabriela
Reiterate BUY on GGRM with similar TP of IDR82,000
GGRM’s share price has been under pressure these past months as
investors worry on their pricing power. With recent hikes earlier this
month, GGRM just increased its ASP of 4.8% Ytd (vs 11M15 at 9.2%
Ytd). Compared to its competitor, HMSP, which has upped ASP of 7.7%
Ytd. As our channel check has mentioned in previous report, we still
expect further price hikes in the next coming months as response to
excise tax hike burden. We have assumed 13/12% for GGRM’s price
increase in 2016/17F, on average. However, since GGRM already posted
an aggressive price hikes by end of 2015, we view price hikes of ~7% in
2016F is more than enough (in year end to year end basis). That being
said, we still like GGRM with an undemanding valuation of 10.0x 2017F
PE (a discount of 69% from HMSP’s valuation). Our TP of IDR82,000
implies 19.9x 2017F PE, a discount of 39% from HMSP’s valuation.
Expect a higher A&P expenses for market share
As threat from new product continues (primarily on SKM FF segment),
we expect GGRM to increase its ads expenses to maintain its market
share. We have assumed 2.9/3.1% ads expenses in 2016/17F (vs 2.6%
in 2015). However, please note that the increase in ads expenses also
occurred to its competitors. Per 9M16, HMSP upped its ads expenses
proportion to revenue by 10bps YoY while RMBA did more aggressive at
260bps. We believe ads expenses is crucial to promote cigs brand.
The rise of relatively “new” brand
We cannot deny that one of GGRM’s flagship brand, Surya (9.4% mar-
ket share, based on Nielsen), has been under pressure this year. How-
ever, we see a volume improvement on its other brands, such as GG
Inter (4.5% market share), Surya Pro (0.5%), Surya Pro Mild (2.6%),
and GG Merah (1.6%). YoY, Surya Pro recorded a growth of 24.2%
thanks to more support from marketing expenses. Surya Pro Mild,
meanwhile, grew by 7.1% YoY as it has a relatively low price in Mild
segment. Another point worth to be noted, GG Merah is the only SKT
brand that posted a growth amid the negative SKT segment.
Founded in 1958, Gudang Garam grew
into one of the biggest and most well-
known cigarette company in Indonesia,
providing both the choice and quality as-
sociated with Gudang Garam.
BUY Rp82,000
Company Update
Stock Data
Major Shareholders
Consensus
Stock Price Year end Dec 2014 2015 2016F 2017F 2018F
Sales (Rp bn) 65,186 70,366 77,272 84,883 95,862
EBITDA (Rp bn) 10,071 11,812 11,969 13,801 15,835
Net Profit (Rp bn) 5,369 6,436 6,652 7,918 9,464
EPS (Rp) 2,790 3,345 3,457 4,115 4,919
EPS Growth (%) 24% 20% 3% 19% 20%
DPS (Rp) 800 800 2,600 2,420 2,881
BVPS (Rp) 17,151 19,698 20,601 22,296 24,334
EV/EBITDA (x) 13.6 11.7 11.6 10.0 8.5
P/E (x) 22.5 18.8 18.2 15.3 12.8
Div Yield (%) 1.3 1.3 4.1 3.9 4.6
Companies Data
Share Price Rp62,775
Sector Cigarette
Price Target Rp82,000 (+31%)
Reuters Code GGRM.JK
Bloomberg Code GGRM.IJ
Issued Shares 1,924
Mkt Cap. (Rpbn) 120,785
Avg. Value Daily 6 Month (Rpbn)
93.0
52-Wk range 77,950 / 48,275
PT Suryaduta Investama 69.3%
Others 7.2%
Public 23.5%
Core EPS 16F 17F
Consensus (Rp) 3,444 3,925
TRIM vs Cons. (%) 0.4% 4.9%

PT Trimegah Securities Tbk - www.trimegah.com MARKET OUTLOOK 71
Income Statement (Rpbn)
Year end Dec 2014 2015 2016F 2017F 2018F
Revenue 65,186 70,366 77,272 84,883 92,862
Revenue Growth
(%)
17.6% 7.9% 9.8% 9.9% 9.4%
Gross Profit 13,380 15,486 16,671 19,175 21,750
Opr. Profit 8,578 10,065 10,166 11,907 13,845
EBITDA 10,071 11,812 11,969 13,801 15,835
EBITDA Growth (%) 29.1% 17.3% 1.3% 15.3% 14.7%
Net Int Inc/(Exp) (1,372) (1,430) (1,240) (1,283) (1,149)
Gain/(loss) Forex 17 72 (14) - -
Other Inc/(Exp) 36 87 150 100 100
Pre-tax Profit 7,206 8,635 8,926 10,624 12,697
Tax (1,811) (2,182) (2,256) (2,685) (3,209)
Minority Int. 27 17 17 20 24
Extra. Items - - - - -
Reported Net Profit 5,369 6,436 6,652 7,918 9,464
Core Net Profit 5,383 6,399 6,680 7,939 9,488
Growth (%) 22.5% 18.9% 4.4% 18.8% 19.5%
Dividend per share 800 800 2,600 2,420 2,881
growth (%) 0.0% 0.0% 225.0% -6.9% 19.0%
Dividend payout
ratio
35.6% 28.7% 77.7% 70.0% 70.0%
Balance Sheet (Rpbn)
Year end Dec 2014 2015 2016F 2017F 2018F
Cash and equivalents 1,588 2,726 1,579 2,002 3,603
Other curr asset 36,944 39,843 42,416 44,855 46,968
Net fixed asset 18,973 20,106 19,804 19,460 19,073
Other asset 728 830 718 707 695
Total asset 58,234 63,505 64,517 67,023 70,339
ST debt 18,147 20,561 19,675 18,712 17,668
Other curr liab 5,636 3,484 3,627 3,814 4,228
LT debt - - - - -
Other LT Liab 1,317 1,452 1,452 1,452 1,452
Minority interest 134 108 125 146 170
Total Liabilities 25,100 25,498 24,755 23,979 23,349
Shareholders Equity 33,000 37,900 39,637 42,899 46,820
Net debt / (cash) 16,559 17,835 18,096 16,711 14,065
Total cap employed 34,451 39,460 41,215 44,497 48,442
Net Working capital 14,749 18,523 20,693 24,330 28,675
Debt 18,147 20,561 19,675 18,712 17,668
Cash Flow (Rpbn)
Year end Dec 2014 2015 2016F 2017F 2018F
Net Profit 5,369 6,436 6,652 7,918 9,464
Depr / Amort 1,440 1,715 1,802 1,894 1,990
Chg in Working Cap (5,224) (5,050) (2,431) (2,252) (1,699)
CF's from oprs 1,585 3,101 6,024 7,561 9,754
Capex (5,625) (2,848) (1,500) (1,550) (1,603)
Others 650 (102) 113 11 12
CF’s from investing (4,975) (2,950) (1,387) (1,539) (1,590)
Dividend (1,539) (1,539) (5,003) (4,657) (5,543)
Others 5,183 2,521 (869) (942) (1,020)
CF’s from financing 3,644 982 (5,872) (5,599) (6,563)
Net cash flow 254 1,132 (1,234) 423 1,601
Cash at BoY 1,427 1,681 2,813 1,579 2,002
Cash at EoY 1,681 2,813 1,579 2,002 3,603
Free Cashflow (4,040) 252 4,524 6,011 8,152
Key Ratio Analysis
Year end Dec 2014 2015 2016F 2017F 2018F
Profitability
Gross Margin (%) 20.5% 22.0% 21.6% 22.6% 23.4%
Opr Margin (%) 13.2% 14.3% 13.2% 14.0% 14.9%
EBITDA Margin (%) 15.4% 16.8% 15.5% 16.3% 17.1%
Core Net Margin (%) 8.3% 9.1% 8.6% 9.4% 10.2%
ROAE (%) 17.3% 18.2% 17.2% 19.2% 21.1%
ROAA (%) 9.9% 10.6% 10.4% 12.0% 13.8%
Stability Current ratio (x) 1.6 1.8 1.9 2.1 2.3
Net Debt to Equity (x) 0.5 0.5 0.5 0.4 0.4
Net Debt to EBITDA (x) 1.8 1.7 1.6 1.4 1.1
Interest Coverage (x) 6.3 7.0 7.9 8.8 10.9
Efficiency A/P (days) 6 11 14 15 15
A/R (days) 10 8 8 8 8
Inventory (days) 229 239 232 227 220
Interim Result (Rpbn)
3Q15 4Q15 1Q16 2Q16 3Q16
Sales 17,786 19,354 17,993 18,970 19,249
Gross Profit 3,708 4,908 4,266 3,773 3,998
EBITDA 3,049 3,969 3,123 2,311 3,142
Opr. Profit 2,614 3,484 2,635 1,815 2,635
Net profit 1,705 2,329 1,693 1,160 1,732
Core profit 1,676 2,334 1,711 1,171 1,727
Gross Margins (%) 20.8% 25.4% 23.7% 19.9% 20.8%
EBITDA Margins (%) 17.1% 20.5% 17.4% 12.2% 16.3%
Opr Margins (%) 14.7% 18.0% 14.6% 9.6% 13.7%
Net Margins (%) 9.6% 12.0% 9.4% 6.1% 9.0%
Core Margins (%) 9.4% 12.1% 9.5% 6.2% 9.0%
Capital History
Date
27-Aug-90 IPO@Rp10,250
27-May-96 Stock split 1:2

MARKET OUTLOOK PT Trimegah Securities Tbk - www.trimegah.com 72
HM Sampoerna Pricing power Patricia Gabriela
Share Price Rp3,870
Sector Cigarette
Price Target Rp4,100 (+6%)
Neutral Rp4,100
Reuters Code HMSP.JK
Bloomberg Code HMSP.IJ
Issued Shares 116,318
Mkt Cap. (Rpbn) 450,151
Avg. Value Daily 6 Month (Rpbn)
66.7
52-Wk range 4,485 / 3,560
PT Philip Morris Indonesia 92.5%
Others 7.5%
Core EPS 16F 17F
Consensus (Rp) 103 114
TRIM vs Cons. (%) 2.3% 1.4%
Company Update
Stock Data
Major Shareholders
Consensus
Stock Price
PT Hanjaya Mandala Sampoerna Tbk
manufactures hand rolled and machine-
rolled clove-blended cigarettes. The
Company distributes its products in do-
mestic and international market. Through
its subsidiaries, the Company also devel-
ops properties.
Maintain Neutral rating
We maintain our TP on HMSP at IDR4,100, implying 35.3x 2017F PE
(based on +1.4 stdev 5-years historical forward PE band). Although its
new brand, U Bold, is deemed to be quite successful (1.8% market
share in 3Q16 vs 0.9% in 2Q16) thanks to more city penetration, it
could cannibalize the higher margin A Mild brand. Although we expect
Marlboro Filter Black to be able to grab 1-2% market share in 2017F,
hence will contribute 300-400mn sticks per month to HMSP (~4% of
HMSP’s 2017F volume expectation), it remains to be seen whether such
volume would provide healthy returns on R&D and marketing. One
positive thing is HMSP’s pricing power and its willingness to maximize it
(7.7% ASP increase Ytd, 9% on avg.), we believe HMSP will continue to
post a strong earnings growth of 18/10% in 2016/17F.
Ads expenses will remain high, but it is for market share pur-
pose
Big cigs company for the likes of HMSP and GGRM are having a hard
time on market share this year, as the impact of new brand introduced
last year by RMBA (Dunhill Kretek Filter) and Djarum Group (LA Bold).
Ads expenses are an important factor on cigs brand market share,
hence we view the high proportion of ads expenses is a positive event
(as long as maintained at certain level). We assumed 3.3% of ads ex-
penses proportion to HMSP’s revenue in 2017F (vs 3.1% in 2016F) and
expect its market share to up by 0.2% next year.
Another price hikes coming in Dec’16
We expect HMSP to increase its price again by Dec’16 as company con-
tinue to revise up its price per month. Though the exact value is not yet
disclosed, but historically HMSP increased its price by 1-2% on avg. We
assumed 11% price hikes on avg. for HMSP in 2016/17F.
Year end Dec 2014 2015 2016F 2017F 2018F
Sales (Rp bn) 80,690 89,069 95,957 105,264 115,926
EBITDA (Rp bn) 14,261 14,641 16,116 17,927 20,756
Net Profit (Rp bn) 10,181 10,363 12,206 13,442 15,469
EPS (Rp) 88 89 105 116 133
EPS Growth (%) -6% 2% 18% 10% 15%
DPS (Rp) 92 105 89 105 116
BVPS (Rp) 116 275 291 301 319
EV/EBITDA (x) 31.8 30.6 27.5 24.9 21.5
P/E (x) 44.2 43.4 36.9 33.5 29.1
Div Yield (%) 2.4% 2.7% 2.3% 2.7% 3.0%
Companies Data

PT Trimegah Securities Tbk - www.trimegah.com MARKET OUTLOOK 73
Income Statement (Rpbn)
Year end Dec 2014 2015 2016F 2017F 2018F
Revenue 80,690 89,069 95,957 105,264 115,926
Revenue Growth
(%)
7.6% 10.4% 7.7% 9.7% 10.1%
Gross Profit 20,500 21,764 23,664 26,420 30,115
Opr. Profit 13,694 13,986 15,637 17,405 20,188
EBITDA 14,261 14,641 16,116 17,927 20,756
EBITDA Growth (%) -5.0% 2.7% 10.1% 11.2% 15.8%
Net Int Inc/(Exp) 10 (69) 773 666 610
Gain/(loss) Forex - - - - -
Other Inc/(Exp) (111) (62) - - -
Pre-tax Profit 13,718 13,933 16,410 18,071 20,797
Tax (3,537) (3,569) (4,204) (4,630) (5,328)
Minority Int. - - - - -
Extra. Items - - - - -
Reported Net Profit 10,181 10,363 12,206 13,442 15,469
Core Net Profit 10,181 10,363 12,206 13,442 15,469
Growth (%) -5.9% 1.8% 17.8% 10.1% 15.1%
Dividend per share 92 105 89 105 116
growth (%) 7.1% 15.0% -15.1% 17.4% 10.1%
Dividend payout
ratio
98.4% 120.3% 100.4% 100.0% 100.0%
Balance Sheet (Rpbn)
Year end Dec 2014 2015 2016F 2017F 2018F
Cash and equivalents 65 1,719 6,537 6,071 8,162
Other curr asset 20,712 28,089 25,004 29,321 29,989
Net fixed asset 5,920 6,281 6,783 7,334 7,946
Other asset 1,684 1,922 2,007 2,100 2,218
Total asset 28,381 38,011 40,330 44,827 48,314
ST debt 2,835 - - 3,158 3,478
Other curr liab 10,765 4,539 5,013 4,877 5,938
LT debt - - - - -
Other LT Liab 1,282 1,456 1,495 1,734 1,814
Minority interest - - - - -
Total Liabilities 14,883 5,995 6,508 9,769 11,229
Shareholders Equity 13,498 32,016 33,822 35,058 37,085
Net debt / (cash) 2,770 (1,719) (6,537) (2,914) (4,684)
Total cap employed 14,780 33,472 35,317 36,792 38,899
Net Working capital 7,177 25,269 26,527 27,357 28,736
Debt 2,835 - - 3,158 3,478
Cash Flow (Rpbn)
Year end Dec 2014 2015 2016F 2017F 2018F
Net Profit 10,181 10,363 12,206 13,442 15,469
Depr / Amort 567 655 479 522 569
Chg in Working
Cap
961 (13,602) 3,559 (4,453) 392
CF's from oprs 11,709 (2,584) 16,244 9,511 16,430
Capex (1,778) (1,016) (980) (1,073) (1,180)
Others (235) (239) (85) (93) (117)
CF’s from invest-
ing
(2,013) (1,255) (1,065) (1,167) (1,297)
Dividend (10,651) (12,250) (10,400) (12,206) (13,442)
Others 272 17,834 39 3,397 399
CF’s from financ-
ing
(10,379) 5,584 (10,361) (8,809) (13,042)
Net cash flow (683) 1,744 4,818 (465) 2,091
Cash at BoY 657 (26) 1,719 6,537 6,071
Cash at EoY (26) 1,719 6,537 6,071 8,162
Free Cashflow 9,931 (3,601) 15,264 8,437 15,250
Key Ratio Analysis
Year end Dec 2014 2015 2016F 2017F 2018F
Profitability
Gross Margin (%) 25.4% 24.4% 24.7% 25.1% 26.0%
Opr Margin (%) 17.0% 15.7% 16.3% 16.5% 17.4%
EBITDA Margin (%) 17.7% 16.4% 16.8% 17.0% 17.9%
Core Net Margin (%) 12.6% 11.6% 12.7% 12.8% 13.3%
ROAE (%) 73.6% 45.5% 37.1% 39.0% 42.9%
ROAA (%) 36.5% 31.2% 31.2% 31.6% 33.2%
Stability Current ratio (x) 1.5 6.6 6.3 4.4 4.1
Net Debt to Equity (x) 0.2 - - 0.1 0.1
Net Debt to EBITDA (x) 0.2 - - 0.2 0.2
Interest Coverage (x) 288.8 101.0 329.6 347.1
Efficiency A/P (days) 15 16 15 14 14
A/R (days) 6 12 12 6 6
Inventory (days) 105 99 100 100 100
Interim Result (Rpbn)
3Q15 4Q15 1Q16 2Q16 3Q16
Sales 21,775 23,552 21,921 25,415 22,939
Gross Profit 5,487 6,017 5,653 5,908 5,619
EBITDA 3,725 3,891 4,160 3,928 3,906
Opr. Profit 3,558 3,707 3,989 3,753 3,722
Net profit 2,585 2,767 3,119 3,029 2,933
Core profit 2,585 2,767 3,119 3,029 2,933
Gross Margins (%) 25.2% 25.6% 25.8% 23.2% 24.5%
EBITDA Margins (%) 17.1% 16.5% 19.0% 15.5% 17.0%
Opr Margins (%) 16.3% 15.7% 18.2% 14.8% 16.2%
Net Margins (%) 11.9% 11.7% 14.2% 11.9% 12.8%
Core Margins (%) 11.9% 11.7% 14.2% 11.9% 12.8%
Capital History
Date
15-Aug-90 IPO@Rp12,600
10-Sept-01 Stock split 1:5
13-Jun-16 Stock split 1:25

MARKET OUTLOOK PT Trimegah Securities Tbk - www.trimegah.com 74
Kalbe Farma Positive growth supported from volume Patricia Gabriela
Prescription pharma: Branded generic starts to record a positive
growth
As non UHC (Universal Health Coverage) hospitals are seeing a patient
volume growth this year, we view the impact will be positive to KLBF as
majority of its prescription pharma is still supported from branded ge-
neric drugs (56% of the segment). Per 9M16, branded generic grew by
4% YoY (vs –5% in 9M15) on volume basis. Margin compression is
inevitable, but company is developing a higher margin product e.g.
oncology which we has discussed in our previous report.
Consumer health: Recovery of energy drink segment
In 9M16, KLBF’s consumer health division posted a growth of 11% YoY,
back to its double-digit track (from previously single-digit growth due to
the weak performance of energy drink). To be specific, the segment
recorded growth of 22% YoY in 3Q16. Aside from the higher demand of
OTC and new product, company also see a recovery demand of Extra
Joss with a single-digit growth (which comprises ~25% of consumer
health) thanks to the product’s new variant: Extra Joss Blend and Extra
Joss Go. We have expected a growth of 14/16% on KLBF’s consumer
health in 2016/17F.
Nutritionals: Continue to be strong
Nutritionals kept its record as the highest growth segment with 11% YoY
in 9M16. Morinaga (~60% of nutritionals) continue to grow strong after
tough competition earlier this year. Though skim milk price has shown
an upward trend of 14% YoY per Nov’16, but we can expect the price to
translate at ~6 months time lag. We also believe in the improving pur-
chasing power next year, hence company can pass on this cost increase
to consumer. Company has launched Blackmores last 3Q16.
Maintain Buy on KLBF with lower TP of IDR1,800
We continue to like KLBF as: 1) volume growth starts to recover and we
see a stable growth from its new innovative product, 2) margin expan-
sion on the back of efficiency. We lower our TP as we are cautious on
USD/IDR volatility next year that might impact its pharmacy and nutri-
tionals segment. Our new TP of IDR1,800 implies 32x 2017F PE.
Kalbe Farma is the largest publicly-listed
pharmaceuticals company in Southeast
Asia.
Share Price Rp1,400
Sector Healthcare
Price Target Rp1,800 (+29%)
Buy Rp1,800
Reuters Code KLBF.JK
Bloomberg Code KLBF.IJ
Issued Shares 46,875
Mkt Cap. (Rpbn) 65,625
Avg. Value Daily 6 Month (Rpbn)
54.9
52-Wk range 1,815 / 1,135
PT. Gira Sole Prima 10.2%
Others 46.5%
Public 43.3%
Company Update
Stock Data
Major Shareholders
Stock Price Year end Dec 2014 2015 2016F 2017F 2018F
Sales (Rp bn) 17,369 17,887 19,669 22,388 25,643
EBITDA (Rp bn) 3,060 2,995 3,390 3,870 4,533
Net Profit (Rp bn) 2,065 2,004 2,260 2,587 3,044
EPS (Rp) 44 43 49 56 66
EPS Growth (%) 8% -3% 14% 14% 17%
DPS (Rp) 17 19 22 25 29
BVPS (Rp) 199 223 251 281 317
EV/EBITDA (x) 20.9 21.1 18.7 16.3 13.9
P/E (x) 31.1 32.4 28.4 24.9 21.2
Div Yield (%) 1.2% 1.4% 1.5% 1.8% 2.1%
Companies Data
Consensus
Core EPS 16F 17F
Consensus (Rp) 49 55
TRIM vs Cons. (%) 1.1% 2.7%

PT Trimegah Securities Tbk - www.trimegah.com MARKET OUTLOOK 75
Income Statement (Rpbn)
Year end Dec 2014 2015 2016F 2017F 2018F
Revenue 17,369 17,887 19,669 22,388 25,643
Revenue Growth
(%)
8.5% 3.0% 10.0% 13.8% 14.5%
Gross Profit 8,476 8,592 9,577 10,907 12,584
Opr. Profit 2,752 2,643 2,962 3,384 3,974
EBITDA 3,060 2,995 3,390 3,870 4,533
EBITDA Growth (%) 9.1% -2.1% 13.2% 14.2% 17.1%
Net Int Inc/(Exp) 11 77 98 108 122
Gain/(loss) Forex 14 42 - - -
Other Inc/(Exp) (20) (25) (60) (40) (20)
Pre-tax Profit 2,764 2,721 3,059 3,491 4,096
Tax (643) (663) (746) (851) (998)
Minority Int. 56 53 53 53 53
Extra. Items - - - - -
Reported Net Profit 2,065 2,004 2,260 2,587 3,044
Core Net Profit 2,110 2,026 2,314 2,640 3,098
Growth (%) 7.1% -4.0% 14.2% 14.1% 17.3%
Dividend per share 17 19 22 25 29
growth (%) -10.5% 11.8% 14.2% 14.5% 17.7%
Dividend payout
ratio
39% 45% 45% 45% 45%
Balance Sheet (Rpbn)
Year end Dec 2014 2015 2016F 2017F 2018F
Cash and equivalents 1,895 2,719 2,646 2,899 3,235
Other curr asset 6,226 6,030 6,594 7,421 8,384
Net fixed asset 3,404 3,938 5,010 5,664 6,416
Other asset 914 1,009 1,009 1,009 1,009
Total asset 12,439 13,696 15,260 16,994 19,045
ST debt 252 266 303 344 392
Other curr liab 2,134 2,100 2,292 2,520 2,778
LT debt 44 128 128 128 128
Other LT Liab 245 265 265 265 265
Minority interest 434 473 520 562 634
Total Liabilities 2,675 2,758 2,987 3,257 3,562
Shareholders Equity 9,330 10,465 11,752 13,175 14,849
Net debt / (cash) (1,598) (2,325) (2,216) (2,427) (2,716)
Total cap employed 10,053 11,331 12,665 14,130 15,875
Net Working capital 5,735 6,383 6,645 7,456 8,450
Debt 296 394 430 472 519
Cash Flow (Rpbn)
Year end Dec 2014 2015 2016F 2017F 2018F
Net Profit 2,065 2,004 2,260 2,587 3,044
Depr / Amort 308 351 428 486 559
Chg in Working Cap (78) 162 (371) (600) (705)
CF's from oprs 2,295 2,517 2,317 2,473 2,899
Capex (787) (885) (1,500) (1,140) (1,311)
Others (17) (95) - - -
CF’s from investing (805) (981) (1,500) (1,140) (1,311)
Dividend (810) (907) (1,017) (1,164) (1,370)
Others (218) 164 128 84 118
CF’s from financing (1,028) (743) (889) (1,080) (1,251)
Net cash flow 462 794 (73) 253 386
Cash at BoY 1,356 1,819 2,658 2,585 2,838
Cash at EoY 1,819 2,658 2,585 2,838 3,174
Free Cashflow 1,522 1,625 797 1,305 1,549
Key Ratio Analysis
Year end Dec 2014 2015 2016F 2017F 2018F
Profitability
Gross Margin (%) 48.8% 48.0% 48.7% 48.7% 49.1%
Opr Margin (%) 15.8% 14.8% 15.1% 15.1% 15.5%
EBITDA Margin (%) 17.6% 16.7% 17.2% 17.3% 17.7%
Core Net Margin (%) 11.8% 11.0% 11.8% 11.8% 12.1%
ROAE (%) 23.7% 20.2% 20.3% 20.8% 21.7%
ROAA (%) 17.4% 15.3% 15.6% 16.0% 16.9%
Stability Current ratio (x) 3.4 3.7 3.6 3.6 3.7
Net Debt to Equity (x) (0.2) (0.2) (0.2) (0.2) (0.2)
Net Debt to EBITDA (x) (0.5) (0.8) (0.7) (0.6) (0.6)
Interest Coverage (x) 52.9 110.5 94.6 102.1 113.0
Efficiency A/P (days) 63 60 55 54 54
A/R (days) 50 50 48 47 47
Inventory (days) 126 120 114 112 112
Interim Result (Rpbn)
3Q15 4Q15 1Q16 2Q16 3Q16
Sales 4,408 4,760 4,550 5,006 4,820
Gross Profit 2,113 2,181 2,194 2,469 2,372
EBITDA 682 761 814 846 835
Opr. Profit 593 664 719 748 734
Net profit 436 505 563 583 556
Core profit 441 523 581 591 567
Gross Margins (%) 47.9% 45.8% 48.2% 49.3% 49.2%
EBITDA Margins (%) 15.5% 16.0% 17.9% 16.9% 17.3%
Opr Margins (%) 13.5% 14.0% 15.8% 15.0% 15.2%
Net Margins (%) 9.9% 10.6% 12.4% 11.6% 11.5%
Core Margins (%) 10.0% 11.0% 12.8% 11.8% 11.8%
Capital History
Date
30-Jul-91 IPO@Rp7,800
08-Oct-12 Stock split 1:5
13-Dec-13 Decrease in issued and
fully paid shares

MARKET OUTLOOK PT Trimegah Securities Tbk - www.trimegah.com 76
PT Nippon Indosari Corpindo Tbk produc-
es baked goods. The Company produces
bread, cakes, bread pudding, lasagna,
and other foods.
Share Price Rp1,455
Sector Consumer
Price Target Rp1,900 (+31%)
Year end Dec 2014 2015 2016F 2017F 2018F
Sales - net (Rp bn) 1,880 2,175 2,470 2,869 3,319
Net Profit (Rp bn) 189 274 269 327 384
EPS (Rp) 37.3 54.1 53.2 64.6 75.9
EPS Growth 18.7% 45.1% -1.7% 21.6% 17.4%
DPS (Rp) 3 9 11 13 15
BVPS (Rp) 190 235 277 329 390
P/E (x) 39.1 26.9 27.4 22.5 19.2
Div Yield 0.9% 2.7% 3.2% 3.9% 4.6%
Nippon Indosari Corpindo Potential future growth to grab!
BUY Rp1,900
Reuters Code ROTI.JK
Bloomberg Code ROTI.IJ
Issued Shares 5,062
Mkt Cap. (Rpbn) 7,365
Avg. Value Daily 6 Month (Rpbn)
3.8
52-Wk range 1770 / 1160
PT Indoritel Makmur Internasion-
al Tbk
31.50%
Bonlight Investments, Ltd 25.10%
Pasco Shikishima Corporation 8.50%
Sojitz Corporation 4.25%
Public 30.6%
EPS 16F 17F
Consensus (IDR) 57 69
TRIM vs Cons. (%) -6.4% -6.0%
Company Update
Stock Data
Major Shareholders
Consensus
Stock Price
Companies Data
9M16 result—pretty much in-line with estimates! ROTI reported decent revenue growth of 17% in 9M16, supported by higher volume across bread categories. Both sweet and white bread posted 10% and 22% sales growth, respectively—this is in line with the
company’s overall focus on its sweet and white bread (both contributed around 98% to total sales). However, net profit only grew 6% in 9M16 as a result of higher costs and expenses including direct labour, A&P, expired inventories, and salaries and wages, thus, overall margins also seen declining. Competition at home is intensifying
While we continue to see ROTI’s performance to remain defensive in 4Q16, we view domestic competition is intensifying despite of its smaller scale in proportion compared to Sari Roti. We have seen several new brands of bread in the market lately, with the recent one is Prime Bread, produced by PT Gardenia Makmur Selaras. Prime Bread is priced lower than Sari Roti at around Rp3,500/pack (vs Sari Roti at around
Rp5,000/pack), however, with its limited product availability currently and smaller business scale (not economies of scale) compared to Sari Roti, we believe ROTI will continue to be the market leader in the mass-produced bread industry. By entering into the Philippines market, we believe Sari Roti can establish a new source of revenue in a populous and growing consumer market like Indonesia. Despite of its small contri-bution at the beginning, we are expecting its JV with Monde Nissin in
Philippines to start contributing in 2018. Changed our estimates slightly… We maintain our conservative estimates for ROTI as we believe ROTI will continue to provide topline growth on the back of higher volume and
lower sales returns, even though we expect normalization in some of the input costs particularly wheat, following the increase in CPO, sugar and
skim milk prices as well as higher direct labor costs. We did a sensitivity analysis to measure the effect of the increase in wheat prices and we found out that every 10% increase on wheat prices, it will reduce gross margin by around 1.1%, assuming other things remain constant. As we changed our USD/IDR exchange rate assumption in 2016F and 2017F, our estimates slightly reduced by around 1% in 2016F.
Reiterate BUY at Rp1,900 Looking at the future potential growth of bread industry in Indonesia, combined with its strong distribution networks and continuous product
innovation, we reiterate our BUY call on ROTI with our TP of Rp1,900 implying 29.4x 2017F P/E. As ROTI’s share price declined by ~13% in the past one month, which mainly due to the overall slowing down in the
market, we see an opportunity to buy with it is currently trading just slightly above average 3-yr forward P/E. Currently, it trades at 22.5x 2017F P/E.
Christy Halim

PT Trimegah Securities Tbk - www.trimegah.com MARKET OUTLOOK 77
Income Statement (Rpbn) Balance Sheet (Rpbn)
Cash Flow Key Ratio Analysis
Interim Results Capital History
Date
28 June 2010 IPO @ Rp1,275
Year end Dec 2014 2015 2016F 2017F 2018F
Revenue 1,880 2,175 2,470 2,869 3,319
Revenue Growth (%) 24.9% 15.6% 13.6% 16.2% 15.7%
Gross Profit 901 1154 1274 1510 1738
Opr. Profit 299 453 400 512 584
EBITDA 28.0% 51.7% -11.7% 27.9% 14.1%
EBITDA Growth (%) 395 566 564 697 790
Net Int Inc/(Exp) -46 -72 -41 -76 -72
Gain/(loss) Forex 4 0 0 0 0
Other Inc/(Exp) 32 38 12 15 17
Pre-tax Profit 253 381 359 436 512
Tax -64 -108 -90 -109 -128
Minority Int. 0 0 0 0 0
Extra. Items 0 0 0 0 0
Reported Net Profit 189 274 269 327 384
Core Net Profit 185 274 269 327 384
Growth (%) 17.9% 48.2% -1.6% 21.6% 17.4%
Dividend per share 3 9 11 13 15
growth (%) -59% 182% 21% 22% 17%
Dividend payout ratio 8% 16% 20% 20% 20%
Year end Dec 2014 2015 2016F 2017F 2018F
Cash and equivalents 163 515 568 723 937
Other current asset 258 298 315 365 424
Net fixed asset 1,680 1,821 2,157 2,322 2,466
Other asset 43 72 82 95 110
Total asset 2,143 2,706 3,122 3,506 3,937
ST debt 126 160 173 195 225
Other curr liab 182 236 207 258 288
LT debt 291 0 198 225 262
Other LT Liab 584 1,122 1,141 1,163 1,190
Minority interest 0 0 0 0 0
Total Liabilities 1,183 1,518 1,718 1,840 1,964
Shareholders Equity 960 1,189 1,405 1,666 1,973
Net debt / (cash) 176 -515 -370 -498 -675
Total cap employed 1,835 2,310 2,742 3,054 3,424
Net Working capital 76 61 108 108 136
Debt 339 0 198 225 2,205
Year end Dec 2014 2015 2016F 2017F 2018F
Net profit 189 274 269 327 384
Depr/Amort 96 113 164 185 206
Chg in non-cash working
capital -55 96 -34 22 2
Others 135 73 0 0 0
CF's from operations 365 556 400 534 592
Capex -598 -257 -500 -350 -350
Others 202 17 -10 -13 -15
CF's from investing -396 -240 -510 -363 -365
Net change in debt 163 130 145 -38 -40
Others -70 -93 19 23 27
CF's from financing 93 37 164 -16 -13
Net cash flow 63 352 53 155 214
Cash at BoY 101 163 515 568 723
Cash at EoY 164 515 568 723 937
Free Cash Flow -233 298 -100 184 242
Year end Dec 2014 2015 2016F 2017F 2018F
Profitability
Gross margin 47.9% 53.1% 51.6% 52.6% 52.4%
Opr margin 15.9% 20.8% 16.2% 17.8% 17.6%
EBITDA margin 21.0% 26.0% 22.8% 24.3% 23.8%
Core net margin
ROE 19.6% 23.0% 19.2% 19.6% 19.5%
ROA 8.8% 10.1% 8.6% 9.3% 9.8%
Stability
Current ratio (x) 1.4 2.1 2.3 2.4 2.7
Net debt to equity (x) 0.2 -0.4 -0.3 -0.3 -0.3
Net debt to EBITDA (x) 0.4 -0.9 -0.7 -0.7 -0.9
Interest coverage (x) 6.4 5.0 8.1 5.4 6.0
Efficiency
A/P (days) 52 50 52 52 51
A/R (days) 38 38 38 38 38
Inventory (days) 14 15 14 14 14
Year end Dec 3Q15 4Q15 1Q16 2Q16 3Q16
Sales 530 605 611 582 644
Gross Profit 283 326 324 293 333
Operating Profit 113 148 132 74 118
Net Profit 74 78 86 43 75
Gross Margins 53.3% 53.9% 53.1% 50.3% 51.7%
Opr Margins 21.4% 24.5% 21.6% 12.7% 18.3%
Net Margins 14.0% 12.9% 14.1% 7.3% 11.6%

MARKET OUTLOOK PT Trimegah Securities Tbk - www.trimegah.com 78
Going back to its consumer scape Post the divestment of its plantation business, Golden Plantation (GOLL), AISA is going back to focus on expanding its consumer business. Its food manufacturing division posted 9% revenue growth CAGR13-15, and we
expect the division to post 10% growth CAGR16-18E mainly on the back of the rising “Bihunku” products and growing snacks business. We view that AISA will strengthen its dominance in the food manufacturing busi-ness along with aggressive new product launching and expand its distri-bution network. Rice mills: Focus on branded pack with higher margin!
Aside from the growing food manufacturing business, AISA is also ex-panding its rice business particularly focusing on the branded pack rice which offer higher margin than branded bulk rice. AISA is expecting its branded pack rice to contribute ~40% to total at the end of 2016E (28% as of 9M16). As rice can be said as a major staple food item for most
Indonesians, we continue to see a promising outlook on rice industry. The
rice division recorded 30% revenue growth CAGR13-15, and we expect rice business to continue deliver its solid performance with 23% revenue growth CAGR16-18E and 69% contribution to total gross sales. Divestment of GOLL—to lower debt burden AISA divested 78.2% stake of its agribusiness under PT Golden Plantation (GOLL IJ) to PT JOM Prawarsa Indonesia at Rp521.4bn on May-16. We
believe the management decision to divest its agribusiness division is positive for AISA and thus, we are expecting AISA’s financial performance to improve as AISA turns to be a pure consumer company. At the same time, AISA’s capital structure will also improve as AISA able to wipe off
~Rp1.1tn of debt attributable to GOLL (accounted ~47% of AISA’s total LT debt). We are expecting AISA’s total debt to reduce by around Rp1tn in 2016E and its debt-to-equity ratio to be 0.82x in 2016E.
BUY, TP Rp2,300 We are assuming coverage on Tiga Pilar (AISA IJ) with a BUY rating and target price of Rp2,300, based on historical 5-year avg forward P/E of 12.4x. Currently, the stock is trading at 10.3x 1-year forward P/E. Even though the stock has re-rating by around 68% post GOLL divestment in
May-16, we view that the stock continues to be attractive, considering potential future growth on its rice mills and food manufacturing business, improvement on margins and capital structure as well as still being one of the cheapest consumer company compared with its peers. BUY!
PT Tiga Pilar Sejahtera Food Tbk produc-
es and distributes different types of noo-
dles such as dried noodle, instant noodle,
and snack noodle. The Company, through
its subsidiaries also produces and distrib-
utes seafood products.
BUY Rp2,300
Reuters Code AISA.JK
Bloomberg Code AISA.IJ
Issued Shares 3,219
Mkt Cap. (Rpbn) 6,019
Avg. Value Daily 6 Month (Rpbn) 8.2
52-Wk range 2340 / 860
EPS 16F 17F
Consensus (IDR) 134 166
TRIM vs Cons. (%) 32.3% 31.5%
Stock Data
Major Shareholders
Consensus
Stock Price Year end Dec 2014 2015 2016F 2017F 2018F
Net Sales (IDR, bn) 5,140 6,010 6,518 7,823 9,143
Net Profit (IDR, bn) 332 323 518 650 759
EPS (IDR) 117 116 177 218 252
EPS Growth (%) 9.0% -1.1% 52.1% 23.2% 15.6%
DPS (IDR) 10 -1 16 20 24
Dividend yield (%) 946 1,047 1,169 1,351 1,564
P/E (x) 15.9 16.1 10.6 8.6 7.4
P/BV (x) 1.5% -0.2% 2.4% 3.1% 3.6%
Companies Data
Share Price Rp1,870
Sector Consumer Staples
Price Target Rp2,300 (+23%)
Company Update
PT Tiga Pilar Corpora 16.0%
Primanex 12.0%
Others 39.5%
Public 32.5%
Tiga Pilar Sejahtera Rice Mills, the growth engine
Christy Halim

PT Trimegah Securities Tbk - www.trimegah.com MARKET OUTLOOK 79
Valuation
We are assuming coverage on Tiga Pilar (AISA IJ) with a BUY rating and target price of Rp2,300, based on histor-
ical 5-year avg forward P/E of 12.4x. Currently, the stock is trading at 10.3x 1-year forward P/E. Even though
the stock has re-rating by around 68% post GOLL divestment, we view that the stock continues to be attractive,
considering potential future growth on its rice mills and food manufacturing business, improvement on margins
and capital structure as well as being one of the cheapest consumer company compared with its peers. Another
potential re-rating on the stock, BUY!
Figure 47. Target Price
Source: Bloomberg, TRIM Research
Figure 48. 5-year avg forward P/E
Source: TRIM Research
0
3
6
9
12
15
18
21
24
Nov
-13
Dec
-13
Jan-
14
Feb-
14
Mar
-14
Apr-
14
May
-14
Jun-
14
Jul-
14
Aug-
14
Sep-
14
Oct
-14
Nov
-14
Dec
-14
Jan-
15
Feb-
15
Mar
-15
Apr-
15
May
-15
Jun-
15
Jul-
15
Aug-
15
Sep-
15
Oct
-15
Nov
-15
Dec
-15
Jan-
16
Feb-
16
Mar
-16
Apr-
16
May
-16
Jun-
16
Jul-
16
Aug-
16
Sep-
16
Oct
-16
Nov
-16
Fwd PE Avg fwd PE Fwd PER +1 STD
Fwd PER +2 STD Fwd PER -1 STD Fwd PER -2 STD
(x)
Target Price 2,300
5-year avg fwd P/E (x) 12.4
1-year fwd EPS (Rp) 190
Target Price (Rp) 2,300
Current Price (Rp) 1,870
Potential upside/(downside) 23%
2015 2016E 2017E 2018E CAGR16-18E
EPS (Rp) 116 177 218 252 19.4%
P/E at TP 19.8 13.0 10.6 9.1
P/E at current price 17.2 11.3 9.2 7.9

PT Trimegah Securities Tbk - www.trimegah.com MARKET OUTLOOK 80
Income Statement (Rp bn) Balance Sheet (Rp bn)
Cash Flow (Rp bn) Key Ratio Analysis
Interim Results Capital History
Year end Dec 2014 2015 2016F 2017F 2018F
Net revenue 5,140 6,010 6,518 7,823 9,143
Net rev growth (%) 26.7% 16.9% 8.5% 20.0% 16.9%
Gross profit 1041 1274 1592 1881 2189
Opr profit 679 739 1009 1150 1326
EBITDA 779 867 1161 1325 1523
Net income/exp -195 -239 -250 -216 -246
Gain/ (loss) forex 2 5 0 0 0
Other income/(exp) 30 1 5 6 7
Pre-tax profit 484 500 758 934 1080
Tax -106 -127 -190 -234 -270
Minority interest -46 -50 -50 -50 -50
Extra items 0 0 0 0 0
Reported net profit 332 323 518 650 759
Core net profit 330 319 518 650 759
Growth (%) 9.0% -3.3% 62.6% 25.5% 16.8%
Dividend per share 10 -1 16 20 24
Growth (%) 34% -114% -1297% 25% 17%
Dividend payout
ratio 10% -1% 10% 10% 10%
Year end Dec 2014 2015 2016F 2017F 2018F
Cash & cash equiva-
lents 1,217 589 1,917 1,690 1,735
Other curr asset 2,761 3,875 3,084 3,896 4,648
Net fixed asset 1,786 2,290 2,438 2,763 3,066
Other asset 1,611 2,307 823 987 1,154
Total asset 7,374 9,061 8,262 9,337 10,603
ST debt 203 352 200 268 327
Other curr liabilities 1,290 2,399 2,281 2,735 3,195
LT debt 1,307 1,351 469 563 658
Other LT liabilities 988 993 1,000 924 943
Minority interest 542 598 548 497 447
Total liabilities 3,788 5,094 3,950 4,491 5,123
Shareholders equity 3,044 3,369 3,764 4,349 5,033
Net debt/ (cash) 1,866 3,523 1,152 1,715 2,106
Total cap employed 5,881 6,311 5,781 6,334 7,081
Net working capital 1,471 1,476 803 1,161 1,453
Debt 3,082 4,111 3,069 3,405 3,841
Year end Dec 2014 2015 2016F 2017F 2018F
Net profit 332 323 518 650 759
Depr/Amort 99 127 152 175 197
Chg in non-cash work-
ing capital -465 -851 680 -634 -581
Others 387 800 0 0 0
CF's from operations 354 399 1,350 191 375
Capex -462 -847 -300 -500 -500
Others -112 -236 1,484 -165 -167
CF's from investing -574 -1,083 1,184 -665 -667
Net change in debt 1,648 1,012 -1,162 278 367
Others -547 -957 -43 -32 -31
CF's from financing 1,102 55 -1,206 246 336
Net cash flow 882 -629 1,329 -227 45
Cash at BoY 317 1,217 589 1,917 1,690
Cash at EoY 1,217 589 1,917 1,690 1,735
Free Cash Flow -108 -448 1,050 -309 -125
Year end Dec 2014 2015 2016F 2017F 2018F
Profitability
Gross margin 20.2% 21.2% 24.4% 24.0% 23.9%
Opr margin 12.6% 12.2% 15.4% 14.6% 14.4%
EBITDA margin 15.2% 14.4% 17.8% 16.9% 16.7%
Net margin 6.5% 5.4% 8.0% 8.3% 8.3%
ROE 10.9% 9.6% 13.8% 15.0% 15.1%
ROA 4.5% 3.6% 6.3% 7.0% 7.2%
Stability
Current ratio (x) 2.7 1.6 2.0 1.9 1.8
Net debt to equity (x) 0.6 1.0 0.3 0.4 0.4
Net debt to EBITDA (x) 2.4 4.1 1.0 1.3 1.4
Interest coverage (x) 3.3 3.0 3.7 4.7 4.9
Efficiency
A/P (days) 15 21 15 16 17
A/R (days) 79 100 79 85 87
Inventory (days) 99 107 99 102 103
Year end Dec 3Q15 4Q15 1Q16 2Q16 3Q16
Sales 1,346 1,507 1,661 1,909 1,409
Gross Profit 305 357 406 473 376
Operating Profit 168 193 305 310 220
Net Profit 59 69 123 132 91
Gross Margins 22.7% 23.7% 24.4% 24.8% 26.7%
Opr Margins 12.5% 12.8% 18.3% 16.2% 15.6%
Net Margins 4.4% 4.6% 7.4% 6.9% 6.4%
Date
11 June 1997 IPO @ Rp950

MARKET OUTLOOK PT Trimegah Securities Tbk - www.trimegah.com 81
A well established FMCG company With its long history and expertise in FMCG industry, Unilever has now grown its business with 39 brands on more than 1,000 SKUs catering different segments in the market. We believe around 95% of Indonesian
households at least use one of Unilever’s products which suggest its strong position in the market. In addition, Unilever is leading in most of its categories. F&B grew faster, but HPC is catching up We view that F&B will continue to be an important growth engine to Unilever despite of its lower margin as compared to HPC. F&B division
reported 17% growth CAGR10-15, and we expect the trend to continue going forward supported by positive economic outlook next year. Despite of higher growth, HPC continues to dominate Unilever’s total sales proportion. Margins wise, HPC also delivered higher margin com-pared to F&B in which one of the main reason is due to its wider range
of products. Unilever has recently entered into fragrance market, by
launching Molto Eau de Perfume, and Molto premium fabric softener. While its current contribution is still very minimal to total revenue, we are doubtful on public’s acceptance of having perfume and fabric soften-er under same brand. Some cost pressure on board This includes 1) volatility in USD/IDR exchange rate—as around 60% of
its total raw materials are USD denominated 2) Opex—we noted that Unilever’s biggest proportion of opex are A&P, distribution costs, and service fees & royalty expenses. Recently, Unilever is implementing the zero-based budgeting that is initiated by its parent company which is
aimed to evaluate their ads spending and its effectiveness. Defensive stock, but valuation is demanding…
Unilever’s sound fundamentals backed with strong operation and proven long track record made Unilever to be consider as defensive stock. How-ever, the stock has always been trading at a premium compared to other consumer names. The stock has gone up by 11% YTD, while JCI was up by 14% - Unilever has slightly underperformed JCI, we view this is due to the recent decline in the overall market. Thus, we are assum-
ing coverage on Unilever with a Neutral rating and our TP of Rp44,000 based on 3-year average forward P/E of 44.5x. We believe the premium valuation is unjustified as we do not see any strong upcoming catalysts
on the stock. At the same time, business landscape in the ice cream market is getting more competitive with several new player entering the market as well as in HPC division. Currently, Unilever is trading at 40.6x 2017F forward P/E.
Established in 1933, Unilever Indonesia
has currently grown to become one of
Indonesia’s leading FMCG company with
the fourth largest market cap on IDX.
Share Price Rp40,100
Sector Consumer
Price Target Rp44,000(+10%)
Year end Dec 2014 2015 2016F 2017F 2018F
Sales 34,512 36,484 39,921 44,229 48,965
Net Profit 5,944 5,856 6,541 7,543 8,373
EPS (Rp) 779 768 857 989 1097
EPS Growth 11.9% -1.5% 11.7% 15.3% 11.0%
DPS (Rp) 672 733 857 989 1097
BVPS (Rp) 622 633 633 633 633
P/E (x) 51.5 52.2 46.8 40.6 36.5
Div Yield 11.3% 12.4% 14.5% 16.7% 18.5%
Unilever Indonesia Premium valuation for defensive proxy?
NEUTRAL Rp44,000
Reuters Code UNVR.JK
Bloomberg Code UNVR.IJ
Issued Shares 7,630
Mkt Cap. (Rpbn) 305,963
Avg. Value Daily 6 Month (Rpbn)
83.2
52-Wk range 47800 / 34150
Unilever Indonesia Holding BV 85%
Public (<5%) 15%
EPS 16F 17F
Consensus (IDR) 846 946
TRIM vs Cons. (%) 1.3% 4.6%
Company Update
Stock Data
Major Shareholders
Consensus
Stock Price
Companies Data
Christy Halim

PT Trimegah Securities Tbk - www.trimegah.com MARKET OUTLOOK 82
Figure 1. xxx
Source: Company
Tighter competition in ice cream market
Within the F&B division, some brands that become main contributors to Unilever includes Bango, Royco, Sari-
wangi, and Walls. Ice cream itself contributed around 15% to total sales. Despite of the still low ice cream con-
sumption per capita in Indonesia at around 0.6 litres (vs average of 2 litres per annum in several other coun-
tries), we view that the business landscape for ice cream will become more competitive going forward. Unilever
introduced new variants to its ice cream products every year to cater consumer taste and preference better—
several new products that has been launched this year includes Wall’s Solero lime and vanilla split, Wall’s Cor-
netto Royale matcha green tea , Magnum Crème Brulee and limited edition Tiramisu.
Figure 49. The new ice cream variants launched this year
One of the largest competitor to Unilever is Campina in our view, as both produced similar products to the mar-
ket with similar pricing point. However, we noted the recent launch of Glico Wings ice cream early this month to
the market as a result of JV between Wings Group and Ezaki Glico. In the beginning, they will produce and sell
16 products under four brands including Waku Waku, Jcone, Frostbite, and Haku. Our on-the-ground check on
several minimarkets and supermarkets in Jakarta shows that Glico Wings has started to place some freezers in
some Family Mart minimarket in Jakarta while the ice cream products itself will be available by the end of this
month.
According to the company’s recent news, they are expecting to be the third largest ice cream producer in Indo-
nesia with around 10% market share in few upcoming years. In terms of its pricing point, we view that Glico
Wings priced its ice cream relatively cheaper compared to Wall’s and Campina. We believe the existence of Glico
Wings will become a threat to Unilever as Glico is a Japanese confectionary company headquartered in Osaka,
Japan, and its JV partner, Wings Group, has strong local distribution and marketing. At the same time, ice cream
contributed around 15% to total Unilever’s sales currently, and thus, it will eventually be sizeable to Unilever in
the future. On the same note, Indofood CBP (ICBP) is also looking to put more focus on its ice cream business
“Indoeskrim” starting next year.

PT Trimegah Securities Tbk - www.trimegah.com MARKET OUTLOOK 83
Income Statement (Rpbn) Balance Sheet (Rpbn)
Cash Flow Key Ratio Analysis
Interim Results Capital History
Year end Dec 2014 2015 2016F 2017F 2018F
Net revenue 34,512 36,484 39,921 44,229 48,965
Net revenue
growth (%) 12.2% 5.7% 9.4% 10.8% 10.7%
Gross profit 17,207 18,649 20,888 23,961 26,990
Opr profit 8,030 7,944 8,867 10,251 11,376
EBITDA 8,385 8,427 9,476 10,910 12,086
Net income/exp -86 -110 -146 -194 -212
Gain/ (loss) forex 0 0 0 0 0
Other income/(exp) 0 0 0 0 0
Pre-tax profit 7,945 7,834 8,721 10,057 11,164
Tax 2,001 1,978 2,180 2,514 2,791
Minority interest 0 0 0 0 0
Extra items 0 0 0 0 0
Reported net profit 5,944 5,856 6,541 7,543 8,373
Core net profit 5,944 5,856 6,541 7,543 8,373
Growth (%) 11.9% -1.5% 11.7% 15.3% 11.0%
Dividend per share 672 733 857 989 1097
Growth (%) 1% 9.1% 17.0% 15.3% 11.0%
Dividend payout
ratio 86% 95% 100% 100% 100%
Year end Dec 2014 2015 2016F 2017F 2018F
Cash and equivalents 859 628 547 687 930
Other curr asset 5,478 5,995 5,998 6,620 7,337
Net fixed asset 7,348 8,321 9,211 9,552 9,842
Other asset 595 786 767 818 901
Total asset 14,281 15,730 16,523 17,677 19,010
ST debt 1,250 1,700 2,795 3,096 3,428
Other curr liab 7,614 8,428 8,063 8,842 9,756
LT debt 0 0 0 0 0
Other LT Liab 670 775 838 911 999
Minority interest 0 0 0 0 0
Total Liabilities 9,534 10,903 11,695 12,849 14,183
Shareholders Equity 4,747 4,827 4,827 4,827 4,827
Net (debt) / cash 391 1,072 2,248 2,409 2,497
Total cap employed 5,416 5,602 5,665 5,739 5,827
Net Working capital -2,136 -2,433 -2,065 -2,222 -2,419
Debt 1,250 1,700 2,795 3,096 3,428
Year end Dec 2014 2015 2016F 2017F 2018F
Core Net Profit 5,944 5,856 6,541 7,543 8,373
Depr / Amort 354 483 610 660 710
Chg. in non-cash Working
Cap 293 296 -368 157 197
Others -129 -337 0 0 0
CF's from oprs 6,236 6,463 6,299 6,783 8,359
Capex -1,000 -1,100 -1,500 -1,000 -1,000
Others -7 -329 19 -52 -83
CF's from investing -1,007 -1,429 -1,481 -1,052 -1,083
Net change in debt -5,243 -5,325 -5,446 -7,241 -8,041
Others 390 183 63 73 88
CF's from financing -4,854 -5,142 -5,383 -7,168 -7,953
Net cash flow 602 -273 -81 140 244
Cash at BoY 261 859 628 547 687
Cash at EoY 859 628 547 687 930
Free Cashflow 5,463 5,199 5,283 7,359 8,280
Year end Dec 2014 2015 2016F 2017F 2018F
Profitability
Gross Margin 49.9% 51.1% 52.3% 54.2% 55.1%
Opr Margin 23.3% 21.8% 22.2% 23.2% 23.2%
EBITDA Margin 24.3% 23.1% 23.7% 24.7% 24.7%
Core Net Margin 17.2% 16.1% 16.4% 17.1% 17.1%
ROAE 125.2
%
121.3
%
135.5
%
156.2
%
173.4
%
ROAA 41.6% 37.2% 39.6% 42.7% 44.0%
Stability
Current ratio (x) 0.7 0.7 0.6 0.6 0.6
Net Debt to Equity (x) 0.1 0.2 0.5 0.5 0.5
Net Debt to EBITDA (x) 0.0 0.1 0.2 0.2 0.2
Interest Coverage (x) 83.6 65.9 56.4 49.7 49.8
Efficiency
A/P (days) 87 96 87 90 90
A/R (days) 29 30 28 29 29
Inventory (days) 46 47 47 47 47
Year end Dec 3Q15 4Q15 1Q16 2Q16 3Q16
Sales 8,745 8,937 9,988 10,757 9,356
Gross Profit 4,435 4,685 5,021 5,470 4,812
Operating Profit 1,703 2,288 2,147 2,331 1,998
Net Profit 1,253 1,669 1,570 1,728 1,452
Gross Margins 50.7% 52.4% 50.3% 50.9% 51.4%
Opr Margins 19.5% 25.6% 21.5% 21.7% 21.4%
Net Margins 14.3% 18.7% 15.7% 16.1% 15.5%
Date
1-Nov-82 IPO @ Rp3,175
11-Jul-89 1:6 bonus issue
7-Mar-93 6.688:100 bonus issue
1-Feb-98 Company listing
6-Nov-00 1:10 stock split
15-Sep-03 1:10 stock split

MARKET OUTLOOK PT Trimegah Securities Tbk - www.trimegah.com 84
More optimistic on margin expansion!
RALS recorded IDR362bn net profit in 9M16, on the back of strong im-
provement of net margin to 5.6% (vs. 5.0% in 9M15). Margin expansion
was notably due to: 1) Strong SSSG of 7.1% mtd in 9M16, 2) Better
merchandise mix, wherein Direct Purchases (DP) fashion products contin-
ue to post strong growth of 13%, and 3) Improvement in RALS’ super-
market business (“SPAR”) despite still recording a net operating loss of
IDR51bn (vs. IDR88bn net loss in 9M15).
And even more optimistic on 2017 sales growth!
We see that RALS continuously grab market share vs. LPPF thanks to its
successful promotional activities and transformation strategy. We are
optimistic that RALS could achieve 7.0% SSSG next year, especially as
we expect SSSG improvements in outer-Java area thanks to rising coal
price. We also expect margin to further expand in 2017 as we expect DP
products to continue posting strong growth and as more supermarkets
are converted to SPAR which has better profitability.
Greatest beneficiary of rising coal price
While many retailers are focusing growth only in Java area, RALS has had
an established presence in Kalimantan and Sumatera area. In fact, outer
Java area contributed 39.1% to RALS total sales in 10M16 (vs. 33.8% for
Greater Jakarta and 27.1% for the rest of Java). As coal price passed the
USD100/tonne level by the end of last month, we expect further increase
to consumer purchasing power in those areas as small miners resume
their production.
Reiterate BUY with upgraded TP of IDR1,900 (+66% ups.)
We upgraded our net profit estimates by 9.1% and 17.0% in 2016-17F,
respectively, on the back of better-than-expected profit margins—
reiterating our positive view on the company! Our TP is pegged to 1.8x
PEG (-0.5 stdev from 3-years average forward PE) and implies 25.1x
2017F PE.
Ramayana Lestari Sentosa Better and stronger
Kevie Aditya
Share Price Rp1,145
Sector Retail
Price Target Rp1,900 (+66%)
BUY Rp1,900
Reuters Code RALS.JK
Bloomberg Code RALS.IJ
Issued Shares 7,096
Mkt Cap. (Rpbn) 8,125
Avg. Value Daily 6 Month (Rpbn)
13.6
52-Wk range 1410 / 550
PT. Ramayana Makmursentosa 55.9%
Public 44.1%
EPS 16E 17E
Consensus (IDR) 57 66
TRIM vs Cons. (%) 8.6% 13.0%
Company Update
Stock Data
Major Shareholders
Consensus
Stock Price
PT Ramayana Lestari Sentosa Tbk oper-
ates department stores in Indonesia
which sell items such as clothes, acces-
sories, bags, shoes, cosmetics, and daily
needs.
Year end Dec 2015 2016E 2017E 2018E 2019E
Sales 7,786 8,228 9,014 9,990 11,141
Net Profit 322 437 531 607 686
EPS (Rp) 47.4 61.5 74.9 85.5 96.7
EPS Growth (%) -5.3% 29.9% 21.7% 14.2% 13.1%
DPS (Rp) 27 30 39 47 54
BVPS (Rp) 470 546 616 694 784
P/E (x) 24.2 18.6 15.3 13.4 11.8
Div Yield (%) 2.4% 2.6% 3.4% 4.1% 4.7%
Companies Data

PT Trimegah Securities Tbk - www.trimegah.com MARKET OUTLOOK 85
Income Statement (Rpbn)
Year end Dec 2015 2016E 2017E 2018E 2019E
Revenue 7,786 8,228 9,014 9,990 11,141
Revenue Growth (%) -2.0% 5.7% 9.5% 10.8% 11.5%
Gross Profit 1,996 2,204 2,454 2,732 3,047
Opr. Profit 234 363 441 507 578
EBITDA 419 561 662 757 855
EBITDA Growth (%) -
14.5%
33.8% 18.2% 14.3% 13.0%
Net Int Inc/(Exp) 114 110 134 149 165
Gain/(loss) Forex 15 0 0 0 0
Other Inc/(Exp) 2 1 1 1 1
Pre-tax Profit 365 474 576 658 745
Tax (29) (37) (45) (52) (58)
Minority Int. 0 0 0 0 0
Extra. Items 0 0 0 0 0
Reported Net Profit 336 437 531 607 686
Core Net Profit 322 437 531 607 686
Growth (%) -9.1% 35.8% 21.7% 14.2% 13.1%
Dividend per share 27 30 39 47 54
Dividend payout ratio
(%)
54.0% 63.3% 63.3% 63.3% 63.3%
Balance Sheet (Rpbn)
Year end Dec 2015 2016E 2017E 2018E 2019E
Cash and equivalents 844 1,256 1,504 1,768 2,119
Other curr asset 1,987 2,007 2,082 2,180 2,298
Net fixed asset 1,333 1,385 1,640 1,944 2,223
Other asset 1,255 1,667 1,915 2,178 2,529
Total asset 4,575 5,059 5,637 6,303 7,050
ST debt 0 0 0 0 0
Other curr liab 961 902 988 1,095 1,210
LT debt 0 0 0 0 0
Other LT Liab 280 280 280 280 280
Minority interest 0 0 0 0 0
Total Liabilities 1,241 1,182 1,268 1,375 1,490
Shareholders Equity 3,334 3,876 4,368 4,928 5,560
Net debt / (cash) (844) (1,256) (1,504) (1,768) (2,119)
Total cap employed 472 472 472 472 472
Net Working capital 47 (79) 10 9 (2)
Debt 0 0 0 0 0
Cash Flow (Rpbn)
Year end Dec 2015 2016E 2017E 2018E 2019E
Net Profit 336 437 531 607 686
Depr / Amort 186 198 222 250 277
Chg in Working Cap 47 (79) 10 9 (2)
Others 0 0 (0) 0 (0)
CF's from oprs 568 556 764 865 961
Capex (104) (250) (477) (554) (556)
Others 75 (0) 0 0 0
CF's from investing (29) (250) (477) (554) (556)
Net change in debt 0 0 0 0 0
Others (320) 106 (39) (47) (54)
CF's from financing (320) 106 (39) (47) (54)
Net cash flow 219 412 248 264 351
Cash at BoY 625 844 1,256 1,504 1,768
Cash at EoY 844 1,256 1,504 1,768 2,119
Free Cashflow 465 306 287 311 405
Key Ratio Analysis
Year end Dec 2015 2016E 2017E 2018E 2019E
Profitability
Gross Margin (%) 25.6% 26.8% 27.2% 27.3% 27.3%
Opr Margin (%) 3.0% 4.4% 4.9% 5.1% 5.2%
EBITDA Margin (%) 5.4% 6.8% 7.3% 7.6% 7.7%
Core Net Margin (%) 4.1% 5.3% 5.9% 6.1% 6.2%
ROAE (%) 10.1% 12.1% 12.9% 13.1% 13.1%
ROAA (%) 7.4% 9.1% 9.9% 10.2% 10.3%
Stability Current ratio (x) 2.9 3.6 3.6 3.6 3.6
Net Debt to Equity (x) -25% -32% -34% -36% -38%
Net Debt to EBITDA
(x)
-201% -224% -227% -233% -248%
Interest Coverage (x) Efficiency A/P (days) 55.34 51.21 46.56 46.12 45.90
A/R (days) 0.15 0.13 0.10 0.10 0.10
Inventory (days) 51.45 50.56 49.11 48.74 48.56
Interim Result (Rpbn)
2015 2016E 2017E 2018E 2019E
Sales 2,628 1,721 1,485 2,883 2,072
Gross Profit 714 426 394 802 562
Opr. Profit 204 11 (16) 270 107
Net profit 213.66 61.54 8.40 245.65 107.59
Gross Margin (%) 27.2% 24.7% 26.6% 27.8% 27.1%
Opr Margin (%) 7.8% 0.6% -1.0% 9.4% 5.1%
Net Margin (%) 8.1% 3.6% 0.6% 8.5% 5.2%
Capital History
Date
15-Jul-96 IPO @ Rp. 3,200

MARKET OUTLOOK PT Trimegah Securities Tbk - www.trimegah.com 86
We visited Zara Vietnam (operated by MAPI) earlier this month…
The store is located in the heart of Ho Chi Minh city (HCMC) in Vincom
Center B—one of the most prestigious shopping centers in town. The
store is very crowded, not only on weekends but also on weekdays—
definitely a BOOM! The crowd seems to be at least 3x of that in a Jakarta
store—which implies that it should be highly profitable (please refer to
our Walking the Streets: Retailers in Ho Chi Minh report dated Nov 16th,
2016)
Our rough calculation suggests that Zara Vietnam could contrib-
ute at least IDR1bn revenue per day!
Assuming that Zara accounted for 80% Inditex sales (wherein Inditex
contributed 25% of specialty stores’ sales), each store in Jakarta contrib-
utes ~IDR150bn annualized revenue per year in 9M16— approximately
IDR400mn revenue per day. Meanwhile, from 9M16 financial statement,
we can see that Vietnam has contributed IDR40bn after half-month of
opening, so roughly calculating revenue per day will be ~IDR2.5bn. Con-
servatively assuming that sales stabilized after months of opening, we
are confident that Zara Vietnam could still contribute at least IDR1bn
revenue per day (2-3x Zara Indonesia’s revenue)—and thus, IDR360bn
revenue per year!
Conservatively assuming an EBIT margin of 8% (MAPI’s 9M16 specialty
stores’ EBIT margin stands at 6.2%), we expect an additional EBIT of
~IDR30bn/year! Fantastic number, in our view, considering MAPI’s 9M16
EBIT number merely stand at IDR577bn. We expect profit from Vietnam
store to positively affect MAPI’s 4Q16 profitability, noting that Zara Vi-
etnam store has only start operating in mid Sept’16!
Optimistic on our BUY call, increase TP to IDR7,200 (+50% ups!)
In addition to our optimism on Zara Vietnam, we remains optimistic on
further margin expansion on the back of controlled inventory level and
more focused expansion. We now peg our TP to 0.7x PEG, 30% discount
for 3-years average forward PEG. Our TP IDR7,200 implies 23.6x 2017
Core PE and 6.2x 2017F EV/EBITDA. BUY!
Mitra Adi Perkasa Zara Vietnam is the next game changer!
Kevie Aditya
Share Price Rp4,870
Sector Retail
Price Target Rp7,200 (+48%)
BUY Rp7,200
Reuters Code MAPI.JK
Bloomberg Code MAPI.IJ
Issued Shares 1,660
Mkt Cap. (Rpbn) 8,084
Avg. Value Daily 6 Month (Rpbn)
7.9
52-Wk range 5900 / 3500
PT Satya Mulia Gema Gemilang 56.0%
Public 44.0%
EPS 16F 17F
Consensus (Rp) 116 198
TRIM vs Cons. (%) -19.8% 25.0%
Company Update
Stock Data
Major Shareholders
Consensus
Stock Price
PT Mitra Adiperkasa Tbk operates depart-
ment stores and specialty stores selling a
broad range of goods including clothing,
toys, food, and other merchandise.
Year end Dec 2015 2016F 2017F 2018F 2019F
Sales 12,833 14,500 16,687 19,285 22,441
Net Profit 37 154 412 639 877
EPS (Rp) 22 93 248 385 528
Core Net Profit 39 243 507 734 972
Core EPS (Rp) 24 146 305 442 585
Core EPS Growth (%) -45.5% 518.4% 108.6% 44.8% 32.4%
DPS (Rp) 0 3 14 37 58
BVPS (Rp) 1,792 2,028 2,167 2,420 2,795
Core P/E (x) 205.8 33.3 16.0 11.0 8.3
Div Yield (%) 0.0% 0.1% 0.3% 0.8% 1.2%
Companies Data

PT Trimegah Securities Tbk - www.trimegah.com MARKET OUTLOOK 87
Income Statement (Rpbn)
Year end Dec 2015 2016F 2017F 2018F 2019F
Revenue 12,833 14,500 16,687 19,285 22,441
Revenue Growth (%) 8.5% 13.0% 15.1% 15.6% 16.4%
Gross Profit 5,783 6,635 7,720 9,018 10,494
Opr. Profit 523 792 1,053 1,386 1,720
EBITDA 1,120 1,428 1,749 2,147 2,555
EBITDA Growth (%) 2.4% 27.5% 22.4% 22.8% 19.0%
Net Int Inc/(Exp) (388) (434) (324) (278) (216)
Gain/(loss) Forex (32) (22) 0 0 0
Other Inc/(Exp) 46 (56) (43) (43) (43)
Pre-tax Profit 148 280 687 1,065 1,461
Tax (118) (126) (275) (426) (585)
Minority Int. (7) 0 0 0 0
Extra. Items 0 0 0 0 0
Reported Net Profit 37 154 412 639 877
Core Net Profit 39 243 507 734 972
Growth (%) -50.0% 468.9% 122.5% 51.9% 35.7%
Dividend per share 0 3 14 37 58
Dividend payout
ratio (%)
0.0% 15.0% 15.0% 15.0% 15.0%
Balance Sheet (Rpbn)
Year end Dec 2015 2016F 2017F 2018F 2019F
Cash and equivalents 504 1,978 352 466 305
Other curr asset 5,192 5,620 6,202 6,888 7,771
Net fixed asset 2,674 2,560 2,456 2,356 2,252
Other asset 1,113 1,113 1,113 1,113 1,113
Total asset 9,483 11,271 10,123 10,823 11,441
ST debt 937 1,282 621 0 0
Other curr liab 2,354 2,678 2,885 3,130 3,446
LT debt 2,719 3,446 2,520 3,178 2,856
Other LT Liab 498 498 498 498 498
Minority interest 6,508 7,904 6,525 6,807 6,801
Total Liabilities 0 0 0 0 0
Shareholders Equity 2,975 3,366 3,597 4,017 4,640
Net debt / (cash) 3,152 2,750 2,790 2,712 2,551
Total cap employed 6,192 7,311 6,616 7,693 7,994
Net Working capital 2,838 2,942 3,317 3,759 4,325
Debt 3,656 4,729 3,142 3,179 2,856
Cash Flow (Rpbn)
Year end Dec 2015 2016F 2017F 2018F 2019F
Net Profit 30 154 412 639 877
Depr / Amort 597 636 695 761 834
Chg in Working Cap (379) (107) (374) (442) (566)
Others 7 0 0 0 0
CF's from oprs 255 683 733 958 1,145
Capex (592) (522) (591) (661) (730)
Others (59) 0 0 0 0
CF's from investing (651) (522) (591) (661) (730)
Net change in debt 558 1,073 (1,587) 37 (322)
Others (19) 238 (181) (220) (254)
CF's from financing 539 1,310 (1,768) (183) (576)
Net cash flow 143 1,471 (1,626) 115 (161)
Cash at BoY 513 504 1,978 352 466
Cash at EoY 504 1,978 352 466 305
Free Cashflow (268) 443 361 490 570
Key Ratio Analysis
Year end Dec 2015 2016F 2017F 2018F 2019F
Profitability
Gross Margin (%) 45.1% 45.8% 46.3% 46.8% 46.8%
Opr Margin (%) 4.1% 5.5% 6.3% 7.2% 7.7%
EBITDA Margin (%) 8.7% 9.8% 10.5% 11.1% 11.4%
Core Net Margin (%) 0.3% 1.4% 2.6% 3.4% 4.0%
ROAE (%) 1.3% 6.2% 12.6% 17.5% 20.9%
ROAA (%) 0.4% 1.9% 4.1% 6.4% 8.1%
Stability Current ratio (x) 1.7 1.9 1.9 2.3 2.3
Net Debt to Equity (x) 1.1 0.8 0.8 0.7 0.5
Net Debt to EBITDA
(x)
2.8 1.9 1.6 1.3 1.0
Interest Coverage (x) 1.3 1.8 3.3 5.0 8.0
Efficiency A/P (days) 58 65 64 64 64
A/R (days) 9 9 9 9 9
Inventory (days) 171 171 171 171 171
Interim Result (Rpbn)
3Q15 4Q15 1Q16 2Q16 3Q16
Sales 3,299 3,432 3,167 3,494 3,629
Gross Profit 1,477 1,598 1,448 1,604 1,682
Opr. Profit 115 217 131 215 232
Net profit (6) 10 15 31 74
Gross Margin (%) 44.8% 46.6% 45.7% 45.9% 46.3%
Opr Margin (%) 3.5% 6.3% 4.1% 6.1% 6.4%
Net Margin (%) -0.2% 0.3% 0.5% 0.9% 2.0%
Capital History
Date
10-Nov-04 IPO @ Rp625

MARKET OUTLOOK PT Trimegah Securities Tbk - www.trimegah.com 88
3Q16 result is indeed disappointing, but looks priced in
LPPF posted a –22.2% SSSG in 3Q16 alone, a bit disappointing even after
taking into account the seasonality basis (it was lower than management’s
guidance of –18-20% SSSG). Cumulative SSSG currently stands at 6.0%,
hence management decided to change their FY16 SSSG forecast to 5.0-
6.5% (vs. previous guidance of 7.0-7.5%).
The lower-than-expected 3Q SSSG was mainly attributed to the weakening
sales of consignment products, which affects Greater Jakarta the most
(which has higher sales contribution coming from consignment products). An
internal assortment problem on ladies’ and girls’ apparels are mentioned to
be the cause of weakening consignment sales. Management is confidence
that the problem is temporary, but we believe we have yet to see further
progress on this issue.
However, we see that LPPF’s share price has fallen by 24% during the past 3
months (while JCI rose 1%!), so it seems that investors have been pricing in
the 3Q result, in our view.
Nevertheless, 9M16 EBIT margin expanded by 70bps to 26.9%
Despite weak sales growth, LPPF’s merchandise margins have continued to
improve (on the back of higher portion of Direct Purchase products) and
efficiency is coming from the use of LTE lighting (utilities & telco accounted
for 2.8% of sales in 9M16 vs. 3.9% in 9M15). Ytd, a total of 110 out of 148
stores have used LTE lighting.
Still bullish on better purchasing power next year, but expect con-
servative SSSG for LPPF on the back of tightening competition
We expect to end the year with a 5.5% SSSG, and expect SSSG to strength-
en to 6.0% by the end of next year. Our SSSG is considerably conservative,
in our view, considering that LPPF posted double digits SSSG during years
2010-14. Although we are bullish on better purchasing power next year, we
are concerned on more competition coming from RALS (Buy, TP IDR1,900)
that has shown good progress on its transformation and is likely to gain
more market share, in our view.
Undemanding valuation! Maintain BUY with lower TP of IDR20,000
LPPF is currently trading at 18.7x 2017F P/E, trading at below –2SD of its 3-
years historical forward PE band. It is indeed an attractive entry point, in our
view, especially after considering that LPPF is still a solid company with
continuously improving sales and profitability margins. We now peg our
valuation to 1.6x PEG, in order to better accommodate the slower EPS
growth that we expect in the upcoming years. Our target price reflects 24.3x
2017F PE.
PT Matahari Department Store Tbk en-
gages in the retail business for several
types of products such as clothes, acces-
sories, bags, shoes, cosmetics, house-
hold appliances, and management con-
Share Price Rp14,250
Sector Retail
Price Target Rp20,000 (+40%)
Year end 31 Dec 2015 2016F 2017F 2018F 2019F
Sales 16,083 17,606 19,768 22,449 25,432
Core Net Profit 1,774 2,078 2,400 2,764 3,181
Core EPS (Rp) 608 712 823 948 1,090
EPS Growth (%) 23.2% 17.1% 15.5% 15.2% 15.1%
DPS (Rp) 292 427 499 576 663
BVPS (Rp) 379 664 988 1,360 1,787
P/E (x) 23.4 20.0 17.3 15.0 13.1
Div Yield (%) 2.0% 2.9% 3.4% 3.9% 4.5%
Matahari Department Store Cheap valuation, weak 3Q result seems priced in
BUY Rp20,000
Reuters Code LPPF.JK
Bloomberg Code LPPF.IJ
Issued Shares 2,918
Mkt Cap. (Rpbn) 41,580
Avg. Value Daily 6 Month (Rpbn)
106.2
52-Wk range 22575 / 13325
PT. Multipolar Tbk 17.5%
Public (<5%) 82.5%
EPS 16F 17F
Consensus (IDR) 735 842
TRIM vs Cons. (%) -3.2% -2.3%
Company Update
Stock Data
Major Shareholders
Consensus
Stock Price Company Data
Kevie Aditya

PT Trimegah Securities Tbk - www.trimegah.com MARKET OUTLOOK 89
Income Statement (Rpbn)
Year end Dec 2014 2015 2016F 2017F 2018F
Revenue 14,451 16,083 17,606 19,768 22,449
Revenue Growth (%) 17.3% 13.6% 10.9% 12.7% 13.6%
Gross Profit 5,048 5,671 6,295 7,112 8,077
Opr. Profit 2,111 2,330 2,600 2,993 3,437
EBITDA 2,339 2,570 2,867 3,294 3,779
EBITDA Growth (%) 17.7% 9.9% 11.6% 14.9% 14.7%
Net Int Inc/(Exp) (233) (93) 19 33 47
Gain/(loss) Forex 0 0 0 0 0
Other Inc/(Exp) (27) 8 0 0 0
Pre-tax Profit 1,851 2,245 2,619 3,026 3,484
Tax (431) (464) (541) (625) (720)
Minority Int. 0 0 0 0 0
Extra. Items 0 0 0 0 0
Reported Net Profit 1,419 1,781 2,078 2,400 2,764
Core Net Profit 1,440 1,774 2,078 2,400 2,764
Growth (%) 23.4% 25.5% 16.7% 15.5% 15.2%
Dividend per share 158 292 427 499 576
Dividend payout ratio 40.0% 60.0% 70.0% 70.0% 70.0%
Balance Sheet (Rpbn)
Year end 31 Dec 2014 2015 2016F 2017F 2018F
Cash and equivalents 786 947 1,653 2,373 3,333
Other curr asset 1,332 1,326 1,444 1,715 1,914
Net fixed asset 726 877 1,040 1,222 1,428
Other asset 569 740 740 740 740
Total asset 3,413 3,889 4,876 6,049 7,416
ST debt 279 0 0 0 0
Other curr liab 2,240 2,439 2,594 2,822 3,104
LT debt 410 0 0 0 0
Other LT Liab 325 344 344 344 344
Minority interest 0 0 0 0 0
Total Liabilities 3,254 2,783 2,939 3,166 3,449
Shareholders Equity 159 1,106 1,937 2,883 3,967
Net debt / (cash) (97) (947) (1,653) (2,373) (3,333)
Total cap employed 894 1,450 2,281 3,227 4,311
Net Working capital (908) (1,113) (1,151) (1,107) (1,190)
Debt 689 0 0 0 0
Cash Flow (Rpbn)
Year end 31 Dec 2014 2015 2016F 2017F 2018F
Net Profit 1,419 1,781 2,078 2,400 2,764
Depr / Amort 228 241 267 301 342
Chg in Working Cap 227 227 38 (44) 83
Others 179 196 0 0 0
CF's from oprs 1,874 2,249 2,383 2,657 3,189
Capex (171) (334) (430) (483) (549)
Others (98) (129) 0 0 0
CF's from investing (269) (463) (430) (483) (549)
Net change in debt (988) (700) 0 0 0
Others (629) (925) (1,247) (1,454) (1,680)
CF's from financing (1,617) (1,625) (1,247) (1,454) (1,680)
Net cash flow (12) 161 706 720 960
Cash at BoY 798 786 947 1,653 2,373
Cash at EoY 786 947 1,653 2,373 3,333
Free Cashflow 1,903 1,982 1,938 2,148 2,603
Key Ratio Analysis
Year end 31 Dec 2014 2015 2016F 2017F 2018F
Profitability Gross Margin (%) 34.9% 35.3% 35.8% 36.0% 36.0%
Opr Margin (%) 14.6% 14.5% 14.8% 15.1% 15.3%
EBITDA Margin (%) 16.2% 16.0% 16.3% 16.7% 16.8%
Core Net Margin
(%)
10.0% 11.0% 11.8% 12.1% 12.3%
ROAE (%) -447.9% 281.5% 136.5% 99.6% 80.7%
ROAA (%) 44.7% 48.8% 42.6% 39.7% 37.3%
Stability Current ratio (x) 0.8 0.9 1.2 1.4 1.7
Net Debt to Equity
(x)
(0.6) (0.9) (0.9) (0.8) (0.8)
Net Debt to EBITDA
(x)
(0.0) (0.4) (0.6) (0.7) (0.9)
Interest Coverage
(x)
9.0 25.1 (137.3) (90.5) (72.4)
Efficiency A/P (days) 181 181 176 170 174
A/R (days) 5 3 3 3 3
Inventory (days) 120 109 109 120 120
Interim Result (Rpbn)
3Q15 4Q15 1Q16 2Q16 3Q16
Sales 5,260 3,891 3,279 5,770 4,186
Gross Profit 1,812 1,378 1,162 2,122 1,468
Opr. Profit 927 544 367 1,155 560
Net profit 736 397 244 913 453
Gross Margins (%) 34.4% 35.4% 35.4% 36.8% 35.1%
Opr Margins (%) 17.6% 14.0% 11.2% 20.0% 13.4%
Net Margins (%) 14.0% 10.2% 7.4% 15.8% 10.8%
Capital History
Date
October-1989 IPO @IDR7,900
July-1990 1:5 Bonus Issue
July-1992 2:1 Bonus Issue
July-1994 1:5 Stock Div
June-1997 Founder Shareholder
July-2001 Right Issue
November-2009 Reverse Stock 5:1
December-2009 Additional share HMETD

MARKET OUTLOOK PT Trimegah Securities Tbk - www.trimegah.com 90
No surprise in 9M16, in-line!
ERAA booked IDR15.6bn revenue in 9M16, up by 11.8% YoY and is in-
line with our estimates. We remain optimistic on ERAA’s performance
until the end of this year—especially as ERAA usually book better sales
during year-end. Gross margin slightly improved to 8.2% (vs. 7.9% in
9M15) on the back of 1) Increased contribution from retail sales which
have better margins, 2) Better margins from ERAA’s handset sales, and
3) Rapid growth of accessories sales which have higher margins.
Rapid expansion of retail outlets
Until 9M16, ERAA had expanded its retail outlets to a total of 668 outlets
(vs. 603 outlets in 2Q16 and 556 outlets in 4Q15!). We see this as ER-
AA’s commitment to further increase their higher margin retail sales
contribution—as it aims for 45% of its total sales to come from its retail
business.
Samsung’s Galaxy Note 7 recall: merely a lost opportunity
We knew that the failure of Galaxy Note 7 has negatively impact ERAA’s
share price in the past few months. However, we learnt that the inci-
dence neither negatively impact ERAA’s sales nor profitability because all
the loss was handled by Samsung (those who have pre-ordered through
ERAA was given a IDR1mn shopping voucher).
Nevertheless, we see the incidence as a lost opportunity. We strongly
believe ERAA’s earnings could easily surpass our numbers if they suc-
cessfully marketed Galaxy Note 7—noting that the phone was highly
sought during the pre-order period.
Local contents regulation (“TKDN”) is a definite positive for ERAA
ERAA is on the process of contract negotiation with two international
manufacturers, as many manufacturers are trying to fulfill the TKDN
requirement as soon as possible. Lately we also see less competition
from online retailers, as now they have to comply to the regulation—
thus, not selling handsets that have not fulfilled “TKDN”.
Maintain BUY with lower TP IDR800
We maintain our forecast for ERAA, but lower our TP to IDR800 as we
now peg our TP to 8.0x 2017F PE (-0.7SD from its 3-years average for-
ward PE). Note that ERAA is still the cheapest retailer in our universe,
currently trading at merely 6.1x 2017F P/E.
Erajaya Swasembada Continues to execute well
Kevie Aditya
Share Price Rp605
Sector Retail
Price Target Rp800 (+32%)
BUY Rp800
Reuters Code ERAA.JK
Bloomberg Code ERAA.IJ
Issued Shares 2,900
Mkt Cap. (Rpbn) 1,755
Avg. Value Daily 6 Month (Rpbn)
8.0
52-Wk range 930 / 482
PT Eralink International 60.0%
Public 40.0%
EPS 16E 17E
Consensus (IDR) 94 108
TRIM vs Cons. (%) -9.6% -7.4%
Company Update
Stock Data
Major Shareholders
Consensus
Stock Price
PT Erajaya Swasembada Tbk distributes
and retails cellular telephones. The
Company is licensed to distribute inter-
national brands of cell phones, and oper-
ates a chain of retail shops in Indonesia.
Companies Data
Year end Dec 2015 2016F 2017F 2018F 2019F
Revenue 20,008 23,211 25,721 28,277 30,835
Net Profit 226 247 290 363 410
EPS 78 85 100 125 141
Core Profit 226 247 290 363 410
Profit Growth (%) 6.9% 9.3% 17.5% 25.1% 12.8%
Core EPS (Rp) 78 85 100 125 141
DPS (Rp) 20 20 25 30 50
Core P/E (x) 7.8 7.1 6.1 4.8 4.3
EV/EBITDA (x) 6.9 7.2 6.3 6.5 6.0
Div Yield (%) 3.7% 3.3% 4.1% 5.0% 5.9%

PT Trimegah Securities Tbk - www.trimegah.com MARKET OUTLOOK 91
Income Statement (Rpbn) Balance Sheet (Rpbn)
Cash Flow (Rpbn) Key Ratio Analysis
Interim Result (Rpbn)
2Q15 3Q15 4Q15 1Q16 2Q16
Sales 4,732 5,267 6,057 4,850 5,512
Gross Profit 363 384 401 409 469
EBITDA 118 124 136 144 159
Opr. Profit 103 113 123 129 144
Net profit 40 54 62 61 65
Core profit 40 54 62 61 65
Gross Margins (%) 7.7% 7.3% 6.6% 8.4% 8.5%
EBITDA Margins (%) 2.5% 2.4% 2.3% 3.0% 2.9%
Opr Margins (%) 2.2% 2.1% 2.0% 2.6% 2.6%
Net Margins (%) 0.8% 1.0% 1.0% 1.3% 1.2%
Core Margins (%) 0.8% 1.0% 1.0% 1.3% 1.2%
Capital History
Date
14-Dec-11 IPO@Rp1,000
Year end Dec 2014 2015 2016F 2017F 2018F
Revenue 14,451 20,008 23,211 25,721 28,277
Revenue Growth (%) 14% 38% 16% 11% 10%
Gross Profit 1,289 1,506 1,834 2,019 2,234
Opr. Profit 409 393 408 473 558
EBITDA 449 440 457 524 613
EBITDA Growth (%) -14% -2% 4% 15% 17%
Net Int Inc/(Exp) -89 -181 -154 -161 -174
Gain/(loss) Forex -1 -5 -2 -3 0
Other Inc/(Exp) 69 87 87 94 98
Pre-tax Profit 296 320 332 389 484
Tax 82 91 83 97 121
Minority Int. 3 4 3 3 3
Extra. Items 0 0 0 0 0
Reported Net Profit 212 226 246 289 360
Core Net Profit 212 226 246 289 360
growth (%) -39% 7% 9% 17% 25%
Dividend per share 0 20 20 25 30
growth (%) -1 N/A 0% 27% 17%
Dividend payout ratio 0% 27% 26% 30% 30%
Year end Dec 2014 2015 2016F 2017F 2018F
Cash and equivalents 170 127 42 140 185
Other curr asset 4,124 5,339 5,805 6,060 6,514
Net fixed asset 402 437 466 495 522
Other asset 1,430 1,898 1,970 1,977 1,987
Total asset 6,126 7,800 8,283 8,671 9,209
ST debt 1,439 1,450 1,350 1,350 350
Other curr liab 1,474 2,945 3,280 3,438 3,585
LT debt 124 140 186 186 1,286
Other LT Liab 76 60 67 75 84
Minority interest 53 67 74 81 89
Total Liabilities 3,112 4,595 4,883 5,048 5,304
Shareholders Equity 3,014 3,205 3,400 3,623 3,904
Net cash (debt) (1,393) (1,463) (1,494) (1,396) (1,450)
Total cap employed 3,053 2,830 2,991 3,117 3,451
Net Working capital 2,650 2,394 2,524 2,622 2,929
Debt 1,563 1,590 1,536 1,536 1,636
Year end Dec 2014 2015 2016F 2017F 2018F
Net Profit 212 226 246 289 360
Depr / Amort 40 48 49 52 55
Chg in Working Cap -147 197 -133 -110 -284
Others -297 -428 -70 6 -33
CF's from oprs -193 43 92 237 98
Capex -168 -75 -78 -80 -82
Others -22 12 0 0 0
CF's from investing -190 -62 -78 -80 -82
Net change in debt 390 49 -76 0 100
Others 82 -72 -22 -59 -70
CF's from financing 472 -23 -98 -59 30
Net cash flow 89 -43 -85 98 46
Cash at BoY 80 170 127 42 140
Cash at EoY 170 127 42 140 185
Free Cashflow -360 -32 14 156 15
Year end Dec 2014 2015 2016F 2017F 2018F
Profitability
Gross Margin (%) 8.9% 7.5% 7.9% 7.8% 7.9%
Opr Margin (%) 2.8% 2.0% 1.8% 1.8% 2.0%
EBITDA Margin (%) 3.1% 2.2% 2.0% 2.0% 2.2%
Core Net Margin (%) 1.5% 1.1% 1.1% 1.1% 1.3%
ROAE (%) 7.3% 7.3% 7.5% 8.2% 9.6%
ROAA (%) 3.8% 3.2% 3.1% 3.4% 4.0%
Stability
Current ratio (x) 1.5 1.2 1.3 1.3 1.7
Net Debt to Equity (x) 0.5 0.5 0.4 0.4 0.4
Net Debt to EBITDA (x) 3.1 3.3 3.3 2.7 2.4
Interest Coverage (x) 2.2 2.5 2.5 2.7 3.2
Efficiency A/P (days) 33 51 49 46 43
A/R (days) 32 34 34 34 34
Inventory (days) 55 50 46 45 44

MARKET OUTLOOK PT Trimegah Securities Tbk - www.trimegah.com 92
10M16 numbers show improvement in terms of sales
ACES managed to book strong performance in 10M16 with 3.7% SSSG,
in our view, considering that last year was its 20th Anniversary Boom
Sale—drawing optimism to recovery in 4Q16 despite disappointing 3Q16.
We revised our SSSG target to 1.5% for this year (from 2.5% previously)
on the back of its disappointing 3Q. Note that 10M16 SSSG stands at
1.1%, so we expect ACES to maintain its strong performance in the last 2
months of this year.
More optimistic on next year, although remains conservative
We expect 3.0% SSSG next year on the back of our optimism towards
better consumer purchasing power for middle-upper segment next year,
post-tax amnesty. As seen in our proprietary survey (see page 63), there
is indeed growing appetite to purchase property next year. Although it is
still too early to judge on how this is going to impact ACES, we definitely
see this as a positive trend for ACES. Note that we view 3.0% SSSG as a
very conservative number considering that ACES booked >5.0% SSSG in
the years 2010-13.
Share price has dropped 16% in the last 3 months
We view that the stock has been over-punished over the past few months
on the back of its disappointing sales figure in 3Q16. Nevertheless, we
admire ACES for being able to maintain its profitability margins at a
respectable level (12.4% EBIT margin in 9M16 vs. 12.9% in 9M15).
Thus, we upgrade our call to BUY with maintained TP of IDR950
(+12% ups.)
We pegged our TP to 1.6x PEG (with 13.5% EPS CAGR 2017-20F), imply-
ing 20.9x 2017F PE—which is ACES’ 3-years average forward PE. Down-
side risks to our call include: 1) Rupiah depreciation that lowers consum-
er’s purchasing power (note that for ACES, Rupiah depreciation is passed
on to customers), and 2) Further slowdown of property market.
Ace Hardware Indonesia Has been overpunished, upgrade to Buy!
Kevie Aditya
Share Price Rp845
Sector Retail
Price Target Rp950 (+12%)
BUY Rp950
Reuters Code ACES.JK
Bloomberg Code ACES.IJ
Issued Shares 17,150
Mkt Cap. (Rpbn) 14,492
Avg. Value Daily 6 Month (Rpbn)
5.0
52-Wk range 1040 / 730
PT Kawan Lama Sejahtera 60.0%
Public 40.0%
EPS 16E 17E
Consensus (IDR) 36 40
TRIM vs Cons. (%) 23.3% 12.8%
Company Update
Stock Data
Major Shareholders
Consensus
Stock Price Year end Dec 2015 2016E 2017E 2018E 2019E
Sales 4,743 5,058 5,625 6,261 6,973
Net Profit 568 681 774 872 986
EPS (Rp) 33 40 45 51 58
EPS Growth (%) 2.9% 19.9% 13.5% 12.7% 13.1%
DPS (Rp) 16 17 21 22 25
BVPS (Rp) 154 181 205 234 267
P/E (x) 25.0 20.9 18.4 16.3 14.4
Div Yield (%) 1.9% 2.0% 2.5% 2.6% 3.0%
Companies Data
Ace Hardware Indonesia is a home
improvement and lifestyle retailer es-
tablished by a reputable Kawan La-
ma Group. They cater middle-class
consumers with more than 70,000 SKUs.

PT Trimegah Securities Tbk - www.trimegah.com MARKET OUTLOOK 93
Income Statement (Rpbn)
Year end Dec 2015 2016E 2017E 2018E 2019E
Revenue 4,743 5,058 5,625 6,261 6,973
Revenue Growth (%) 4.4% 6.7% 11.2% 11.3% 11.4%
Gross Profit 2,254 2,403 2,693 3,016 3,378
Opr. Profit 688 697 790 893 1,012
EBITDA 778 791 906 1,032 1,177
EBITDA Growth (%) 3.8% 1.7% 14.5% 13.9% 14.1%
Net Int Inc/(Exp) 6 12 20 23 27
Gain/(loss) Forex 16 0 0 0 0
Other Inc/(Exp) 26 197 134 149 166
Pre-tax Profit 737 906 945 1,065 1,205
Tax (152) (168) (176) (198) (224)
Minority Int. (3) (4) (5) (5) (6)
Extra. Items 0 0 0 0 0
Reported Net Profit 588 742 774 872 986
Core Net Profit 568 681 774 872 986
Growth (%) 2.9% 10.8% 14.3% 13.0% 13.5%
Dividend per share 16.0 16.7 21.1 22.0 24.8
Dividend payout ratio
(%)
48.5% 48.5% 48.5% 48.5% 48.5%
Balance Sheet (Rpbn)
Year end Dec 2015 2016E 2017E 2018E 2019E
Cash and equivalents 622 873 989 1,169 1,393
Other curr asset 1,846 1,978 2,175 2,397 2,644
Net fixed asset 457 487 584 680 773
Other asset 343 361 374 389 406
Total asset 3,268 3,698 4,123 4,635 5,216
ST debt 23 0 0 0 0
Other curr liab 389 391 406 427 450
LT debt 0 0 0 0 0
Other LT Liab 226 226 226 226 226
Minority interest 1 (4) (8) (13) (19)
Total Liabilities 639 617 632 653 676
Shareholders Equity 2,628 3,084 3,498 3,995 4,559
Net debt / (cash) (599) (873) (989) (1,169) (1,393)
Total cap employed 2,855 3,307 3,717 4,208 4,766
Net Working capital 2,055 2,460 2,758 3,139 3,587
Debt 23 0 0 0 0
Cash Flow (Rpbn)
Year end Dec 2015 2016E 2017E 2018E 2019E
Net Profit 588 742 774 872 986
Depr / Amort 82 94 116 139 165
Chg in Working Cap (24) (142) (196) (217) (241)
Others 41 6 0 0 0
CF's from oprs 643 690 689 789 905
Capex (130) (124) (213) (235) (258)
Others 7 0 0 0 0
CF's from investing (124) (124) (213) (235) (258)
Net change in debt (4) (23) 0 0 0
Others (290) (285) (360) (375) (423)
CF's from financing (294) (308) (360) (375) (423)
Net cash flow 225 257 116 180 224
Cash at BoY 391 616 873 989 1,169
Cash at EoY 616 873 989 1,169 1,393
Free Cashflow 513 566 476 555 647
Key Ratio Analysis
Year end Dec 2015 2016E 2017E 2018E 2019E
Profitability
Gross Margin (%) 47.5 47.5 47.9 48.2 48.4
Opr Margin (%) 14.5 13.8 14.0 14.3 14.5
EBITDA Margin (%) 16.4 15.6 16.1 16.5 16.9
Core Net Margin (%) 11.1 11.5 11.8 12.0 12.2
ROAE (%) 23.8 26.0 23.5 23.3 23.1
ROAA (%) 18.9 21.3 19.8 19.9 20.0
Stability
Current ratio (x) 6.0 7.3 7.8 8.4 9.0
Net Debt to Equity (x) (0.2) (0.3) (0.3) (0.3) (0.3)
Net Debt to EBITDA
(x)
(0.8) (1.1) (1.1) (1.1) (1.2)
Interest Coverage (x) 224.9 263.8 NA! NA NA
Efficiency
A/P (days) 17 16 16 15.9 15.9
A/R (days) 1.2 1.2 1.6 1.6 1.6
Inventory (days) 220 220 220 220.2 220.2
Interim Result (Rpbn)
3Q15 4Q15 1Q16 2Q16 3Q16
Sales 1,235 1,287 1,161 1,177 1,213
Gross Profit 597 605 556 554 578
Opr. Profit 173 242 159 99 181
Net profit 195 195 140 99 238
Gross Margin (%) 48.3% 47.0% 47.9% 47.1% 47.6%
Opr Margin (%) 14.0% 18.8% 13.7% 8.4% 14.9%
Net Margin (%) 15.8% 15.2% 12.0% 8.4% 19.6%
Capital History
Date

MARKET OUTLOOK PT Trimegah Securities Tbk - www.trimegah.com 94
Expect FY16 sales to remain flat until the end of this year
Although we remains positive on better consumer purchasing power this
4Q16, we expect MPPA’s sales figure to stay flat at IDR14.2tn (+1.7%
yoy). We also remain cautious on threats from minimarkets, highlighting
on the good result posted by one of the minimarket players AMRT, which
revenue increases by 18% yoy to IDR41.4tn in 9M16.
Profitability margins are still under-pressure
Even though they are done with inventory actions occurred in the 1H16,
3Q16 EBIT margin is still weak at 2.7% as we see pressures coming from
an increase of rental and salary expenses. Moreover. we don’t expect to
improve much in either 4Q16 or even going forward to next year.
Despite its strong presence in outer Java area, we don’t see MPPA
as the main beneficiary of rising coal price
Coal price has passed the USD100/ton level by the end of last month.
Even though MPPA has established a strong presence in outer Java area
(vs. its hypermarket competitors Carrefour and Giant Ekspres) we are
also still worried on the pressures from the minimarkets which has also
established strong network there.
The good thing is, we see inventory trending down
We see that inventory has consistently fall from 116 days in 1H15 to 84
days in 9M16—definitely a positive. To further create efficiency, MPPA 1)
plans to cut their number of SKUs from 140,000 to 40,000, and 2) has
changed their accounting policy by implementing a shift to the cost
method of inventory valuation—thus, it could better track its sales perfor-
mance and the profitability of each product.
Cut our earnings by 41%/23% for 2016/17F, downgrade to Sell
with TP IDR1,500
We pegged our valuation to 29.3x 2017F PE, which is the 3-years aver-
age forward PE for the year 2012-14 (before inventory problem oc-
curred). Although we definitely see MPPA improving next year, we still
view the stock as expensive in terms of valuation—thus, downgrading our
call to Sell. Upside to our call will include 1) Better than expected SSSG
(especially in outer Java areas, where coal price is rising), 2) Better than
expected marketing income.
Matahari Putra Prima Valuation remains unattractive
Kevie Aditya
Share Price Rp1,700
Sector Retail
Price Target Rp1,500 (-12%)
SELL Rp1,500
Reuters Code MPPA.JK
Bloomberg Code MPPA.IJ
Issued Shares 5,378
Mkt Cap. (Rpbn) 9,143
Avg. Value Daily 6 Month (Rpbn)
10.5
52-Wk range 2130 / 1185
PT. Multipolar Tbk 50.2%
Prime Star Investment Pte.Ltd. 26.1%
Public 23.7%
EPS 16E 17E
Consensus (Rp) 25 61
TRIM vs Cons. (%) -40.4% -15.4%
Company Update
Stock Data
Major Shareholders
Consensus
Stock Price
PT Matahari Putra Prima Tbk operates re-
tail stores. The Company focuses on
merchandising operations which includes
general merchandise and food discount
stores, including hypermarkets. Matahari
Putra Prima offers its services throughout
Indonesia.
Year end Dec 2015 2016E 2017E 2018E 2019E
Sales 13,929 14,163 16,332 18,925 21,736
Net Profit 183 82 280 325 381
EPS (Rp) 34 15 52 61 71
Core Net Profit 194 82 280 325 381
Core EPS (Rp) 36 15 52 61 71
Core EPS Growth (%) -61.6% -57.7% 241.6% 16.2% 16.9%
DPS (Rp) 43 33 31 24 28
BVPS (Rp) 516 488 507.4 536.7 583.3
Core P/E (x) 47.2 111.5 32.6 28.1 24.0
Div Yield (%) 2.5% 1.9% 1.8% 1.4% 1.7%
Companies Data

PT Trimegah Securities Tbk - www.trimegah.com MARKET OUTLOOK 95
Income Statement (Rpbn)
Year end Dec 2015 2016E 2017E 2018E 2019E
Revenue 13,929 14,163 16,332 18,925 21,736
Revenue Growth (%) 2.5% 1.7% 15.3% 15.9% 14.9%
Gross Profit 2,356 2,339 2,796 3,259 3,764
Opr. Profit 282 167 433 502 575
EBITDA 588 524 852 986 1,130
EBITDA Growth (%) -38.4% -10.8% 62.5% 15.8% 14.5%
Net Int Inc/(Exp) -36 -71 -76 -88 -90
Gain/(loss) Forex 0 0 0 0 0
Other Inc/(Exp) -14 0 0 0 0
Pre-tax Profit 233 96 357 415 485
Tax -50 -14 -77 -89 -104
Minority Int. 0 0 0 0 0
Extra. Items 0 0 0 0 0
Reported Net Profit 183 82 280 325 381
Core Net Profit 194 82 280 325 381
Growth (%) -61.6% -57.7% 241.6% 16.2% 16.9%
Dividend per share 43 33 31 24 28
Dividend payout
ratio (%)
41.7% 97.0% 60.0% 40.0% 40.0%
Balance Sheet (Rpbn)
Year end Dec 2015 2016E 2017E 2018E 2019E
Cash and equivalents 409 175 206 336 510
Other curr asset 3,562 3,512 3,779 4,101 4,418
Net fixed asset 1,462 1,575 1,741 1,880 1,991
Other asset 861 861 861 861 861
Total asset 6,294 6,123 6,587 7,179 7,781
ST debt 250 0 0 0 0
Other curr liab 2,565 2,603 2,864 3,189 3,540
LT debt 400 590 690 800 800
Other LT Liab 304 304 304 304 304
Minority interest 0 0 0 0 0
Total Liabilities 3,519 3,497 3,858 4,292 4,644
Shareholders Equity 2,776 2,626 2,729 2,886 3,137
Net debt / (cash) -241 -415 -484 -464 -290
Total cap employed 3,480 3,520 3,723 3,990 4,241
Net Working capital 1,156 1,084 1,121 1,249 1,388
Debt 650 590 690 800 800
Cash Flow (Rpbn)
Year end Dec 2015 2016E 2017E 2018E 2019E
Net Profit 194 82 280 325 381
Depr / Amort 307 357 419 484 555
Chg in Working Cap -594 88 -6 2 34
Others -49 -49 -49 -49 -49
CF's from oprs -141 479 644 764 921
Capex -494 -470 -585 -624 -666
Others -89 4 4 4 4
CF's from investing -583 -466 -580 -619 -662
Net change in debt 650 -60 100 110 0
Others -265 -265 -211 -202 -164
CF's from financing 385 -325 -111 -92 -164
Net cash flow -339 -312 -47 53 96
Cash at BoY 748 487 253 284 414
Cash at EoY 409 175 206 336 510
Free Cashflow -195 117 168 258 375
Key Ratio Analysis
Year end Dec 2015 2016E 2017E 2018E 2019E
Profitability
Gross Margin (%) 16.9
%
16.5% 17.1% 17.2% 17.3%
Opr Margin (%) 2.0% 1.2% 2.7% 2.7% 2.6%
EBITDA Margin (%) 4.2% 3.7% 5.2% 5.2% 5.2%
Core Net Margin (%) 1.4% 0.6% 1.7% 1.7% 1.8%
ROAE (%) 6.5% 3.0% 10.5% 11.6% 12.6%
ROAA (%) 3.0% 1.3% 4.4% 4.7% 5.1%
Stability Current ratio (x) 1.4 1.4 1.4 1.4 1.4
Net Debt to Equity (x) 0.1 0.2 0.2 0.2 0.1
Net Debt to EBITDA
(x)
0.4 0.8 0.6 0.5 0.3
Interest Coverage (x) 6.1 2.1 5.3 5.2 5.6
Efficiency A/P (days) 56 56 56 56 56
A/R (days) 1 1 1 1 1
Inventory (days) 87 84 80 77 73
Interim Result (Rpbn)
3Q15 4Q15 1Q16 2Q16 3Q16
Sales 3,593 3,481 3,265 3,736 3,393
Gross Profit 597 556 459 673 558
Opr. Profit 108 -53 -107 115 90
Net profit 70 -52 -123 102 53
Core profit 72 -57 -120 105 56
Gross Margin (%) 16.6% 16.0% 14.1% 18.0% 16.5%
Opr Margin (%) 3.0% -1.5% -3.3% 3.1% 2.7%
Net Margin (%) 1.9% -1.5% -3.8% 2.7% 1.6%
Core Margin (%) 2.0% -1.6% -3.7% 2.8% 1.7%
Capital History
Date
18-Dec-92 IPO @ Rp7,150

MARKET OUTLOOK PT Trimegah Securities Tbk - www.trimegah.com 96
Mitra Keluarga Remains ‘healthy’ Patricia Gabriela
Offset impact from UHC: patient volume—revenue per patient
While MIKA’s patient volume is in a recovery mode this year with growth
of 8.9% YoY in 9M16 (vs –1.2% YoY in 9M15), but we see a problem in
its revenue per patient, primarily inpatient. As the impact of UHC
(Universal Health Coverage), MIKA experienced less complex treatment
which contribute much to its revenue per inpatient. Not to mention,
MIKA did not increase its drugs price (47% of revenue, 38% of gross
profit) this year but only services. Hence, MIKA’s revenue per inpatient
in 9M16 declined by 0.5% YoY (vs 12.0% YoY in 9M15). Following this,
we tweaked up our 2016/17F assumption on patient volume by 2.7%
but tweaked down our price increase assumption by 300bps. That being
said, our new 2016/17F revenue down by 2/4% from previous number.
Margin expansion remains on track
MIKA’s drugs procurement strategy applied in 2Q15 has upped its gross
margin by 220bps to 48.1% in 9M16. Company will continue to do drugs
procurement, though we see the impact will be limited as MIKA has
applied the strategy to majority of its hospitals. Company will also do
procurement for its lab business (11-12% of revenue). There will not be
significant margin expansion from such procurement (the business’
COGS is ~17.3% of revenue), but we believe can help improve overall
profitability line.
Hospital expansion on the pipeline
There are two new hospitals outside Jakarta currently under develop-
ment. We expect those new hospitals to start commencing by 2018F,
hence give no hospital expansion in 2017F. However, MIKA’s volume
growth can still be provided from additional bed capacity in existing
hospitals.
Maintain Buy rating on MIKA with similar TP of IDR3,000
MIKA’s valuation will still be a premium compared to competitors, but
MIKA offers: 1) stable and highest profitability line at 29.2% in 2016F
(vs regional’s average at 10.2%), 2) ROE of 19.9% (vs regional’s aver-
age at 11.6%), and 3) dividend payout ratio of ~64% in 2017F (vs
regional’s average at 38.3%). We maintain our TP of IDR3,000 implying
42x 2017F EV/EBITDA; hence Buy rating.
PT Mitra Keluarga Karyasehat Tbk is one
of the largest private hospital groups in
Indonesia with 25 years of brand herit-
age.
Share Price Rp2,580
Sector Healthcare
Price Target Rp3,000 (+16%)
Year end Dec 2014 2015 2016F 2017F 2018F
Sales (Rp bn) 1,946 2,141 2,444 2,708 3,011
EBITDA (Rp bn) 666 696 852 968 1,103
Net Profit (Rp bn) 517 567 702 777 860
EPS (Rp) 37 39 49 54 60
EPS Growth (%) 30% 5% 24% 11% 11%
DPS (Rp) 34 20 25 32 35
BVPS (Rp) 128 227 245 267 292
EV/EBITDA (x) 52.1 50.1 40.9 36.1 31.7
P/E (x) 69.0 65.7 53.0 47.9 43.3
Div Yield (%) 1.3% 0.8% 1.0% 1.2% 1.4%
Buy Rp3,000
Reuters Code MIKA.JK
Bloomberg Code MIKA.IJ
Issued Shares 14,429
Mkt Cap. (Rpbn) 37,227
Avg. Value Daily 6 Month (Rpbn)
16.0
52-Wk range 2980 / 2010
Lion Investment Partners B.V. 49.7%
PT Griyainsani Cakrasadaya 32.3%
Public 18%
Core EPS 16F 17F
Consensus (IDR) 47 54
TRIM vs Cons. (%) 4.2% -0.9%
Company Update
Stock Data
Major Shareholders
Consensus
Stock Price
Companies Data

PT Trimegah Securities Tbk - www.trimegah.com MARKET OUTLOOK 97
Income Statement (Rpbn)
Year end Dec 2014 2015 2016F 2017F 2018F
Revenue 1,946 2,141 2,444 2,708 3,011
Revenue Growth (%) 11.7% 10.0% 14.1% 10.8% 11.2%
Gross Profit 865 972 1,185 1,322 1,474
Opr. Profit 586 604 746 837 941
EBITDA 666 696 852 968 1,103
EBITDA Growth (%) 19.2% 4.5% 22.5% 13.6% 13.9%
Net Int Inc/(Exp) 80 135 144 147 145
Gain/(loss) Forex 2 3 - - -
Other Inc/(Exp) 40 2 18 22 23
Pre-tax Profit 667 739 890 984 1,087
Tax (133) (151) (177) (196) (216)
Minority Int. 17 22 22 22 22
Extra. Items - - - - -
Reported Net Profit 517 567 702 777 860
Core Net Profit 533 586 713 788 871
Growth (%) 30.6% 9.9% 21.7% 10.5% 10.5%
Dividend per share 34 20 25 32 35
growth (%) 3033% -40.7% 25.0% 25.5% 10.7%
Dividend payout ratio 118% 56% 64% 65% 65%
Balance Sheet (Rpbn)
Year end Dec 2014 2015 2016F 2017F 2018F
Cash and equivalents 970 2,387 2,365 2,334 2,244
Other curr asset 220 234 245 267 293
Net fixed asset 771 884 1,135 1,442 1,819
Other asset 208 215 243 276 331
Total asset 2,169 3,720 3,987 4,319 4,686
ST debt - - - - -
Other curr liab 205 206 218 229 241
LT debt - - - - -
Other LT Liab 195 235 235 235 235
Minority interest 61 83 - - -
Total Liabilities 400 441 453 464 476
Shareholders Equity 1,769 3,279 3,534 3,855 4,210
Net debt / (cash) (970) (2,387) (2,365) (2,334) (2,244)
Total cap employed 1,964 3,514 3,769 4,090 4,445
Net Working capital 984 2,415 2,392 2,373 2,295
Debt - - - - -
Cash Flow (Rpbn)
Year end Dec 2014 2015 2016F 2017F 2018F
Net Profit 517 567 702 777 860
Depr / Amort 79 91 106 131 161
Chg in Working Cap 58 (14) 2 (12) (13)
CF's from oprs 654 645 811 896 1,008
Capex (173) (113) (357) (438) (538)
Others (70) (6) (28) (33) (55)
CF's from investing (243) (120) (385) (471) (593)
Dividend (470) (291) (364) (457) (505)
Others (79) 1,180 (83) - -
CF's from financing (549) 889 (447) (457) (505)
Net cash flow (138) 1,414 (22) (31) (91)
Cash at BoY 1,108 970 2,387 2,365 2,334
Cash at EoY 970 2,387 2,365 2,334 2,244
Free Cashflow 434 445 349 352 364
Key Ratio Analysis
Year end Dec 2014 2015 2016F 2017F 2018F
Profitability
Gross Margin (%) 44.4% 45.4% 48.5% 48.8% 49.0%
Opr Margin (%) 30.1% 28.2% 30.5% 30.9% 31.3%
EBITDA Margin (%) 34.2% 32.5% 34.9% 35.7% 36.6%
Core Net Margin (%) 26.5% 26.4% 29.2% 29.1% 28.9%
ROAE (%) 29.9% 22.5% 20.6% 21.0% 21.3%
ROAA (%) 24.0% 19.3% 18.2% 18.7% 19.1%
Stability Current ratio (x) 5.8 12.7 12.0 11.4 10.5
Net Debt to Equity (x) (0.5) (0.7) (0.7) (0.6) (0.5)
Net Debt to EBITDA (x) (1.5) (3.4) (2.8) (2.4) (2.0)
Interest Coverage (x) 41.2 57.6 71.1 79.8 89.8
Efficiency A/P (days) 30 31 31 32 32
A/R (days) 25 26 25 24 24
Inventory (days) 13 12 12 11 11
Interim Result (Rpbn)
3Q15 4Q15 1Q16 2Q16 3Q16
Sales 500 539 625 636 566
Gross Profit 223 243 296 316 266
EBITDA 157 152 224 230 192
Opr. Profit 135 127 199 205 166
Net profit 130 127 184 188 157
Core profit 134 132 191 195 163
Gross Margins (%) 44.6% 45.2% 47.4% 49.7% 47.0%
EBITDA Margins (%) 31.5% 28.3% 35.8% 36.1% 33.8%
Opr Margins (%) 26.9% 23.5% 31.8% 32.2% 29.4%
Net Margins (%) 25.9% 23.7% 29.4% 29.6% 27.8%
Core Margins (%) 26.7% 24.5% 30.5% 30.7% 28.8%
Capital History
Date
24-Mar-15 IPO@Rp17,000
16-Oct-15 Stock split 1:10
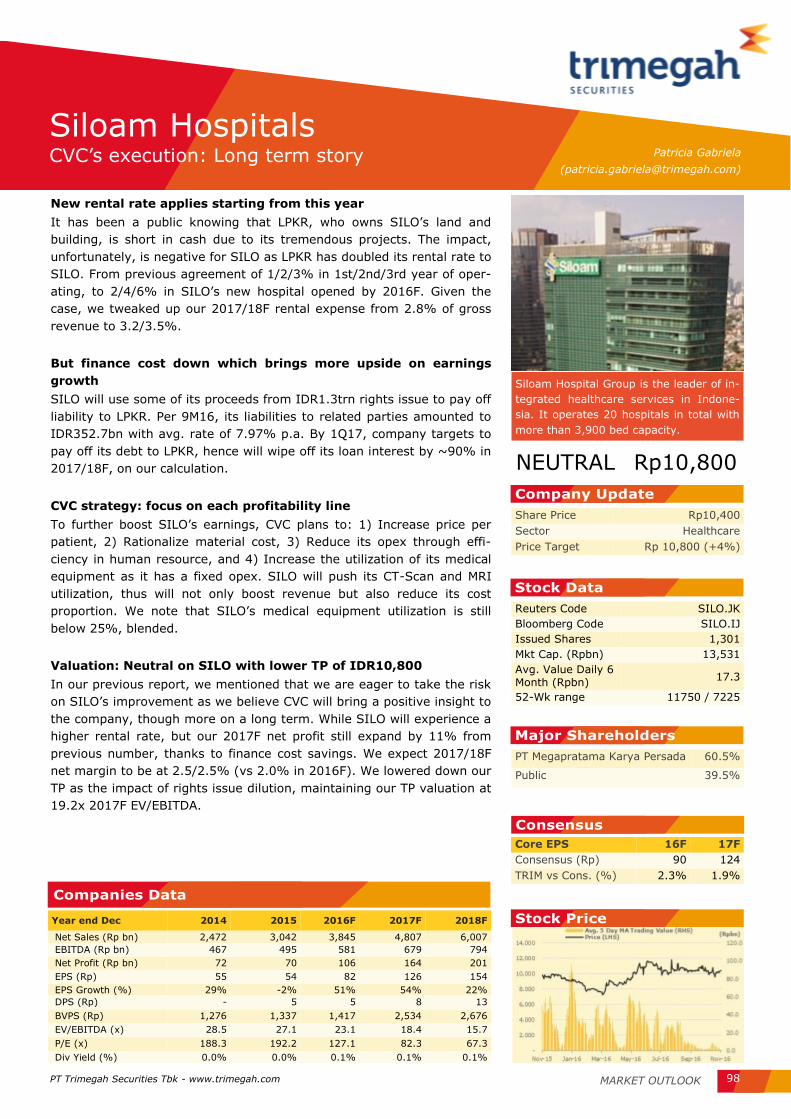
MARKET OUTLOOK PT Trimegah Securities Tbk - www.trimegah.com 98
Patricia Gabriela
Siloam Hospital Group is the leader of in-
tegrated healthcare services in Indone-
sia. It operates 20 hospitals in total with
more than 3,900 bed capacity.
Share Price Rp10,400
Sector Healthcare
Price Target Rp 10,800 (+4%)
Year end Dec 2014 2015 2016F 2017F 2018F
Net Sales (Rp bn) 2,472 3,042 3,845 4,807 6,007
EBITDA (Rp bn) 467 495 581 679 794
Net Profit (Rp bn) 72 70 106 164 201
EPS (Rp) 55 54 82 126 154
EPS Growth (%) 29% -2% 51% 54% 22%
DPS (Rp) - 5 5 8 13
BVPS (Rp) 1,276 1,337 1,417 2,534 2,676
EV/EBITDA (x) 28.5 27.1 23.1 18.4 15.7
P/E (x) 188.3 192.2 127.1 82.3 67.3
Div Yield (%) 0.0% 0.0% 0.1% 0.1% 0.1%
Reuters Code SILO.JK
Bloomberg Code SILO.IJ
Issued Shares 1,301
Mkt Cap. (Rpbn) 13,531
Avg. Value Daily 6 Month (Rpbn)
17.3
52-Wk range 11750 / 7225
PT Megapratama Karya Persada 60.5%
Public 39.5%
Core EPS 16F 17F
Consensus (Rp) 90 124
TRIM vs Cons. (%) 2.3% 1.9%
Company Update
Stock Data
Major Shareholders
Consensus
Stock Price
Companies Data
Siloam Hospitals CVC’s execution: Long term story
New rental rate applies starting from this year
It has been a public knowing that LPKR, who owns SILO’s land and
building, is short in cash due to its tremendous projects. The impact,
unfortunately, is negative for SILO as LPKR has doubled its rental rate to
SILO. From previous agreement of 1/2/3% in 1st/2nd/3rd year of oper-
ating, to 2/4/6% in SILO’s new hospital opened by 2016F. Given the
case, we tweaked up our 2017/18F rental expense from 2.8% of gross
revenue to 3.2/3.5%.
But finance cost down which brings more upside on earnings
growth
SILO will use some of its proceeds from IDR1.3trn rights issue to pay off
liability to LPKR. Per 9M16, its liabilities to related parties amounted to
IDR352.7bn with avg. rate of 7.97% p.a. By 1Q17, company targets to
pay off its debt to LPKR, hence will wipe off its loan interest by ~90% in
2017/18F, on our calculation.
CVC strategy: focus on each profitability line
To further boost SILO’s earnings, CVC plans to: 1) Increase price per
patient, 2) Rationalize material cost, 3) Reduce its opex through effi-
ciency in human resource, and 4) Increase the utilization of its medical
equipment as it has a fixed opex. SILO will push its CT-Scan and MRI
utilization, thus will not only boost revenue but also reduce its cost
proportion. We note that SILO’s medical equipment utilization is still
below 25%, blended.
Valuation: Neutral on SILO with lower TP of IDR10,800
In our previous report, we mentioned that we are eager to take the risk
on SILO’s improvement as we believe CVC will bring a positive insight to
the company, though more on a long term. While SILO will experience a
higher rental rate, but our 2017F net profit still expand by 11% from
previous number, thanks to finance cost savings. We expect 2017/18F
net margin to be at 2.5/2.5% (vs 2.0% in 2016F). We lowered down our
TP as the impact of rights issue dilution, maintaining our TP valuation at
19.2x 2017F EV/EBITDA.
NEUTRAL Rp10,800

PT Trimegah Securities Tbk - www.trimegah.com MARKET OUTLOOK 99
Income Statement (Rpbn)
Year end Dec 2014 2015 2016F 2017F 2018F
Net Revenue 2,472 3,042 3,845 4,807 6,007
Revenue Growth
(%)
33.9% 23.1% 26.4% 25.0% 25.0%
Gross Profit 952 1,177 1,505 1,902 2,390
Opr. Profit 146 158 212 254 313
EBITDA 467 495 581 679 794
EBITDA Growth (%) 50.4% 6.0% 17.4% 16.8% 17.1%
Net Int Inc/(Exp) (40) (52) (49) 5 7
Gain/(loss) Forex - - - - -
Other Inc/(Exp) (34) (53) (65) (75) (86)
Pre-tax Profit 106 106 163 259 321
Tax (37) (44) (65) (104) (128)
Minority Int. (3) (9) (9) (9) (9)
Extra. Items - - - - -
Reported Net Profit 72 70 106 164 201
Core Net Profit 72 70 106 164 201
Growth (%) 44.1% -2.0% 51.2% 54.4% 22.3%
Dividend per share 0 5 6 8 10
growth (%) 0.0% 0.0% 17.1% 34.4% 54.4%
Dividend payout
ratio
0% 9% 10% 10% 10%
Balance Sheet (Rpbn)
Year end Dec 2014 2015 2016F 2017F 2018F
Cash and equivalents 280 160 165 1,061 1,110
Other curr asset 561 796 847 1,037 1,275
Net fixed asset 1,589 1,553 1,622 1,701 1,683
Other asset 416 477 477 477 477
Total asset 2,846 2,986 3,111 4,276 4,545
ST debt 16 10 10 10 10
Other curr liab 466 620 641 708 791
LT debt 31 23 23 23 23
Other LT Liab 674 593 593 239 239
Minority interest 5 (4) - - -
Total Liabilities 1,186 1,246 1,267 979 1,063
Shareholders Equity 1,660 1,740 1,843 3,297 3,482
Net debt / (cash) (233) (127) (132) (1,029) (1,077)
Total cap employed 2,364 2,356 2,460 3,559 3,744
Net Working capital 358 326 361 1,381 1,584
Debt 47 33 33 33 33
Cash Flow (Rpbn)
Year end Dec 2014 2015 2016F 2017F 2018F
Net Profit 72 70 106 164 201
Depr / Amort 321 337 369 424 481
Chg in Working Cap 18 (82) (30) (124) (154)
CF's from oprs 411 326 446 465 528
Capex (508) (301) (438) (503) (463)
Others (128) (61) - - -
CF’s from investing (636) (362) (438) (503) (463)
Dividend - (6) (7) (11) (16)
Others (9) (78) 4 945 -
CF’s from financing (9) (84) (3) 935 (16)
Net cash flow (234) (120) 5 896 49
Cash at BoY 515 280 160 165 1,061
Cash at EoY 280 160 165 1,061 1,110
Free Cashflow (74) 44 29 (50) 52
Key Ratio Analysis
Year end Dec 2014 2015 2016F 2017F 2018F
Profitability
Gross Margin (%) 38.5% 38.7% 39.1% 39.6% 39.8%
Opr Margin (%) 5.9% 5.2% 5.5% 5.3% 5.2%
EBITDA Margin (%) 14.0% 11.9% 11.1% 10.4% 9.8%
Core Net Margin (%) 2.9% 2.3% 2.8% 3.4% 3.3%
ROAE (%) 4.3% 4.1% 5.9% 6.4% 5.9%
ROAA (%) 2.6% 2.4% 3.5% 4.5% 4.6%
Stability Current ratio (x) 1.7 1.5 1.6 2.9 3.0
Net Debt to Equity (x) (0.1) (0.1) (0.1) (0.3) (0.3)
Net Debt to EBITDA (x) (0.5) (0.3) (0.2) (1.5) (1.4)
Interest Coverage (x) 2.6 2.8 4.0 12.8 16.0
Efficiency A/P (days) 43 43 41 38 38
A/R (days) 36 43 41 39 39
Inventory (days) 24 24 23 22 22
Interim Result (Rpbn)
3Q15 4Q15 1Q16 2Q16 3Q16
Gross sales 1,026 1,131 1,254 1,301 1,270
Gross Profit 290 320 375 391 356
EBITDA 125 104 161 159 140
Opr. Profit 39 17 74 69 48
Net profit 22 - 41 29 16
Core profit 22 - 41 29 16
Gross Margins (%) 28.3% 28.3% 29.9% 30.1% 28.0%
EBITDA Margins (%) 12.2% 9.2% 12.8% 12.2% 11.1%
Opr Margins (%) 3.8% 1.5% 5.9% 5.3% 3.8%
Net Margins (%) 2.2% 0.0% 3.2% 2.2% 1.3%
Core Margins (%) 2.2% 0.0% 3.2% 2.2% 1.3%
Capital History
Date
12-Sept-13 IPO@Rp9,000

PT Trimegah Securities Tbk - www.trimegah.com MARKET OUTLOOK 100
Telecommunication Sector

MARKET OUTLOOK PT Trimegah Securities Tbk - www.trimegah.com 101
Telecommunication Sector Long term play
A more competitive environment
This considers: 1) EXCL’s intention to recover its growth momentum and
increase market share in outer Java; 2) Telkomsel’s (65% owned by TLKM)
offered significant 4G bonus volume (since Sep’16) and more data-centric
promotion. We expect more competition to result in: a) Data yield continue
falling by 27% YoY in 2017, b) Voice yield growth stagnating to –0.6%YoY
in 2017 from previously +12%YoY, and c) SMS yield falling by –3%YoY in
2017. Note however, that we do not yet foresee a price war to the extent
of 2008-12 price war. We still expect overall cellular revenue growth will
increase from 9% in 2016 to 11% in 2017F on the back of EXCL’s growth
recovery.
Expect slower growth from cellular business’ EBITDA
Despite better top-line growth, our cellular EBITDA growth is lower in
2017F compared to 2016F, mainly due to lower margin as the result of:
Expansion to data service (lower margin than voice and SMS), additional
cost of license fee for ISAT, and lower margin for EXCL partly from 2nd
tower-sale-and-lease-back this year. Our 2016/17F aggregate cellular
EBITDA growth is 13/10%YoY.
Demand in tower industry still lackluster
We think the industry still experiencing lower demand partly due to possi-
bility of network sharing regulation change. We see potentially more net-
work roll-out (BTS) from Telkomsel, but it yet give significant impact to our
TBIG’s earning growth estimates. Telkomsel might need to increase its
network capacity following additional data traffic resulted from volume-
driven pricing strategy, in our view.
Neutral on sector
We have a Neutral for the sector considering slower growth in EBITDA in
the midst of more competitive environment. ISAT is still the cheapest and
the most undervalued in terms of EV/EBITDA considering its position as
no. 2 market share holder, but we view that potential growth momentum
is better for ISAT in 2018F relative to 2017F.
Paula Ruth
Neutral
TICKER
Price
(IDR) Mkt. Cap
TP Ups.
Rec. EPS Growth(%) PE (x) EV/EBITDA (x) Div. yield (%)
28-Nov (IDR bn) (%) 2016 2017 2016 2017 2016 2017 2016 2017
TLKM 3,840 380,399 4,200 9.4 Neutral 19.8 11.5 19.3 17.3 9.1 8.2 3.5 4.0
ISAT 6,200 33,690 6,700 8.1 Neutral NM 88.5 41.1 21.8 3.7 3.5 1.5 2.4
EXCL 2,040 21,803 2,200 7.8 Neutral NM NM (19.9) (26.1) 4.1 3.9 0.0 0.0
TBIG 5,625 25,489 6,100 8.4 Neutral -12.9 10.9 20.5 18.5 14.6 13.3 1.2 1.4
Companies Data

PT Trimegah Securities Tbk - www.trimegah.com MARKET OUTLOOK 102
Figure 50. Big 3 Cellular Service Performance: Data, Voice, and SMS
Source: Companies, TRIM Research
Note: EXCL did not disclose actual revenue and traffic for voice and SMS separately starting from 2Q16.
Service revenue and service contribution Traffic vs. average yield

PT Trimegah Securities Tbk - www.trimegah.com MARKET OUTLOOK 103
Figure 51. 3Q16 Big 3 Telecoms - Revenue Breakdown
Source: Companies, TRIM Research
Net debt/
EBITDA
USD debt
(USD mn)
% USD
debt of
total debt
Hedged portion
of USD Debt
% Unhedged USD
debt to total debt
16E 17E 9M16 9M16 9M16 Note
TLKM 0.1 0.1 ~87 4% NA NA Company has forward contact for upcoming payments (principal and interest)
ISAT 1.3 1.0 350 12% 50% 6.0% Hedged for principal amount only.
EXCL 1.6 1.4 186 30% 100% 0.0% 86% of USD350mn debt are hedged for prin-cipal amount only, the rest for principal and interest amount.
Figure 52. Big 3 Telecoms’ net debt/EBITDA and USD debt portion
Data 35%
Voice 26%
SMS17%
Others 22%
ISAT
Data Voice SMS Others
Data41%
Non-data47%
Others 3%
EXCL
Data Non-data Others
Data32%
Voice47%
SMS15%
Others 5.9%
Telkomsel
Data Voice SMS Others
Source: Companies, TRIM Research

PT Trimegah Securities Tbk - www.trimegah.com MARKET OUTLOOK 104
Figure 53. Big 3 Subscriber, Revenue, and EBITDA market share
Note: ISAT cellular revenue included tower rental
revenue, while EXCL cellular revenue excluded it.
4Q15 Telkomsel’s EBITDA above excluding one-off
from extra incentive for employees.
Source: Companies, TRIM Research
Figure 54. Big 3 Telecom Fw. Hist. EV/EBITDA band (until 25 Nov)
Source: Companies, Bloomberg, TRIM Research
3
4
5
6
7
8
9
10
11
Jan-1
0
Mar-1
0
May-1
0
Jul-1
0
Sep-1
0
Nov-1
0
Jan-1
1
Mar-1
1
May-1
1
Jul-1
1
Sep-1
1
Nov-1
1
Jan-1
2
Mar-1
2
May-1
2
Jul-1
2
Sep-1
2
Nov-1
2
Jan-1
3
Mar-1
3
May-1
3
Jul-1
3
Sep-1
3
Nov-1
3
Jan-1
4
Mar-1
4
May-1
4
Jul-1
4
Sep-1
4
Nov-1
4
Jan-1
5
Mar-1
5
May-1
5
Jul-1
5
Sep-1
5
Nov-1
5
Jan-1
6
Mar-1
6
May-1
6
Jul-1
6
Sep-1
6
Nov-1
6
EXCL Fw-EV/EBITDA TLKM Fw-EV/EBITDA ISAT Fw-EV/EBITDA
8x
4x
4x

PT Trimegah Securities Tbk - www.trimegah.com MARKET OUTLOOK 105
More optimist on data growth for the next several years We expect data service to continue to drive Indonesia’s telecom industry growth supported by more affordable smartphone, further 4G-LTE adoption, and higher apps usage by existing smartphone users. From our on-the-ground observation in Jakarta last Oct’16, popular brand LTE smartphone already more affordable: Samsung Z2
IDR900K (~USD67), 18% below Samsung J1 Mini- previously considered as one of the cheapest popular brand LTE smartphone in Jun 2016. Based on experience with 2G, there will be significant increase in penetration when mobile handset’s price down to USD50. We expect Big 3 Telecom’s avg. monthly data traffic per smartphone to grow from only ~600MB in 2015 to 3.4GB in 2021E, implying 35% CAGR. Based on Ericsson report, Asia Pacific
monthly data traffic per smartphone is expected to grow from FY15 1GB to 6.5GB (37% CAGR).
Note: ISAT cellular revenue included tower rental revenue, while EXCL cellular revenue excluded it. 4Q15 Telkomsel’s EBITDA above excluding
one-off from extra incentive for employees.
Figure 56. Big 3 Telecoms: Cellular revenue and EBITDA for 2014-2019F
Source: Companies, TRIM Research
Figure 55. Big 3 Telecoms: Data revenue, yield, and traffic for 2014-2019F
Source: Companies, World Bank, TRIM Research
Source: Companies, TRIM Research
Figure 57. Big 3 Telecoms: Annual market share for 2014-2019F

MARKET OUTLOOK PT Trimegah Securities Tbk - www.trimegah.com 106
Telekomunikasi Indonesia Encouraging higher 4G usage
Paula Ruth
Increase revenue for the next 2-3 years from data service
We maintain similar revenue target for 2016E-17E, but slightly in-
creased our 2018-19F TLKM’s revenue by 3% compared to old est. as
we are more optimist on data revenue growth in the next several years
aligned with rising smartphone penetration and higher data usage per
smartphone. For 2017-19F, our Telkomsel’s (65% owned by TLKM)
revenue growth is 12-8%YoY as we expect: 1) Strong data revenue
growth of 34-16%YoY; 2) Modest voice revenue growth of 6-2%YoY; 3)
SMS revenue to go down by 11-6%YoY.
Lower long-term EBITDA margin estimates
There is risk of declining EBITDA margin from Telkomsel’s expansion to
data service (lower margin than voice and SMS), in our view. However,
as we noticed positive trend in smartphone penetration, data traffic, and
eventually data revenue, we view that data margin may also gradually
improve and limit blended margin decrease. We slightly lowered TLKM’s
2021-27F long term EBITDA margin est. from 52-51% to 52-50%. Note
that TLKM’s fixed broadband, Indihome, might be able to post higher
margin along with bigger number of subscribers. For 2016-17F, we
increased EBITDA margin estimates following better than expected
margin in 3Q16.
Telecom regulation change still pending
We have not included impact from potential change in interconnection
and network sharing regulation (change yet approved). We view if regu-
lation change is approved (may first bring negative sentiment to TLKM),
additional time might still be needed until it is widely implemented and
bring significant financial impact to the industry.
Lower TP by 9% to IDR4,200 (9% ups.) – Maintain Neutral
We use DCF to calculate TP. We increased our RFR from 6.8% to 8.0%
resulted to increase in WACC from 10.0% to 10.9%. Telkomsel 10.0x
2017F EV/EBITDA, roughly similar to Singtel’s at 9.5x (adj. with 35% of
2017F Telkomsel’s EBITDA). TLKM trades at 8x 2017F EV/EBTIDA
(based on adj. EBITDA without Singtel’s 35% ownership in Telkomsel).
TLKM’s current price translates to 17x 2017F PE. TLKM‘s 2017F EV/
EBITDA is similar to average telecoms without Indonesia (8x). TLKM
trades at slightly cheaper for 17PE to avg. regional telecoms excl. Indo-
nesia at 18x 2017F PE.
Telekomunikasi Indonesia (Telkom) is a
state-owned telecommunication compa-
ny that has a near monopoly in fixed-line
telco industry and also has the largest
market share in mobile telco industry
through its 65% owned subsidiary
Telkomsel.
Share Price Rp3,840
Sector Telecommunications
Price Target Rp4,200 (9% ups.)
Year end Dec 2014 2015 2016F 2017F 2018F
Sales 89,696 102,470 115,908 130,246 143,234
EBITDA 45,673 51,415 59,466 66,117 73,007
Net Profit 14,471 15,489 18,981 21,699 24,251
EPS 146 156 192 219 245
Core Profit 13,977 16,432 19,690 21,961 24,251
Core EPS (Rp) 141 166 199 222 245
Core EPS Growth (%) 9.0% 17.6% 19.8% 11.5% 10.4%
DPS (Rp) 89 94 134 153 171
BVPS (Rp) 684 758 785 870 961
EV/EBITDA (x) 11.8 10.5 9.1 8.2 7.5
Core P/E (x) 27.2 23.1 19.3 17.3 15.7
Div Yield (%) 2.3% 2.4% 3.5% 4.0% 4.5%
Neutral Rp4,200
Reuters Code TLKM.JK
Bloomberg Code TLKM.IJ
Shares 99,062
Mkt Cap. (Rpbn) 380,399
Avg. Value Daily 6
Month (Rpbn) 385.2
52-Wk range 4570 / 2900
Government of RI 52.6%
The Bank of New York Mellon Corp 8.3%
Public 39.1%
EBITDA 16F 17F
Consensus (Rp bn) 59,730 66,723
TRIM vs Cons. (%) -0.4% -0.9%
Company Update
Stock Data
Major Shareholders
Consensus
Companies Data
Stock Data Stock Data Stock Price

PT Trimegah Securities Tbk - www.trimegah.com MARKET OUTLOOK 107
Income Statement (Rpbn)
Year end Dec 2014 2015 2016F 2017F 2018F
Revenue 89,696 102,470 115,908 130,246 143,234
Revenue Growth (%) 8.1% 14.2% 13.1% 12.4% 10.0%
Gross Profit NA NA NA NA NA
Opr. Profit 28,542 32,881 40,364 45,167 50,299
EBITDA 45,673 51,415 59,466 66,117 73,007
EBITDA Growth (%) 9.3% 12.6% 15.7% 11.2% 10.4%
Net Int Inc/(Exp) (576) (1,074) (1,011) (408) (431)
Gain/(loss) Forex (14) (46) (216) 0 0
Other Inc/(Exp) 661 (419) (684) (350) 0
Pre-tax Profit 28,613 31,342 38,454 44,409 49,868
Tax (7,339) (8,025) (9,746) (11,255) (12,638)
Minority Int. 6,803 7,828 9,728 11,455 12,979
Extra. Items 0 0 0 0 0
Reported Net Profit 14,471 15,489 18,981 21,699 24,251
Core Net Profit 13,977 16,432 19,690 21,961 24,251
Growth (%) 9.0% 17.6% 19.8% 11.5% 10.4%
Dividend per share 89 94 134 153 171
growth (%) -12.6% 4.9% 43.0% 14.3% 11.8%
Dividend payout ratio 61.2% 60.0% 70.0% 70.0% 70.0%
Balance Sheet (Rpbn)
Year end Dec 2014 2015 2016F 2017F 2018F
Cash and equiva-
lents 20,469 30,935 33,471 31,721 27,940
Other curr asset 13,825 16,977 18,087 20,831 23,217
Net fixed asset 94,809 103,700 116,063 126,526 135,901
Other asset 12,719 14,561 16,187 20,109 24,348
Total asset 141,822 166,173 183,808 199,187 211,406
ST debt 7,709 4,444 1,944 4,798 10,033
Other curr liab 24,609 30,969 40,303 45,913 51,109
LT debt 15,743 30,168 35,905 32,493 23,529
Other LT Liab 7,769 7,164 7,199 6,554 5,927
Minority interest 18,271 18,292 20,691 23,250 25,569
Total Liabilities 55,830 72,745 85,352 89,759 90,598
Shareholders Equity 67,721 75,136 77,765 86,178 95,240
Net debt / (cash) 2,983 3,677 4,378 5,570 5,622
Total cap employed 109,504 130,760 141,560 148,476 150,265
Net Working capital 1,976 12,499 9,311 1,840 (9,985)
Debt 23,452 34,612 37,849 37,291 33,562
Cash Flow (Rpbn)
Year end Dec 2014 2015 2016F 2017F 2018F
Core Net Profit 13,977 16,432 19,690 21,961 24,251
Depr / Amort 17,131 18,534 19,102 20,950 22,709
Chg in Working Cap 4,832 1,979 11,121 3,571 2,492
Others 1,796 6,724 (709) (261) 0
CF's from oprs 37,736 43,669 49,204 46,221 49,452
Capex (26,105) (25,833) (29,599) (30,012) (30,439)
Others 1,357 (1,588) (3,954) (4,115) (3,875)
CF's from investing (24,748) (27,421) (33,553) (34,127) (34,314)
Net change in debt 3,196 11,160 3,237 (558) (3,729)
Others (17,283) (16,942) (16,351) (13,286) (15,189)
CF's from financing (14,087) (5,782) (13,114) (13,844) (18,919)
Net cash flow (1,099) 10,466 2,536 (1,751) (3,781)
Cash at BoY 21,568 20,469 30,935 33,471 31,721
Cash at EoY 20,469 30,935 33,471 31,721 27,940
Free Cashflow 11,631 17,836 19,604 16,209 19,013
Key Ratio Analysis
Year end Dec 2014 2015 2016F 2017F 2018F
Profitability
Gross Margin (%) NA NA NA NA NA
Opr Margin (%) 31.8% 32.1% 34.8% 34.7% 35.1%
EBITDA Margin (%) 50.9% 50.2% 51.3% 50.8% 51.0%
Core Net Margin (%) 15.6% 15.5% 17.0% 16.9% 16.9%
ROAE (%) 21.9% 22.2% 25.8% 26.8% 26.7%
ROAA (%) 10.3% 10.3% 11.3% 11.5% 11.8%
Stability
Current ratio (x) 1.1 1.4 1.2 1.0 0.8
Net Debt to Equity (x) 0.0 0.0 0.1 0.1 0.1
Net Debt to EBITDA (x) 0.1 0.1 0.1 0.1 0.1
Interest Coverage (x) 15.7 13.3 15.1 18.7 21.6
Efficiency
A/P (days) NA NA NA NA NA
A/R (days) 30 28 30 29 29
Inventory (days) NA NA NA NA NA
Interim Result (Rpbn)
3Q15 4Q15 1Q16 2Q16 3Q16
Sales 26,919 26,711 27,542 28,912 29,734
Gross Profit NA NA NA NA NA
Opr. Profit 8,823 9,395 10,250 9,806 10,965
Net profit 4,098 3,944 4,587 5,339 4,806
Core profit 4,063 4,665 5,089 4,964 5,240
Gross Margins (%) NA NA NA NA NA
Opr Margins (%) 32.8% 35.2% 37.2% 33.9% 36.9%
Net Margins (%) 15.2% 14.8% 16.7% 18.5% 16.2%
Core Margins (%) 15.1% 17.5% 18.5% 17.2% 17.6%
Capital History
Date
14-Nov-95 IPO @ Rp. 2,050

MARKET OUTLOOK PT Trimegah Securities Tbk - www.trimegah.com 108
Indosat Facing more agressive competitors
Paula Ruth
PT Indosat Tbk is a telecommunication
and information service provider in Indo-
nesia that provides cellular services
(prepaid and postpaid), fixed data ser-
vices or MIDI (Multimedia, Internet &
Data Communication) and fixed voice
services including fixed wireless access
services.
Share Price Rp6,200
Sector Telecommunications
Price Target Rp6,700 (8% ups.)
Year end Dec 2014 2015 2016F 2017F 2018F
Sales 24,085 26,769 29,251 31,654 34,920
EBITDA 10,033 11,473 12,709 13,565 14,802
Net Profit (2,008) (1,310) 1,004 1,636 2,646
EPS (370) (241) 185 301 487
Core Profit (567) (86) 819 1,544 2,555
Core EPS (Rp) (104) (16) 151 284 470
Core EPS Growth (%) NM NM NM 88.5% 65%
DPS (Rp) NM NM 92 151 243
BVPS (Rp) 2,506 2,297 2,481 2,689 3,026
EV/EBITDA (x) 4.7 4.1 3.7 3.5 3.2
Core P/E (x) NM NM 41.1 21.8 13.2
Div Yield (%) NM NM 1.5% 2.4% 3.9%
Neutral Rp6,700
Reuters Code ISAT.JK
Bloomberg Code ISAT.IJ
Issued Shares 5,434
Mkt Cap. (Rpbn) 33,690
Avg. Value Daily 6
Month (Rpbn) 3.9
52-Wk range 7125 / 4700
Ooredoo Asia Pte. Ltd. 65.0%
Government of RI 14.3%
Public 20.7%
EBITDA 16F 17F
Consensus (Rp bn) 12,770 13,937
TRIM vs Cons. (%) -0.5% -2.7%
Company Update
Stock Data
Major Shareholders
Consensus
Stock Data Stock Data Stock Price
2nd highest data traffic among Big 3 Telecoms
In terms of 3Q16 data traffic, ISAT reached no. 2 highest traffic, replac-
ing EXCL. Telkomsel still remain as the operator with the highest data
traffic. As we see EXCL becoming more aggressive to pursue growth,
incl. network improvement in outer Java, and ISAT might face slower
growth next year, we assume ISAT’s data revenue market share to be
relatively flat (2016E 23% to 2018E 22%) after experiencing increase in
market share at least in 2014 (19%) and 2015 (21%). We still assume
ISAT to be able to retain its no. 2 position in the market for long run.
Slower EBITDA growth next year
We de-rate our TP from 4.4x to 3.7x 2017F EV/EBITDA considering
higher price war risk and slower growth next year. However, we see
possibility of better growth in 2018F as data revenue will have bigger
contribution to the company’s top-line. We expect EBITDA growth to
decrease from 2016F 11%YoY to 2017E 7%YoY, due to lower top-line
growth and declining EBITDA margin, including from higher license fee,
but expect higher EBITDA growth in 2018F. The company announced its
plan to reduce data quota in 4Q16, but we think the net impact will
depend on behavior of subscribers and competitors.
Valuation: Decrease TP to IDR6,700 (8% ups.) – Neutral
We arrive at our TP using DCF method. We increased our WACC from
9.6% to 10.2% due to higher RFR from 6.8% to 8.0%. Changing RFR
caused 4% decrease to TP, assuming all else the same. We reduced our
TP by 15% and downgrade our recommendation to Neutral. Our TP
implied 3.7x 2017F EV/EBITDA, near to –1 STD hist. fw-EV/EBITDA of
3.8x. ISAT trades at 4x 2017F EV/EBITDA, similar to EXCL, but signifi-
cantly cheaper than TLKM at 8x. ISAT‘s 2017F PE is 22x, still higher
than TLKM at 17x, but still below EXCL (we forecast core loss for EXCL in
2017E).
Upside risks
There might be upside risk from positive sentiment when interconnec-
tion rate cut and/or network sharing regulation change is approved by
Gov’t.
Companies Data

PT Trimegah Securities Tbk - www.trimegah.com MARKET OUTLOOK 109
Figure 58. Forecast drivers
Source: Companies and TRIM Research
31 December 2013A 2014A 2015A 2016E 2017E 2018E 2019E
Indosat
Mobile subs (m) 60 63 70 82 83 84 85
Implied ARPU (Rp 000) 27 26 27 27 27 30 32
% growth -2.2% -3.4% 3.9% -2.7% 0.6% 10.3% 6.8%
Voice Outgoing MOU (min/sub/month) 46 41 39 44 48 51 51
Total MOU (min/sub/month) 93 78 70 71 72 74 74
Total minutes carried
(b min) 62 54 57 64 71 74 75
% growth -6.0% -12.7% 5.8% 12.7% 10.0% 5.0% 1.0%
Incoming minutes (%) 29% 29% 30% 31% 31% 31% 31%
Voice revenue / outgoing minute (Rp) 211 192 190 174 153 146 147
% growth 14.0% -9.3% -0.7% -8.4% -12.0% -5.0% 1.0%
Data
Data traffic (terabyte) 30,517 85,359 199,054 500,869 876,621 1,312,461 1,635,339
% growth 100.8% 179.7% 133.2% 151.6% 75.0% 49.7% 24.6%
Data Rate (Rp/kb) NA 0.05 0.04 0.02 0.02 0.01 0.01
% growth NA NA -32.7% -41.0% -24.2% -16.0% -7.9%
SMS Outgoing SMS (bn) 274 237 237 205 198 192 187
% growth 1.9% -13.5% 0.0% -13.7% -3.0% -3.0% -3.0%
Revenue / outgoing SMS (Rp) NA NA 21 24 24 23 22
% growth NA NA NA 15.3% -3.0% -3.0% -2.0%
(in Rp tr) Cellular - net revenue 19.4 19.5 21.9 24.3 26.5 29.6 32.0
% growth 4.8% 0.5% 12.4% 10.9% 9.2% 11.6% 8.0%
Fixed voice service 1.2 1.1 1.1 1.0 0.9 0.8 0.7
% growth 18.9% -9.8% 2.1% -12.0% -9.4% -9.3% -9.2%
Fixed data (MIDI) 3.3 3.5 3.8 4.0 4.2 4.5 4.8
% growth 12.3% 7.4% 7.0% 6.4% 6.3% 6.2% 6.0%
Net revenue 23.9 24.1 26.8 29.3 31.7 34.9 37.5
% growth 6.4% 1.0% 11.1% 9.3% 8.2% 10.3% 7.4%
EBITDA 10.4 10.0 11.5 12.7 13.6 14.8 15.4
% growth -1.6% -3.3% 14.4% 10.8% 6.7% 9.1% 3.7%
EBITDA margin 43.5% 41.7% 42.9% 43.4% 42.9% 42.4% 40.9%
Capex / revenue 39.3% 28.4% 37.5% 25.7% 23.7% 22.1% 26.8%

PT Trimegah Securities Tbk - www.trimegah.com MARKET OUTLOOK 110
Figure 59. ISAT—Changes in assumption & forecast
Source: TRIM Research
Revenues - Current 2016E 2017E 2018E 2019E Note
Revenues - Current 29,251 31,654 34,920 37,497 More optimist on data revenue growth in the
next several years Revenues - Old 28,864 30,799 32,189 33,135
% change 1.3% 2.8% 8.5% 13.2%
Cellular Revenue - Current 24,272 26,516 29,603 31,982
Cellular Revenue - Old 23,905 25,592 26,706 27,351
% change 1.5% 3.6% 10.8% 16.9%
Fixed line, MIDI, others revenue - Current 4,979 5,138 5,317 5,515
Fixed line, MIDI, others revenue - Old 4,960 5,208 5,483 5,785
% change 0.4% -1.3% -3.0% -4.7%
EBITDA - Current 12,709 13,565 14,802 15,351
EBITDA - Old 12,376 12,950 13,328 13,582
% change 2.7% 4.7% 11.1% 13.0%
EBITDA margin - Current 43.4% 42.9% 42.4% 40.9% In 2017, ISAT expects cost saving from IT
outsourcing, electricity, and possibility of
joint-procurement with Ooredoo Group. This
may help to partly offset Ooredoo’s license
fee cost impact. We assume no cut in inter-EBITDA margin - Old 42.9% 42.0% 41.4% 41.0%
D&A - Current (9,250) (9,345) (9,423) (9,576)
D&A - Old (9,249) (9,379) (9,532) (9,689)
% change 0.0% -0.4% -1.1% -1.2%
EBIT - Current 3,459 4,220 5,379 5,775
EBIT - Old 3,126 3,571 3,795 3,893
% change 10.6% 18.2% 41.7% 48.3%
Net interest expense - Current (2,122) (1,805) (1,507) (1,342)
Net interest expense - Old (2,218) (1,835) (1,530) (1,274)
% change -4.3% -1.7% -1.5% 5.4%
Net Income - Current 1,003 1,635 2,646 3,029
Net Income - Old 689 1,164 1,522 1,757
% Change 45.6% 40.4% 73.8% 72.4%
Core profit - Current 818 1,544 2,555 2,938 3Q16 actual is 65% higher than our est.
Core profit - Old 489 1,053 1,411 1,646
% change 67.5% 46.6% 81.0% 78.5%
Capex - Current 7,510 7,492 7,705 10,032
Capex - Old 7,494 8,407 8,874 9,099
% change 0.2% -10.9% -13.2% 10.3%

PT Trimegah Securities Tbk - www.trimegah.com MARKET OUTLOOK 111
YE Dec 31 (in Rp b) 2018F 2019F 2020F 2021F 2022F 2023F 2024F 2025F 2026F 2027F
EBIT 5,379 5,775 5,713 5,803 5,568 5,191 4,682 4,109 3,664 3,192
Tax Rate 30.0% 30.0% 30.0% 30.0% 30.0% 30.0% 30.0% 30.0% 30.0% 30.0%
EBIT*(1-t) 3,765 4,042 3,999 4,062 3,897 3,633 3,277 2,876 2,565 2,234
+ D & A 9,423 9,576 10,007 10,420 10,784 11,123 11,455 11,779 12,096 12,406
- Capex (7,705) (10,032) (10,386) (9,923) (9,690) (9,880) (10,042) (10,192) (10,337) (10,481)
+ Decrease/(increase) in
non cash working capital 199 2,108 409 (292) (66) 325 312 309 312 318
FCFF 5,682 5,694 4,029 4,266 4,925 5,203 5,002 4,772 4,636 4,478
FCFF - Discounted 5,157 4,691 3,013 2,895 3,034 2,908 2,538 2,198 1,938 1,699
Value of cash-flows thro
2027 30,070
Terminal value– 3.3x
EV/EBITDA 19,527 Risk free rate 8.00%
Equity market premium 5.00%
Enterprise value 49,597 Beta 0.87
Net Debt / (Cash) 13,440 Cost of equity 12.35%
Equity value 36,157 Cost of debt 8.25%
# of shares (mn) 5,434 Debt/total capital 53%
Value per share (mn) 6,654 10.2% WACC
Target price after rounding 6,700
Figure 60. DCF calculations
Source: TRIM Research
TP (IDR/sh) Beta
6,700 0.70 0.87 1.00 1.10 1.20
Terminal
EV/
EBITDA
(x)
3.0 6,500 6,300 6,200 6,000 5,900
3.3 6,900 6,700 6,500 6,400 6,200
3.8 7,400 7,200 7,000 6,900 6,700
5.0 8,800 8,500 8,300 8,100 8,000
6.0 9,900 9,600 9,300 9,200 9,000
7.0 11,100 10,700 10,400 10,200 10,000
8.0 12,200 11,800 11,500 11,200 11,000
Figure 61. TP sensitivity analysis
Source: TRIM Research

PT Trimegah Securities Tbk - www.trimegah.com MARKET OUTLOOK 112
Income Statement (Rpbn)
Year end Dec 2014 2015 2016F 2017F 2018F
Revenue 24,085 26,769 29,251 31,654 34,920
Revenue Growth (%) 1% 11% 9.3% 8.2% 10.3%
Gross Profit NA NA NA NA NA
Opr. Profit 1,807 2,704 3,459 4,220 5,379
EBITDA 10,033 11,473 12,709 13,565 14,802
EBITDA Growth (%) -3% 14% 11% 7% 9%
Net Int Inc/(Exp) (2,264) (2,611) (2,122) (1,804) (1,507)
Gain/(loss) Forex (395) (1,599) 421 0 0
Other Inc/(Exp) (1,110) (280) (164) 130 130
Pre-tax Profit (1,962) (1,786) 1,594 2,546 4,002
Tax 84 622 (453) (764) (1,201)
Minority Int. (130) (147) (138) (146) (155)
Extra. Items 0 0 0 0 0
Reported Net Profit (2,008) (1,310) 1,004 1,636 2,646
Core Net Profit (567) (86) 819 1,544 2,555
Growth (%) -15% -85% NM 88% 65%
Dividend per share NM NM 92 151 243
growth (%) NM NM NM 63% 62%
Dividend payout
ratio 50% 50% 50% 50% 50%
Balance Sheet (Rpbn)
Year end Dec 2014 2015 2016F 2017F 2018F
Cash and equiva-
lents 3,480 3,623 1,778 2,986 4,044
Other curr asset 5,111 6,295 6,550 6,918 7,492
Net fixed asset 40,776 41,822 40,082 38,228 36,510
Other asset 3,903 3,648 4,819 5,072 5,354
Total asset 53,270 55,389 53,229 53,205 53,400
ST debt 11,797 7,069 5,584 2,828 2,538
Other curr liab 9,351 12,983 13,786 14,196 14,969
LT debt 11,350 16,607 12,722 13,598 11,160
Other LT Liab 6,474 5,465 6,738 6,905 7,071
Minority interest 681 781 919 1,065 1,220
Total Liabilities 38,971 42,125 38,831 37,527 35,738
Shareholders
Equity 13,618 12,483 13,479 14,613 16,441
Net debt / (cash) 19,666 20,053 16,529 13,440 9,655
Total cap em-
ployed 32,122 35,336 33,859 36,181 35,893
Net working capi-
tal (12,557) (10,134) (11,042) (7,120) (5,971)
Debt 23,146 23,676 18,307 16,426 13,698
Cash Flow (Rpbn)
Year end Dec 2014 2015 2016F 2017F 2018F
Core Profit (567) (86) 819 1,544 2,555
Depr / Amort 8,226 8,769 9,250 9,345 9,423
Chg in Working Cap 1,981 2,448 548 42 199
Others (2,291) (2,866) 185 91 91
CF's from oprs 7,349 8,265 10,802 11,023 12,268
Capex (6,391) (7,084) (7,510) (7,492) (7,705)
Others 1,388 (62) (423) 59 40
CF's from investing (5,004) (7,145) (7,933) (7,432) (7,664)
Net change in debt (1,008) (1,036) (5,369) (1,880) (2,728)
Others (49) (50) 655 (502) (818)
CF's from financing (1,057) (1,085) (4,714) (2,382) (3,546)
Net cash flow 1,246 143 (1,845) 1,208 1,057
Cash at BoY 2,234 3,480 3,623 1,778 2,986
Cash at EoY 3,480 3,623 1,778 2,986 4,044
Free Cashflow 958 1,181 3,292 3,532 4,563
Key Ratio Analysis
Year end Dec 2014 2015 2016F 2017F 2018F
Profitability Gross Margin (%) NA NA NA NA NA
Opr Margin (%) 7.5% 10.1% 11.8% 13.3% 15.4%
EBITDA Margin (%) 41.7% 42.9% 43.4% 42.9% 42.4%
Core Net Margin (%) -2.4% -0.3% 2.8% 4.9% 7.3%
ROAE (%) -3.8% -0.7% 6.3% 11.0% 16.5%
ROAA (%) -1.1% -0.2% 1.5% 2.9% 4.8%
Stability Current ratio (x) 0.4 0.5 0.4 0.6 0.7
Net Debt to Equity (x) 1.4 1.6 1.2 0.9 0.6
Net Debt to EBITDA (x) 2.0 1.7 1.3 1.0 0.7
Interest Coverage (x) 0.8 1.0 1.5 2.2 3.3
Efficiency A/P (days) NA NA NA NA NA
A/R (days) 32 37 36 36 36
Inventory (days) NA NA NA NA NA
Interim Result (Rpbn)
3Q15 4Q15 1Q16 2Q16 3Q16
Sales 6,962 7,187 6,813 7,129 7,582
Gross Profit NA NA NA NA NA
EBITDA 3,205 2,906 2,961 3,080 3,425
Opr. Profit 1,128 383 743 847 1,156
Net profit (389) (188) 217 211 417
Core profit 116 (149) 84 195 408
Gross Margins (%) NA NA NA NA NA
EBITDA Margins (%) 46% 40% 43% 43% 45%
Opr Margins (%) 16% 5% 11% 12% 15%
Net Margins (%) -5.6% -2.6% 3.2% 3.0% 5.5%
Core Margins (%) 1.7% -2.1% 1.2% 2.7% 5.4%
Capital History
Date
19-Oct-94 IPO @ Rp. 7,000

MARKET OUTLOOK PT Trimegah Securities Tbk - www.trimegah.com 113
XL Axiata Recovery momentum still uncertain
Paula Ruth
Expect top-line growth to recover next year
We still estimate negative top-line growth for EXCL this year, but notice
potentially better growth trend next year as : 1) Combined voice and
SMS portion in revenue to decrease; 2) Demand for data remain strong; 3) EXCL’s intention to monetize 4G traffic growth in 2017 (though im-pact depend of market dynamic); 4) Additional driver for revenue from outer Java supported by aggressive offering and network improvement, such as 900Mhz roll out for 3G sites (to complete early 2017F) and
further network upgrade for 4G preparation.
Looking for momentum next year
We expect top-line turnaround next year, though cautiously assume next year’s growth rate of 6%YoY, below industry rate, driven by stronger data revenue growth, but partially off-set by faster decline in combined voice & SMS revenue compared to last year. Our forecasts
suggested that EXCL might be able to post positive YoY revenue growth starting 2Q17 and more attractive revenue and EBITDA YoY growth in 3Q17F (comparable with post tower sale-and-lease-back in 3Q16), im-plying potential re-rating. There might be faster timing of better revenue growth momentum if EXCL can post significantly better than expected result in 4Q16.
Decrease TP to IDR2,200 (8% ups.) – Maintain Neutral
We calculate our TP using DCF method. We revised up our RFR assump-tion from 6.8% to 8.0%, causing WACC increase from 10.1% to 10.8%. Although we expect positive revenue growth in 2017E, our model indi-cates longer time until core profit turnaround. Our new TP is 35% below
our old TP, as we further de-rated our TP from 5x to 4x 2017F EV/
EBITDA, below –2 STD of EXCL’s fw-hist. EV/EBITDA of 4.4x. The com-pany trades at 2017F EV/EBITDA of 3.9x.
PT XL Axiata Tbk, doing business as XL,
is an Indonesia-based mobile telecom-
munications services operator. The oper-
ator's coverage includes Java, Bali, and
Lombok as well as the principal cities in
and around Sumatra, Kalimantan and
Sulawesi.
Share Price Rp2,040
Sector Telecommunications
Price Target Rp2,200 (8% ups.)
Year end Dec 2014 2015 2016F 2017F 2018F
Sales 23,460 22,876 21,504 22,679 24,785
EBITDA 8,623 8,393 8,177 8,565 9,627
Net Profit (804) (25) 481 (397) 114
EPS (75) (2) 45 (37) 11
Core Profit 148 1 (1,094) (837) (326)
Core EPS (Rp) 14 0 (102) (78) (31)
Core EPS Growth (%) -92.4% -99.2% NM NM NM
DPS (Rp) 4 0 0 0 0
BVPS (Rp) 1 1 2.0 2.0 2
EV/EBITDA (x) 3.9 4.0 4.1 3.9 3.5
Core P/E (x) 148 17,799 (19.9) (26.1) (66.8)
Div Yield (%) 0.2% 0.0% 0.0% 0.0% 0.0%
Neutral Rp2,200
Reuters Code EXCL.JK
Bloomberg Code EXCL.IJ
Issued Shares 10,688
Mkt Cap. (Rpbn) 21,803
Avg. Value Daily 6
Month (Rpbn) 44.7
52-Wk range 4217 / 2030
Axiata Investments (Indonesia)
Sdn. Bhd.
66.4%
Public 33.6%
EBITDA 16F 17F
Consensus (Rp bn) 8,494 9,104
TRIM vs Cons. (%) -3.7% -5.9%
Company Update
Stock Data
Major Shareholders
Consensus
Companies Data
Stock Data Stock Data Stock Price

PT Trimegah Securities Tbk - www.trimegah.com MARKET OUTLOOK 114
Figure 62. Forecast drivers
Source: Companies and TRIM Research
31 December 2013A 2014A 2015A 2016F 2017F 2018F 2019F
XL Axiata
Mobile subs (m) 61 60 42 46 47 48 49
Implied Net ARPU (Rp 000) 31 31 36 39 39 42 44
% growth -11.0% -1.6% 16.9% 8.6% 1.2% 6.8% 4.5%
Voice Outgoing MOU (min/sub/month) 169 130 106 50 31 26 23
Total MOU (min/sub/month) 338 260 213 102 64 55 48
Total minutes carried (b min) 216 188 130 54 34 30 27
% growth 1.3% -13.0% -30.7% -58.6% -36.0% -12.0% -10.0%
Incoming minutes (%) 50% 50% 50% 51% 51% 51% 51%
Voice revenue / outgoing minute (Rp) 72 85 128 281 351 362 366
% growth -8.7% 18.7% 50.7% 119.9% 24.9% 3.0% 1.0%
Data Data traffic (terabyte) 54,615 123,824 186,300 484,465 866,010 1,280,542 1,571,932
% growth 141.5% 126.7% 50.5% 160.0% 78.8% 47.9% 22.8%
Data Rate (Rp/kb) 0.07 0.04 0.03 0.02 0.01 0.01 0.01
% growth -51.8% -37.6% -24.4% -49.9% -20.0% -14.5% -5.3%
SMS Outgoing SMS (bn) 259 253 138 33 18 14 11
% growth 5.9% -2.1% -45.4% -76.5% -43.4% -22.0% -20.0%
Revenue / outgoing SMS (Rp) 18 19 28 83 114 115 117
% growth -9.2% 5.6% 51.6% 195.6% 37.4% 1.0% 1.0%
(in Rp tr) Gross revenue (Rp t) 21.4 23.6 23.0 21.6 22.8 24.9 26.5
% change 0.3% 10.4% -2.6% -6.0% 5.5% 9.3% 6.5%
Net revenue (Rp t) 21.3 23.5 22.9 21.5 22.7 24.8 26.4
% change 1.4% 10.3% -2.5% -6.0% 5.5% 9.3% 6.5%
EBITDA (Rp t) 8.7 8.6 8.4 8.2 8.6 9.6 10.3
% change -11.1% -0.4% -2.7% -2.6% 4.7% 12.4% 6.9%
EBITDA margin 40.7% 36.8% 36.7% 38.0% 37.8% 38.8% 39.0%
Capex / revenue 32.6% 24.5% 21.2% 32.0% 30.0% 24.0% 24.0%

PT Trimegah Securities Tbk - www.trimegah.com MARKET OUTLOOK 115
Figure 63. EXCL —Changes in assumption & forecast
Source: Companies and TRIM Research
YE 31 Dec (Rp bn) 2016F 2017F 2018F 2019F Note
Revenues - Current 21,504 22,679 24,785 26,389 More optimist on data revenue
growth in the next several years
Revenues - Old 21,208 22,332 23,135 23,703
% change 1% 2% 7% 11%
EBITDA - Current 8,177 8,565 9,627 10,289
EBITDA - Old 8,192 8,655 9,584 10,059
% change -0.2% -1.0% 0.4% 2.3%
EBITDA margin - Current 38.0% 37.8% 38.8% 39.0% Assume higher marketing expense.
We changed our assumption from
assuming lower interconnection rate
starting Sept’16 to no rate cut
(regulation change still delayed). EBITDA margin - Old 38.6% 38.8% 41.4% 42.4%
D&A - Current (7,773) (8,303) (8,836) (8,831)
D&A - Old (7,449) (7,861) (8,288) (8,646)
% change 4.4% 5.6% 6.6% 2.1%
EBIT - Current 404 262 791 1,457
EBIT - Old 744 794 1,296 1,413
% change -46% -66.9% -39.0% 3.2%
Net interest expense - Current (1,693) (1,245) (1,226) (940)
Net interest expense - Old (1,663) (1,438) (1,300) (969)
% change 1.8% -13.4% -5.7% -2.9%
Net profit - Current 481 (397) 114 828
Net profit - Old 1,440 (43) 437 773
% Change -66.6% NM -74.0% 7.1%
Core profit - Current (1,094) (837) (326) 388 3Q16 core loss is higher than our
estimate.
Core profit - Old (806) (483) (3) 333
% change NM NM NM 16.4%
Capex - Current 6,881 6,804 5,948 6,333 Company guides max. IDR7tn for
2016E
Capex - Old 5,938 5,940 5,846 5,990
% change 15.9% 14.5% 1.8% 5.7%
Capex of revenue – Current 32.0% 30.0% 24.0% 24.0%
Capex of revenue – Old 28.0% 26.6% 25.3% 25.3%
Net debt – Current 12,783 11,793 8,663 5,599
Net debt – old 13,076 11,392 8,665 5,726
% change -2.2% 3.5% 0.0% -2.2%

PT Trimegah Securities Tbk - www.trimegah.com MARKET OUTLOOK 116
YE Dec 31 (in Rp b) 2018F 2019F 2020F 2021F 2022F 2023F 2024F 2025F 2026F 2027F
EBIT 791 1,457 2,209 2,016 1,446 2,417 1,694 1,533 719 509
Tax Rate 25% 25% 25% 25% 25% 25% 25% 25% 25% 25%
EBIT*(1-t) 593 1,093 1,657 1,512 1,085 1,813 1,271 1,150 539 382
+ D & A 8,836 8,831 8,353 8,730 9,134 8,494 8,880 9,276 9,680 10,091
- Capex (5,948) (6,333) (6,067) (6,407) (6,646) (6,823) (6,973) (7,109) (7,236) (7,358)
+ Decrease/(increase) in
non cash working capital (104) (352) (300) (264) 105 131 98 79 78 91
FCFF 3,377 3,239 3,643 3,571 3,677 3,614 3,275 3,396 3,061 3,206
FCFF - Discounted 3,048 2,638 2,678 2,369 2,201 1,953 1,597 1,494 1,216 1,149
Value of cash-flows thro
2027 20,342
Terminal value– 4.5x
EV/EBITDA 15,196 Risk free rate 8.0%
Equity market premium 5.0%
Enterprise value 35,538 Beta 0.869
Net Debt / (Cash) 11,793 Cost of equity 12.3%
Equity value 23,745 Post-tax cost of debt 8.3%
Value per share (mn) 2,222 Debt/total capital 37.6%
WACC 10.8%
Target price after rounding 2,200
Figure 64. DCF calculations
Source: TRIM Research
Potential forex volatility impact to interest expense
EXCL’s remaining USD debt (30% to total debt) are already hedged. Among the hedged USD debt, ~14% USD
debt are hedged for principal and interest, while remaining ~86% hedged for principal only (~25% of total debt), implying impact to profitability. Interest expense still accounted 8-6% of our 2016-17F EXCL’s revenue. Our 2016-17F forex rate assumption is IDR13.6K-13.7K/USD (vs. current rate of ~IDR13.5K/USD).
De-rating
We de-rate our TP from 5x to 4x 2017F EV/EBITDA considering: 1) Substitution effect from voice and SMS to
data is relatively faster in EXCL compared to other telco players; 2) Ability to monetize data remain uncertain
considering market dynamic and subscriber behavior; 3) Time gap until the company manage to show better
momentum on top-line growth and core profit turnaround.
Risks
Upside risk might occur if revenue growth from expansion in outer Java is higher than we expected and/or less
pressure in 4G data tariff in the industry. Downside risk if EXCL cannot grow its data revenue fast enough to
offset decline in voice, SMS, and interconnection (related to off-net incoming call and SMS).

PT Trimegah Securities Tbk - www.trimegah.com MARKET OUTLOOK 117
Income Statement (Rpbn)
Year end Dec 2014 2015 2016F 2017F 2018F
Revenue 23,460 22,876 21,504 22,679 24,785
Revenue Growth (%) 10.3% -2.5% -6.0% 5.5% 9.3%
Gross Profit NA NA NA NA NA
Opr. Profit 1,782 1,258 404 262 791
EBITDA 8,623 8,393 8,177 8,565 9,627
EBITDA Growth (%) -0.4% -2.7% -2.6% 4.7% 12.4%
Net Int Inc/(Exp) (1,496) (1,080) (1,693) (1,245) (1,226)
Gain/(loss) Forex (1,295) (2,521) 481 0 0
Other Inc/(Exp) 5 1,713 1,450 587 587
Pre-tax Profit (1,003) (631) 641 (397) 151
Tax 200 605 (160) (0) (38)
Minority Int. 0 0 0 0 0
Extra. Items 0 0 0 0 0
Reported Net Profit (804) (25) 481 (397) 114
Core Net Profit 148 1 (1,094) (837) (326)
Growth (%) -92.4% -99.2% NM -23.5% -61.0%
Dividend per share 4 0 0 0 3
growth (%) -94.1% NM NM NM NM
Dividend payout
ratio -5% 0% 0% 0% 28%
Balance Sheet (Rpbn)
Year end Dec 2014 2015 2016F 2017F 2018F
Cash and equiva-
lents 6,951 3,312 2,133 1,108 1,735
Other curr asset 6,358 6,840 5,851 6,295 6,793
Net fixed asset 35,207 33,427 31,717 29,822 26,583
Other asset 15,114 15,266 15,743 15,812 16,307
Total asset 63,631 58,844 55,443 53,036 51,419
ST debt 3,922 3,922 3,050 2,893 2,500
Other curr liab 11,477 11,826 9,939 9,967 10,362
LT debt 25,707 23,031 11,866 10,008 7,898
Other LT Liab 8,478 5,973 8,997 8,742 9,028
Minority interest 0 0 0 0 0
Total Liabilities 49,583 44,753 33,852 31,609 29,787
Shareholders
Equity 14,048 14,092 21,591 21,427 21,631
Net debt / (cash) 22,677 23,642 12,783 11,793 8,663
Total cap em-
ployed 48,233 43,096 42,454 40,177 38,557
Net working capi-
tal (2,089) (5,597) (5,006) (5,457) (4,334)
Debt 29,628 26,953 14,916 12,901 10,398
Cash Flow (Rpbn)
Year end Dec 2014 2015 2016F 2017F 2018F
Net Profit (804) (25) 481 (397) 114
Depr / Amort 6,841 7,135 7,773 8,303 8,836
Chg in Working Cap 4,838 (132) (898) (416) (104)
Others (2,336) 528 0 0 (0)
CF's from oprs 8,540 7,506 7,356 7,490 8,846
Capex (7,095) (4,146) (6,881) (6,804) (5,948)
Others (9,583) (460) 0 0 0
CF's from investing (16,67
8) (4,605) (6,881) (6,804) (5,948)
Net change in debt 4,961 (5,287) (11,955
) (2,015) (2,503)
Others 8,808 (1,269) 10,301 304 232
CF's from financing 13,769 (6,556) (1,654) (1,711) (2,271)
Net cash flow 5,632 (3,655) (1,179) (1,025) 627
Cash at BoY 1,319 6,967 3,312 2,133 1,108
Cash at EoY 6,951 3,312 2,133 1,108 1,735
Free Cashflow 1,445 3,361 475 686 2,898
Key Ratio Analysis
Year end Dec 2014 2015 2016F 2017F 2018F
Profitability Gross Margin (%) NA NA NA NA NA
Opr Margin (%) 7.6% 5.5% 1.9% 1.2% 3.2%
EBITDA Margin (%) 36.8% 36.7% 38.0% 37.8% 38.8%
Core Net Margin (%) 0.6% 0.0% -5.1% -3.7% -1.3%
ROAE (%) 1.0% 0.0% -6.1% -3.9% -1.5%
ROAA (%) 0.3% 0.0% -1.9% -1.5% -0.6%
Stability Current ratio (x) 0.9 0.6 0.6 0.6 0.7
Net Debt to Equity (x) 1.6 1.7 0.6 0.6 0.4
Net Debt to EBITDA (x) 2.6 2.8 1.6 1.4 0.9
Interest Coverage (x) 1.0 0.7 0.2 0.2 0.6
Efficiency A/P (days) NA NA NA NA NA
A/R (days) 18 15 19 17 17
Inventory (days) NA NA NA NA NA
Interim Result (Rpbn)
3Q15 4Q15 1Q16 2Q16 3Q16
Sales 5,831 5,954 5,616 5,237 5,229
Gross Profit NA NA NA NA NA
EBITDA 2,196 2,320 2,191 2,065 1,979
Opr. Profit 515 439 320 -24 179
Net profit 344 481 169 55 -65
Core profit 137 -83 -200 -606 -514
Gross Margins (%) NA NA NA NA NA
EBITDA Margins (%) 37.7% 39.0% 39.0% 39.4% 37.8%
Opr Margins (%) 8.8% 7.4% 5.7% -0.5% 3.4%
Net Margins (%) 8.8% 7.4% 5.7% -0.5% 3.4%
Core Margins (%) 2.3% -1.4% -3.6% -11.6% -9.8%
Capital History
Date
29-Oct-05 IPO @ Rp. 2,000

MARKET OUTLOOK PT Trimegah Securities Tbk - www.trimegah.com 118
Share Price Rp5,625
Sector Telecommunications
Price Target Rp6,100 (8%)
Year end Dec 2014 2015 2016F 2017E 2018E
Sales 3,307 3,421 3,708 4,092 4,471
EBITDA 2,717 2,911 3,200 3,520 3,852
Net Profit 701 1,430 1,251 1,381 1,404
EPS (Rp) 28 315 275 305 310
EPS Growth (%) -92.3% 1031.0% -12.9% 10.9% 1.6%
DPS (Rp) 0 58 73 80 82
BVPS (Rp) 458 338 520 744 972
P/E (x) 201.7 17.8 20.5 18.5 18.2
EV/EBITDA (x) 17.2 16.1 14.6 13.3 12.1
Div Yield (%) 0.0% 1.0% 1.3% 1.4% 1.5%
Tower Bersama Infrastructure Overall tower industry trend remains lackluster
Neutral Rp6,100
Paula Ruth
Reuters Code TBIG.JK
Bloomberg Code TBIG.IJ
Outstanding
Shares*
4,531
Mkt Cap. (Rpbn) 25,489
Avg. Value Daily 6
Month (Rpbn) 17.0
52-Wk range 7000 / 5275
PT Wahana Anugerah Sejahtera 27.5%
PT Provident Capital Indonesia 24.7%
Public 47.8%
EBITDA 16F 17F
Consensus (Rp) 3,188 3,542
TRIM vs Cons. (%) 0.4% -0.6%
Company Update
Stock Data
Major Shareholders
Consensus
Stock Price
Companies Data
PT Tower Bersama Infrastructure Tbk provides
telecommunication infrastructure services to In-
donesian wireless carriers. The Company devel-
ops and operates telecommunication supporting
infrastructure including tower and in-building
systems across Indonesia.
Indication of better demand from Telkomsel...
We increased our 2016E (net) additional tenants from 2K to 2.3K, on
the back of more network roll-out from Telkomsel. We think this is align
with Telkomsel’s 4G volume-driven pricing strategy since last Sept,
which potentially drive subscribers’ 4G data traffic. Telkomsel said
among its ~20K new BTS in 9M16, ~85% are co-locations. We still view
the tower industry at lackluster demand period, as several operators still
intend to pursue network modernization.
.. but insignificant impact to revenue and EBITDA estimate
This only increased our 2016E-18E revenue by 2%. The company expe-
rienced decrease in tenancy rental rate in FY15 as contracts with
Telkomsel excluded electricity expense, but quarterly trend in 1H16
indicated slight increment. Thus, we expect tenancy rental rate to rise a
bit in 2016Em but still assume slight rate decrease gradually in the long
term. Our 2016E-17E EBITDA is 2-3% above to old estimates.
Valuation: TP Rp6,100—Maintain Neutral
We slightly increased our TP by 3% compared to our TP before. We raise
RFR assumption from 6.8% to 8.0%. Our number of outstanding shares
already assumed treasury stock cancellation of 265mn of shares (5.53%
of capital issued and fully paid-in capital). TBIG trades at 13x 2017E EV/
EBITDA. In calculating our TP, we use DCF method assuming WACC of
7.8%.
*) Assume 265mn treasury stock cancellation.

PT Trimegah Securities Tbk - www.trimegah.com MARKET OUTLOOK 119
Income Statement (Rpbn)
Year end Dec 2014 2015 2016E 2017E 2018E
Revenue 3,307 3,421 3,708 4,092 4,471
Growth (%) 22.9% 3.5% 8.4% 10.4% 9.3%
Gross Profit 2,797 2,972 3,225 3,545 3,859
Opr. Profit 2,505 2,661 2,904 3,183 3,467
EBITDA 2,717 2,911 3,200 3,520 3,852
Growth (%) 23.2% 7.2% 9.9% 10.0% 9.4%
Net Int Inc/(Exp) (1,404) (1,599) (1,223) (1,321) (1,575)
Gain/(loss) Forex (192) (45) 24 0 0
Other Inc/(Exp) 521 73 (38) 0 0
Pre-tax Profit 1,431 1,089 1,667 1,862 1,892
Tax (689) 356 (401) (465) (473)
Minority Int. (41) (15) (15) (15) (15)
Extra. Items 0 0 0 0 0
Reported Net Profit 701 1,430 1,251 1,381 1,404
Core Net Profit 126 1,429 1,246 1,381 1,404
growth (%) -92.3% 1031.0% -12.9% 10.9% 1.6%
Dividend per share 0 55 69 76 77
growth (%) NM NM NM 0.0% 0.0%
Dividend payout 0.0% 18.3% 26.4% 26.4% 26.4%
Balance Sheet (Rpbn)
Year end Dec 2014 2015 2016E 2017E 2018E
Cash and equivalents 901 296 972 746 764
Other curr asset 2,408 2,309 2,253 2,303 2,353
Net fixed asset 15,515 16,654 18,243 19,785 21,268
Other asset 2,806 3,540 4,382 5,382 6,620
Total asset 21,629 22,800 25,850 28,217 31,005
ST debt 7,314 439 512 1,211 1,249
Other curr liab 1,810 1,475 1,475 1,475 1,475
LT debt 8,748 18,041 20,178 20,814 22,516
Other LT Liab 1,653 1,253 1,253 1,253 1,253
Minority interest 28 61 76 91 106
Total Liabilities 19,525 21,209 23,419 24,754 26,494
Shareholders Equity 2,076 1,530 2,355 3,372 4,406
Net (debt) / cash (15,162) (18,184) (19,718) (21,279) (23,001)
Total cap employed 12,505 20,885 23,862 25,531 28,281
Net Working capital (5,816) 691 1,238 364 393
Debt 16,062 18,480 20,690 22,025 23,765
Cash Flow (Rpbn)
Year end Dec 2014 2015 2016E 2017E 2018E
Core Net Profit 126 1,429 1,246 1,381 1,404
Depr / Amort 212 250 296 338 385
Chg in Working Cap 0 0 (45) (51) (50)
Others 2,215 539 107 0 0
CF's from oprs 2,553 2,218 1,604 1,668 1,739
Capex (1,782) (1,226) (1,555) (1,570) (1,516)
Others (581) (365) 0 0 0
CF's from investing (2,363) (1,591) (1,555) (1,570) (1,516)
Net change in debt 1,445 (298) (1,225) (1,329) (1,581)
Others (1,441) (951) 1,852 1,005 1,376
CF's from financing 4 (1,249) 627 (324) (205)
Net cash flow 193 (622) 676 (226) 17
Cash at BoY 707 918 296 972 746
Cash at EoY 901 296 972 746 764
Free Cashflow 770 993 49 98 223
Key Ratio Analysis
Year end Dec 2014 2015 2016E 2017E 2018E
Profitability Gross Margin (%) 84.6% 86.9% 87.0% 86.6% 86.3%
Opr Margin (%) 75.8% 77.8% 78.3% 77.8% 77.5%
EBITDA Margin (%) 82.2% 85.1% 86.3% 86.0% 86.1%
Core Net Margin (%) 3.8% 41.8% 33.6% 33.8% 31.4%
ROAE (%) 5.3% 79.3% 64.1% 48.2% 36.1%
ROAA (%) 0.6% 6.4% 5.1% 5.1% 4.7%
Stability Current ratio (x) 0.4 1.4 1.6 1.1 1.1
Net Debt to Equity (x) 7.3 11.9 8.4 6.3 5.2
Net Debt to EBITDA (x) 5.6 6.2 6.2 6.0 6.0
Interest Coverage (x) 1.8 1.7 2.4 2.4 2.2
Efficiency A/P (days) 116 127 157 146 129
A/R (days) 39 48 48 48 48
Inventory (days) NA NA NA NA NA
Interim Result (Rpbn) Capital History
Date
26-Oct-10 IPO @ Rp2,025
3Q15 4Q15 1Q16 2Q16 3Q16
Sales 869 880 901 917 942
Gross Profit 739 772 800 814 835
Opr. Profit 655 698 726 736 756
EBITDA 736 759 784 795 818
Net profit 321 634 747 95 96
Gross Margins (%) 85.0% 87.7% 88.7% 88.9% 88.7%
EBITDA Margins (%) 84.7% 86.2% 87.0% 86.7% 86.9%
Opr Margins (%) 75.4% 79.3% 80.5% 80.4% 80.2%
Net Margins (%) 37.0% 72.0% 82.8% 10.4% 10.2%

PT Trimegah Securities Tbk - www.trimegah.com MARKET OUTLOOK 120
Media Sector

MARKET OUTLOOK PT Trimegah Securities Tbk - www.trimegah.com 121
Media Sector Still prefer radio over TV
TICKER
Price
(IDR) Mkt. Cap
TP Ups.
Rec.
EPS Growth
(%) PE (x)
EV/EBITDA
(x)
Div. yield
(%)
28-Nov (IDR bn) (%) 2016 2017 2016 2017 2016 2017 2016 2017
MNCN 1,735 23,727 1,900 9.5 Neutral 7.0 10.4 15.0 13.6 10.6 9.4 3.5 3.6
MARI 915 481 1,100 20.2 Buy 13.2 7.0 12.2 11.4 7.8 6.8 0.8 4.2
Companies Data
Paula Ruth
Neutral Supported by optimism on consumer sector’s revenue growth
We expect media companies’ to be able to pursue higher revenue growth
in the next several years on the back of higher spending from consumer
companies. Based on our Consumer Committee’s view for companies in
Trimegah Consumer Sector, we see that growth in Advertising & Promotion
expenditure to be driven by Pharmacy in 2016E and Cigarette Companies
in 2017E. MNCN, one of listed media companies whose TV station rated
no. 1 by Nielsen, said that its 9M16 advertising revenue from cigarette
jumped significantly. MNCN mentioned possibility that this might be due to
spots in Euro Cup program and possibility of impact from prohibition of
outdoor advertising for Tobacco by Gov’t.
Radio still has potential in Indonesia
Nielsen survey stated that Radio Advertising Expenditure (Adex) still in-
creased during Jan—Jun 2016 with peak during May-Jun’16 due to Lebaran
Festive Season. According to the same report, 1H16 top advertisers in
radio are: 1) Shell, 2) UNVR, and 3) Telkomsel (65% owned by TLKM),
with 1H16 highest Adex came from Shell and highest number of spots
from UNVR. Nielsen also found that more than half (57%) of radio listen-
ers are Gen Z (10-19 years old) and Millenials (20-34 years old), but most
of them tune to radio from mobile phone. We view this indicates possibil-
ity that demand for radio will still exist in the future (see Figure 3).
MARI as top pick
We have a Neutral for the sector because, although MNCN has strong
audience share momentum, we assume its earning will grow in gradual
manner. Meanwhile, we still have a Buy for MARI (TP IDR1,100), a radio
company which has largest listenership in Indonesia.

PT Trimegah Securities Tbk - www.trimegah.com MARKET OUTLOOK 122
Figure 66. Quarterly Nielsen’s audience share vs. revenue
Source: Companies, Nielsen, TRIM Research
Quarterly audience share is calculated from average monthly audience share within that quarter.
Figure 65. Trimegah Consumer Sector— Advertising & Promotion (A & P) Expense
Source: Companies, TRIM Research
Trimegah Consumer Sector: UNVR, ICBP, HMSP, GGRM, and KLBF
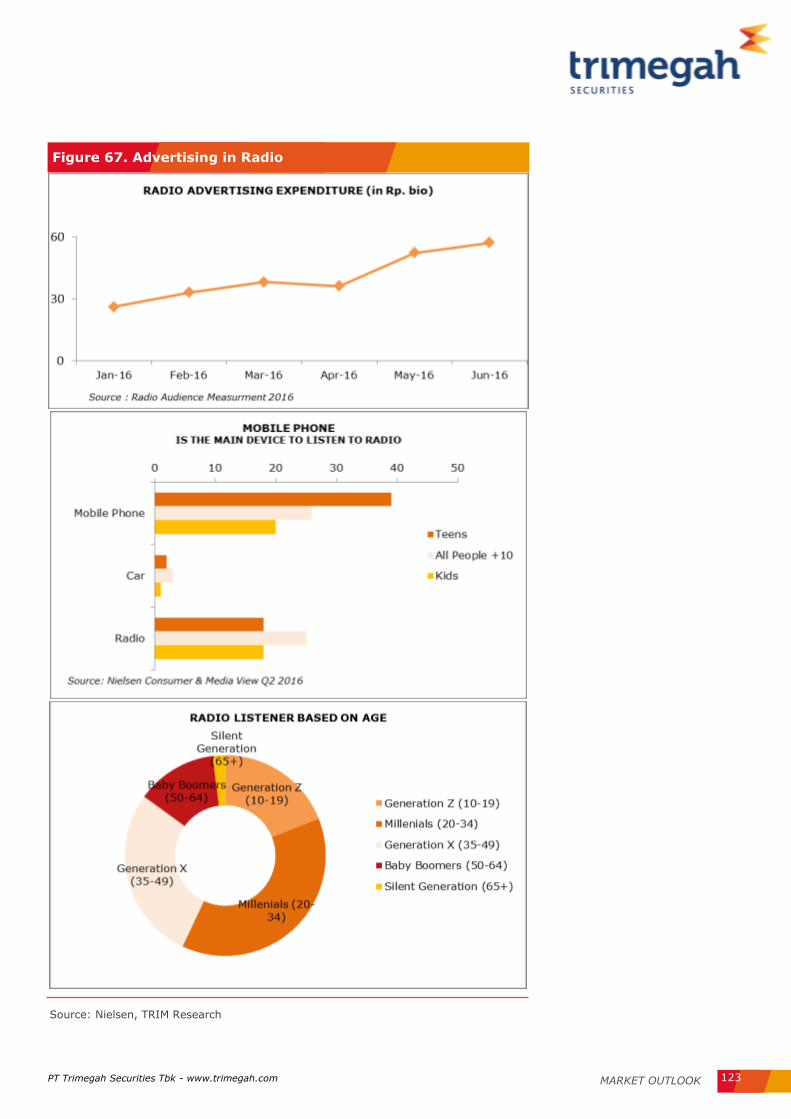
PT Trimegah Securities Tbk - www.trimegah.com MARKET OUTLOOK 123
Figure 67. Advertising in Radio
Source: Nielsen, TRIM Research

MARKET OUTLOOK PT Trimegah Securities Tbk - www.trimegah.com 124
Media Nusantara Citra Audience share remain strong but bottom-line still lagging
Paula Ruth
RCTI still delivers competitively strong program
During 3Q16, MNCN prime time (4 Free-to-Air / FTA TVs) audience share
remained strong at avg. 45%. This is relatively similar to 1H16, but
improved compared to 3Q15 at just 36% in average. In addition, RCTI
launched new sinetron “Anugrah Cinta” last August which immediately
hit no. 2 in Nielsen’s top 10 drama series, just below RCTI no. 1 drama
series “Anak Jalanan”. According to Nielsen, between Jun to Sep’16,
RCTI actually posted slight increase in prime time audience share from
26% to 31%, but blended impact to MNCN’s total audience share was off
-set by decrease in MNC TV’s share from 13% to 9%.
Top-line growth recovery to last longer
Looking into consumer industry as media industry clients, our Consumer
Committee expects generally higher top-line growth in the next several
years, supported by combination of better consumers’ purchasing pow-
er, new products innovation, and/or volume recovery. Thus, we expect
MNCN to book 2016E-18E revenue growth at 8-10%, after slight nega-
tive YoY growth last year.
Conservatively assume gradual impact to bottom-line
Although we think RCTI’s high rating momentum will drive MNCN’s reve-
nue growth, resulted margin expansion might not fully reflected to
blended level instantly, considering that MNCN’s iNews TV (just launched
Apr’15) still needs time to achieve economies of scale. We expect slight
operating margin improvement from 2016E at 35% to 2019E at 37%, on
the back of better operating scale of iNews TV and growing demand for
TV advertisement in the next several years from consumer sector. Our
consumer committee expect generally higher top-line growth in the next
several years based on combination of better purchasing power, new
products innovation, and/or volume recovery. Our 2016E-18E core profit
growth is 7%-13%YoY.
Valuation: DCF-based TP of IDR1,900 (9% upside) - Neutral
We changed our risk free rate from 6.8% to 8% resulted to WACC in-
crease from 10.7% to 11.6%, lowering TP by 13.6% to IDR1,900. We
maintain our Neutral recommendation. Our MNCN’s target price implies
15x 2017 PE. MNCN trades at 2017 PE of 14x, below SCMA 19x.
MNCN (Media Nusantara Citra) owns and
operates three FTA (Free To Air) TV sta-
tions: 1) RCTI (Rajawali Citra Televisi In-
donesia), 2) MNC TV, and 3) Global TV.
Altogether, MNCN commands 45% audi-
ence market share in 2016E, the largest
among TV ownership groups in Indone-
sia.
Share Price Rp1,735
Sector Media
Price Target Rp1,900 (10%)
NEUTRAL Rp1,900
Reuters Code MNCN.JK
Bloomberg Code MNCN.IJ
Issued Shares 13,675 Mkt Cap. (Rpbn) 23,727
Avg. Value Daily 6
Month (Rpbn) 26.4
52-Wk range 2415 / 1185
PT Global Mediacom Tbk 65.2%
Public 34.8%
EPS 16F 17F
Consensus (Rp bn) 118 136
TRIM vs Cons. (%) -3.7% -7.1%
Company Update
Stock Data
Major Shareholders
Consensus
Companies Data Stock Data Stock Data Stock Price
Year end Dec 2014 2015 2016F 2017F 2018F
Sales 6,666 6,445 6,939 7,588 8,362 Net Profit 1,761 1,186 1,700 1,745 1,965
Core Net Profit 1,827 1,474 1,578 1,742 1,961
Core EPS (Rp) 134 108 115 127 143
EPS Growth (%) 1.0% -19.3% 7.0% 10.4% 12.6%
DPS (Rp) 65 43 62 63 71
BVPS (Rp) 651 656 737 804 885
P/E (x) 13.0 16.1 15.0 13.6 12.1
Div Yield (%) 3.7 2.5 3.5 3.6 4.1

PT Trimegah Securities Tbk - www.trimegah.com MARKET OUTLOOK 125
Figure 68. DCF calculations (in IDR bn)
Periods 1 2 3 4 5 6 7 8 9 10
Years 2018 2019 2020 2021 2022 2023 2024 2025 2026 2027
EBIT x (1 - tax) 2,307 2,440 2,718 3,031 3,364 3,703 4,078 4,460 4,881 5,345
Less: Capital Expenditure (908) (855) (837) (822) (851) (930) (1,016) (1,110) (1,214) (1,329)
Changes in Working Capital (565) (295) (604) (648) (727) (794) (870) (959) (1,055) (1,161)
Add: Depreciation & Amorti-
zation 324 358 390 421 453 487 524 564 609 657
FCFF 1,158 1,648 1,666 1,982 2,239 2,467 2,716 2,955 3,220 3,511 Discount Factor 1.12 1.25 1.39 1.55 1.73 1.93 2.15 2.40 2.68 2.99 PV of FCFF 1,038 1,324 1,199 1,279 1,295 1,278 1,261 1,230 1,201 1,174
Terminal Value 56,028 Sum of PV of FCFF 12,278 Risk Free Rate 8.00% PV of Terminal Value 18,729 Market Premium 5.0%
Add: Cash & Marketable Sec 232 Stock Beta
1.33
Less: Debt 5,003 Cost of Equity 14.6% NAV (IDR bn) 26,236 6.0% Cost of debt
Total Share (billion) 13.675 Debt portion of
capital 30.1%
NAV (IDR / share) 1,918 WACC 11.6%
Target Price 1,900 Terminal growth
rate 5.0%
Source: Company, Bloomberg, Trimegah research

PT Trimegah Securities Tbk - www.trimegah.com MARKET OUTLOOK 126
Income Statement (Rpbn)
Year end Dec 2014 2015 2016F 2017F 2018F
Revenue 6,666 6,445 6,939 7,588 8,362
Growth (%) 2.2% -3.3% 7.7% 9.3% 10.2%
Gross Profit 3,853 3,584 3,782 4,173 4,641
Opr. Profit 2,604 2,194 2,437 2,727 3,076
EBITDA 2,780 2,403 2,692 3,016 3,400
Growth (%) 2.1% -13.6% 12.0% 12.0% 12.7%
Net Int Inc/(Exp) 28 (133) (195) (244) (281)
Gain/(loss) Forex (77) (315) 167 0 0
Other Inc/(Exp) (12) (65) (4) 4 5
Pre-tax Profit 2,542 1,681 2,404 2,486 2,800
Tax (660) (404) (601) (621) (700)
Minority Int. 121 91 103 120 135
Extra. Items 0 0 0 0 0
Reported Net Profit 1,761 1,186 1,700 1,745 1,965
Core Net Profit 1,827 1,474 1,578 1,742 1,961
growth (%) 1.0% -19.3% 7.0% 10.4% 12.6%
Dividend per share 64 42 61 62 70
growth (%) -20.7% -33.9% 43.4% 2.6% 12.6%
Dividend payout
ratio
50.4% 49.5% 49.5% 49.5% 49.5%
Balance Sheet (Rpbn)
Cash Flow (Rpbn)
Year end Dec 2014 2015 2016F 2017F 2018F
Core Profit 1,827 1,474 1,578 1,742 1,961
Depr / Amort 176 209 256 290 324
Chg in Working Cap 1,188 464 (69) 529 565
Others (2,093) (898) (1,216) (1,423) (1,474)
CF's from oprs 1,098 1,249 549 1,137 1,377
Capex 1,289 1,420 881 915 908
Others (4,024) (2,484) (1,681) (1,761) (1,827)
CF's from investing (2,736) (1,064) (800) (845) (919)
Net change in debt 2,665 599 873 332 615
Others (470) (1,518) (580) (832) (854)
CF's from financing 2,195 (919) 293 (501) (239)
Net cash flow 557 (734) 42 (208) 218
Cash at BoY 575 1,132 398 440 232
Cash at EoY 1,132 398 440 232 450
Free Cashflow 2,387 2,670 1,430 2,053 2,285
Key Ratio Analysis
Year end Dec 2014 2015 2016F 2017F 2018F
Profitability
Gross Margin (%) 57.8% 55.6% 54.5% 55.0% 55.5%
Opr Margin (%) 39.1% 34.0% 35.1% 35.9% 36.8%
EBITDA Margin (%) 41.7% 37.3% 38.8% 39.8% 40.7%
Core Net Margin (%) 27.4% 22.9% 22.7% 23.0% 23.4%
ROAE (%) 22.4% 16.5% 16.6% 16.5% 17.0%
ROAA (%) 15.7% 10.5% 10.2% 10.1% 10.4%
Stability Current ratio (x) 9.7 7.4 6.5 6.9 6.9
Net Debt to Equity (x) 0.2 0.4 0.4 0.4 0.4
Net Debt to EBITDA (x) 0.7 1.4 1.6 1.6 1.5
Interest Coverage (x) 44.7 11.2 10.7 9.7 10.2
Efficiency A/P (days) 52 65 59 62 60
A/R (days) 176 192 192 192 192
Inventory (days) 212 203 198 201 203
Interim Result (Rpbn)
3Q15 4Q15 1Q16 2Q16 3Q 16
Sales 1,700 1,414 1,539 2,030 1,696
Gross Profit 917 722 882 1,149 930
Opr. Profit 571 317 518 780 592
Net profit (47) 536 480 523 441
Core profit 174 482 353 496 387
Gross Margins (%) 53.9% 51.0% 57.3% 56.6% 54.9%
Opr Margins (%) 33.6% 22.4% 33.6% 38.4% 34.9%
Net Margins (%) -2.8% 37.9% 31.2% 25.7% 26.0%
Core Margin (%) 10.3% 34.1% 22.9% 24.4% 22.8%
Capital History
Date
22-Jun-07 IPO @ Rp900
Year end Dec 2014 2015 2016F 2017F 2018F
Cash and equiva-
lents
1,132 398 440 232 450
Other curr asset 7,538 7,328 7,365 7,980 8,708
Net fixed asset 2,659 4,145 4,771 5,397 5,981
Other asset 2,280 2,602 3,951 4,227 4,563
Total asset 13,609 14,475 16,528 17,836 19,702
ST debt 55 117 209 140 155
Other curr liab 837 923 995 1,046 1,173
LT debt 3,144 3,681 4,462 4,862 5,462
Other LT Liab 180 187 176 189 202
Minority interest 486 601 601 601 601
Total Liabilities 4,216 4,908 5,842 6,238 6,993
Shareholders Equi-
ty
8,907 8,966 10,085 10,998 12,108
Net (debt) / cash (2,067) (3,399) (4,231) (4,771) (5,167)
Total cap employed 12,717 13,435 15,324 16,650 18,374
Net Working capital 7,778 6,687 6,602 7,025 7,830
Debt 3,199 3,798 4,671 5,003 5,618
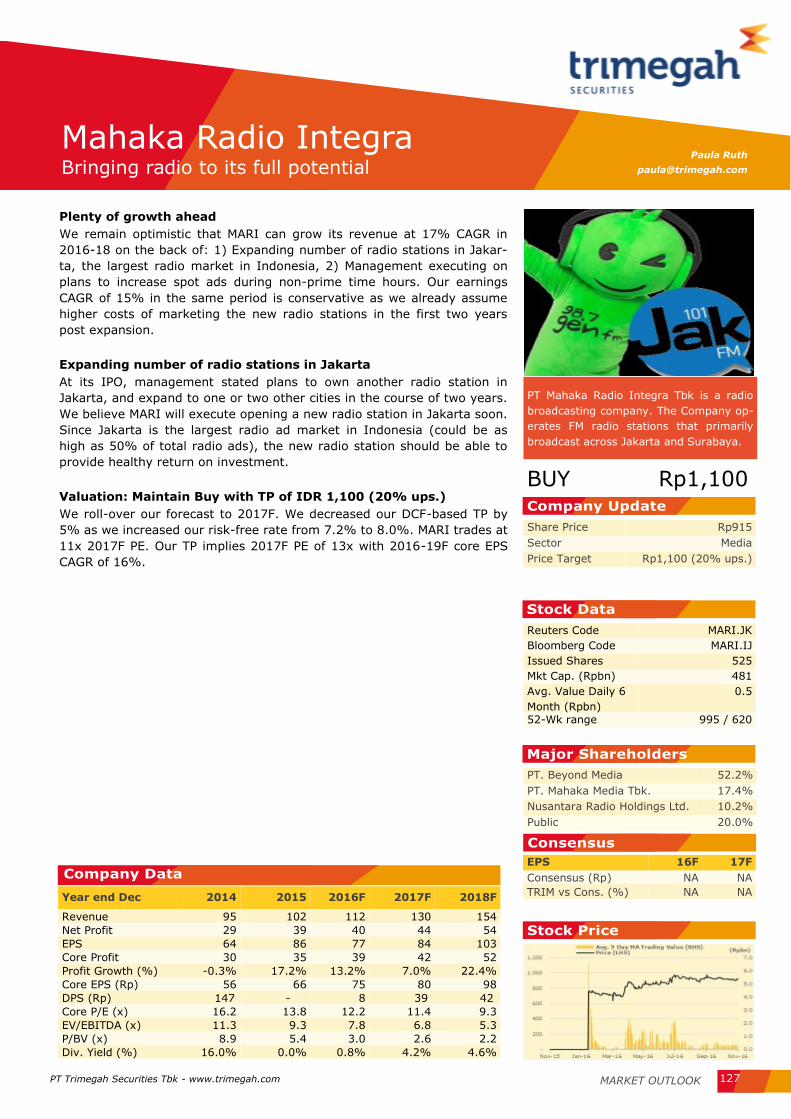
MARKET OUTLOOK PT Trimegah Securities Tbk - www.trimegah.com 127
Plenty of growth ahead
We remain optimistic that MARI can grow its revenue at 17% CAGR in
2016-18 on the back of: 1) Expanding number of radio stations in Jakar-
ta, the largest radio market in Indonesia, 2) Management executing on
plans to increase spot ads during non-prime time hours. Our earnings
CAGR of 15% in the same period is conservative as we already assume
higher costs of marketing the new radio stations in the first two years
post expansion.
Expanding number of radio stations in Jakarta
At its IPO, management stated plans to own another radio station in
Jakarta, and expand to one or two other cities in the course of two years.
We believe MARI will execute opening a new radio station in Jakarta soon.
Since Jakarta is the largest radio ad market in Indonesia (could be as
high as 50% of total radio ads), the new radio station should be able to
provide healthy return on investment.
Valuation: Maintain Buy with TP of IDR 1,100 (20% ups.)
We roll-over our forecast to 2017F. We decreased our DCF-based TP by
5% as we increased our risk-free rate from 7.2% to 8.0%. MARI trades at
11x 2017F PE. Our TP implies 2017F PE of 13x with 2016-19F core EPS
CAGR of 16%.
PT Mahaka Radio Integra Tbk is a radio
broadcasting company. The Company op-
erates FM radio stations that primarily
broadcast across Jakarta and Surabaya.
Share Price Rp915
Sector Media
Price Target Rp1,100 (20% ups.)
Year end Dec 2014 2015 2016F 2017F 2018F
Revenue 95 102 112 130 154
Net Profit 29 39 40 44 54
EPS 64 86 77 84 103
Core Profit 30 35 39 42 52
Profit Growth (%) -0.3% 17.2% 13.2% 7.0% 22.4%
Core EPS (Rp) 56 66 75 80 98
DPS (Rp) 147 - 8 39 42
Core P/E (x) 16.2 13.8 12.2 11.4 9.3
EV/EBITDA (x) 11.3 9.3 7.8 6.8 5.3
P/BV (x) 8.9 5.4 3.0 2.6 2.2
Div. Yield (%) 16.0% 0.0% 0.8% 4.2% 4.6%
Mahaka Radio Integra Bringing radio to its full potential
BUY Rp1,100
Reuters Code MARI.JK
Bloomberg Code MARI.IJ
Issued Shares 525
Mkt Cap. (Rpbn) 481
Avg. Value Daily 6
Month (Rpbn)
0.5
52-Wk range 995 / 620
PT. Beyond Media 52.2%
PT. Mahaka Media Tbk. 17.4%
Nusantara Radio Holdings Ltd. 10.2%
Public 20.0%
EPS 16F 17F
Consensus (Rp) NA NA
TRIM vs Cons. (%) NA NA
Company Update
Stock Data
Major Shareholders
Consensus
Stock Price
Company Data
Paula Ruth

PT Trimegah Securities Tbk - www.trimegah.com MARKET OUTLOOK 128
Source: Trimegah research
Figure 69. DCF-based NAV calculation
Year 1 Year 2 Year 3 Year 4 Year 5
in Rpbn 2018F 2019F 2020F 2021F 2022F
EBIT (1- tax) 54 64 77 91 107
Depreciation and Amortisation 8 9 9 10 11
Changes in non-cash Working Capital (12) (11) (15) (16) (16)
Capex (15) (5) (6) (7) (8)
FCFF 35 56 64 78 93
Discounted FCFF 32 46 47 52 56
Discounted FCFF Year 1-5 233 Terminal Value Assumptions
Terminal Value 260 Terminal ROIC 15.0%
Net debt (cash) (2) WACC 10.8%
Loans to related parties (cash equivalent)
70 LT Growth 5.0%
NAV 561 EV/Invested Capital 1.7
Invested Capital in 2022 253
Shares outstanding (mn) 525 EV in 2022 435
NAV / share (post-IPO) 1,068
Target price after rounding 1,100

PT Trimegah Securities Tbk - www.trimegah.com MARKET OUTLOOK 129
Year end Dec 2014 2015 2016F 2017F 2018F
Revenue 95 102 112 130 154
Revenue Growth (%) 18% 7% 10% 16% 18%
Opr. Profit 40 47 53 58 72
EBITDA 42 49 55 64 80
EBITDA Growth (%) 4% 18% 13% 16% 24%
Net Int Inc/(Exp) 9 7 5 3 4
Gain/(loss) Forex 0 0 0 0 0
Other Inc/(Exp) (0) 3 1 1 0
Pre-tax Profit 39 51 54 59 72
Tax (10) (11) (13) (15) (18)
Minority Int. 0 0 0 0 0
Extra. Items 0 0 0 0
Reported Net Profit 29 39 40 44 54
Core Net Profit 30 35 39 42 52
growth (%) 0% 17% 13% 7% 22%
Dividend per share 147 0 8 39 42
growth (%) 31% -100% NM 413% 8%
Dividend payout ratio 266% 0% 10% 50% 50%
Income Statement (Rpbn) Balance Sheet (Rpbn)
Year end Dec 2014 2015 2016F 2017F 2018F
Cash and equivalents 66 65 50 78 92
Other curr asset 75 65 73 93 111
Net fixed asset 4 3 38 58 65
Other asset 21 23 24 29 29
Total asset 166 156 185 258 296
ST debt 56 40 12 12 12
Other curr liab 42 23 6 30 36
LT debt 0 0 0 20 20
Other LT Liab 14 5 6 11 11
Minority interest 0 0 0 0 0
Total Liabilities 112 68 23 73 78
Shareholders Equity 54 88 162 186 218
Net cash (debt) 10 25 39 46 60
Total cap employed 37 45 105 121 139
Net Working capital 33 42 67 63 75
Debt 56 40 12 32 32
Cash Flow (Rpbn)
Year end Dec 2014 2015 2016F 2017F 2018F
Core Net Profit 30 35 39 42 52
Depr / Amort 2 2 3 6 8
Chg in Working Cap 20 11 54 (5) 12
Others (59) (22) (78) 11 (21)
CF's from oprs (8) 25 18 55 50
Capex 1 1 37 26 15
Others (2) (3) (74) (53) (29)
CF's from investing (1) (1) (37) (26) (15)
Net change in debt (16) (27) (28) 20 0
Others 21 5 31 (20) (22)
CF's from financing 6 (22) 2 (0) (22)
Net cash flow (3) 2 (17) 28 14
Cash at BoY 19 16 19 2 29
Cash at EoY 16 19 2 29 43
Free Cashflow (7) 27 55 81 65
Key Ratio Analysis
Year end Dec 2014 2015 2016F 2017F 2018F
Profitability Opr Margin (%) 41.7% 46.4% 46.9% 44.7% 46.7%
EBITDA Margin (%) 43.7% 48.0% 49.5% 49.4% 51.9%
Core Net Margin (%) 31.2% 34.1% 35.1% 32.5% 33.6%
ROAE (%) 50.6% 49.0% 31.5% 24.2% 25.6%
ROAA (%) 16.8% 21.6% 23.1% 19.0% 18.6%
Stability
Current ratio (x) 1.4 2.1 7.1 4.1 4.2
Net Debt to Equity (x) (0.2) (0.3) (0.2) (0.3) (0.3)
Net Debt to EBITDA (x) (0.2) (0.5) (0.7) (0.7) (0.8)
Interest Coverage (x) (4.5) (6.8) (12.1) (22.4) (20.0)
Efficiency A/P (days) 9 0 0 0 0
A/R (days) 247 217 201 219 219
Inventory (days) 0 0 0 0 0
Capital History
Date
11-Feb-2016 IPO @ Rp. 750

PT Trimegah Securities Tbk - www.trimegah.com MARKET OUTLOOK 130
Construction Sector

MARKET OUTLOOK PT Trimegah Securities Tbk - www.trimegah.com 131
Construction Sector Lucrative price offsets the headwind ahead
We expect lower government-disbursement from Ministries
Macro outlook for 2017 seems to have a mixed impact on infrastructure
SOE where we foresee budget cut for ministries that might impact nega-
tively on SOE contractors. Based on government priority projects, we
can expect higher portion of oil refinery projects as government plans to
refurbish 5 oil refineries projects; Cilacap, Balongan, dumai, Balikpapan,
and Plaju, whilst the amount for toll-road projects should decrease. The
increase in oil refinery projects will benefit several companies due to the
higher gross margin these projects give.
But valuations are cheap for the time being
Construction-sector stocks are currently trading below their 3-years
average PE, but does not necessarily translate to a downwards rerating
as the main cause of depreciation itself was due to the recently occurred
massive foreign selloffs following uncertainty over emerging markets
post-Trump election (and made worse due to the fact that ~15% of
infra/construction stocks were owned by foreign investors).
In search of the one with most value-for-money..
As macro condition is not exactly at the sector’s favor, coupled by at-
tractive entry-point prices, we screen potential stocks over their: 1)
Price-to-equity ratio, 2) EV-to New Contract, 3) Potential earnings
growth. We also believe that given how tight 2017 state budget’s alloca-
tion to infrastructure / construction related ministries is (which was
lowered by 7% YoY), companies’ ability to add leverage becomes ex-
tremely crucial and would potentially be the game-changing factor for
2017.
..with WSKT and WIKA as our top picks
We pick WSKT and WIKA as our top picks as both of them offer security
amid the volatility macro uncertainty ahead. WSKT’s sheer order book
size (which is way above its peers) that should secure their revenue as
well as net profit growth for another 3-4 years, while still having high
chances on securing Indonesia’s upcoming toll-road related new con-
tracts, and WIKA’s current order book manage to cover 99% of our
revenue estimate for the next three years.
Sebastian Tobing, CFA
Gabriela Jacoub
NEUTRAL
Companies Data
Rec.
TP Sh. Px. Ups EPS Growth EV/EBITDA(x) Div. yield (%)
(Rp/sh) (Rp/sh) (%) 2016 2017 2016 2017 2016 2017
WSKT BUY 2,910 2,270 28.2 17.3 80.8 16.0 9.5 0.3 0.6
WIKA BUY 2,930 2,330 25.8 17.7 6.6 7.7 4.4 0.9 1.0
WSBP BUY 630 555 13.5 202.9 0.1 9.4 7.3 0.0 0.0
PTPP NEUTRAL 4,210 3,900 7.9 27.1 12.1 8.7 6.5 1.0 1.1
ADHI NEUTRAL 1,930 1,830 5.5 -50.7 30.1 6.9 5.5 1.1 1.4
WTON SELL 760 805 -5.6 106.3 -20.8 9.7 10.8 1.4 0.8

PT Trimegah Securities Tbk - www.trimegah.com MARKET OUTLOOK 132
2017: What to Expect
Macro outlook for 2017 seems to have a mixed impact on infrastructure SOE. We are seeing budget cut for min-
istries that might impact negatively on SOE contractors. Yet, oil refinery projects that should start to tender in
2017, should positively impact certain SOEs due to their average higher margin.
1) Infrastructure budget to increase, but not necessarily from SOEs
As overall construction sector’s new contracts are 98% correlated with infrastructure state budget, a 23% YoY in
Indonesia’s 2017 proposed infrastructure budget should boost the sector as a whole. It should be noted however
that this does not necessarily mean that it would instantly increase the year’s SOE new contract outlook especial-
ly considering that despite new projects varying from toll roads, power plants, and even low income housing pro-
jects (which all is being derived from numerous ministries), state budget’s disbursements to ministries had been
lowered by 7% YoY. The state budget’s overall increase itself was mainly due to the increase in government dis-
bursements to local governments where they would typically appoint smaller-scale contractors for their projects
instead of SOE contractors.
2) A shift towards oil refinery projects that yields better margin than toll-roads
Based on government priority projects, we can expect higher portion of oil refinery projects as government plans
to refurbish 5 oil refineries projects; Cilacap, Balongan, Dumai, Balikpapan, and Plaju (total investment value:
IDR210tn), whilst the amount for toll-road projects should decrease which then create a positive sentiment to
both WIKA and PTPP as they already have on-going Energy-sector EPC exposure that can contribute higher gross
margins at ~12% compared to toll road’s ~10% gross margin. ADHI, on the other hand, might experience diffi-
culty in benefitting from this EPC construction sector as they are currently still in loss making state over their
past Energy-sector EPC projects.
Figure 70. Infrastructure State Budget & Priority Project Types
Source: Trimegah Research, kppip.go.id, kemenkeu.go.id

PT Trimegah Securities Tbk - www.trimegah.com MARKET OUTLOOK 133
2017: A lucrative entry point
Each infra / construction-sector stocks are currently trading below their 3-years average PE. Though it is current-
ly at a downtrend, this does not necessarily translate to a downwards rerating, as we think the decrease itself is
due to large foreign-flow exposure to Indonesia (on average, 15.4% of infrastructure shares were owned by for-
eign investors); which experienced massive sell-off following Trump’s election towards emerging-market pro-
spects. On average, 15.4% of infrastructure shares is owned by foreign investor. We think this uncertainty
should sustain until Trump had finally sits his office and the market can then assess his policy direction. Thus, we
remain prudent in stock picking where we look for the ones with most value-for-money among all.
Figure 71. WIKA’s Forward PE Band Figure 72. ADHI’s Forward PE Band
Figure 73. PTPP’s Forward PE Band Figure 74. WSKT’s Forward PE Band
Figure 75. WTON’s Forward PE Band Figure 76. WSBP’s Forward PE Band
Source: Trimegah Research, Company Source: Trimegah Research, Company
Source: Trimegah Research, Company Source: Trimegah Research, Company
Source: Trimegah Research, Company Source: Trimegah Research, Company

PT Trimegah Securities Tbk - www.trimegah.com MARKET OUTLOOK 134
The search for the true value-for-money item
Our definition of cheap will be based on 2 aspects; price-to-earnings ratio and Enterprise Value-to-new contract,
along with companies’ ability to add debt, order book scale, and revenue coverage. Given that 2017’s state-
budget’s allocation for ministries is tight, having room to leverage would be the key differentiating factor for each
companies. We also see order book and earnings coverage as added features that should hedge the fluctuation of
new contract that might happen in the year ahead.
In terms of Pricing: WSKT
In terms of pricing, WSKT and ADHI are the two cheapest stock in PE perspective, yet WSKT is still cheaper than
ADHI in terms of EV/ New Contract. Therefore, we can conclude that WSKT is the cheapest one.
In terms of room to leverage: WTON & WSBP
WSBP and WTON are the ones with least leverage, which is due to their business nature as a precast manufac-
turer rather than contractor. Being a precast manufacturer implies that they have less exposure to lengthy ac-
count receivables as goods were sold in a cash and carry basis, which translates to lower necessity to add debt.
In terms of order book scale: WSKT & WIKA
The one with the biggest order book is WSKT, with an estimated order book of ~IDR126trn, followed by WIKA at
IDR77trn.
In terms of 3 years revenue coverage: WIKA & WSKT
Revenue coverage is a percentage of how big 2016’s order book compared to the next 3 years of its forecasted
revenue. The higher the percentage is, the more guaranteed the revenue for 3 years ahead. Thus, more potential
downside. On this sense, WIKA is the one who is least exposed to fluctuation, followed by WKST.
WSKT and WIKA as our top picks.
Based on the description stated above, we pick WSKT and WIKA as our top picks as both of them offers security
over a possible fluctuation of new contract ahead. . WSKT is our top pick due to the sheer order book scale which
should secure both revenue as well as Net Profit growth for another 3-4 years ahead, whilst still having chances
on further increasing their order book following Indonesia’s aggressive stance on nation-wide toll-road connectiv-
ity. On top of that WSKT is the cheapest one among its peers. WIKA also have huge order book which could cov-
er our next 3 years revenue forecast.
2017 PE EV/ New Con-
tract
3 Years Revenue
Coverage
WSKT 14 0.7 74%
ADHI 14 0.8 27%
WIKA 20 0.9 99%
PTPP 18 1.0 72%
WSBP 16 1.5 24%
WTON 26 2.7 19%
Figure 77. Construction PE & EV/ New Contract Ratio & Debt to Equity Ratios
Source: Trimegah Research, Company
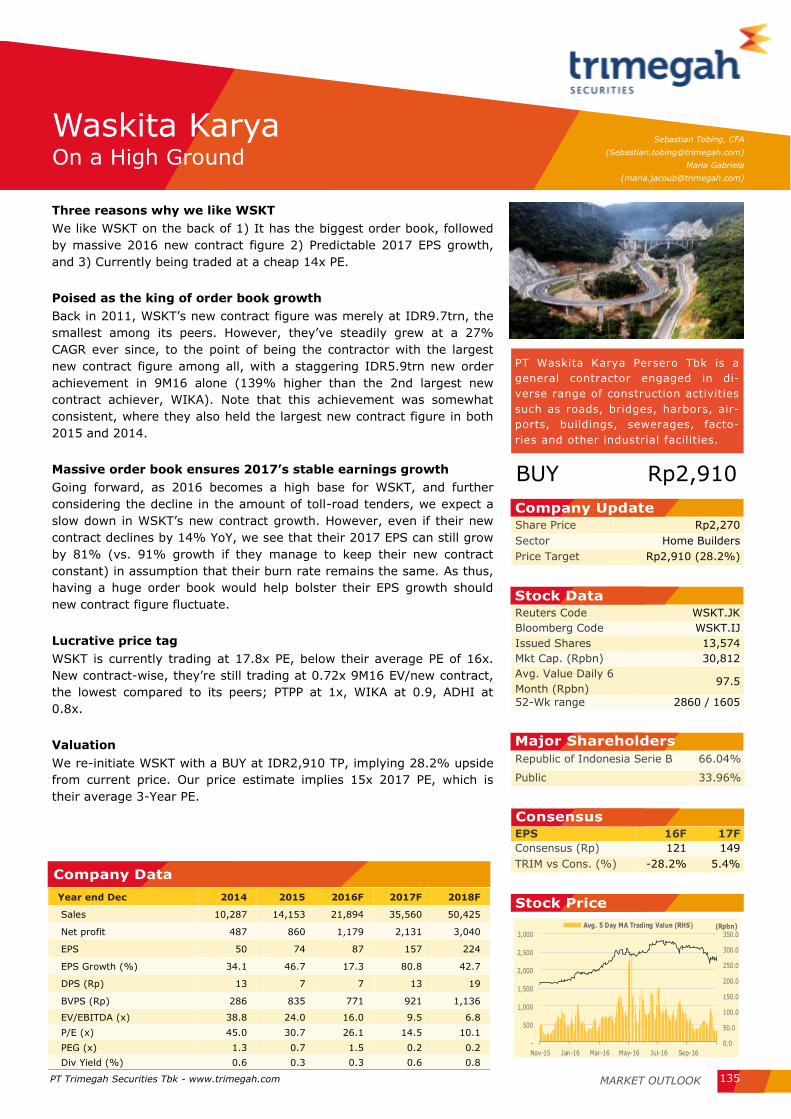
MARKET OUTLOOK PT Trimegah Securities Tbk - www.trimegah.com 135
Three reasons why we like WSKT
We like WSKT on the back of 1) It has the biggest order book, followed
by massive 2016 new contract figure 2) Predictable 2017 EPS growth,
and 3) Currently being traded at a cheap 14x PE.
Poised as the king of order book growth
Back in 2011, WSKT’s new contract figure was merely at IDR9.7trn, the
smallest among its peers. However, they’ve steadily grew at a 27%
CAGR ever since, to the point of being the contractor with the largest
new contract figure among all, with a staggering IDR5.9trn new order
achievement in 9M16 alone (139% higher than the 2nd largest new
contract achiever, WIKA). Note that this achievement was somewhat
consistent, where they also held the largest new contract figure in both
2015 and 2014.
Massive order book ensures 2017’s stable earnings growth
Going forward, as 2016 becomes a high base for WSKT, and further
considering the decline in the amount of toll-road tenders, we expect a
slow down in WSKT’s new contract growth. However, even if their new
contract declines by 14% YoY, we see that their 2017 EPS can still grow
by 81% (vs. 91% growth if they manage to keep their new contract
constant) in assumption that their burn rate remains the same. As thus,
having a huge order book would help bolster their EPS growth should
new contract figure fluctuate.
Lucrative price tag
WSKT is currently trading at 17.8x PE, below their average PE of 16x.
New contract-wise, they’re still trading at 0.72x 9M16 EV/new contract,
the lowest compared to its peers; PTPP at 1x, WIKA at 0.9, ADHI at
0.8x.
Valuation
We re-initiate WSKT with a BUY at IDR2,910 TP, implying 28.2% upside
from current price. Our price estimate implies 15x 2017 PE, which is
their average 3-Year PE.
Waskita Karya On a High Ground
Sebastian Tobing, CFA
Maria Gabriela
PT Waskita Karya Persero Tbk is a
general contractor engaged in di-
verse range of construction activities
such as roads, bridges, harbors, air-
ports, buildings, sewerages, facto-
ries and other industrial facilities.
BUY Rp2,910
Share Price Rp2,270
Sector Home Builders
Price Target Rp2,910 (28.2%)
Company Update
Reuters Code WSKT.JK
Bloomberg Code WSKT.IJ
Issued Shares 13,574
Mkt Cap. (Rpbn) 30,812
Avg. Value Daily 6
Month (Rpbn) 97.5
52-Wk range 2860 / 1605
Stock Data
Republic of Indonesia Serie B 66.04%
Public 33.96%
Major Shareholders
EPS 16F 17F
Consensus (Rp) 121 149
TRIM vs Cons. (%) -28.2% 5.4%
Consensus
Stock Price
0.0
50.0
100.0
150.0
200.0
250.0
300.0
350.0
-
500
1,000
1,500
2,000
2,500
3,000
Nov-15 Jan-16 Mar-16 May-16 Jul-16 Sep-16
(Rpbn)Avg. 5 Day MA Trading Value (RHS)
Company Data
Year end Dec 2014 2015 2016F 2017F 2018F
Sales 10,287 14,153 21,894 35,560 50,425
Net profit 487 860 1,179 2,131 3,040
EPS 50 74 87 157 224
EPS Growth (%) 34.1 46.7 17.3 80.8 42.7
DPS (Rp) 13 7 7 13 19
BVPS (Rp) 286 835 771 921 1,136
EV/EBITDA (x) 38.8 24.0 16.0 9.5 6.8
P/E (x) 45.0 30.7 26.1 14.5 10.1
PEG (x) 1.3 0.7 1.5 0.2 0.2
Div Yield (%) 0.6 0.3 0.3 0.6 0.8

PT Trimegah Securities Tbk - www.trimegah.com MARKET OUTLOOK 136
Income Statement (Rpbn)
Year end Dec 2014 2015 2016F 2017F 2018F
Revenue 10,287 14,153 21,894 35,560 50,425
Revenue Growth (%) 6.2 37.6 54.7 62.4 41.8
Gross Profit 1,109 1,921 2,969 4,878 6,920
Opr. Profit 431 518 781 1,140 1,627
EBITDA 961 1,558 2,333 3,909 5,489
EBITDA Growth (%) 32.6 62.0 49.8 67.6 40.4
Net Int Inc/(Exp) (140) (267) (304) (323) (415)
Gain/(loss) Forex (3) 13 0 0 0
Other Inc/(Exp) 24 146 83 151 195
Pre-tax Profit 756 1,398 1,993 3,604 5,122
Tax (254) (350) (763) (1,380) (1,961
)
Minority Int. (0) (0) 0 0 0
Extra. Items 0 0 0 0 0
Reported Net Profit 502 1,048 1,230 2,224 3,161
Core Net Profit 487 860 1,179 2,131 3,040
Growth (%) 34.4 76.4 37.1 80.8 42.7
Balance Sheet (Rpbn)
Year end Dec 2014 2015 2016F 2017F 2018F
Cash and equivalents 1,675 5,511 5,309 3,145 3,292
Other curr. Assets 8,430 12,564 14,410 23,298 33,076
Net Fixed Assets 622 2,183 2,773 3,079 3,385
Other Assets 1,815 10,051 16,170 21,026 22,992
Total Assets 12,542 30,309 38,662 50,549 62,746
ST Debt 1,917 3,488 4,939 5,580 5,930
Other Curr Liab. 5,811 10,177 13,809 22,151 30,093
LT Debt 1,246 4,809 7,153 6,813 6,848
Other LT Liab. 803 2,131 2,301 3,497 4,459
Minority Interest 0 0 0 0 0
Total Liabilities 9,777 20,605 28,202 38,042 47,331
Shareholder's Equity 2,765 9,704 10,461 12,507 15,415
Net Debt/(Cash) 1,488 2,234 4,012 6,813 7,647
Total cap employed 5,928 17,450 19,781 22,465 26,354
Net Working Capital 2,377 4,410 971 -1,288 345
Debt 3,167 8,034 11,824 12,124 12,509
Cash Flow (Rpbn)
Year end Dec 2014 2015 2016F 2017F 2018F
Net Profit 502 1,048 1,230 2,224 3,161
Depr/Amort 86 143 119 133 147
Chg in Working Capi-
tal -509 232 1,785 -545 -1,836
CF's from Oprs 78 1,422 3,134 1,812 1,472
Capex 0 0 0 0 0
Others -1,516 -9,940 -6,828 -5,295 -2,419
CF's from investing -1,516 -9,940 -6,828 -5,295 -2,419
Net Change in Debt 3,163 8,035 11,830 12,131 12,516
Others -1,190 -1,053 -8,339 -10,811 -11,422
CF's from Financing 1,973 6,982 3,491 1,320 1,094
Net Cash Flow 535 -1,536 -202 -2,163 147
Cash at BoY 1,120 1,675 5,511 5,309 3,145
Cash at EoY 1,675 5,511 5,309 3,145 3,292
Free Cashflow 78 1,422 3,134 1,812 1,472
Key Ratio Analysis
Year end Dec 2014 2015 2016F 2017F 2018F
Profitability
Gross Margin - before 10.8 13.6 13.6 13.7 13.7
Op. Margin (%)
EBITDA Margin (%) 9.3 11.0 10.7 11.0 10.9
Core Net Margin (%) 4.7 6.1 5.4 6.0 6.0
ROE (%) 19% 17% 12% 19% 23%
ROA (%) 5% 5% 4% 5% 6%
Stability
Current Ratio (x) 1.3 1.3 1.1 1.0 1.0
Net Debt to Equity (x) 0.54 0.23 0.38 0.54 0.50
Interest Coverage (x) 0.1 0.1 0.1 0.2 0.2
Efficiency
A/P days 95 118 120 129 129
A/R days 70 89 86 80 75
Inventory Days 18 21 24 23 22
Interim Result (Rpbn)
3Q15 4Q15 1Q16 2Q16 3Q16
Sales 3,438 6,731 3,072 5,013 5,923
Gross Profit 428 975 484 997 938
Operating Profit 316 731 384 854 824
Net Profit 229 647 127 459 348
Gross Margins (%) 12% 14% 16% 20% 16%
Opr Margins (%) 9% 11% 12% 17% 14%
Net Margins (%) 7% 10% 4% 9% 6%
Capital History
Date
09-Dec-12 IPO @ IDR380
08-Jul-15 Right Issue @IDR100

MARKET OUTLOOK PT Trimegah Securities Tbk - www.trimegah.com 137
Wijaya Karya
Three reasons why we have a buy on WIKA
We re-initiate WIKA with a buy on the back of 1) significant progress in High
Seed Railway project 2) Potential revenue upside from Jakarta LRT’s first-phase
construction, and 3) cheap valuation.
Significant progress in HSR project
HSR project has been hitting two speed bumps, 1) the debt financing from China
Development Bank (CDB) that cannot be drown down by WIKA, 2) Tight deadline
on HSR land clearing progress. Yet, as of 11M16, WIKA has managed to gain
approval of supreme court’s legal opinion, officially appointing WIKA as the con-
tractor of HSR. As thus, CDB has the necessary assurance to disburse the loan
needed for HSR construction. As of 11M16, land clearing has also reached 85%,
which is a significant progress from 8M16’s 45%, making HSR’s IDR16.7trn new
contract highly probable to secure.
LRT Jakarta as another potential catalyst
Jakpro has appointed WIKA to be the contractor of Jakarta LRT, constructing LRT
from Depok to Velodrome which spans for 5.8 km, with 6 planned stations. WIKA
could seize an additional IDR5tn from this contract as soon as it is signed. These
two catalysts suggests that WIKA could add IDR21.7trn of new contract by 4Q16,
lifting their potential new contract figure to IDR46trn, ~88% of their FY16 target.
Yet, we remain conservative and exclude Jakarta LRT from our TP calculation
given the uncertainty. We estimate that WIKA should be able to reach ~IDR43trn
of new contract in FY16, approximately 82% achievement (assuming that HSR
project is being signed by 2016, and WIKA still gets new contracts with a busi-
ness as usual rate).
Attractive entry point pricing
WIKA is actually one of the most expensively priced share compared the other
SOE construction companies, which is being currently being traded at 20x (vs.
15x PE for WSKT). However, from a PE perspective, WIKA is trading at its least
demanding PE, where currently it is on –1STD from 3-Years forward average. The
catalysts above ensures that a rerating to a lower PE seem unlikely.
Valuation
We re-initiate WIKA with a buy and TP of IDR2,930, implying 26% upside from
current price. Our price estimate implies 26x 2017PE, which is their 3-Years
average PE.
Gearing Up
PT Wijaya Karya Persero Tbk, through its sub-
sidiaries, offers construction services; manu-
factures building materials; and develops real
estate. The Company constructs commercial
and residential apartments, rail transportation
systems and bridges; and man
BUY Rp2,930
Share Price Rp2,330
Sector Real Estate
Price Target Rp2,930 (25.8%)
Company Update
Reuters Code WIKA.JK
Bloomberg Code WIKA.IJ
Issued Shares 6,616
Mkt Cap. (Rpbn) 15,414
Avg. Value Daily 6
Month (Rpbn) 49.8
52-Wk range 3139 / 2037
Stock Data
Republic of Indonesia Serie B 65.05%
Director 0.0%
Employee 1.1% Public 33.8%
Major Shareholders
Core EPS 16F 17F
Consensus (Rp) 38 46
TRIM vs Cons. (%) 12.3% -24.3%
Consensus
Stock Price
0.0
50.0
100.0
150.0
200.0
-
500
1,000
1,500
2,000
2,500
3,000
3,500
Nov-15 Jan-16 Mar-16 May-16 Jul-16 Sep-16
(Rpbn)Avg. 5 Day MA Trading Value (RHS)
Company Data
Year end Dec 2014 2015 2016F 2017F 2018F
Sales 12,463 13,620 18,838 19,782 22,979
Net profit 701 653 769 1,108 1,179
EPS 114 106 116 124 132
EPS Growth (%) 5 -7 9 7 6
DPS (Rp) 20 20 20 23 24
BVPS (Rp) 793 884 1,874 872 1,058
EV/EBITDA (x) 8 7 8 4 4
P/E (x) 20 22 20 19 18
PEG (x) 4 -3 2 3 3
Div Yield (%) 1 1 1 1 1
Sebastian Tobing, CFA
Maria Gabriela

PT Trimegah Securities Tbk - www.trimegah.com MARKET OUTLOOK 138
Income Statement (Rpbn)
Year end Dec 2014 2015 2016F 2017F 2018F
Revenue 12,463 13,620 18,838 19,782 22,979
Revenue Growth (%) 5 9 38 5 16
Gross Profit 1,794 1,943 2,790 2,975 3,527
Opr. Profit 1,401 1,514 2,211 2,269 2,708
EBITDA 1,592 1,786 1,633 2,846 3,453
EBITDA Growth (%) 17 12 -9 74 21
Net Int Inc/(Exp) -124 -372 -674 -418 -664
Gain/(loss) Forex -2 28 -17 0 0
Other Inc/(Exp) -129 -72 -155 -127 -147
Pre-tax Profit 1,146 1,098 1,366 1,724 1,898
Tax -395 -395 -565 -593 -689
Minority Int. -136 -78 -133 -105 -123
Extra. Items 0 0 0 0 0
Reported Net Profit 615 625 668 1,025 1,085
Core Net Profit 701 653 769 1,108 1,179
Growth (%) 5 -7 18 44 6
Balance Sheet (Rpbn)
Year end Dec 2014 2015 2016F 2017F 2018F
Cash and equivalents 2,301 2,560 8,162 3,395 4,039
Other curr. Assets 7,180 10,000 12,749 12,333 13,206
Net Fixed Assets 3,944 4,702 5,621 7,882 9,986
Other Assets 2,484 2,340 3,070 3,699 4,443
Total Assets 15,909 19,602 29,602 27,309 31,673
ST Debt 1,708 1,818 3,462 4,196 4,643
Other Curr Liab. 6,768 8,780 9,965 10,981 12,943
LT Debt 1,324 1,692 1,849 2,160 2,363
Other LT Liab. 1,233 1,874 1,928 2,170 2,260
Minority Interest 989 1,063 1,030 1,276 1,547
Total Liabilities 11,032 14,164 17,205 19,507 22,209
Shareholder's Equity 3,888 4,375 11,368 6,527 7,917
Net Debt/(Cash) 731 950 -2,850 2,962 2,967
Total cap employed 6,919 7,885 16,679 12,883 14,923
Net Working Capital 1,005 1,963 7,484 551 -342
Debt 3,032 3,510 5,311 6,356 7,006
Cash Flow (Rpbn)
Year end Dec 2014 2015 2016F 2017F 2018F
Net Profit 615 625 668 1,025 1,085
Depr/Amort 0 0 -578 577 745
Chg in Working Capi-
tal 0 0 -1,540 1,437 1,112
CF's from Oprs 615 625 -1,450 3,039 2,942
Capex -1,268 -325 -862 -3,426 -3,532
Others 0 0 -234 -46 -83
CF's from investing -1,268 -325 -1,095 -3,472 -3,615
Net Change in Debt 1,706 1,120 1,855 1,286 740
Others 654 -774 6,292 -5,620 577
CF's from Financing 2,360 346 8,147 -4,334 1,317
Net Cash Flow 1,707 646 5,601 -4,767 644
Cash at BoY 1,387 2,301 2,560 8,162 3,395
Cash at EoY 3,094 2,947 8,162 3,395 4,039
Free Cashflow -653 300 -2,312 -387 -589
Key Ratio Analysis
Year end Dec 2014 2015 2016F 2017F 2018F
Profitability
Gross Margin - before 14.4 14.3 14.8 15.0 15.4
Op. Margin (%) 11.2 11.1 11.7 11.5 11.8
EBITDA Margin (%) 12.8 13.1 8.7 14.4 15.0
Core Net Margin (%) 5.6 4.8 4.1 5.6 5.1
ROE (%) 14.2 11.9 7.0 6.6 11.9
ROA (%) 4.0 3.5 2.5 2.3 3.5
Stability
Current Ratio (x) 1.1 1.2 1.6 1.0 1.0
Net Debt to Equity (x) 0.1 0.2 (0.2) 0.4 0.3
Interest Coverage (x) 7.1 3.5 2.9 3.2 3.5
Efficiency
A/P days 50 63 57 59 52
A/R days 114 124 99 103 100
Inventory Days 32 28 26 28 29
Interim Result (Rpbn)
3Q15 4Q15 1Q16 2Q16 3Q16
Sales 3,313 5,529 1246 3,307 3,306
Gross Profit 559 786 749 522 454
Operating Profit 455 645 652 382 347
Net Profit 190 235 605 185 145
Gross Margins (%) 16.9 14.2 60 16% 14%
Opr Margins (%) 13.7 11.7 52 12% 11%
Net Margins (%) 5.7 4.2 49 6% 4%
Capital History
Date
29 Oct 07 IPO @ IDR420
23—29 Nov 16 Rights Issue

MARKET OUTLOOK PT Trimegah Securities Tbk - www.trimegah.com 139
Three reasons why we like WSBP
We like WSBP on the back of: 1) Strong 9M16 performance, seizing
IDR7.5tn new contract on 9M16 vs. WTON’s new contract achievement
of IDR3tn. 2) One of the beneficiaries of WSKT’s huge growth on 2016.
3) Reasonably priced at 16x PE.
Strong 9M16 operational & financial performance...
WSBP managed to set a great first impression by growing their 9M16
revenue and profit by 89% and 86% respectively. From an operational
perspective, they’ve secured 93% (~IDR7.5trn) of their FY16 target,
and it should be stressed that the majority of their total contract was
contributed by WSKT’s toll road projects; Cimanggis-Cibitung, Pemalang
-Batang, and Batang-Semarang. They have also snatched up turnkey
projects such as Becakayu toll road, which should contribute to better
9M16’s gross margin.
…which should sustain thanks to WSKT’s full support over them
Their stellar 2016 new contract achievement should not be an one-off
event since they were given by WSKT, WSBP’s parent company. We see
that WSBP’s new contract is correlated with WSKT’s previous year new
contract, and as WSKT’s 9M16 new contract tripled, should then become
a catalyst to WSBP’s 2017 new contract. If the precast project takes up
20% of WSKT’s overall construction project, it would result in WSBP’s
2017 new contract to be at ~IDR11tn for FY17. The increase in revenue
should translate to 79% growth in 2017 net profit, assuming that there
are no opex efficiency conducted.
Valuation is relatively expensive, but for a very good reason
If we measure its value over their new contracts, which is currently
trading at 1.43x EV/new contracts, is cheaper than their direct competi-
tor, WTON, which is currently being traded at 2.7x. In terms of PE they
are also the third cheapest one.
Valuation
We initiate WSBP with TP of IDR630, implying 13.5% upside from cur-
rent price. Our price estimate implies 18.5x PE from 2017EPS, which is
their above 1 standard deviation to their average PE since initial public
offering in early September 2016.
Waskita Beton Precast The Prodigy
Sebastian Tobing, CFA
Maria Gabriela
PT. Waskita Beton Precast tbk oper-
ates as a construction services com-
pany. The Company offers precast
concrete for buildings and bridges,
retaining walls, drainages, ready-mix
concrete, barriers, and rail pads.
BUY Rp630
Share Price Rp555
Sector Engineering&Construction
Price Target Rp630(13.5%)
Company Update
Reuters Code WSBP.JK
Bloomberg Code WSBP.IJ
Issued Shares 26,361
Mkt Cap. (Rpbn) 14,630
Avg. Value Daily 6
Month (Rpbn) NA
52-Wk range 645 / 490
Stock Data
Waskita Karya Tbk 60.00% Public 40.00%
Major Shareholders
EPS 16F 17F
Consensus (Rp) 21 29
TRIM vs Cons. (%) 25.1% -9.3%
Consensus
Stock Price
0.0
200.0
400.0
600.0
800.0
1,000.0
-
100
200
300
400
500
600
700
Nov-15 Jan-16 Mar-16 May-16 Jul-16 Sep-16
(Rpbn)Avg. 5 Day MA Trading Value (RHS)
Company Data
Year end Dec 2014 2015 2016F 2017F 2018F
Sales 642 2,644 5,013 6,230 8,566
Net profit 140 334 700 890 930
EPS 22,696 38 27 34 35
EPS Growth (%) -30 27 4
DPS (Rp) 0 0 0
BVPS (Rp) 113,698 153 299 333 368
EV/EBITDA (x) 62 20 9 7 6
P/E (x) 0 14 21 16 16
PEG (x) -1 1 3
Div Yield (%) 0 0 0 0 0

PT Trimegah Securities Tbk - www.trimegah.com MARKET OUTLOOK 140
Income Statement (Rpbn)
Year end Dec 2014 2015 2016F 2017F 2018F
Revenue 642 2,644 5,013 6,230 8,566
Revenue Growth (%) 311.9 89.6 24.3 37.5
Gross Profit 147 419 852 997 1,114
Opr. Profit 142 363 767 887 936
EBITDA 149 451 976 1,257 1,508
EBITDA Growth (%) 202.1 116.4 28.8 20.0
Net Int Inc/(Exp) 1 (19) (45) 31 22
Gain/(loss) Forex 0 2 1 0 0
Other Inc/(Exp) 0 0 0 0 0
Pre-tax Profit 143 346 722 918 958
Tax (2) (11) (22) (28) (29)
Minority Int. 0 0 0 0 0
Extra. Items (1) 0 0 0 0
Reported Net Profit 141 335 701 890 930
Core Net Profit 140 334 700 890 930
Growth (%) 138.0 109.9 27.1 4.5
Balance Sheet (Rpbn)
Year end Dec 2014 2015 2016F 2017F 2018F
Cash and equivalents 272 98 7,689 6,830 5,540
Other curr. Assets 709 905 1,332 1,701 2,291
Net Fixed Assets 222 987 2,279 3,909 5,837
Other Assets 0 2,342 2,547 3,165 4,352
Total Assets 1,203 4,333 13,848 15,606 18,021
ST Debt 0 302 900 900 900
Other Curr Liab. 500 2,130 3,557 4,425 5,910
LT Debt 0 459 1,411 1,411 1,411
Other LT Liab. 0 110 115 115 115
Minority Interest 0 0 0 0 0
Total Liabilities 500 3,002 5,983 6,851 8,336
Shareholder's Equity 702 1,331 7,864 8,754 9,684
Net Debt/(Cash) -272 663 -5,378 -4,519 -3,229
Total cap employed 702 2,092 10,175 11,065 11,995
Net Working Capital 480 -1,429 4,565 3,207 1,022
Debt 0 761 2,311 2,311 2,311
Cash Flow (Rpbn)
Year end Dec 2014 2015 2016F 2017F 2018F
Net Profit 141 335 701 890 930
Depr/Amort 7 87 209 370 572
Chg in Working Capi-
tal -208 1,735 1,598 499 895
CF's from Oprs -60 2,158 2,507 1,759 2,397
Capex -229 -853 -1,500 -2,000 -2,500
Others 0 -2,342 -205 -618 -1,187
CF's from investing -229 -3,195 -1,705 -2,618 -3,687
Net Change in Debt 0 761 2,311 2,311 2,311
Others 562 103 4,478 -2,311 -2,311
CF's from Financing 562 864 6,789 0 0
Net Cash Flow 272 -174 7,591 -859 -1,290
Cash at BoY 0 272 99 7,689 6,830
Cash at EoY 272 99 7,689 6,830 5,540
Free Cashflow -289 1,304 1,007 -241 -103
Key Ratio Analysis
Year end Dec 2014 2015 2016F 2017F 2018F
Profitability
Gross Margin - before 23 16 17 16 13
Op. Margin (%) 22 14 15 14 11
EBITDA Margin (%) 23 17 19 20 18
Core Net Margin (%) 22 13 14 14 11
ROE (%) 20 33 15 11 10
ROA (%) 12 12 8 6 6
Stability
Current Ratio (x) 2 0 2 2 1
Net Debt to Equity (x) -2 -1 -2 -2
Interest Coverage (x) 19 17 19 20
Efficiency
A/P days 95 70 81 81 81
A/R days 359 78 72 72 72
Inventory Days 15 6 9 9 8
Interim Result (Rpbn)
9M15 9M16
Sales 1,617 3,066
Gross Profit 250 744
Operating Profit 214 690
Net Profit 211 392
Gross Margins (%) 15.50% 24.30%
Opr Margins (%) 13.20% 22.50%
Net Margins (%) 13.10% 12.80%
Capital History
Date
20-Sep-16 IPO @ IDR490
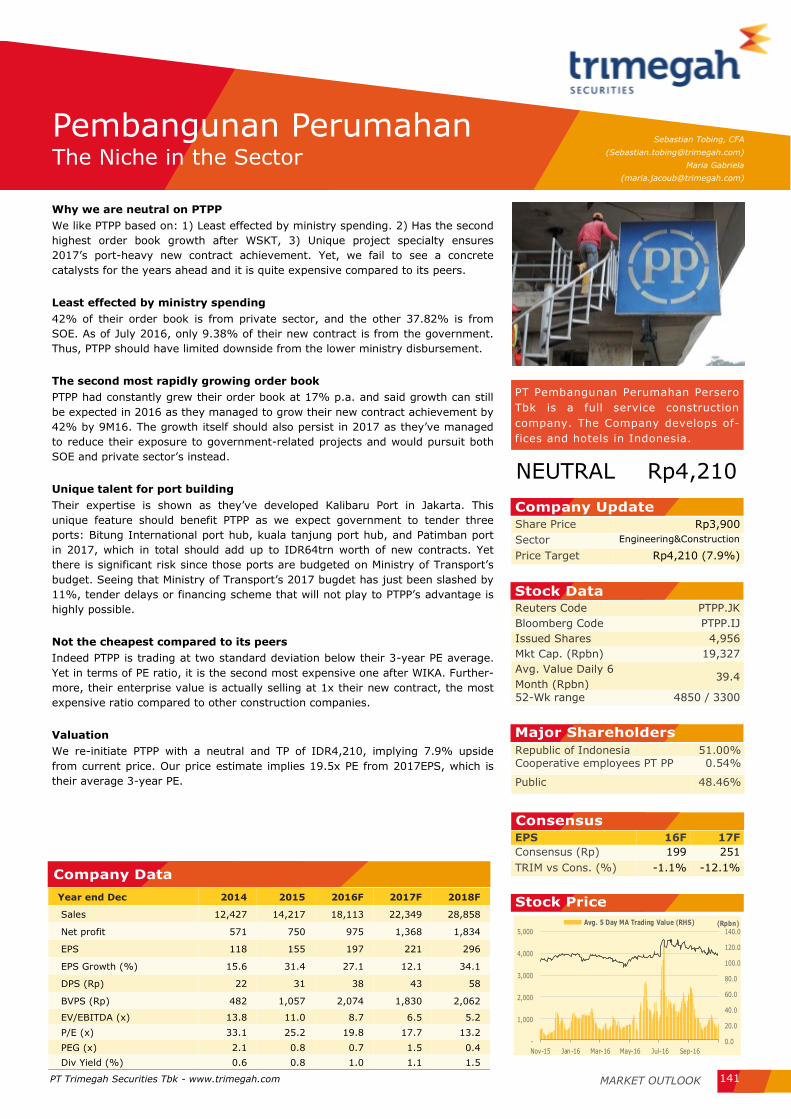
MARKET OUTLOOK PT Trimegah Securities Tbk - www.trimegah.com 141
Why we are neutral on PTPP
We like PTPP based on: 1) Least effected by ministry spending. 2) Has the second
highest order book growth after WSKT, 3) Unique project specialty ensures
2017’s port-heavy new contract achievement. Yet, we fail to see a concrete
catalysts for the years ahead and it is quite expensive compared to its peers.
Least effected by ministry spending
42% of their order book is from private sector, and the other 37.82% is from
SOE. As of July 2016, only 9.38% of their new contract is from the government.
Thus, PTPP should have limited downside from the lower ministry disbursement.
The second most rapidly growing order book
PTPP had constantly grew their order book at 17% p.a. and said growth can still
be expected in 2016 as they managed to grow their new contract achievement by
42% by 9M16. The growth itself should also persist in 2017 as they’ve managed
to reduce their exposure to government-related projects and would pursuit both
SOE and private sector’s instead.
Unique talent for port building
Their expertise is shown as they’ve developed Kalibaru Port in Jakarta. This
unique feature should benefit PTPP as we expect government to tender three
ports: Bitung International port hub, kuala tanjung port hub, and Patimban port
in 2017, which in total should add up to IDR64trn worth of new contracts. Yet
there is significant risk since those ports are budgeted on Ministry of Transport’s
budget. Seeing that Ministry of Transport’s 2017 bugdet has just been slashed by
11%, tender delays or financing scheme that will not play to PTPP’s advantage is
highly possible.
Not the cheapest compared to its peers
Indeed PTPP is trading at two standard deviation below their 3-year PE average.
Yet in terms of PE ratio, it is the second most expensive one after WIKA. Further-
more, their enterprise value is actually selling at 1x their new contract, the most
expensive ratio compared to other construction companies.
Valuation
We re-initiate PTPP with a neutral and TP of IDR4,210, implying 7.9% upside
from current price. Our price estimate implies 19.5x PE from 2017EPS, which is
their average 3-year PE.
Pembangunan Perumahan The Niche in the Sector
PT Pembangunan Perumahan Persero
Tbk is a full service construction
company. The Company develops of-
fices and hotels in Indonesia.
NEUTRAL Rp4,210
Share Price Rp3,900
Sector Engineering&Construction
Price Target Rp4,210 (7.9%)
Company Update
Reuters Code PTPP.JK
Bloomberg Code PTPP.IJ
Issued Shares 4,956
Mkt Cap. (Rpbn) 19,327
Avg. Value Daily 6
Month (Rpbn) 39.4
52-Wk range 4850 / 3300
Stock Data
Republic of Indonesia 51.00% Cooperative employees PT PP 0.54%
Public 48.46%
Major Shareholders
EPS 16F 17F
Consensus (Rp) 199 251
TRIM vs Cons. (%) -1.1% -12.1%
Consensus
Stock Price
0.0
20.0
40.0
60.0
80.0
100.0
120.0
140.0
-
1,000
2,000
3,000
4,000
5,000
Nov-15 Jan-16 Mar-16 May-16 Jul-16 Sep-16
(Rpbn)Avg. 5 Day MA Trading Value (RHS)
Company Data
Year end Dec 2014 2015 2016F 2017F 2018F
Sales 12,427 14,217 18,113 22,349 28,858
Net profit 571 750 975 1,368 1,834
EPS 118 155 197 221 296
EPS Growth (%) 15.6 31.4 27.1 12.1 34.1
DPS (Rp) 22 31 38 43 58
BVPS (Rp) 482 1,057 2,074 1,830 2,062
EV/EBITDA (x) 13.8 11.0 8.7 6.5 5.2
P/E (x) 33.1 25.2 19.8 17.7 13.2
PEG (x) 2.1 0.8 0.7 1.5 0.4
Div Yield (%) 0.6 0.8 1.0 1.1 1.5
Sebastian Tobing, CFA
Maria Gabriela

PT Trimegah Securities Tbk - www.trimegah.com MARKET OUTLOOK 142
Income Statement (Rpbn)
Year end Dec 2014 2015 2016F 2017F 2018F
Revenue 12,427 14,217 18,113 22,349 28,858
Revenue Growth (%) 7 14 27 23 29
Gross Profit 1,550 2,007 2,237 2,999 3,803
Opr. Profit 1,339 1,664 2,030 2,696 3,381
EBITDA 1,397 1,748 2,221 2,942 3,681
EBITDA Growth (%) 17 25 27 32 25
Net Int Inc/(Exp) -354 -362 -565 -671 -690
Gain/(loss) Forex 2 71 0 0 0
Other Inc/(Exp) -83 -111 -68 -73 -76
Pre-tax Profit 921 1,287 1,423 1,985 2,640
Tax -387 -442 -427 -595 -792
Minority Int. 0 -105 -50 -50 -50
Extra. Items 0 0 0 0 0
Reported Net Profit 533 740 946 1,339 1,798
Core Net Profit 571 750 975 1,368 1,834
Growth (%) 16 31 30 40 34
Balance Sheet (Rpbn)
Cash Flow (Rpbn)
Year end Dec 2014 2015 2016F 2017F 2018F
Net Profit 533 740 946 1,339 1,798
Depr/Amort 57 84 192 246 300
Chg in Working Capi-
tal -643 -83 1,004 -618 -1,025
CF's from Oprs -52 742 2,142 967 1,073
Capex -498 -387 -760 -760 -760
Others 61 -2,134 -29 -864 -614
CF's from investing -437 -2,521 -789 -1,624 -1,374
Net Change in Debt 1,275 646 1,014 1,050 130
Others 99 775 -629 -492 -94
CF's from Financing 1,374 1,421 385 558 36
Net Cash Flow 885 -358 1,738 -99 -265
Cash at BoY 2,397 2,408 3,025 4,764 4,665
Cash at EoY 2,408 3,025 4,764 4,665 4,401
Free Cashflow -551 355 1,382 207 313
Key Ratio Analysis
Year end Dec 2014 2015 2016F 2017F 2018F
Profitability
Gross Margin - before 12 14 12 13 13
Op. Margin (%) 11 12 11 12 12
EBITDA Margin (%) 11 12 12 13 13
Core Net Margin (%) 5 5 5 6 6
ROE (%) 25 20 12 12 15
ROA (%) 4 4 4 5 6
Stability
Current Ratio (x) 1.4 1.4 1.4 1.3 1.3
Net Debt to Equity (x) 0.3 0.1 0.0 0.1 0.1
Interest Coverage (x) 3.7 4.3 3.5 3.8 4.7
Efficiency
A/P days 220 220 223 224 224
A/R days 58 66 65 65 63
Inventory Days 69 74 84 77 73
Interim Result (Rpbn)
3Q15 4Q15 1Q16 2Q16 3Q16
Sales 3,553 5,443 2,588 3,885 4,373
Gross Profit 495 829 360 573 632
Operating Profit 406 751 261 454 508
Net Profit 217 362 98 257 211
Gross Margins (%) 13.9 15.2 13.9 15 14
Opr Margins (%) 11.4 13.8 10.1 12 12
Net Margins (%) 6.1 6.7 3.8 7 5
Capital History
Date
09-Feb-10 IPO @ IDR560
Balance Sheet (Rpbn)
Year end Dec 2014 2015 2016F 2017F 2018F
Cash and equivalents 2,408 3,025 4,764 4,665 4,401
Other curr. Assets 11,069 12,405 14,195 17,660 22,602
Net Fixed Assets 710 2,989 3,020 3,726 4,432
Other Assets 392 709 1,276 1,948 2,316
Total Assets 14,579 19,129 23,254 27,998 33,751
ST Debt 1,577 1,765 2,297 2,837 3,087
Other Curr Liab. 8,284 9,350 11,612 13,918 17,586
LT Debt 1,455 1,913 2,395 2,905 2,785
Other LT Liab. 928 982 1,075 1,391 1,907
Minority Interest 0 -105 -50 -50 -50
Total Liabilities 12,244 14,010 17,378 21,051 25,365
Shareholder's Equity 2,335 5,119 10,276 11,347 12,786
Net Debt/(Cash) 624 653 -72 1,077 1,472
Total cap employed 5,367 8,797 14,968 17,089 18,658
Net Working Capital 3,616 4,316 5,051 5,570 6,330
Debt 3,032 3,678 4,692 5,742 5,872

MARKET OUTLOOK PT Trimegah Securities Tbk - www.trimegah.com 143
Three reasons we put neutral on ADHI
Despite being the cheapest stock in term of PE, we see the reasoning behind the
cheap valuation. We see that ADHI has: 1) Slower new contract achievement
than expected. 2) LRT scheme not exactly at their favor, and 3) Possible addition-
al EPC loss in 2017.
New contract achievement slower than expected
ADHI new contract figure has been sluggish compared to other companies,
achieving only IDR11.4tn as of 9M16, achieving 61% of their FY16. Bear in mind
that 61% achievement is from their revised target (which has been lowered by
18% in 3Q16). We see their probability of achieving their new contract target to
be rather slim, especially considering their new contract in 10M16 was merely
IDR400bn. Assuming that their achievement stays constant in both November
and December, new contract achievement would only reach 67%. In our TP
calculation however, we estimate ADHI’s monthly new contract figure to be at
IDR1trn, which uis their average new contract achievement rate in 2016. As thus,
we expect ADHI to be able to achieve IDR14trn for the year.
LRT financing scheme disclosed and its not exactly at their favor
ADHI would only receive IDR10.5tn from State Budget (IDR2tn in 2017, IDR5tn
in 2018, and IDR3tn in 2019) with the remaining IDR11tn being bank loans,
making ADHI’s total liability figure to be at IDR23tn which would then breach
their 3.5x maximum DER covenant. To avoid this, a corporate action is in place
to maintain DER below 3.5x; ADHI to issue preferred stock and perform spin off
of ADHI Gedung on 2017 which is estimated to raise their equity by IDR2.5tn to
IDR7.5tn, thus granting the ability to add debt up to IDR25.37tn whilst still main-
taining a favorable below 3.5x DER.
Downside risk from EPC loss in 2017
Their EPC-issue remains a threat as they will still recognize an additional
IDR200bn EPC loss in 2017, which also marks 30% of their FY 2017 estimated
net profit.
Valuation
We re-initiate ADHI with a neutral and TP of IDR1,930, implying 5.5% upside
from current price. Our price estimate implies 18.2x 2017PE which is the average
between the mean of 3-Year PE band and –1 standard deviation of 3-Year PE.
Adhi Karya Cheap for a reason
PT Adhi Karya Persero Tbk provides
construction and engineering, me-
chanical and electrical, and property
development services . The Company
also manufactures liquid and pre-
cast concrete.
NEUTRAL IDR1,930
Share Price Rp1,830
Sector Engineering&Construction
Price Target Rp1,930 (5.5%)
Company Update
Reuters Code ADHI.JK
Bloomberg Code ADHI.IJ
Issued Shares 3,561
Mkt Cap. (Rpbn) 6,516
Avg. Value Daily 6
Month (Rpbn) 51.6
52-Wk range 2910 / 1830
Stock Data
Government 51.00% Public 49.00%
Major Shareholders
EPS 16F 17F
Consensus (Rp) 132 199
TRIM vs Cons. (%) -36.9% -45.5%
Consensus
Stock Price
0.0
20.0
40.0
60.0
80.0
100.0
120.0
140.0
160.0
-
500
1,000
1,500
2,000
2,500
3,000
3,500
Nov-15 Jan-16 Mar-16 May-16 Jul-16 Sep-16
(Rpbn)Avg. 5 Day MA Trading Value (RHS)
Company Data
Year end Dec 2014 2015 2016F 2017F 2018F
Sales 8,654 9,390 11,402 14,221 20,045
Net profit 287 386 297 386 850
EPS 160 169 83 108 239
EPS Growth (%) -36 6 -51 30 120
DPS (Rp) 68 35 20 26 59
BVPS (Rp) 972 2,258 1,394 2,229 2,523
EV/EBITDA (x) 10 11 7 6 4
P/E (x) 11 11 22 17 8
PEG (x) 0 2 0 1 0
Div Yield (%) 4 2 1 1 3
Sebastian Tobing, CFA
Maria Gabriela

PT Trimegah Securities Tbk - www.trimegah.com MARKET OUTLOOK 144
Income Statement (Rpbn)
Year end Dec 2014 2015 2016F 2017F 2018F
Revenue 8,654 9,390 11,402 14,221 20,045
Revenue Growth (%) -12 9 21 25 41
Gross Profit 1,109 1,921 2,969 4,878 6,920
Opr. Profit 660 611 951 1,197 1,647
EBITDA 686 641 983 1,235 1,686
EBITDA Growth (%) -27 -7 53 26 37
Net Int Inc/(Exp) -103 -86 -150 -488 -521
Gain/(loss) Forex 100 165 0 0 0
Other Inc/(Exp) -8 68 0 0 0
Pre-tax Profit 600 746 391 509 1,126
Tax -268 -281 -98 -127 -281
Minority Int. 3 1 3 4 6
Extra. Items 0 0 0 0 0
Reported Net Profit 329 464 290 377 838
Core Net Profit 287 386 297 386 850
Growth (%) -36 34 -23 30 120
Balance Sheet (Rpbn)
Year end Dec 2014 2015 2016F 2017F 2018F
Cash and equivalents 811 4,317 3,279 9,050 11,149
Other curr. Assets 8,673 10,374 10,844 12,803 18,067
Net Fixed Assets 857 1,477 1,947 2,325 2,638
Other Assets 117 593 713 927 1,098
Total Assets 10,459 16,761 16,784 25,105 32,952
ST Debt 692 1,115 1,598 3,873 6,957
Other Curr Liab. 33 28 55 60 80
LT Debt 1,577 2,003 1,972 3,097 2,713
Other LT Liab. 61 181 202 231 285
Minority Interest 7 8 8 8 8
Total Liabilities 8,707 11,599 11,819 17,169 23,968
Shareholder's Equity 1,745 5,154 4,956 7,928 8,976
Net Debt/(Cash) 1,458 -1,199 290 -2,080 -1,479
Total cap employed 4,014 8,272 8,525 14,898 18,646
Net Working Capital 2,415 5,277 4,478 8,011 8,246
Debt 2,269 3,119 3,569 6,970 9,670
Cash Flow (Rpbn)
Year end Dec 2014 2015 2016F 2017F 2018F
Net Profit 329 464 290 377 838
Depr/Amort 25 30 32 38 40
Chg in Working
Capital -1,337 796 -713 177 -1,145
CF's from Oprs -983 1,290 -391 592 -267
Capex -542 -1,623 -666 -830 -574
Others 0 0 0 0 0
CF's from investing -542 -1,623 -666 -830 -574
Net Change in Debt 522 892 505 3,415 2,729
Others -124 2,946 -487 2,594 210
CF's from Financing 398 3,838 18 6,009 2,939
Net Cash Flow -1,126 3,505 -1,038 5,771 2,099
Cash at BoY 1,940 811 4,317 3,279 9,050
Cash at EoY 811 4,317 3,279 9,050 11,149
Free Cashflow -1,525 -333 -1,057 -238 -840
Key Ratio Analysis
Year end Dec 2014 2015 2016F 2017F 2018F
Profitability
Gross Margin - before 12.8 20.5 26.0 34.3 34.5
Op. Margin (%) 7.6 6.5 8.3 8.4 8.2
EBITDA Margin (%) 7.9 6.8 8.6 8.7 8.4
Core Net Margin (%) 3.3 4.1 2.6 2.7 4.2
ROE (%) 20% 13% 6% 6% 10%
ROA (%) 3% 3% 2% 2% 3%
Stability
Current Ratio (x) 1.3 1.6 1.5 1.6 1.4
Net Debt to Equity (x) 0.83 -0.23 0.06 -0.26 -0.16
Interest Coverage (x) 4.8 4.5 3.4 2.0 1.9
Efficiency
A/P days 228 244 225 225 225
A/R days 72 80 80 80 86
Inventory Days 7 6 13 16 7
Interim Result (Rpbn)
3Q15 4Q15 1Q16 2Q16 3Q16
Sales 2,204 3,974 1,329 1,802 2,562
Gross Profit 212 433 127 141 314
Operating Profit 121 283 50 41 195
Net Profit 67 326 11 45 59
Gross Margins (%) 9.6 10.9 9.6 8 12
Opr Margins (%) 5.5 7.1 3.7 2 8
Net Margins (%) 3.0 8.2 0.8 3 2
Capital History
Date
18-Mar-04 IPO @ IDR150
09— 21 Oct 15 Right Issue

MARKET OUTLOOK PT Trimegah Securities Tbk - www.trimegah.com 145
Three reasons why we have a sell on WTON
Despite a few upside potential such as potential beneficiaries from HSR construc-
tion, we see that WTON does not have any lasting competitive advantage to
WSBP. Therefore, WTON should see a decrease in revenue in the near future.
Still a chance of becoming HSR project beneficiary
As WIKA, WTON’s parent company, manages to secure High Speed Railway’s
contract, WTON should gain benefit over the project’s precast requirements.
However, it should be noted that as the project itself is a JV with China Railway,
there is a possibility that China Railway would provide a portion of the required
precast thus reducing WTON’s potential new contract figure.
More variety in product and is inevitably more experienced...
WSBP has just been established in 2014 while WTON has been providing precast
since 1973. WTON also has products readily available while WSBP would need
more time to provide the goods as it has yet been produced. As a example,
WTON produces “strippers”, a precast item commonly used in railway projects,
which WSBP does not have. This enables the former to have a better product
portfolio and at the same time appeal to a much broader audience.
… Yet no barrier for other precast companies to catch up
Yet it is crucial to bear in mind that other precast company could build facility to
produce the same goods as WTON if given enough time. Especially if one of them
has fresh funds from IPO. To top it of WTON could only attain IDR3tn new con-
tract on 9M16. It is still growing by 36% YoY, yet this is small compared to
IDR7.5tn from WSBP. With no sign of slowing down from WSBP, WTON is facing a
credible threat.
Valuation
We re-initiate WTON with SELL and TP of IDR760, implying 5.6% downside from
current price. Our price estimate implies 25x 2017PE which is the average be-
tween the mean of 3-Year PE band and –1 standard deviation of 3-Year PE.
Wijaya Karya Beton Challenging Times Ahead
PT Wijaya Karya Beton Tbk manufac-
tures and distributes construction
products. The Company produces
and markets precast concrete struc-
tures, including bridge beams, re-
taining walls, pipes, and bearings.
SELL IDR760
Share Price Rp805
Sector Real Estate
Price Target Rp760 (-5.6%)
Company Update
Reuters Code WTON.JK
Bloomberg Code WTON.IJ
Issued Shares 8,715
Mkt Cap. (Rpbn) 7,016
Avg. Value Daily 6
Month (Rpbn) 21.1
52-Wk range 1075 / 780
Stock Data
Wijaya Karya 60.00% Koperasi Karya Mitra Satya 7.70%
Yayasan Wijaya Karya 1.00%
Public 27.00%
Treasury Stock 4.30%
Major Shareholders
EPS 16F 17F
Consensus (Rp) 31 41
TRIM vs Cons. (%) 23.3% -26.2%
Consensus
Stock Price
0.0
20.0
40.0
60.0
80.0
100.0
-
200
400
600
800
1,000
1,200
Nov-15 Jan-16 Mar-16 May-16 Jul-16 Sep-16
(Rpbn)Avg. 5 Day MA Trading Value (RHS)
Company Data
Year end Dec 2014 2015 2016F 2017F 2018F
Sales 3,277 2,653 3,436 3,519 3,718
Net profit 331 161 333 264 308
EPS 38 19 38 30 35
EPS Growth (%) 35 -51 106 -21 17
DPS (Rp) 0 12 11 6 7
BVPS (Rp) 253 260 286 311 339
EV/EBITDA (x) 13 19 10 11 10
P/E (x) 21 43 21 27 23
PEG (x) 2 -2 1 -4 4
Div Yield (%) 0 1 1 1 1
Sebastian Tobing, CFA
Maria Gabriela

PT Trimegah Securities Tbk - www.trimegah.com MARKET OUTLOOK 146
Income Statement (Rpbn)
Year end Dec 2014 2015 2016F 2017F 2018F
Revenue 3,277 2,653 3,436 3,519 3,718
Revenue Growth (%) 24 -19 30 2 6
Gross Profit 487 329 596 514 587
Opr. Profit 409 238 512 427 491
EBITDA 495 328 649 580 660
EBITDA Growth (%) 25 -34 98 -11 14
Net Int Inc/(Exp) 6 -26 -71 -78 -84
Gain/(loss) Forex -5 -8 -3 -1 -1
Other Inc/(Exp) 2 1 1 1 1
Pre-tax Profit 412 206 439 349 407
Tax -89 -34 -110 -87 -102
Minority Int. 6 2 2 2 2
Extra. Items 0 0 0 0 0
Reported Net Profit 329 174 331 264 307
Core Net Profit 331 161 333 264 308
Growth (%) 35 -51 106 -21 17
Balance Sheet (Rpbn)
Year end Dec 2014 2015 2016F 2017F 2018F
Cash and equivalents 1,038 824 1,283 1,810 2,317
Other curr. Assets 1,089 1,631 1,769 1,747 1,868
Net Fixed Assets 1,675 2,001 1,345 1,324 1,271
Other Assets 1 0 0 0 0
Total Assets 3,802 4,456 4,397 4,881 5,456
ST Debt 199 211 235 259 278
Other Curr Liab. 1,311 1,582 1,266 1,514 1,827
LT Debt 0 320 320 320 320
Other LT Liab. 90 79 79 79 79
Minority Interest 59 58 64 70 74
Total Liabilities 1,599 2,193 1,901 2,173 2,505
Shareholder's Equity 2,144 2,205 2,432 2,638 2,878
Net Debt/(Cash) -840 -292 -728 -1,230 -1,719
Total cap employed 2,711 2,658 2,989 3,219 3,478
Net Working Capital -1,510 -1,793 -1,501 -1,774 -2,105
Debt 568 453 557 581 600
Cash Flow (Rpbn)
Year end Dec 2014 2015 2016F 2017F 2018F
Net Profit 329 174 331 264 307
Depr/Amort 86 90 137 153 169
Chg in Working Capi-
tal -283 95 -454 270 192
CF's from Oprs 132 359 14 686 668
Capex 474 91 280 285 285
Others -1,214 -507 239 -417 -401
CF's from investing -740 -416 519 -132 -116
Net Change in Debt 26 333 24 24 19
Others 385 901 -182 -98 -47
CF's from Financing 1,234 -158 -74 -28 -45
Net Cash Flow 625 -215 459 527 507
Cash at BoY 413 1,038 824 1,283 1,810
Cash at EoY 1,038 824 1,283 1,810 2,317
Free Cashflow 1,038 824 1,283 1,810 2,317
Key Ratio Analysis
Year end Dec 2014 2015 2016F 2017F 2018F
Profitability
Gross Margin - before 14.9 12.4 17.3 14.6 15.8
Op. Margin (%) 12.5 9.0 14.9 12.1 13.2
EBITDA Margin (%) 15.1 12.4 18.9 16.5 17.8
Core Net Margin (%) 10.1 6.1 9.7 7.5 8.3
ROE (%) 22.5 7.8 13.9 10.1 10.9
ROA (%) 9.8 4.2 7.5 5.7 5.9
Stability
Current Ratio (x) 1.4 1.4 2.0 2.0 2.0
Net Debt to Equity (x) (0.2) (0.2) (0.3) (0.5) (0.6)
Interest Coverage (x) 8.5 3.8 7.2 5.5 5.9
Efficiency
A/P days 48 76 59 59 59
A/R days 49 71 55 55 55
Inventory Days 84 84 96 88 89
Interim Result (Rpbn)
3Q15 4Q15 1Q16 2Q16 3Q16
Sales 657 1,104 733 786 723
Gross Profit 74 140 91 110 105
Operating Profit 54 110 73 86 83
Net Profit 33 87 50 59 55
Gross Margins (%) 11.3 12.7 12.4 14 15
Opr Margins (%) 8.2 10.0 10.0 79 79
Net Margins (%) 5.1 7.9 6.9 69 66
Capital History
Date
08-Apr-14 IPO @ IDR590

PT Trimegah Securities Tbk - www.trimegah.com MARKET OUTLOOK 147
Property Sector

MARKET OUTLOOK PT Trimegah Securities Tbk - www.trimegah.com 148
Property Sector
Wisnu Budhiargo
Maria Gabriela
The best has yet to come
Marketing sales has yet to pick up..
We remain neutral on Property sector following lackluster marketing sales perfor-
mance. 2016 targets achievement are still a long way to go, with average deficit
reaching ~40%, especially on larger market-capped developers; SMRA at 37%,
BSDE at 40% and CTRA at 38%. Note that several big-names had lowered their
marketing sales target, and we expect more to come following the lack of sales
improvement for the year. Our neutral stance is further supported by the not-so-
favorable gap between primary and secondary prices, which is still at ~15%,
whilst we think demand would again be conducive only if it goes back to being in
the low-single digits.
..although premium-segment developers are showing prospect..
Whilst overall marketing sales still at turmoil, we still believe middle-upper seg-
ment developers are the ones performing. PWON had reached 88% of their
(revised) marketing sales target, whilst DILD reaching 55%. Note that tax am-
nesty-related cash has yet been fully absorbed by the sector, and is less likely
being spent on middle-segment properties as well. On that sense, we think inner-
city focused developers are the ones to benefit the most during the next property
upcycle.
..while industrial estates takes the cake
Industrial estates had performed better than expected, especially DMAS where
they’ve not only meet their preassigned target while still having much room for
sales addition (note that as of 9M16 DMAS had reached 6% excess over their
land sales target).
2017 should be better following more incentives..
We have yet given up altogether though as we still believe 2017 should see
better demand following the incentives that had happened in late-2016. Relaxed
LTV and mortgage limitations, followed by cheaper mortgage rates, as well as
broader foreign-purchasable supply should be the main property demand driver
for 2017, as thus would lean more towards middle-upper segment properties,
especially those that are directly benefitted by Jakarta’s upcoming MRT.
..with PWON and DMAS as our top picks
We pick both PWON and DMAS due to their robust balance and stable earnings.
We like PWON following their ability to mitigate earning volatility thanks to their
second-to-none recurring income performance, whilst DMAS due to their strong
yet consistent land sales performance. Note that we are Neutral on the sector
itself as we do not expect demand to drastically improve in 2017, however, our
top picks represents the stocks that we believe has the least earnings downside.
Wisnu Budhiargo
Gabriela Jacoub
Neutral
Companies Data
Rec.
TP Sh. Px. Ups Discount
to NAV
(%)
EPS 2017 PE (x) EV/EBITDA
(x)
Div.yld.(%)
(Rp/sh) (Rp/sh) (%) (IDR) (% YoY) 2016 2016 2016
PWON BUY 790 680 16.1 52 30 14 27 10 0
DMAS BUY 290 230 26.0 72 13 24 22 10 4
DILD BUY 780 500 56.0 77 497 19 13 13 2
MDLN BUY 670 340 97.0 79 46 -69 5 1 2
MMLP BUY 760 670 13.4 NA 21 41 45 37 0
BKSL BUY 170 95 78.9 77 4 113 48 22 2
MTLA BUY 510 264 93.1 84 20 23 7 5 7
BSDE NEUTRAL 1,800 1,680 7.1 68 140 -14 10 8 3
SMRA SELL 1,330 1,360 -2.2 68 16 72 150 17 0

PT Trimegah Securities Tbk - www.trimegah.com MARKET OUTLOOK 149
NAVs seem attractive at the moment..
As of 28/11/2016, sector’s valuation was at an attractive position, where stocks’ under our radar’s average dis-
count to NAV was at 70% with PWON leading the herd at 52% discount to NAV. Note that valuations were al-
ready relatively cheap prior to JCI’s post-Trump US Presidency victory price drop, where sector’s average dis-
count to NAV as of 10/11/2016 was at 67% and then fell to 71% as of 15/11/2016. What we’d like to highlight is
that prices were already cheap to begin with, and global sentiments had only made it even cheaper. But this
does not necessarily mean that the sector itself is currently worth any overweight rating, as NAV would only
measure their asset size, whilst monetization ability still remain as the sector’s main issue.
..but not so much on marketing sales performance
At this point, larger NAV becomes irrelevant so long as monetization ability remains an issue. Marketing sales
throughout 2016 has yet shown significant improvement, let alone sales growth. As of 9M 2016, sector’s cumula-
tive marketing sales was at a 10% deficit over 2015’s 9M achievement, and further note that 2016’s sales target
was being set on a relatively conservative manner with target growth being capped at ~10% (except for DILD,
where target was at an aggressive 35% increase). We do not expect the sector to meet its target for the year,
especially considering that in order to do so it would require ~170% improvement over 3Q16’s marketing sales
achievement, hence our Neutral stance over the sector.
Figure 78. Developer NAVs under our coverage
Figure 79. Developers’ Marketing Sales Performance (IDRbn)
2014 2015 2016 Target
Achieve-
ment
9M YoY
Growth Q1 Q2 Q3 Q4 Q1 Q2 Q3 Q4 Q1 Q2 Q3
APLN* 1,830 630 1,060 2,830 940 460 300 760 1,017 519 554 69.7%** 23%
DILD 632 549 621 736 252 245 884 493 702 298 400 54.7% 1%
PWON 586 543 842 1,129 1,200 799 501 600 594 550 656 81.8%** -28%
SMRA 650 1,790 1,810 351 1,200 1,500 296 1,354 401 1,312 489 62.9% -27%
BSDE 1,765 985 2,250 1,507 2,200 1,259 1,141 2,157 1,204 1,329 1,568 59.7% -11%
ASRI* 900 1,600 1,300 455 568 548 349 435 418 578 464 58.4% 0%
CTRA* 1,730 1,770 2,300 2,830 1,745 2,555 1,000 3,900 1,100 1,900 2,800 62.4% 9%
BKSL 452 518 420 255 212 164 115 278 156 244 246 53.8% 31%
MTLA - - - - 229 266 278 334 241 277 522 79.1% 35%
MDLN - - - - 1,456 606 522 587 221 233 508 22.9% -63%
DMAS 0 580 82 927 378 177 1,119 0 43 152 708 106.2% -46%
BEST* 73 154 256 300 213 0 0 226 0 189 188 54.0% NA
KIJA* 188 262 121 450 292 225 207 285 49 421 550 72.9% 41%
TOTAL - - - - 9,200 7,932 5,913 10,489 5,683 7,493 5,823
RNAV (IDR) Price as of 28/11/2016 (IDR) Discount to NAV
PWON 1,412 680 52%
DMAS 824 230 71%
DILD 2,237 500 77%
MDLN 1,659 340 79%
MTLA 1,748 264 84%
BKSL 410 95 78%
BSDE 5,333 1,680 67%
SMRA 4,220 1,360 68%
Source: Trimegah Research, Company
Source: Trimegah Research, Company. *not under our coverage universe **revised target

PT Trimegah Securities Tbk - www.trimegah.com MARKET OUTLOOK 150
Incentives were leaned towards high-rise developers..
Looking back, 2016 had experienced numerous incentives which highly benefits both supply and demand side,
however, demand was still relatively weak. It should be noted that 2016 was also the year where potential buy-
ers, especially high networth individuals, were in a wait-and-see stance following July’s tax amnesty. Given that
its been done, yet demand had yet rebounded, we expect mid-2017 to be the turning point of the sector as we
think buyers should be less concerned by tax payments by then, and would again opt for property purchase as a
means of investment.
..with added prospect over MRT
Figure 80. Recent Property-Related Incentives
Figure 81. Jakarta MRT Map
Source: Trimegah Research, Company
Source: Trimegah Research, Company
As Jakarta’s Mass Rapid Transit is getting
closer to completion, we expect high possi-
bility of affected area’s land value to fur-
ther appreciate (as precedent, based on
our discussions with property agents; Cen-
tury21 and Leads, land price in Cipete and
Cilandak appreciated by ~40% during
Antasari non-toll elevated road’s comple-
tion).
Following the same rationale, we expect
developers with exposure to MRT stations
to experience better take-up and sales rate
as to the ones that are not, and the ones
that should benefit the most are the ones
that has direct immediate access to said
stations; PWON, over their Blok M Plaza
asset which is directly connected to Blok M
Plaza, and DILD over their South Quarter
Simatupang asset and Kebon Melati asset
which are within close proximity to Lebak
Bulus and Bunderan HI station, respective-
ly.
Effective as of Aug-16
Lowers required Down
Payments for new mort-
gages to 15% (lowest,
first mortgage) and 25%
(highest, third mortgage).
Also grants second mort-
gage for indent properties.
Effective as of Sep-16
Lowers property final tax
from 5% to 2.5%.
Effective as of Sep-16
Enables KITAS-holding
expats to purchase HGB-
titled Apartments (priced
above IDR3bn-Jakarta)
and SHM-titled Landed
houses (priced above
IDR10bn-Jakarta).
Effective as of Oct-16
Lowers BPHTB tariff to 0%
for properties priced below
IDR2bn located in Jakarta.
Potentially by 2017
Further relaxes Indonesia
property purchasable
expatriates (currently
limited to KITAS holders,
potentially broadened to
visit-visa holders).
LTV Relaxation Property Final Tax Foreign Ownership Jakarta BPHTB Foreign Ownership
Main Beneficiaries:
BSDE due to their large
mortgage buyer-base,
PWON & DILD due to in-
dent property mortgage
exposure.
Main Beneficiaries:
MDLN and BKSL due to
90%+ development-based
revenue.
Main Beneficiaries:
PWON and DILD due to
project portfolio being
highly exposed to expat-
prone areas.
Main Beneficiaries:
PWON, DILD and MDLN
due to landbank and sup-
ply portfolio being highly
exposed to Jakarta.
Main Beneficiaries:
PWON and DILD as it
would further increase
their potential demand
pool.

PT Trimegah Securities Tbk - www.trimegah.com MARKET OUTLOOK 151
Secondary-primary price gap are getting less threatening..
Figure 82. Jakarta Apartment Secondary—Primary Price per sm Comparison (IDRbn)
Source: Trimegah Research, Cushman & Wakefield Indonesia, Century21, Rumah123.com
Figure 83. Jakarta Primary—Secondary Price Trend
Source: Bank Indonesia, Trimegah Research
..especially considering the gap-trend
Historically speaking, Jakarta is now fac-
ing a downwards trend in terms of prima-
ry-secondary price spread; making room
for an ideal primary market-driven prop-
erty demand environment to occur as in-
vestment oriented-buyer’s would then
have better confidence on being able to
dispose their investments at a favorable
price. As of end-Q3 2016, the spread was
at 14.4% (vs. 18.8% in Q3 2015) and
historically, should see lower spread by
Q4. Following the trend, we should see
2017’s spread to further decrease by an-
other 3-4%.
Our market findings (which was based on on-the-ground research on Greater Jakarta’s properties-for-sale in Q3
2016), indicates that the price difference between primary market and secondary market units are within the
range of 5% - 35% and would highly vary depending on the area as well as price-segmentation; with North Ja-
karta’s Upper-Middle segment apartments having the most spread between primary-secondary prices, with Cen-
tral Jakarta’s Lower-Middle segment units being the least, followed by East Jakarta’s Middle segment units. It
should be noted however that the spread itself could vary depending on both listing and transacted price availa-
bilities.

MARKET OUTLOOK PT Trimegah Securities Tbk - www.trimegah.com 152
Pakuwon Jati
Wisnu Budhiargo
Maria Gabriela
Three reasons why we like PWON
We upgrade PWON with a Buy and IDR790,- TP (16% upside) on the
back of: 1) Robust occupancy with NLA addition within hindsight, 2)
Potential upside from high quality development pipeline, and 3) New
large-scale inner city land bank acquisition ensures ample development
growth.
Robust recurring income performance, with more NLA to come
Their high-performing investment properties’ performance remained
robust where occupancy remained at +90% level, and gets even better
thanks to recent NLA additions followed by both planned and potential
further NLA additions. They currently have 510sm of shopping malls
operational whilst 110sm is currently under construction, adding 21% of
fresh supply by 2019. Note that their flagship retail development, Tun-
jungan Plaza, still holds the crown of being the largest shopping mall in
Surabaya with 98% occupancy rate (as of 6M16). Overall recurring
revenue contributes 47% to their topline, and is estimated to grow by
60% over 5 years.
Expect brand new launches in 2017
PWON had always been known for high-quality superblocks in both
Jakarta and Surabaya. Following their recent land acquisition of both
Simatupang (4.2Ha) and Daan Mogot (11Ha), we can expect fresh new
inner-city exciting developments of similar quality to be launched
throughout 2017. Both landbanks would not only provide strata invento-
ry, but would also create room for further increment in PWON’s recur-
ring income portfolio, further strengthening their position as Indonesia’s
King of Investment Properties.
Valuation
Our TP is derived using SOTP where we use DCF for both development
and recurring income whilst idle land banks are being valued based on
their current market price (see p.3 for valuation details). PWON current-
ly trades at 49% discount and 24x 2017 PE.
Pakuwon Jati is a property developer focusing
on upper-middle segment mixed-use develop-
ments in Jakarta and Surabaya.
Share Price Rp680
Sector Real Estate
Price Target Rp790 (16%)
BUY Rp790
Reuters Code PWON.JK
Bloomberg Code PWON.IJ
Issued Shares 48,160
Mkt Cap. (Rpbn) 33,471
Avg. Value Daily 6
Month (Rpbn) 54.6
52-Wk range 765 / 416
Burgami Inv. Ltd. 20.9%
PT. Pakuwon Arthaniaga 16.7%
Concord Media Inv. Ltd. 7.4% Raylight Investment Ltd 7.1% Public 47.8%
Core EPS 16F 17F
Consensus (Rp) 38 46
TRIM vs Cons. (%) -31.7% -37.0%
Simatupang to the rescue!
Company Update
Stock Data
Major Shareholders
Consensus
Stock Price
0.0
50.0
100.0
150.0
200.0
-
100
200
300
400
500
600
700
800
Nov-15 Jan-16 Mar-16 May-16 Jul-16 Sep-16
(Rpbn)Avg. 5 Day MA Trading Value (RHS)
Company Data
Year end Dec 2014 2015 2016F 2017F 2018F
Sales 3,873 4,625 5,123 4,602 5,234
EBITDA 2,472 3,441 3,245 3,566 4,236
Net Profit 2,599 1,401 1,259 1,435 1,777
EPS 54 29 26 30 37
DPS (Rp) 4 6 5 6 7
BVPS (Rp) 128 150 171 195 225
P/E (x) 13 23 26 23 18

PT Trimegah Securities Tbk - www.trimegah.com MARKET OUTLOOK 153
Income Statement (Rpbn)
Year end Dec 2014 2015 2016F 2017F 2018F
Revenue 3,873 4,625 5,123 4,602 5,234
% growth 28 19 11 -10 14
Gross Profit 2,158 2,669 2,229 2,305 2,744
Opr Profit 1,890 2,265 1,841 1,907 2,316
EBITDA 2,472 3,441 3,245 3,566 4,236
% growth 0 0 0 0 0
Net Int Inc/(Exp) 0 -157 -228 -237 -170
Gain/(loss) Forex -40 -277 -268 -268 -268
Other Inc/(Exp) 720 -839 -1,277 -1,335 -1,238
Pre-tax Profit 2,610 1,425 1,259 1,435 1,777
Tax -10 -25 0 0 0
Extra. Items 0 0 0 0 0
Net Profit 2,599 1,401 1,259 1,435 1,777
% growth 129 -46 -10 14 24
Balance Sheet (Rpbn)
Year end Dec 2014 2015 2016F 2017F 2018F
Cash and Deposits 2,809 2,071 2,881 2,490 -23
Inventory 1,665 2,244 3,783 3,568 3,490
Other Current Assets 7 10 10 10 10
Net Fixed Assets 964 1,457 1,965 2,447 2,924
Investment Properties 8,156 8,887 9,434 9,975 10,510
Other Noncurrent Assets 21 3 3 3 3
Total Assets 16,771 18,778 19,448 19,936 18,226
ST Debt 514 536 0 866 350
Other Current Liabilities 3,399 3,887 4,233 4,677 3,833
LT Debt 956 1,651 2,686 1,821 1,471
Other LT Liabs 3,625 3,248 3,073 3,117 3,117
Minority Interest 2,110 2,236 2,236 2,236 2,236
Total Liabilities 8,494 9,323 9,993 10,481 8,771
Shareholder's Equity 6,167 7,219 7,219 7,219 7,219
Net Debt/(Cash) -1,338 116 -195 196 1,843
Net Working capital 1,594 985 3,670 1,826 464
Cash Flow (Rpbn)
Year end Dec 2014 2015 2016F 2017F 2018F
Net Profit 2,599 1,401 1,259 1,435 1,777
Depr/Amort 582 1,177 1,404 1,659 1,920
Others 0 0 0 0 0
Chg in Opr Ass&Liab 1,303 -1,412 460 51 -1,081
CF's from Oprs 4,484 1,165 3,875 3,470 2,489
Capex -5,079 -2,398 -3,495 -3,642 -2,905
Others 1,884 126 0 0 0
CF's from Investing -3,196 -2,272 -3,495 -3,642 -2,905
Net Change in Debt -294 717 499 1,000 134
Others -312 -348 -992 -598 -211
CF's from Financing -605 369 -493 402 -76
Net Cash Flow 683 -738 -113 230 -492
Cash at BoY 2,126 2,809 2,071 1,958 2,188
Cash at EoY 2,809 2,071 1,958 2,188 1,697
Free Cashflow -595 -1,374 175 -386 -568
Key Ratio Analysis
Year end Dec 2014 2015 2016F 2017F 2018F
Profitability
Gross Margins (%) 56% 58% 44% 50% 52%
Op Margins (%) 49% 49% 29% 28% 39%
EBITDA Margins (%) 64% 74% 63% 78% 81%
Net Margins (%) 67% 30% 25% 31% 34%
ROA (%) 20% 8% 6% 7% 8%
ROE (%) 52% 21% 16% 16% 18%
Stability
Current Ratio (x) 1.4 1.2 1.6 1.2 1.6
Net Debt/Equity (x) -0.2 -0.3 -0.3 -0.3 -0.2
Int Coverage (x) 6.5 9.0 4.3 4.6 5.1
Efficiency
A/P days 20 31 25 28 23
A/R days 42 42 40 33 30
Inventory Days na na na na na
Interim Result (Rpbn)
3Q15 4Q15 1Q16 2Q16 3Q16
Sales 1137 1062 1246 1195 1194
Gross Profit 658 576 749 617 704
Operating Profit 569 426 652 328 769
Net Profit 827 434 605 353 426
Gross Margins (%) 58 54 60 51 59
Opr Margins (%) 50 40 52 27 64
Net Margins (%) 73 41 49 29 35
Capital History
Date
09-Oct-89 IPO @ IDR7,200
02-Jan-12 Right Issue III
30-Mar-12 Stock Split III (36,119,701,800)
03-Jul-15 Cash Dividend @ IDR4.5

MARKET OUTLOOK PT Trimegah Securities Tbk - www.trimegah.com 154
Puradelta Lestari Size does matter
PT Puradelta Lestari sells industrial, resi-
dential and commercial land through
their estate, Kota Deltamas.
Share Price Rp230
Sector Property
Price Target Rp290 (26%)
Buy Rp290
Reuters Code DMAS.JK
Bloomberg Code DMAS.IJ
Issued Shares 48,198
Mkt Cap. (Rpbn) 11,086
Avg. Value Daily 6
Month (Rpbn) 13.1
52-Wk range 296 / 183
AFP International Capital Ltd. 53.9%
Sojitz Corp. 22.5%
Public 20.0%
EPS 16F 17F
Consensus (Rp) 20 22
TRIM vs Cons. (%) 8.5% -35.9%
Company Update
Stock Data
Major Shareholders
Consensus
Stock Price
Three reasons why we like DMAS
We re-initiate DMAS with a Buy and a IDR290,- TP (26% upside) on the
back of: 1) Great 2015 marketing sales performance, and should remain
satisfactory throughout 2016 with plenty of traffic generating catalysts,
2) Remain as the king of industrial landbank, and 3) Cash-rich balance
sheet with 4% divd yield, highest among property comps. DMAS also
has underperformed BEST by ~30% this year despite similar marketing
sales (DMAS 10.4 ha Vs. BEST 6.5 ha year-to-date).
Realistic marketing sales target, company should deliver
DMAS had booked 90.5Ha in land sales throughout 2015, and targets
50Ha in 2016. Although as of 1Q DMAS had only booked 2.2Ha, compa-
ny guides optimistic tone upon achievement, whereas an additional
8.2Ha had been secured whilst intensive negotiation on another 37Ha is
currently on-going. If all goes through as planned, 95% of target should
be secured by end of 3Q.
Still the largest non-scattered landbank holder in West Java
Puradelta Lestari holds the largest net saleable landbank in the immedi-
ate area (+125% to LPCK, +65% BEST, +60% KIJA) and has the ability
to accommodate any upcoming anchor tenants with ease due to their
land bank being one big bulk land, in which would be beneficial since
anchor buyers would usually require at least 50+ Ha of non-scattered
land. As a result, as FDI picks up, Puradelta Lestari should be their first
pick for investment.
Strong commitment to dividend yield
DMAS has a net cash balance sheet and has shown strong commitment
to dividend, as it gave a payout ratio of 73% in 2015 when it had a
record profit and management is committed to a minimum of 30% pay-
out. We assume 40/50% payout ratio to arrive in 4/3% divd yield in
2016/17 with upside if company can achieve better marketing sales.
Valuation
We come to a DCF-based TP of IDR310 (35% upside), implying 10x
2016 P/E. Price target is based on our DCF estimate, with Beta of 1.7,
risk-free rate of 7.2% and WACC of 15.5%. The stock is trading at
9x/14x 2016E/2017E P/E. RNAV-wise, our TP implies 41% discount to
RNAV whilst current price reflects 57% discount to RNAV.
Wisnu Budhiargo
Maria Gabriela
0.0
10.0
20.0
30.0
40.0
50.0
60.0
-
50
100
150
200
250
300
350
Nov-15 Jan-16 Mar-16 May-16 Jul-16 Sep-16
(Rpbn)Avg. 5 Day MA Trading Value (RHS)
Year end Dec 2014 2015 2016F 2017F 2018F
Sales 1,538 2,286 1,786 1,133 1,406
EBITDA 944 1,359 1,000 589 728
Net Profit 964 412 497 614 683
EPS 22 28 21 12 15
DPS (Rp) 0 23 9 7 5
P/E (x) 11 8 11 19 15
Dividend Yield (%) 0 0 0 0 0
Companies Data
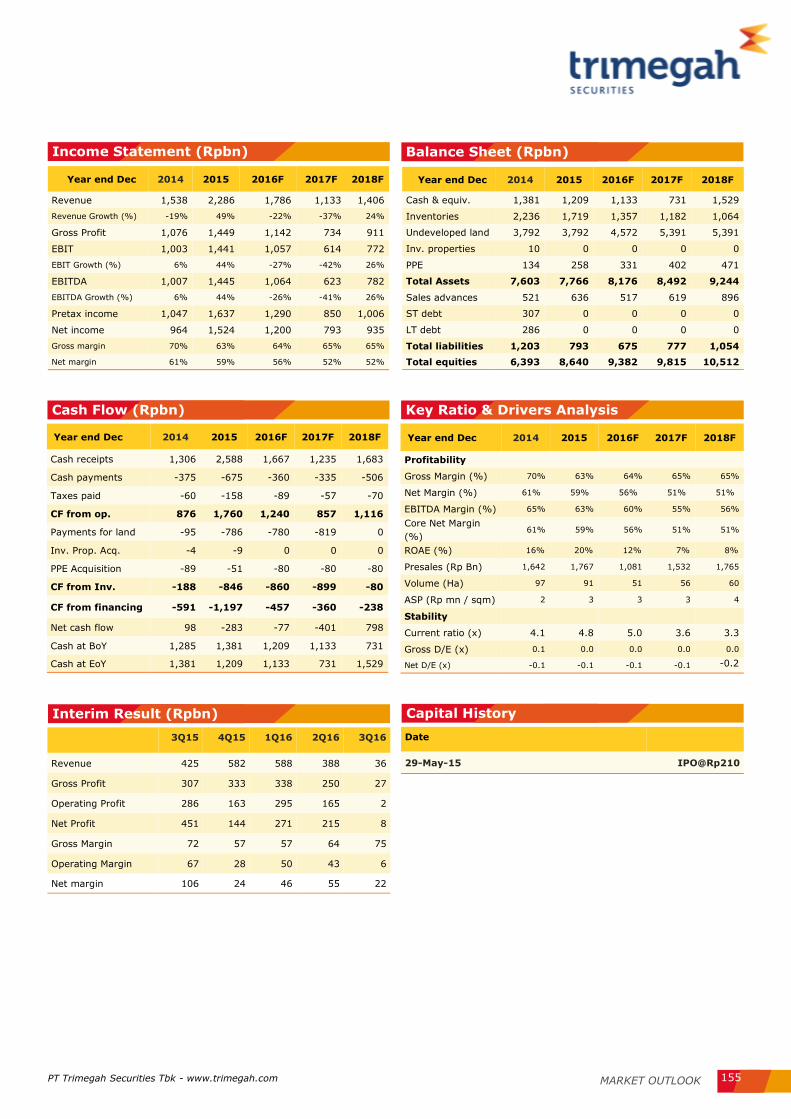
PT Trimegah Securities Tbk - www.trimegah.com MARKET OUTLOOK 155
Income Statement (Rpbn)
Year end Dec 2014 2015 2016F 2017F 2018F
Revenue 1,538 2,286 1,786 1,133 1,406
Revenue Growth (%) -19% 49% -22% -37% 24%
Gross Profit 1,076 1,449 1,142 734 911
EBIT 1,003 1,441 1,057 614 772
EBIT Growth (%) 6% 44% -27% -42% 26%
EBITDA 1,007 1,445 1,064 623 782
EBITDA Growth (%) 6% 44% -26% -41% 26%
Pretax income 1,047 1,637 1,290 850 1,006
Net income 964 1,524 1,200 793 935
Gross margin 70% 63% 64% 65% 65%
Net margin 61% 59% 56% 52% 52%
Balance Sheet (Rpbn)
Cash Flow (Rpbn)
Year end Dec 2014 2015 2016F 2017F 2018F
Cash receipts 1,306 2,588 1,667 1,235 1,683
Cash payments -375 -675 -360 -335 -506
Taxes paid -60 -158 -89 -57 -70
CF from op. 876 1,760 1,240 857 1,116
Payments for land -95 -786 -780 -819 0
Inv. Prop. Acq. -4 -9 0 0 0
PPE Acquisition -89 -51 -80 -80 -80
CF from Inv. -188 -846 -860 -899 -80
CF from financing -591 -1,197 -457 -360 -238
Net cash flow 98 -283 -77 -401 798
Cash at BoY 1,285 1,381 1,209 1,133 731
Cash at EoY 1,381 1,209 1,133 731 1,529
Key Ratio & Drivers Analysis
Year end Dec 2014 2015 2016F 2017F 2018F
Profitability
Gross Margin (%) 70% 63% 64% 65% 65%
Net Margin (%) 61% 59% 56% 51% 51%
EBITDA Margin (%) 65% 63% 60% 55% 56%
Core Net Margin
(%) 61% 59% 56% 51% 51%
ROAE (%) 16% 20% 12% 7% 8%
Presales (Rp Bn) 1,642 1,767 1,081 1,532 1,765
Volume (Ha) 97 91 51 56 60
ASP (Rp mn / sqm) 2 3 3 3 4
Stability
Current ratio (x) 4.1 4.8 5.0 3.6 3.3
Gross D/E (x) 0.1 0.0 0.0 0.0 0.0
Net D/E (x) -0.1 -0.1 -0.1 -0.1 -0.2
Interim Result (Rpbn)
3Q15 4Q15 1Q16 2Q16 3Q16
Revenue 425 582 588 388 36
Gross Profit 307 333 338 250 27
Operating Profit 286 163 295 165 2
Net Profit 451 144 271 215 8
Gross Margin 72 57 57 64 75
Operating Margin 67 28 50 43 6
Net margin 106 24 46 55 22
Capital History
Date
29-May-15 IPO@Rp210
Year end Dec 2014 2015 2016F 2017F 2018F
Cash & equiv. 1,381 1,209 1,133 731 1,529
Inventories 2,236 1,719 1,357 1,182 1,064
Undeveloped land 3,792 3,792 4,572 5,391 5,391
Inv. properties 10 0 0 0 0
PPE 134 258 331 402 471
Total Assets 7,603 7,766 8,176 8,492 9,244
Sales advances 521 636 517 619 896
ST debt 307 0 0 0 0
LT debt 286 0 0 0 0
Total liabilities 1,203 793 675 777 1,054
Total equities 6,393 8,640 9,382 9,815 10,512

MARKET OUTLOOK PT Trimegah Securities Tbk - www.trimegah.com 156
Three reasons why we like Intiland
We re-initiate DILD with a Buy and TP at IDR780 (50% upside) on the back of: 1)
Main beneficiary of upcoming demand over upper-segment vertical / landed hous-
ings through tax amnesty-related increased purchasing confidence, 2) Further ASP
appreciation potential as a result of better accessibility backed by upcoming MRT-
infra’ delivery, whilst having better affordability given cheaper monthly payments
thanks to second-house mortgage relaxation, 3) Relatively strong marketing sales
performance despite the absence of major new launches.
Tax amnesty to unleash pent-up demand due to tax disclosure concern
DILD mainly focuses on upper-segment properties, which demand has been
suppressed not just due to recent economic slow-down, but also due to buyers’
concern of being chased by tax department when they invest in large ticket items
such as high-end apartments. We think buyers would be more comfortable buying
after declaring their net worth in tax amnesty. Note that 46% of DILD’s NAV has
upper-segment individuals as captive market.
Main beneficiary of the highly coveted MRT-infra
14% of Company’s NAV has high exposure to MRT, in which should create further
room for ASP appreciation (overseas precedence shows 25% increment is possi-
ble), a much needed price catalyst in the currently challenging property-sector
environment.
Flagship-level architecture made affordable thanks to mortgage relaxation
DILD’s reputation of being one of the few developers whom puts effort on creating
flagship properties through high-profile architectural firm creates an upper edge in
terms of take up potential, where their upcoming / existing major assets utilizes
world-class architecture firms that provides better value-for-money projects and
should translate to better chances of being bought over its direct competitors.
Timing is further supported by mortgage-relaxation as it significantly decreases
monthly payments as to compared to developer installments, which again should
create additional attractiveness.
Valuation
Our TP is a sum of the parts comprised of: 1) DCF for launched and within pipeline
development and investment properties, 2) Market replacement cost of idle land-
bank. DILD currently trades at 77% discount to NAV and 15x 2016 PE.
DILD is a leading Indonesian property develop-
er with a primary focus on property develop-
ment, management and investment. Compa-
ny’s portfolio includes middle to high-end town-
ships & estates, mixed-use & high rise develop-
ments,and industrial estates in Greater Jakarta,
Share Price Rp500
Sector Real Estate
Price Target Rp780 (50%)
Intiland Development Against all odds
BUY Rp780
Reuters Code DILD.JK
Bloomberg Code DILD.IJ
Issued Shares 10,366
Mkt Cap. (Rpbn) 5,183
Avg. Value Daily 6
Month (Rpbn) 14.3
52-Wk range 665 / 455
Credit Suisse Singapore 19.9%
DB Singapore 12.6%
UBS AG Singapore 9.6%
Public 56.9%
EPS 16F 17F
Consensus (Rp) 43 49
TRIM vs Cons. (%) -8.4% 8.2%
Company Update
Stock Data
Major Shareholders
Consensus
Stock Price
Wisnu Budhiargo
Maria Gabriela
0.0
5.0
10.0
15.0
20.0
25.0
30.0
35.0
-
100
200
300
400
500
600
700
Nov-15 Jan-16 Mar-16 May-16 Jul-16 Sep-16
(Rpbn)Avg. 5 Day MA Trading Value (RHS)Year end Dec 2014 2015 2016F 2017F 2018F
Sales (Rp bn) 1828 2201 2334 2799 2994
Net Profit (Rp bn) 431 402 401 476 583
EPS (Rp) 39 40 48 60 67
EPS Growth (%) -11 2 21 24 11
DPS (Rp) 8 10 8 8 9
BVPS (Rp) 0 0 0 0 0
P/E (x) 13 12 10 8 8
Div Yield (%) 2 2 2 2 2
Company Data
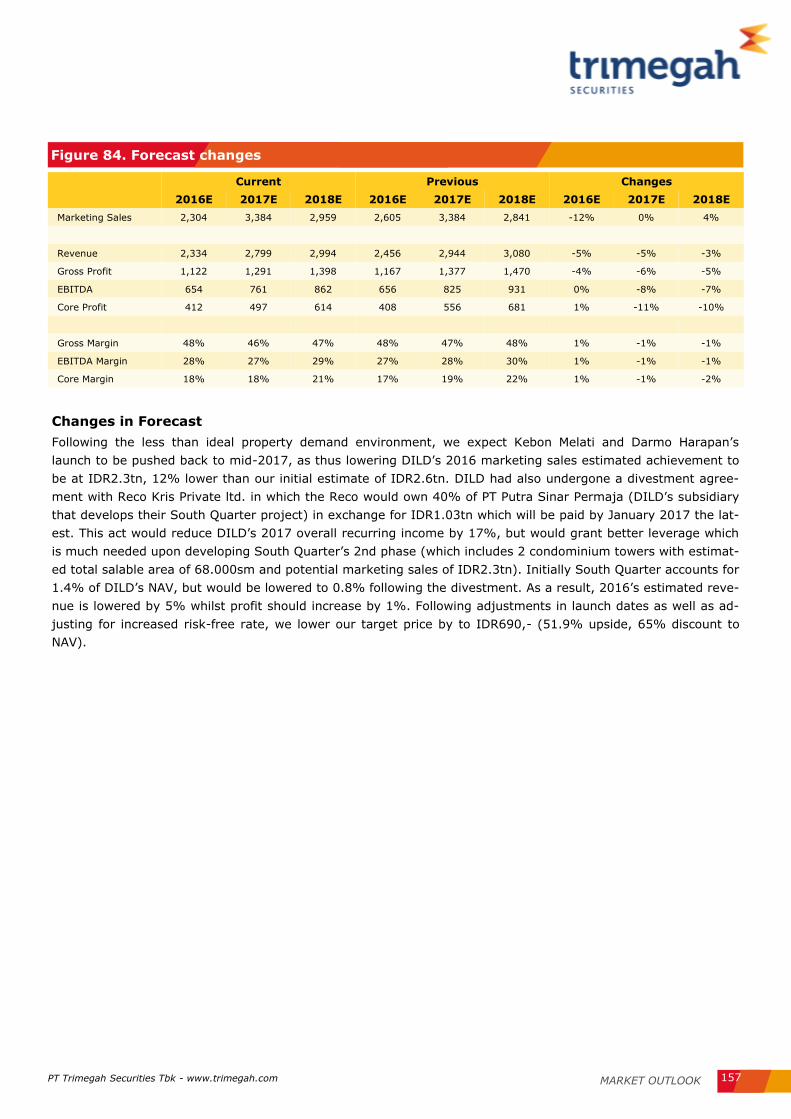
PT Trimegah Securities Tbk - www.trimegah.com MARKET OUTLOOK 157
Changes in Forecast
Following the less than ideal property demand environment, we expect Kebon Melati and Darmo Harapan’s
launch to be pushed back to mid-2017, as thus lowering DILD’s 2016 marketing sales estimated achievement to
be at IDR2.3tn, 12% lower than our initial estimate of IDR2.6tn. DILD had also undergone a divestment agree-
ment with Reco Kris Private ltd. in which the Reco would own 40% of PT Putra Sinar Permaja (DILD’s subsidiary
that develops their South Quarter project) in exchange for IDR1.03tn which will be paid by January 2017 the lat-
est. This act would reduce DILD’s 2017 overall recurring income by 17%, but would grant better leverage which
is much needed upon developing South Quarter’s 2nd phase (which includes 2 condominium towers with estimat-
ed total salable area of 68.000sm and potential marketing sales of IDR2.3tn). Initially South Quarter accounts for
1.4% of DILD’s NAV, but would be lowered to 0.8% following the divestment. As a result, 2016’s estimated reve-
nue is lowered by 5% whilst profit should increase by 1%. Following adjustments in launch dates as well as ad-
justing for increased risk-free rate, we lower our target price by to IDR690,- (51.9% upside, 65% discount to
NAV).
Current Previous Changes
2016E 2017E 2018E 2016E 2017E 2018E 2016E 2017E 2018E
Marketing Sales 2,304 3,384 2,959 2,605 3,384 2,841 -12% 0% 4%
Revenue 2,334 2,799 2,994 2,456 2,944 3,080 -5% -5% -3%
Gross Profit 1,122 1,291 1,398 1,167 1,377 1,470 -4% -6% -5%
EBITDA 654 761 862 656 825 931 0% -8% -7%
Core Profit 412 497 614 408 556 681 1% -11% -10%
Gross Margin 48% 46% 47% 48% 47% 48% 1% -1% -1%
EBITDA Margin 28% 27% 29% 27% 28% 30% 1% -1% -1%
Core Margin 18% 18% 21% 17% 19% 22% 1% -1% -2%
Figure 84. Forecast changes

PT Trimegah Securities Tbk - www.trimegah.com MARKET OUTLOOK 158
Income Statement (Rpbn)
Year end Dec 2014 2015 2016F 2017F 2018F
Revenue 1828 2201 2334 2799 2994
Revenue Growth (%) 21 20 6 20 7
Gross Profit 993 1043 1122 1291 1398
EBIT 595 571 609 706 798
EBIT Growth (%) 49 -4 7 16 13
EBITDA 637 605 654 761 862
EBITDA Growth (%) 45 -5 8 16 13
Pretax income 528 533 580 697 811
Net income 431 402 401 476 583
Gross margin 54 47 48 46 47
Net margin 24 18 17 17 19
Balance Sheet (Rpbn)
Year end Dec 2014 2015 2016F 2017F 2018F
Cash & equiv. 552 405 497 389 89
Inventories 3,125 3,564 3,803 5,029 5,452
Undeveloped land 3,202 3,644 4,270 5,299 5,805
Fixed Assets 1,019 1,343 1,574 1,953 2,140
Total Assets 9,008 10,289 11,600 14,458 15,408
Sales advances 1,760 1,343 1,389 2,006 2,346
Bank Loan 1,620 2,691 3,132 3,099 3,174
Bonds Payable 497 498 744 754 600
Total liabilities 4,539 5,518 6,509 7,941 8,403
Total equities 4,382 4,682 4,983 5,358 5,821
Cash Flow (Rpbn)
Year end Dec 2014 2015 2016F 2017F 2018F
Cash receipts 2,308 1,789 2,334 2,799 2,994
Cash payments -2,772 -2,459 -1,212 -1,508 -1,596
Tax paid -107 -123 -101 -101 -99
CF from op. -727 -1,058 386 464 574
Capital expenditure -98 -51 -900 -1,500 -700
Security investment /
asset sale 3 35 0 0 0
Dividend received 5 8 0 0 0
CF from Inv. -89 -8 -900 -1,500 -700
CF from financing 852 918 606 927 -174
Net cash flow 35 -148 93 -108 -300
Cash at BoY 529 552 405 497 389
Cash at EoY 552 405 497 389 89
Key Ratio Analysis
Year end Dec 2014 2015 2016F 2017F 2018F
Gross Margin (%) 54 47 48 46 47
Net Margin (%) 24 18 17 17 19
EBITDA Margin (%) 35 27 28 27 29
Core Net Margin (%) 25 18 18 18 21
ROAE (%) 10 9 52 54 55
Presales (Rp Bn) 2,537 1,873 2,304 3,384 2,959
Chg in total debt 933 1021 686 -23 -79
Gross D/E (%) 48 68 78 71 64
Net D/E (%) 36 59 68 65 63
Interim Result (Rpbn)
3Q15 4Q15 1Q16 2Q16 3Q16
Sales 581 626 589 541 528
Gross Profit 268 378 240 227 243
Operating Profit 146 232 142 98 118
Net Profit 84 187 101 50 55
Gross Margins (%) 46 60 40 42 46
Opr Margins (%) 25 37 24 18 22
Net Margins (%) 15 29 17 9 10
Capital History
Date
04-Feb-91 IPO@Rp6,500
04-Jul-10 Rights Issue
26-Jul-10 Stock Split 2:1
19-Jul-12 Cash Dividend @ IDR3
30-Jul-13 Cash Dividend @ IDR5
11-Jul-14 Cash Dividend @ IDR8
17-Jun-15 Cash Dividend @I DR5
12-Jul-16 Cash Dividend @ IDR5

MARKET OUTLOOK PT Trimegah Securities Tbk - www.trimegah.com 159
Modernland, a multi-years growth story in the making
We initiate MDLN with a Buy and TP at IDR670,- (97% upside) on the
back of: 1) 59.5% of NAV are highly benefitted by soon to be effective
LTV-relaxation, 2) Current NAV reflects cheaply priced assets, whilst
holding the ability to unlock new ASP heights, 3) Key beneficiary of
lowered Final Tax payment. Our TP is a sum of the parts comprised of:
1) DCF for major existing development properties, 2) Market replace-
ment cost of Company’s matured properties and idle landbank, 3) Capi-
talization of their currently revenue-generating investment properties.
MDLN currently trades at 13x 2016 PE and at a steep 66% discount to
RNAV.
Plenty of exciting developments in Jakarta Garden City in 2H16
and 2017
MDLN’s Jakarta Garden City (JGC, 244ha, 80% of our SOTP) residential
township currently sells at ~IDR 10mn psm versus Kelapa Gading
~25mn psm despite only 20mins driving distance post completion of a
direct access road. Aeon mall is also under construction and its opening
in early 2017 should be a catalyst for land value in JGC. Management
has been more active in finding ways to increase value further in JGC
and we are optimistic we can see more facilities or deals signed soon.
Bekasi industrial estate will become new growth driver from
2018 onward
MDLN’s Bekasi industrial estate (961ha with license for 2200ha) will
benefit from Cibitung—Cilincing toll road (has not begun construction)
which would provide it with nearer access to Jakarta port compared to
existing industrial estates in Cikampek/Cikarang area. We expect the
Bekasi industrial estate to be launched in 2018 at the earliest.
What can the Company do to improve outlook further?
Given that their operating cash flow are being highly burdened by inter-
est cost (reaching 36% of EBITDA), we think the Company should be
able to carry themselves forward by performing bulk land sales (as they
did back in 2013) to gain fresh cash and lower their interest level. We’ve
observed their available assets, and come to an impression that either
JGC or Bekasi land bank has the highest chance of being sold immedi-
ately. By doing so, MDLN not only gains edge on their cash flow but also
an enlarged Bekasi’s working capital war chest.
Modernland is a township developer
which focuses on both middle-upper
segment landed residential develop-
ments and industrial estates. Their
notable assets include Jakarta Gar-
den City in East Jakarta and Modern
Cikande Tangerang.
Share Price Rp340
Sector Real Estate
Price Target Rp670 (97%)
Modernland Realty For those who seek untapped value
BUY Rp670
Reuters Code MDLN.JK
Bloomberg Code MDLN.IJ
Issued Shares 12,533
Mkt Cap. (Rpbn) 4,261
Avg. Value Daily 6
Month (Rpbn) 5.2
52-Wk range 510 / 315
AA Land Pte. Ltd. 16.08% Woodside Global Ventures Inc. 11.17%
Webster Heights Holding Pte. Ltd. 11.54%
Public 67.68%
EPS 16F 17F
Consensus (Rp) 55 60
TRIM vs Cons. (%) -34.6% -27.8%
Company Update
Stock Data
Major Shareholders
Consensus
Stock Price
Wisnu Budhiargo
Gabriella Jacoub
0.0
5.0
10.0
15.0
20.0
25.0
-
100
200
300
400
500
600
Nov-15 Jan-16 Mar-16 May-16 Jul-16 Sep-16
(Rpbn)Avg. 5 Day MA Trading Value (RHS)Year end Dec 2014 2015 2016F 2017F 2018F
Sales (Rp bn) 2,840 2,962 3,488 2,171 2,428
Net Profit (Rp bn) 706 873 807 246 371
EPS (Rp) 56 70 64 20 30
EPS Growth (%) -71.19% 23.67% -7.64% -69.46% 50.66%
DPS (Rp) 5 12 6 6 2
BVPS (Rp) 425 483 541 555 582
P/E (x) 6 5 5 18 12
Div Yield (%) 1.45% 3.47% 1.81% 1.67% 0.51%
Companies Data

PT Trimegah Securities Tbk - www.trimegah.com MARKET OUTLOOK 160
Income Statement (Rpbn) Balance Sheet (Rpbn)
Cash Flow (Rpbn) Key Ratio Analysis
Interim Result (Rpbn) Capital History
Year end Dec 2014 2015 2016F 2017F 2018F
Revenue 2,840 2,962 3,488 2,171 2,428
Revenue Growth 54% 4% 18% -38% 12%
Gross Profit 1,600 1,676 1,885 1,175 1,316
EBIT 1,201 1,258 144 149 154
EBIT Growth (%) 18.70% 4.70% -89% 3% 3%
EBITDA 1407 1506 1,531 907 1,016
EBITDA Growth (%) 19% 7% 2% -41% 12%
Pretax income 714 960 807 246 371
Net income 706 873 807 246 371
Gross margin 56% 57% 54% 54% 54%
Net margin 25% 29% 23% 11% 15%
Year end Dec 2014 2015 2016F 2017F 2018F
Cash & equiv. 583 519 2,115 2,584 3,002
Inventories 924 851 746 851 1,049
Undeveloped land 4,221 5,484 2,184 2,284 2,384
Fixed Assets 1,131 1,128 1,184 1,234 1,281
Total Assets 10,359 12,843 12,588 13,516 14,658
Sales advances 603 1,099 585 965 1,364
Bank Loan 216 308 308 308 308
Bonds Payable 3,378 4,231 4,231 4,231 4,231
Total liabilities 5,036 6,786 5,811 6,566 7,359
Total equities 5,323 6,057 6,776 6,950 7,299
Year end Dec 2014 2015 2016F 2017F 2018F
Cash receipts 2,601 275 202 -203 -380
Cash payments -2,351 -495 -507 375 394
Tax paid -103 -16 0 0 0
CF from op. 147 -237 -1,416 842 740
Capital expenditure -25 10 3,100 -300 -300
Security invest-
ment / asset sale -43 -33 0 0 0
Dividend received 0 0 0 0 0
CF from Inv. -68 -23 3,100 -300 -300
CF from financing -9 -23 -79 -73 -22
Net cash flow 71 -283 1,605 470 418
Cash at BoY 512 509 509 2,115 2,584
Cash at EoY 583 227 2,115 2,584 3,002
Year end Dec 2014 2015 2016F 2017F 2018F
Gross Margin (%) 56 57 54 54 54
Net Margin (%) 25 29 23 11 15
EBITDA Margin (%) 50 51 44 42 42
Core Net Margin (%) 25 29 23 11 15
ROAE (%) 12% 11% 11% 6% 6%
Presales (Rp Bn) 3651 3651 -832 3057 3019
Chg in total debt 159 -113 0 0 0
Gross D/E (x) 95% 112% 86% 94% 101%
Net D/E (x) 68% 75% 67% 65% 62%
3Q15 4Q15 1Q16 2Q16 3Q16
Sales 735 814 621 1,112 402
Gross Profit 334 581 308 575 195
Operating Profit 232 495 232 302 198
Net Profit 144 407 50 26 3
Gross Margins (%) 45 71 50 52 49
Opr Margins (%) 32 61 37 27 49
Net Margins (%) 20 50 8 2 1
Date
18-Jan-93 IPO@Rp4,650
16-Jan-12 Additional Share @Rp 500
13-Nov-13 Stock Split 1:2

MARKET OUTLOOK PT Trimegah Securities Tbk - www.trimegah.com 161
Metropolitan Land
Three reasons to Buy MTLA
We re-initiate MTLA with a Buy and a IDR510 TP (93% upside) on the
back of: 1) Beneficiary of lower mortgage rate trend (~60% of market-
ing sales below IDR650mn per unit and 90% of its buyers use mort-
gage), 2) Upside in land value thanks to planned infrastructure in Great-
er Jakarta, and 3) Solid recurring income (39% of profit) in malls that
should also benefit from infrastructure build-out. Also note that MTLA
has delivered strong marketing sales considering current property mar-
ket environment, with 1Q16 up 25% YoY. The only issue is liquidity (90
days ADTV of IDR 0.2bn).
Beneficiary of lower mortgage rate trend
MTLA benefits from non-subsidized mortgage rate coming down
(promotion rate by big banks have fallen from 10% to 8% in last 3mos).
90% of MTLA’s buyer profile are mortgage-buyers, who tend to opt for
lower-middle segment houses (categorized as <500m per unit), which
fits MTLA’s product portfolio like a glove. 65% of their NAV are aimed
towards lower-middle segment, and backed by solid historical marketing
sales despite overall slowing in the property market.
Land bank benefits from infra build-out in Greater Jakarta
They’re also the main beneficiary of upcoming major infrastructure, LRT,
which shall be located nearby their major assets, creating room for
potential ASP upside (see p.8). They’re higher-end property line up also
ensures that they’re well-equipped should tax amnesty bill is passed.
Solid recurring income in malls that also benefit from infra
36% of their revenue (2016E) is recurring (mostly malls with some
hotels), and is expected to further grow following the completion of their
latest shopping mall in a growing end-user neighborhood. Our NAV for
MTLA’s recurring business implies 11% cap rate, which we think is con-
servative (current going rate is 8-10%).
Valuation
Our TP is derived using 83% discount to NAV for development property
and we use DCF for recurring income (see p.3 for details on NAV). MTLA
currently trades at 8.6x 2016 PE.
Metropolitan Land is a township develop-
er focusing on lower-middle segment
houses in Greater Jakarta.
Share Price Rp264
Sector Real Estate
Price Target Rp530 (93%)
BUY Rp510
Reuters Code MTLA.JK
Bloomberg Code MTLA.IJ
Issued Shares 7,655
Mkt Cap. (Rpbn) 2,021
Avg. Value Daily 6
Month (Rpbn) 0.1
52-Wk range 340 / 178
Reco Newton PTE LTD 37.5%
PT Metropolitan Perada Int. 36.7%
DBS Bank LTD 14.7%
Public 10.7%
Core EPS 16F 17F
Consensus (Rp) 27 40
TRIM vs Cons. (%) 31.9% 13.4%
Beneficiary of mortgage trends
Company Update
Stock Data
Major Shareholders
Consensus
Stock Price
0.0
0.2
0.4
0.6
0.8
1.0
-
50
100
150
200
250
300
350
400
Nov-15 Jan-16 Mar-16 May-16 Jul-16 Sep-16
(Rpbn)Avg. 5 Day MA Trading Value (RHS)
Wisnu Budhiargo
Gabriella Jacoub
Company Data
Year end Dec 2014 2015 2016F 2017F 2018F
Sales 1,118 1,089 1,250 1,543 1,787
EBITDA 467 461 544 633 719
Net Profit 268 214 284 349 418
EPS 35 28 36 45 54
DPS (Rp) 3.5 5.6 7.2 9.0 10.7
BVPS (Rp) 255 276 306 344 389
EV/EBITDA (x) 6.2 6.7 5.3 3.8 3.0
P/E (x) 8.8 11.1 8.6 7.0 5.8
Price to Marketing Sales (x) 0.29 0.28 0.24 0.20 0.18

PT Trimegah Securities Tbk - www.trimegah.com MARKET OUTLOOK 162
Income Statement (Rpbn)
Year end Dec 2014 2015 2016F 2017F 2018F
Revenue 1,118 1,089 1,250 1,543 1,787
% growth 31 -3 15 23 16
Gross Profit 648 660 752 884 1,007
Opr Profit 432 419 498 582 664
EBITDA 467 461 544 633 719
% growth 1 1 1 1 1
Net Int Inc/(Exp) 63 77 62 40 28
Gain/(loss) Forex 0 0 0 0 0
Other Inc/(Exp) -1 -40 -36 -36 -36
Pre-tax Profit 550 596 600 684 766
Tax 6 2 86 105 118
Minority Int. 41 26 26 26 26
Extra. Items 0 1 2 3 4
Net Profit 268 214 284 349 418
% growth 11 -20 32 23 20
Balance Sheet (Rpbn)
Year end Dec 2014 2015 2016F 2017F 2018F
Cash and Deposits 302 216 210 390 626
Inventory 1,372 1,687 1,736 1,517 1,444
Other Current Assets 368 293 383 457 519
Net Fixed Assets 316 364 422 475 525
Investment Properties 808 981 887 881 1,010
Other Noncurrent
Assets 85 79 79 79 79
Total Assets 3,251 3,621 3,717 3,799 4,203
ST Debt 436 446 286 0 380
Other Current Liabili-
ties 167 254 323 346 365
LT Debt 416 483 380 380 0
Other LT Liabs 202 225 248 274 286
Minority Interest 100 103 129 154 180
Total Liabilities 1,220 1,408 1,237 1,000 1,031
Shareholder's Equity 1,931 2,110 2,351 2,644 2,992
Net Debt/(Cash) 549 712 456 -10 -246
Net Working capital 1,440 1,497 1,720 2,017 1,844
Cash Flow (Rpbn)
Year end Dec 2014 2015 2016F 2017F 2018F
Net Profit 268 214 284 349 418
Depr/Amort 35 43 47 51 55
Others 0 1 2 3 4
Chg in Opr Ass&Liab -426 -131 -45 195 41
CF's from Oprs -124 126 285 595 514
Capex -124 -91 -104 -104 -104
Others -331 9 -170 119 32
CF's from Investing -115 -260 15 -72 -207
Net Change in Debt 209 77 -263 -286 0
Others -55 -35 -43 -57 -70
CF's from Financing 154 42 -305 -343 -70
Net Cash Flow -85 -93 -5 180 236
Cash at BoY 382 302 216 210 390
Cash at EoY 297 209 211 390 626
Free Cashflow -304 -34 124 455 384
Key Ratio Analysis
Year end Dec 2014 2015 2016F 2017F 2018F
Profitability
Gross Margins (%) 58% 61% 60% 57% 56%
Op Margins (%) 39% 38% 40% 38% 37%
EBITDA Margins (%) 42% 42% 44% 41% 40%
Net Margins (%) 24% 20% 23% 23% 23%
ROE (%) 14% 10% 12% 13% 14%
ROA (%) 8% 6% 8% 9% 10%
Stability
Current Ratio (x) 3.4 3.1 3.8 6.8 3.5
Net Debt/Equity (x) 0.3 0.3 0.2 0 -0.1
Net Debt/EBITDA (x) 1.2 1.5 0.8 0 -0.3
Int Coverage (x) 6.9 5.4 8 14.6 23.9
Efficiency
A/P days 30 25 72 67 66
A/R days 108 77 93 93 93
Inventory Days 1067 1437 1273 840 676
Interim Result (Rpbn)
3Q15 4Q15 1Q16 2Q16 3Q16
Sales 223 339 246 286 232
Gross Profit 129 212 151 162 146
Operating Profit 56 150 95 97 80
Net Profit 29 84 65 61 43
Gross Margins (%) 57 62 61 57 63
Opr Margins (%) 25 44 38 34 34
Net Margins (%) 13 24 26 21 18
Capital History
Date
09-Jun-11 IPO @ Rp240
08-Aug-15 Stock Dividend 1:100

MARKET OUTLOOK PT Trimegah Securities Tbk - www.trimegah.com 163
Sentul City, the next Serpong phenomenon
We initiate BKSL with a Buy and TP at IDR170,- (79% upside) on the back of: 1)
Better monetization strategy which highly involves Joint Ventures, 2) Current NAV
reflects cheaply priced assets, whilst assets are no longer affiliated with troubled
Bakrie Group, 3) Key beneficiary of currently under construction Light Rail Train
infrastructure. Our TP is a sum of the parts comprised of: 1) DCF for major
existing development properties, 2) Discounted market value of BKSL’s idle
landbank, 3) Capitalization of their currently revenue-generating investment
properties. BKSL currently trades at 24x 2017 PE at a steep 78% discount to
readjusted net asset value and 12% discount to readjusted replacement value.
Game-changing developments as main growth driver
Though Sentul City (BKSL’s main asset that accounts for 90% of their NAV) has
adequate amenities as of now, major developments within the estate are current-
ly undergoing construction, e.g. AEON Mall, Trisakti University, JV Apartments, in
which should serve as estate’s major traffic attractor and at the same time in-
creasing ASP growth potential.
Learning from past mistakes, they now eye on broader target market
As competition gets tighter, BKSL had realized that their old sales strategy is no
longer relevant to the current market. Instead of hoarding their extra large land
bank for themselves, they are now leaning towards utilizing JV-projects as means
of asset monetization. Verdura apartment serves as their latest JV-project, where
they’re co-developing a 3-towered apartment block worth ~IDR1.2tn with PTPP
Properti (PPRO.IJ) and the trend itself should sustain as BKSL had made further
commitments with PPRO to co-develop other projects within the estate. Note that
PPRO specializes on middle-segment high rise developments, thus should add
more colour on BKSL’s buyer-segment portfolio (which is currently heavy on
middle-upper segment buyers).
Further supported by major infrastructure pipeline
BKSL is one of the few developers that are directly benefitted by the much antici-
pated upcoming Light Rail Train (LRT) public transportation where one of the
stations is within their Sentul City estate, further adding asset attractiveness to
both exiting residents as well as potential buyers. Key point is that with said LRT,
it not only adds transportation options, but should potentially reduce Jagorawi toll
road’s traffic flow thus adding convenience to both lower-middle segment buyers
(which actually utilizes said LRT) and middle-upper segment buyers that utilizes
Jagorawi toll road as their main mean of access.
Sentul City Tbk is a township devel-
oper which focuses middle-upper
segment landed residentials in
Greater Jakarta, with notable expo-
sure in Sentul, Bogor.
Sentul City The giant is on the move
BUY Rp170
Wisnu Budhiargo
Maria Gabriela Jacoub
Share Price Rp95
Sector Real Estate
Price Target Rp170 (79%)
Reuters Code BKSL.JK
Bloomberg Code BKSL.IJ
Issued Shares 34,537
Mkt Cap. (Rpbn) 3,281
Avg. Value Daily 6
Month (Rpbn) 19.6
52-Wk range 121 / 52
PT Citra Kharisma Komunika 34.33% PT Sakti Generasi Perdana 7.94%
EFG Bank AG, Singapore 6.53%
Public 51.20%
EPS 16F 17F
Consensus (Rp) 3 4
TRIM vs Cons. (%) -23.1% -7.0%
Company Update
Stock Data
Major Shareholders
Consensus
Stock Price
0.0
10.0
20.0
30.0
40.0
50.0
60.0
-
20
40
60
80
100
120
140
Nov-15 Jan-16 Mar-16 May-16 Jul-16 Sep-16
(Rpbn)Avg. 5 Day MA Trading Value (RHS)Year end Dec 2014 2015 2016F 2017F 2018F
Sales (Rp bn) 712 560 726 794 1,038
Net Profit (Rp bn) 28 50 69 146 155
EPS (Rp) 1 1 2 4 4
EPS Growth (%) -95% 62% 38% 113% 6%
DPS (Rp) 0 0 0 0 0
BVPS (Rp) 176 168 170 174 178
P/E (x) 107 66 48 22 21
Div Yield (%) 0% 0% 0% 0% 0%
Companies Data

PT Trimegah Securities Tbk - www.trimegah.com MARKET OUTLOOK 164
Capital History
Date
18-Jul-97 IPO@Rp500
29-Jul-99 14:5 Rights @ Rp500
01-Aug-06 Reverse Stock 4:1 A Series @500
01-Aug-06 Reverse Stock 4:1 B Series @100
09-Oct-06 Additional Share HMETD @100
05-Oct-09 Additional Share @100
29-Jan-10 Company Listing HMETD
03-Aug-10 Warrant Conversion
05-Aug-10 Warrant Conversion
06-Aug-10 Warrant Conversion
09-Aug-10 Warrant Conversion
10-Aug-10 Warrant Conversion
11-Aug-10 Warrant Conversion
19-Aug-11 Additional Share @100
29-Dec-15 Additional Share @50
Income Statement (Rpbn) Balance Sheet (Rpbn)
Cash Flow (Rpbn) Key Ratio Analysis
Capital History
Year end Dec 2014 2015 2016F 2017F 2018F
Revenue 712 560 726 794 1,038
Revenue Growth -26% -21% 30% 9% 31%
Gross Profit 324 230 345 478 583
EBIT 152 205 174 217 252
EBIT Growth (%) 389% 35% -15% 24% 16%
EBITDA 167 217 187 230 322
EBITDA Growth (%) 19% 7% -14% 23% 40%
Pretax income 39 62 83 163 173
Net income 28 50 69 146 155
Gross margin 46% 41% 47% 60% 56%
Net margin 4% 9% 9% 18% 15%
Year end Dec 2014 2015 2016F 2017F 2018F
Cash & equiv. 243 568 773 1,023 1,504
Inventories 1,936 2,091 2,201 2,184 2,410
Undeveloped land 4,660 5,675 5,675 5,675 5,675
Fixed Assets 190 178 165 152 140
Total Assets 9,987 11,146 11,899 12,534 13,238
Sales advances 0 0 0 156 156
Bank Loan 633 643 948 1,548 2,065
Bonds Payable 0 0 0 0 0
Total liabilities 3,738 4,596 5,281 5,770 6,319
Total equities 5,514 5,814 5,868 5,997 6,135
Year end Dec 2014 2015 2016F 2017F 2018F
Cash receipts 974 542 909 995 1,301
Cash payments -624 -597 -572 -475 -684
Tax paid -23 -86 -61 -41 -54
CF from op. -17 -114 -6 260 261
Capital expenditure -82 -41 -420 -420 0
Security invest-
ment / asset sale 4 0 0 0 0
Dividend received 0 0 0 0 0
CF from Inv. -78 -41 -420 -420 0
CF from financing -114 480 470 153 348
Net cash flow -209 325 205 250 481
Cash at BoY 452 243 568 773 1,023
Cash at EoY 243 568 773 1,023 1,504
Year end Dec 2014 2015 2016F 2017F 2018F
Gross Margin (%) 46% 41% 47% 60% 56%
Net Margin (%) 4% 9% 9% 18% 15%
EBITDA Margin (%) 23% 39% 26% 29% 31%
Core Net Margin (%) 12% 13% 8% 20% 22%
ROAE (%) 7% 0% 0% 1% 1%
Presales (Rp Bn) 1644 770 773 1003 1107
Chg in total debt -462 50 470 153 348
Gross D/E (x) 68% 79% 90% 96% 103%
Net D/E (x) 11% 11% 16% 26% 34%
Interim Result (Rpbn)
3Q15 4Q15 1Q16 2Q16 3Q16
Sales 116 162 143 109 226
Gross Profit 45 61 91 53 143
Operating Profit -36 259 52 38 97
Net Profit -55 179 21 35 53
Gross Margins (%) 38 38 64 49 63
Opr Margins (%) -31 160 36 35 43
Net Margins (%) -47 111 15 32 24

MARKET OUTLOOK PT Trimegah Securities Tbk - www.trimegah.com 165
Mega Manunggal Property Staying true to their words
Wisnu Budhiargo
Maria Gabriela
Phenomenal expansion growth rate; proven on track
Mega Manunggal Logistic Property builds and leases customized ware-
house to consumer companies and with limited competition, the possi-
bility of them being Indonesia’s largest logistic warehousing company is
wide open. They’re committed to expand their NLA to 500.000sm by
2020 (which is then being shortened to 2018 given their rapid expan-
sion), and had walked their talk as total NLA has reached 271.000sm as
of 3Q2016 (including the ones currently under construction), fulfilling
54%% of their initial target in just 1 year; which as result should boost
their EBIT by 73% as of end-2018.
Still a stable yet cash-rich business model
MMLP’s future warehouses are mostly built based on built-to-suit or-
ders, hence lowering the risk of holding non-performing properties. The
company also receives down payment from its tenant to help with land
acquisition as well as transition cost.
E-commerce business still promising, backed by prudent TPL
We think MMLP still serves as Indonesia’s e-commerce industry’s proxy
following Lazada’s long-term lease continuation (where they’ve commit-
ted to occupy ~60,000sm), which happens to be the world’s largest e-
commerce player, Alibaba, choice of Indonesian investment. Aside from
that, they’re still being supported by growing third party logistics (TPL)
which accounts for ~30% of their vast client base.
Upgrade MMLP to BUY with TP of IDR800 (22% upside)
We upgrade our rating on MMLP with a BUY and price target of RP 760,
implying 13% upside over DCF valuation method. We like MMLP as it
deserves a premium for its exceptionally rapid growth and demand
backlog. Note that we only assume 50k sqm of gross un-signed future
NLA in our model. In a bullish scenario of 100k sqm of un-signed future
NLA and land price appreciation assumption unchanged at 10% p.a.,
our NAV would rise to IDR 1,010/share.
MMLP is a rental warehouse developer,
focusing on long-term build-to-suit con-
tracts in Greater Jakarta
Share Price Rp670
Sector Property
Price Target Rp760 (13%)
BUY Rp760
Reuters Code MMLP.JK
Bloomberg Code MMLP.IJ
Issued Shares 5,714
Mkt Cap. (Rpbn) 3,829
Avg. Value Daily 6
Month (Rpbn) 2.7
52-Wk range 850 / 615
PT Mega Mandiri Properti 69.3%
Vasanta Investments LTD 5.8%
Sutedja Hungkang 0.7%
Nicholas The 0.0%
Core EPS 16F 17F
Consensus (Rp) 25 31
TRIM vs Cons. (%) -40.5% -33.2%
Company Update
Stock Data
Major Shareholders
Consensus
0.0
2.0
4.0
6.0
8.0
10.0
12.0
14.0
16.0
18.0
0
100
200
300
400
500
600
700
800
900
Nov-15 Jan-16 Mar-16 May-16 Jul-16 Sep-16
(Rpbn)Avg. 5 Day MA Trading Value (RHS)Series1
Stock Price
Year end Dec 2014 2015 2016F 2017F 2018F
Sales 142 163 168 232 282
EBITDA 115 123 124 178 221
Net Profit 286 114 85 119 152
EPS 382 20 15 21 0
Core Profit 49 82 85 119 152
Core EPS (Rp) - 14 15 21 27
Core EPS Growth (%) - - 0.0 0.4 0.3
DPS (Rp) 0 0 0 0 1
BVPS (Rp) 253 446 454 475 501
EV/EBITDA (x) - 38 37 25 23
Core P/E (x) - 47 45 32 27
Div Yield (%) - - - - -
Company Data

PT Trimegah Securities Tbk - www.trimegah.com MARKET OUTLOOK 166
Income Statement (Rpbn)
Year end Dec 2014 2015 2016F 2017F 2018F
Revenue 142 163 168 232 299 Revenue Growth (%) 13% 14% 2% 39% 29%
Gross Profit 129 147 150 210 272
Opr. Profit 114 122 120 175 230
EBITDA 8% 7% -1% 45% 32%
EBITDA Growth (%) 115 123 124 178 235
Net Int Inc/(Exp) -43 -24 -19 -32 -61
Gain/(loss) Forex -15 -29 0 0 0
Other Inc/(Exp) 253 62 0 0 0
Pre-tax Profit 309 131 102 143 170
Tax -14 -16 -17 -23 -30
Minority Int. 0 0 0 0 0
Extra. Items 0 0 1 2 3
Reported Net Profit 286 114 85 119 140
Core Net Profit 49 82 85 119 140
Growth (%) -447% 68% 4% 41% 17%
Dividend per share 0 0 1 2 3
growth (%) 0% 0% 100% 200% 300%
Dividend payout
ratio 0 0 1 2 3
Balance Sheet (Rpbn)
Cash Flow (Rpbn)
Year end Dec 2014 2015 2016F 2017F 2018F
Net Profit 49 82 85 119 140
Depr/Amort 1 1 4 4 4
Chg in Working Capital 13 -74 111 29 14
CF's from Oprs 70 76 199 152 158
Capex -52 -578 -324 -511 -479
Others -35 -56 0 0 0
CF's from investing -86 -635 -324 -511 -479
Net Change in Debt -24 -57 2 0 0
Others 24 57 -2 0 0
CF's from Financing 30 930 -38 0 0
Net Cash Flow 14 371 -163 -358 -320
Cash at BoY 6 11 382 219 -139
Cash at EoY 11 382 219 -139 -459
Free Cashflow 76 -529 -89 -303 -230
Key Ratio Analysis
Year end 31 Dec 2014 2015 2016F 2017F 2018F
Profitability
Gross Margin (%) 91% 90% 89% 90% 91%
Opr Margin (%) 81% 74% 72% 75% 77%
EBITDA Margin (%) 81% 75% 74% 77% 78%
Core Net Margin (%) 34% 50% 50% 51% 47%
ROAE (%) 11% 7% 5% 7% 7%
ROIC (%) 10% 6% 6% 7% 8%
Stability Current ratio (x) 0.6 3.0 2.6 -0.3 -2.1
Net Debt to Equity (x) 0.4 0.1 0.1 0.3 0.4
Net Debt to EBITDA
(x) 5.1 1.6 3.0 4.1 4.5
Interest Coverage (x) 2.6 2.3 2.4 3.5 4.7
Efficiency
A/P (days) 587 402 678 883 662
A/R (days) 31 25 23 23 25
Inventory (days) NA NA NA NA NA
Interim Result (Rpbn) Capital History
Date
29-Jun-15 IPO@Rp585
Year end Dec 2014 2015 2016F 2017F 2018F
Cash and equivalents 11 383 219 -139 -459
Other curr asset 71 136 82 87 92
Net fixed asset 2039 2402 2723 3229 3704
Other asset 17 284 284 284 284
Total asset 2139 3204 3307 3461 3620
ST debt 55 125 10 10 10
Other curr liab 82 51 107 142 161
LT debt 541 461 578 578 578
Other LT Liab 13 17 17 17 17
Total Liabilities 691 653 712 747 766
Minority interest 3 3 3 3 3
Shareholders Equity 1445 2548 2593 2712 2852
Gross debt 596 586 588 588 588
Net debt / (cash) 585 203 368 727 1047
Invested capital (adj.) 1191 1887 2097 2575 3035
Adjusted Equity (adj.) 606 1684 1729 1848 1988
3Q15 4Q15 1Q16 2Q16 3Q16
Sales 42 43 46 42 43
Gross Profit 38 39 39 39 39
Operating Profit 32 30 32 27 31
Net Profit 2 104 26 16 22
Gross Margins (%) 91 90 86 93 90
Opr Margins (%) 75 69 70 63 72
Net Margins (%) 5 240 56 39 52

MARKET OUTLOOK PT Trimegah Securities Tbk - www.trimegah.com 167
Bumi Serpong Damai
Wisnu Budhiargo
Maria Gabriela
Three reasons why we’re Neutral on BSDE
We re-initiate BSDE with a Neutral and IDR1,800,- TP (7% upside) on
the back of: 1) Marketing sales not as performing as well as initially
expected, 2) Large land bank reserve still remains favorable but not
requires longer time to monetize, and 3) New infrastructure is being laid
in BSDE’s favor.
Marketing sales performance is not exactly ideal
BSDE booked IDR4.1tn in marketing sales throughout 9M16. Not great,
but relatively good considering today’s property demand climate which
is still far from favorable. Note that BSDE has yet lowered their market-
ing sales target, which implies demand confidence. However, given that
the deficit itself amounts to ~IDR2.7tn (which is ~76% higher than Q3’s
achievement), we do not expect BSDE to be able to meet its target for
the year, instead we expect ~80% achievement.
Their landbank is the thing worth holding on to..
Being one of the early initiators of Serpong, BSDE controls massive
amount, if not the largest, of developable land in the area whilst the
immediate area itself being the hottest battle ground among Indonesia’s
listed property developers. BSDE controls 4.092ha of landbank in total,
where 56% is within BSD City development area. Historically, BSD City
is able to monetize an average of 50Ha of land per year, with ASP
growth at 7-10%. This should translate to a potential recurring develop-
ment sales of ~IDR3tn per year for ~30 years to come from BSD City
alone.
..and is being further strengthened by upcoming infras
Given that property-landbank monetization highly requires adequate
infrastructure, BSDE is being highly benefitted by their recent success
over Serpong-Balaraja tollroad which grants yet another direct access to
their massive 2.300Ha landbank (making BSDE a company with not only
large amount of asset, but quality asset that is relatively easy to dispose
and then translate to less discounted NAV).
Valuation
TP is derived using SOTP; estimated market price for both developed
and idle landbanks, and net income capitalization for their investment
properties. Currently trades at 67% discount and 10x 2017 PE.
PT Bumi Serpong Damai Tbk develops real es-
tate including housing infrastructure, commer-
cial and industrial estates, golf courses, and
public facilities.
Share Price Rp1,680
Sector Real Estate
Price Target Rp1,800(7%)
NEUTRAL Rp1,800
Reuters Code BSDE.JK
Bloomberg Code BSDE.IJ
Issued Shares 19,247
Mkt Cap. (Rpbn) 32,334
Avg. Value Daily 6
Month (Rpbn) 69.5
52-Wk range 2380 / 1580
Paraga Artamida 26.6%
Ekacentra Usahamaju 25.0%
Serasi Niaga Sakti 3.1% Metropolitan Transcities
Indonesia 1.3%
Public 38.9%
Core EPS 16F 17F
Consensus (Rp) 112 135
TRIM vs Cons. (%) 59.6% 13.6%
Close, but no cigar
Company Update
Stock Data
Major Shareholders
Consensus
Stock Price
0.0
20.0
40.0
60.0
80.0
100.0
120.0
140.0
160.0
180.0
200.0
0
500
1000
1500
2000
2500
Nov-15 Jan-16 Mar-16 May-16 Jul-16 Sep-16
(Rpbn)Avg. 5 Day MA Trading Value (RHS)Series1
Company Data
Year end Dec 2014 2015 2016F 2017F 2018F
Sales 5,614 6,210 7,898 7,449 7,101
EBITDA 2,781 3,030 4,386 3,974 3,668
Net Profit 3,818 2,140 3,129 2,690 2,531
EPS 218 122 163 140 131
DPS (Rp) 55 31 41 35 33
BVPS (Rp) 877 1,077 1,211 1,327 1,435
P/E (x) 8 14 10 12 13

PT Trimegah Securities Tbk - www.trimegah.com MARKET OUTLOOK 168
NAV—Still remain as one of the largest landbank holder
We estimate BSDE’s RNAV to be at IDR78tn or IDR4.354,- per share implying 59% discount to NAV towards cur-
rent price. BSDE’s largest NAV contributor is still being held by BSD City, in which accounts for 80% (for both
phase II and III landbank). BSDE’s investment properties are being valued through capitalization method in
which we apply 12% capitalization rate and accounts for 5% of BSDE’s NAV. Our target price implies 55% dis-
count to RNAV (NAV-after cash and debts).
Marketing Sales—Not quite there yet
BSDE had achieved 60% of their 2016 marketing sales throughout 9M16, and we expect their marketing sales to
achieve IDR5.6tn by the end of the year following the launches in Simatupang, Jagir as well as the existing in-
ventory sales from Element Rasuna (which each should be able to generate IDR248bn, IDR256bn and IDR526bn,
respectively by end-2016 if all projects meet their allotted target). We expect BSDE’s 2017 marketing sales to
reach IDR5.9tn, implying 7% YoY growth over 2016’s estimated achievement. In terms of marketing sales per-
formance, BSDE’s still at the front line; SMRA at 49% pre-revised 2016 target as per 9M16, ASRI at 58%, whilst
CTRA’s leading at 62% achievement.
2015 1Q16 2Q16 3Q16 9M16
Landed Houses 4,357 816 533 1,230 2,579
Land Plots 609 98 293 0 391
Strata Apartments 655 97 373 110 581
Industrial 22 14 4 0 17
Shophouses 1,114 179 125 228 533
Land Plots—JV 0 0 0 0 0
Total 6,757 1,204 1,329 1,568 4,101
Area (m2) Market Value Develop Cost Marketing
Fee NAV
Landbank 40,720,329 96,355 12,927 4,818 71,676
High Rise inventory 250,559 5,830 2,394 291 2,888
Recurring Income 3,825
TOTAL NAV (IDR bn) 78,389
After Cash-Debt RNAV (IDR bn) 76,175
RNAV/ Share (IDR) IDR 4,354
Target Price IDR 1,950
Discount to NAV 55%
Source: Trimegah Research
Source: Trimegah Research
Figure 85. Forecast changes

PT Trimegah Securities Tbk - www.trimegah.com MARKET OUTLOOK 169
Income Statement (Rpbn)
Year end Dec 2014 2015 2016F 2017F 2018F
Revenue 5,614 6,210 7,898 7,449 7,101
% growth -2 11 27 -6 -5
Gross Profit 4,167 4,638 6,093 5,767 5,517
Opr Profit 2,664 2,901 4,311 3,898 3,592
EBITDA 2,781 3,030 4,386 3,974 3,668
% growth -7 9 45 -9 -8
Net Int Inc/(Exp) -107 -324 -244 -314 -210
Gain/(loss) Forex 30 139 0 0 0
Other Inc/(Exp) 1,717 0 -35 -35 -35
Pre-tax Profit 4,304 2,715 4,032 3,549 3,346
Tax -310 -364 -454 -429 -408
Extra. Items 0 0 0 0 0
Net Profit 3,818 2,140 3,129 2,690 2,531
% growth 42 -44 46 -14 -6
Balance Sheet (Rpbn)
Year end Dec 2014 2015 2016F 2017F 2018F
Cash and Deposits 2,820 6,109 4,241 3,732 3,472
Inventory 6,548 6,548 4,193 3,993 4,056
Other Current Assets 5,350 7,040 9,485 7,287 6,986
Undevelopment Land 8,038 8,594 11,450 15,530 16,597
Net Fixed Assets 607 803 1,056 1,180 1,304
Investment Properties 2,715 3,278 2,747 2,716 2,686
Other Noncurrent Assets 2,128 3,650 3,655 3,655 3,655
Total Assets 28,207 36,022 36,828 38,093 38,756
ST Debt 1,506 1,989 377 377 377
Other Current Liabilities 348 534 255 262 265
Other LT Liabs 5,161 5,641 4,963 4,558 4,738
Minority Interest 3,091 3,247 3,701 4,130 4,538
Total Liabilities 9,767 13,925 11,931 10,750 9,106
Shareholder's Equity 15,349 18,850 21,196 23,213 25,111
Net Debt/(Cash) 1,437 1,641 2,472 2,198 632
Net Working capital 12,864 17,174 17,287 14,372 13,872
Cash Flow (Rpbn)
Year end Dec 2014 2015 2016F 2017F 2018F
Net Profit 3,818 2,140 3,129 2,690 2,531
Depr/Amort 117 130 76 76 76
Others - - - - -
Chg in Opr Ass&Liab -5,496 -2,546 -1,053 2,001 420
CF's from Oprs -1,561 -277 2,151 4,766 3,026
Capex -1,289 -1,444 -2,654 -4,249 -1,235
Others - - - - -
CF's from Investing -1,390 -1,288 -2,200 -3,820 -827
Net Change in Debt 164 3,493 -1,037 -783 -1,827
Others - - - - -
CF's from Financing 1,474 4,854 -1,819 -1,455 -2,459
Net Cash Flow -1,477 3,289 -1,868 -509 -260
Cash at BoY 4,297 2,820 6,109 4,241 3,732
Cash at EoY 2,820 6,109 4,241 3,732 3,472
Free Cashflow -2,999 -2,010 -934 146 1,367
Key Ratio Analysis
Year end Dec 2014 2015 2016F 2017F 2018F
Profitability
Gross Margins (%) 74 75 77 77 78
Op Margins (%) 47 47 55 52 51
EBITDA Margins (%) 50 49 56 53 52
Net Margins (%) 68 34 40 36 36
ROA (%) 42 17 18 13 11
ROE (%) 19 8 10 7 7
Stability
Current Ratio (x) 7.9 7.8 28.4 23.5 22.6
Net Debt/Equity (x) 0.1 0.1 0.1 0.1 0.0
Int Coverage (x) -14.0 -7.9 -7.6 0.0 0.0
Efficiency
A/P days 10 10 10 10 10
A/R days 8 8 8 8 8
Inventory Days 1,088 1,343 1,324 1,165 943
Interim Result (Rpbn) Capital History
Date
06-Jun-08 IPO @ IDR550
20-Dec-10 Additional Share HMETD
16-May-14 Additional Listing without Right Issue
14-April-15 Additional Share HMETD
3Q15 4Q15 1Q16 2Q16 3Q16
Sales 1,291 614 843 1,766 1,383
Gross Profit 973 386 548 1,289 1,034
Operating Profit 490 292 485 820 522
Net Profit 314 624 527 563 336
Gross Margins (%) 75 62 65 73 74
Opr Margins (%) 38 47 57 46 37
Net Margins (%) 24 101 62 31 24

MARKET OUTLOOK PT Trimegah Securities Tbk - www.trimegah.com 170
Summarecon Agung
Wisnu Budhiargo
Maria Gabriela
Three reasons why we are neutral on SMRA
We re-initiate SMRA with a Sell and IDR1,330,- TP (2.2% downside) on
the back of: 1) Far from ideal marketing sales performance, 2) Minority
interest still dominates bottom-line portion, and 3) Sold good’s tight
margin.
Satellite-area sales has yet fully rebounded
10M16 marketing sales was at 69% post-revision achievement, which is
still far from ideal as it reflects 22% lag in YoY sales achievement.
Serpong, their main sales arsenal, is still at 76% achievement despite
being at the 10th month with no major new launches in sight. Bandung
and Kerawang, on the other hand, shows promise following their sold
out streak, and with new cluster launches ahead should be able to meet
their area-specific targets.
Supplies are being sold at an unfavorable margin
Both Bandung and Bekasi acts a double-edged blade to SMRA, as both
despite selling well, is being sold at an unfavorable margin (of approxi-
mately 30-35%, which is relatively low as to compared to typical landed
residential unit’s margin of ~50%). It should be noted that both are new
projects with 5-10 years development horizon, as thus, early marketing
sales will not be at their optimum ASP. Bandung, specifically, has to
bear worse margin and revenue booking given its moist soil condition
(which then costs more and take longer to develop).
Results should still be on the lower-end
We do not expect their high minority interest-ridden earnings to end its
streak until 2018 given that 2014-2016’s sales were mostly derived
from JV-related projects. As a result, net margin would still be at the
lower-end of the curve, whereas we expect to be at 2% by FY2016.
Valuation
Our TP is derived using SOTP where we use estimated developed land-
bank’s market price and DCF for their investment properties (see p.3 for
valuation details). SMRA currently trades at 63% discount and 86x 2017
PE.
PT Summarecon Agung Tbk and its subsidiaries
develop and invest in real estate. The Compa-
ny develops and operates residential houses,
apartments, shopping centers, recreational
centers and office buildings.
Share Price Rp1,360
Sector Real Estate
Price Target Rp1.330 (-2.2%)
NEUTRAL Rp1,330
Reuters Code SMRA.JK
Bloomberg Code SMRA.IJ
Issued Shares 14,427
Mkt Cap. (Rpbn) 19,620
Avg. Value Daily 6
Month (Rpbn) 47.0
52-Wk range 1970 / 1225
Harto Djojo Nagaria 0.3%
PT. Semarop Agung 25.4% PT. Sinamegah Jayasentosa 6.6%
BNYMSNAV RE AMS Pool 5.6% Public 62.1%
Core EPS 16F 17F
Consensus (Rp) 32 44
TRIM vs Cons. (%) -71.6% -63.6%
Still a long way to go
Company Update
Stock Data
Major Shareholders
Consensus
Stock Price
0.0
20.0
40.0
60.0
80.0
100.0
120.0
0
500
1000
1500
2000
2500
Nov-15 Jan-16 Mar-16 May-16 Jul-16 Sep-16 Nov-16
(Rpbn)Avg. 5 Day MA Trading Value (RHS)Series1
Company Data
Year end Dec 2014 2015 2016F 2017F 2018F
Sales 5,757 5,624 5,017 5,146 4,240
Net Profit 1,385 855 131 225 183
EPS 96 59 9 16 13
EPS Growth (%) -37 -38 -85 72 -19
DPS (Rp) 58 18 3 5 4
BVPS (Rp) 889 522 514 510 516
P/E (x) 14 23 148 87 106
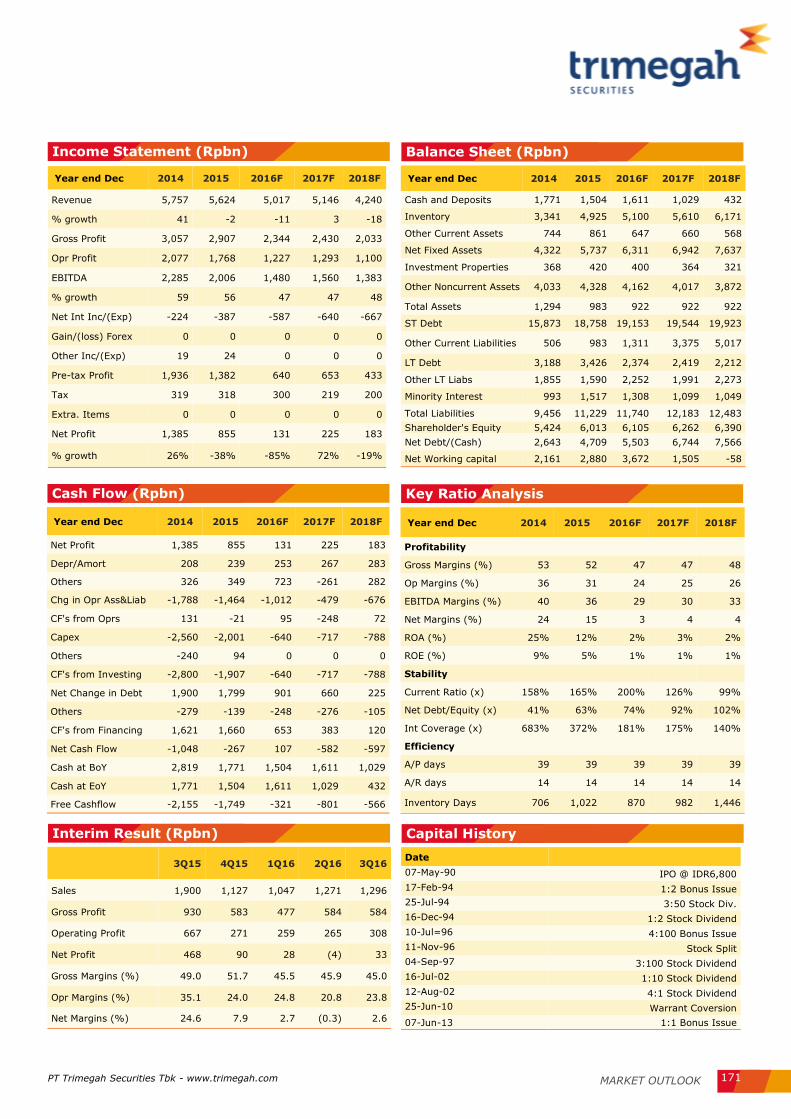
PT Trimegah Securities Tbk - www.trimegah.com MARKET OUTLOOK 171
Income Statement (Rpbn)
Year end Dec 2014 2015 2016F 2017F 2018F
Revenue 5,757 5,624 5,017 5,146 4,240
% growth 41 -2 -11 3 -18
Gross Profit 3,057 2,907 2,344 2,430 2,033
Opr Profit 2,077 1,768 1,227 1,293 1,100
EBITDA 2,285 2,006 1,480 1,560 1,383
% growth 59 56 47 47 48
Net Int Inc/(Exp) -224 -387 -587 -640 -667
Gain/(loss) Forex 0 0 0 0 0
Other Inc/(Exp) 19 24 0 0 0
Pre-tax Profit 1,936 1,382 640 653 433
Tax 319 318 300 219 200
Extra. Items 0 0 0 0 0
Net Profit 1,385 855 131 225 183
% growth 26% -38% -85% 72% -19%
Balance Sheet (Rpbn)
Year end Dec 2014 2015 2016F 2017F 2018F
Cash and Deposits 1,771 1,504 1,611 1,029 432
Inventory 3,341 4,925 5,100 5,610 6,171
Other Current Assets 744 861 647 660 568
Net Fixed Assets 4,322 5,737 6,311 6,942 7,637
Investment Properties 368 420 400 364 321
Other Noncurrent Assets 4,033 4,328 4,162 4,017 3,872
Total Assets 1,294 983 922 922 922
ST Debt 15,873 18,758 19,153 19,544 19,923
Other Current Liabilities 506 983 1,311 3,375 5,017
LT Debt 3,188 3,426 2,374 2,419 2,212
Other LT Liabs 1,855 1,590 2,252 1,991 2,273
Minority Interest 993 1,517 1,308 1,099 1,049
Total Liabilities 9,456 11,229 11,740 12,183 12,483
Shareholder's Equity 5,424 6,013 6,105 6,262 6,390
Net Debt/(Cash) 2,643 4,709 5,503 6,744 7,566
Net Working capital 2,161 2,880 3,672 1,505 -58
Cash Flow (Rpbn)
Year end Dec 2014 2015 2016F 2017F 2018F
Net Profit 1,385 855 131 225 183
Depr/Amort 208 239 253 267 283
Others 326 349 723 -261 282
Chg in Opr Ass&Liab -1,788 -1,464 -1,012 -479 -676
CF's from Oprs 131 -21 95 -248 72
Capex -2,560 -2,001 -640 -717 -788
Others -240 94 0 0 0
CF's from Investing -2,800 -1,907 -640 -717 -788
Net Change in Debt 1,900 1,799 901 660 225
Others -279 -139 -248 -276 -105
CF's from Financing 1,621 1,660 653 383 120
Net Cash Flow -1,048 -267 107 -582 -597
Cash at BoY 2,819 1,771 1,504 1,611 1,029
Cash at EoY 1,771 1,504 1,611 1,029 432
Free Cashflow -2,155 -1,749 -321 -801 -566
Key Ratio Analysis
Year end Dec 2014 2015 2016F 2017F 2018F
Profitability
Gross Margins (%) 53 52 47 47 48
Op Margins (%) 36 31 24 25 26
EBITDA Margins (%) 40 36 29 30 33
Net Margins (%) 24 15 3 4 4
ROA (%) 25% 12% 2% 3% 2%
ROE (%) 9% 5% 1% 1% 1%
Stability
Current Ratio (x) 158% 165% 200% 126% 99%
Net Debt/Equity (x) 41% 63% 74% 92% 102%
Int Coverage (x) 683% 372% 181% 175% 140%
Efficiency
A/P days 39 39 39 39 39
A/R days 14 14 14 14 14
Inventory Days 706 1,022 870 982 1,446
Interim Result (Rpbn)
3Q15 4Q15 1Q16 2Q16 3Q16
Sales 1,900 1,127 1,047 1,271 1,296
Gross Profit 930 583 477 584 584
Operating Profit 667 271 259 265 308
Net Profit 468 90 28 (4) 33
Gross Margins (%) 49.0 51.7 45.5 45.9 45.0
Opr Margins (%) 35.1 24.0 24.8 20.8 23.8
Net Margins (%) 24.6 7.9 2.7 (0.3) 2.6
Capital History
Date
07-May-90 IPO @ IDR6,800
17-Feb-94 1:2 Bonus Issue
25-Jul-94 3:50 Stock Div.
16-Dec-94 1:2 Stock Dividend
10-Jul=96 4:100 Bonus Issue
11-Nov-96 Stock Split
04-Sep-97 3:100 Stock Dividend
16-Jul-02 1:10 Stock Dividend
12-Aug-02 4:1 Stock Dividend
25-Jun-10 Warrant Coversion
07-Jun-13 1:1 Bonus Issue
PT Trimegah Securities Tbk - www.trimegah.com MARKET OUTLOOK 172
Cement Sector

MARKET OUTLOOK PT Trimegah Securities Tbk - www.trimegah.com 173
Downgrade sector to neutral
We downgrade our cement sector call to Neutral, on the back of: 1)
potential demand growth slowdown, 2) delayed Rembang plant and
INTP’s plummeting ASP, 3) significant coal price increase.
Capacity growth still outpacing demand growth
We decided to slightly revise down our FY17 domestic cement sales to
66m tonne (previous: 70mn), while also revising down our capacity
forecast to 102mn tonne (previous: 105mn), implying 36mn tonne
oversupply. Slower expected demand growth is largely due to lacklustre
property marketing sales growth. Despite better outlook from infrastruc-
ture, demand growth is still dominated by bag sales (mostly from prop-
erty). Consequently, we expect ASP to still decline, albeit at a much
slower rate.
Hurdles on big players
Both SMGR and INTP have had setbacks that might be detrimental to
their FY17 performance. Rembang plant potential delay would cause
significant loss of potential revenue as well as market share. Similarly,
INTP’s major ASP drop—due to underperforming demand growth in its
home market—would lead to a decline in both top and bottom line.
Rising coal price
Substantial increase in coal price would have adverse effects on cement
industry, as coal is a significant cost component in cement manufactur-
ing process. However, recent tighter competition landscape has forced
cement players to be more cost-efficient. Thus, we expect the compa-
nies’ cost-efficiency measures to slightly offset the negative impacts
from rising coal price.
SMGR remains as top pick
We maintain our buy call on SMGR with TP of 11,300 (30.3% upside), as
we believe regions in which SMGR holds the largest market share—i.e.
outside Java—will outperform in terms of demand growth. Despite this,
SMGR still has undemanding valuation, and currently trades at an at-
tractive 12.4x 2017F PE, still at 24% discount to INTP’s 15.4x 2017F PE.
Downside risk to our call
Downside risks: 1) Further prolonged cement ASP, 2) big players losing
more market share, 3) Further sluggish property demand resulting in
slower volume growth, 4) Further significant increase in coal and energy
price.
2017F P/E
SMGR 12.5
INTP 15.4
Rec.
TP Sh.Pr. Ups/dw EPS Growth (%) PE (x) EV/EBITDA (x) Div. yield (%)
(Rp/sh) (Rp/sh) (%) 2016 2017 2016 2017 2016 2017 2016 2017
SMGR Buy 11,300 8,675 30.3% -9.1 0.7 12.5 12.4 7.3 7.5 3.5 3.2
INTP Neutral 16,400 15,350 6.8% -11.8 -7.5 14.2 15.4 8.1 7.0 5.6 5.2
Cement Sector Tighter competitive landscape
Companies Data
Billy Theodorus
Neutral

PT Trimegah Securities Tbk - www.trimegah.com MARKET OUTLOOK 174
Figure 86. Domestic Sales, Capacity, and Utilisation Trend
Source: ASI, TRIM Research
Our decision to revise down our 2017 sales target is based on our expectation of slower overall demand growth
in 2017, mainly due to lower expectation of property sector’s marketing sales achievement this year—in general,
there is a one year lag between marketing sales and actual construction of the properties—which led to lower
expected demand for cement from property sector in 2017. This will be explained further in the next page.
Modest growth accompanied by low utilisation ahead
As mentioned in our previous cement sector report, we still expect the domestic cement supply-demand imbal-
ance to linger in 2017. This can be seen by the growth in design capacity outpacing the growth in domestic con-
sumption (sales), shown by higher 2010-17F design capacity CAGR at 8.5% (vs. 5.3% for consumption). None-
theless, we decided to slightly revise down our forecast for 2017 domestic cement sales to 66m (previous:
70mn) tons, implying 4.5% YoY growth—we also revise down our 2016 target to 63m (previous: 64m) tons, im-
plying 3.5% YoY growth, due to slightly lower than expected 10M16 domestic sales so far at 52m tons. Likewise,
we also reduce our expectation of annual design capacity for 2017 to 102mn tons (previous: 105mn) due to pro-
jected delay in SMGR’s Rembang plant operation date, thus implying 65% utilisation rate (see Figure 86).
Figure 87. Quarterly ASP trend
Source: Companies, TRIM Research
800
850
900
950
1,000
1,050
1Q142Q143Q144Q141Q152Q153Q154Q151Q162Q163Q16
ID
R '0
00
/to
n
SMGR INTP
-15.0%
-10.0%
-5.0%
0.0%
5.0%
10.0%
800
850
900
950
1,000
1,050
2014 2015 2016F 2017F 2018F
ID
R '
00
0/
ton
SMGR INTP
SMGR % Change (RHS) INTP % Change (RHS)
Figure 88. Annual ASP of SMGR and INTP
Figure 87 shows that cement ASP (we use SMGR and INTP as price benchmark) have constantly been in declining
trend since reaching its peak in 4Q14, with INTP being the most aggressive in its price cut (9.4% decline YTD vs.
SMGR’s 2.3%). We believe the growing gap between the two companies’ declining ASP can largely be attributed
to the significant decline in domestic consumption in Jakarta, Banten, and West Java area—which can be consid-
ered as INTP’s home market—as well as growing number of new entrants in the region.
44
49
5559 60 61
6366
53 57
61
66
74 75
93
102
50%
55%
60%
65%
70%
75%
80%
85%
90%
95%
-
20
40
60
80
100
120
2010 2011 2012 2013 2014 2015 2016F 2017F
(mn tons)Total domestic cement sales volume Design Capacity Utilisation
Growth in de-
mand is out-
paced by growth
in capacity, cre-
ating low utili-
sation environ-
ment.

PT Trimegah Securities Tbk - www.trimegah.com MARKET OUTLOOK 175
On a more general note, we believe the significant decline in overall cement ASP was caused by the sudden jump
in cement oversupply in 2016 (an 110% YoY increase to 29mn ton). In 2017, however, we expect the oversupply
would still increase, but at much lower rate (22% YoY increase to 36mn ton). Moreover, we also believe cement
players would start to adapt and consolidate their market share, which will lead to cement players being less ag-
gressive in their price war. Therefore, as can be seen in Figure 88, we still expect an overall decline in ASP in
2017, albeit in much lower rate compared to 2016. Additionally, we also expect INTP would have a prolonged
period of ASP decline due to expected sluggish growth in cement consumption in its home market.
Demand growth potential
We believe the main drivers for domestic cement demand are derived from infrastructure and property sectors.
From infrastructure side, we believe there is a sound upside potential for cement demand from growing govern-
ment’s infrastructure spending. As can be seen in Figure 89, the trend shows growing allocation of infrastructure
budget relative to GDP, almost doubling from 1.7% of GDP in 2014 to 3.0% in 2017F (assuming 5.1% GDP
growth in 2017). Consequently, infrastructure contribution to cement sales—indicated by bulk sales—shows a
stable growth, from 18.5% in 10M11 to 24.1% in 10M16 (see Figure 90). We believe this trend is likely to contin-
ue in the coming years, provided the government remains committed to its infrastructure development plans.
Figure 89. Infrastructure Budget as % of
Source: BPS, ASI
Figure 90. Cement Sales Breakdown
86114.2
145.5
184.3 177.9
290.3317.1
387.3
1.0%
1.5%
2.0%
2.5%
3.0%
3.5%
0
50
100
150
200
250
300
350
400
450
2010 2011 2012 2013 2014 2015 2016F 2017F
ID
R t
n
Infrastructure Budget (LHS) % of GDP (RHS)
81.5% 80.8% 78.9% 78.4% 76.5% 75.9%
18.5% 19.2% 21.1% 21.6% 23.5% 24.1%
60%
65%
70%
75%
80%
85%
90%
95%
100%
10M11 10M12 10M13 10M14 10M15 10M16
Bag Bulk
Property sector, on the other hand, presents less favourable outlook for demand growth in 2017. 2016 Marketing
sales, both realised and expected, have been lacklustre (see property sector section for details), with many com-
panies still falling short of this year’s target. In consequence, we believe this would translate into unsatisfactory
demand growth from property.
Moreover, the sluggish property situation is also exacerbated by expected 7DRR hike in 2017F—thus, also mort-
gage rate hike—due to high possibility of Fed Fund Rate hike in the course of 2017. Our data shows that cement
domestic sales from 2010-9M16 is negatively correlated (-0.7, to be precise) with BI rate (we use BI rate as a
proxy for mortgage rate). Thus, assuming higher interest rate environment in 2017, we expect this would trans-
late into slower growth in cement demand.
Summing it up
Despite positive outlook from infrastructure side, it should be noted that bulk sales still only composes less than
25% of cement revenue. Therefore, we decided to revise down our 2017F cement consumption growth to 4.5%
(previous: 9.9%), as we expect the negative impact from sluggish property sector would outweigh the more
cheerful tone of infrastructure sector.

PT Trimegah Securities Tbk - www.trimegah.com MARKET OUTLOOK 176
Rising coal price vs. cost-efficiency
The recent sudden rise in coal price has raised some concerns on its impact on cement companies’ costs. Our
estimate of 2017F average coal price has been revised up 21% to USD75/ton. Coal is quite an essential factor in
cement industry’s costs, as most plants use coal for some of their power sources. In fact, coal composes ~16-
20% of SMGR and INTP’s COGS.
In response, the industry would be forced to implement even stricter cost-efficiency to retain their margins. For
example, INTP’s management has stated that their new plant (P14) is able to use cheaper low calorific value
(CV) coal. Similarly, SMGR also has built a Waste Heat Recovery Power Generator in Padang, West Sumatra and
is building another one in Tuban, East Java. These power generator would be able to convert hot gases produced
from cement manufacture into energy, allowing more operating efficiency. In addition, the companies can also
buy cheaper coal from smaller mines.
Therefore, one of the key themes in 2017 cement sector who can be the most cost-efficient in order to offset the
impact of rising costs from coal.
Big players to retain their market share
As shown in Figure 91, the big players (SMGR and INTP) have been gradually losing market share since 2014,
largely due to foreign cement companies (e.g. Anhui Conch, Siam Cement Group) entering the sector. We expect
the big players to still lose some market share in FY16, before starting to retain—if not regain—some market
share in FY17.
We expect INTP to slightly gain market share to 26.7%, due to additional 4.4mn annual capacity from the newly
commissioned P14 plant. SMGR, on the other hand, is expected to slightly lose market share to 41.7%, due to
the expected delay of Rembang plant. Overall however, we expect the combined market share of the big players
to slightly rise to 68.4% (vs. 2016F’s 67.8%).
Figure 91. Market Share Trend
Source: ASI, TRIM Research
38.7%46.5%
40.4% 39.8% 40.7% 43.4% 43.5% 43.2% 42.4% 41.7%
28.0%
30.2%
28.8% 30.7% 31.9% 30.1% 30.2% 27.4% 25.4% 26.7%
33.3%23.3%
30.8% 29.4% 27.3% 26.5% 26.3% 29.4% 32.2% 31.6%
0%
10%
20%
30%
40%
50%
60%
70%
80%
90%
100%
2008 2009 2010 2011 2012 2013 2014 2015 2016F 2017F
SMGR Market Share INTP Market Share Others
Expect the big play-
ers (SMGR and INTP)
to hold their market
share in FY17, alt-
hough SMGR will
slightly lose its mar-
ket share in FY17
due to Rembang
Plant delay.

MARKET OUTLOOK PT Trimegah Securities Tbk - www.trimegah.com 177
Maintain Buy call—revise TP to Rp11,300
We maintain our Buy call on SMGR, but with revised TP of Rp11,300
(previous: Rp12,100) on the back of: 1) SMGR’s superior market share
in region with outperforming demand growth, 2) undemanding valua-
tion. Downside risk to our call includes total shutdown of Rembang
plant, prolonged decline of cement price, more foreign players entering
cement market, significant rise in energy and coal price, as well as un-
stable IDR.
Overall better market share in outperforming regions
As mentioned in our previous cement sector report (published on Octo-
ber 4, 2016), we expect gradual growth of sales contribution from out-
side Java region. This is already apparent in 10M16 cement industry
sales geographical breakdown, with outside Java region logging in 4.7%
YoY growth (vs. –1.1% YoY in Java, and –7.4% YoY in Western Java!).
Outside Java, SMGR has the largest market share at 46.3% (vs. INTP at
16.2%). As we believe outside Java region will keep on delivering supe-
rior demand growth, this will translate into better revenue and thus
earnings growth in years ahead.
Compelling value in Semen Gresik
Although the uncertainty in Rembang plant situation seems like a valid
reason for cheaper valuation, we believe SMGR’s share price has been
over-punished in 2016YTD. SMGR’s share price has declined 24%, and
underperforming JCI by 35%. Considering our TP has taken into account
the loss of 2017F potential earnings from Rembang plant delay, this
leaves an ample 30% upside.
Valuation: TP Rp11,300, 30.3% upside, Buy
We decrease our TP to Rp11,300, and change our valuation method to
PE multiples only (previous: combination of DCF and PE). We derived
our TP from 5-year average Forward PE of 16.2x, similar with INTP’s
16.4x. Currently, SMGR trades at 12.4x 2017F PE, implying 24% dis-
count to INTP at 15.4x, despite 5-year average of only 2% discount.
Year end Dec 2014 2015 2016F 2017F 2018F
Sales (Rpbn) 26,987 26,948 26,062 26,640 31,081
Net Profit (Rpbn) 5,560 4,521 4,112 4,140 4,943
EPS (Rp) 937 762 693 698 833
EPS Growth (%) 3.5 -18.7 -9.1 0.7 19.4
DPS (Rp) 407 375 306 279 333
BVPS (Rp) 4,054 4,454 4,772 5,164 5,720
EV/EBITDA (x) 6.3 6.3 7.3 7.5 7.0
P/E (x) 9.3 11.4 12.5 12.4 10.4
Div Yield (%) 4.7 4.3 3.5 3.2 3.8
Semen Indonesia Staying strong in the face of a storm
Billy Theodorus
Companies Data
PT Semen Gresik (Persero) Tbk manu-factures cement including portland ce-ment, oil well cement, and mixed ce-ment. Through its subsidiaries, the Company also develops and operates an industrial estate, mines limestone and clay, and packages and istributes cement.
Share Price Rp8,675
Sector Cement
Price Target Rp11,300 (30.3%)
Buy Rp11,300
Reuters Code SMGR.JK
Bloomberg Code SMGR.IJ
Issued Shares 5,932
Mkt Cap. (Rpbn) 51,456
Avg. Value Daily 6
Month (Rpbn) 102.5
52-Wk range 11875 / 8050
Republic of Indonesia 51.0%
Public 49.0%
EPS 16F 17F
Consensus (Rp) 691 720
TRIM vs Cons. (%) 0.3% -3.2%
Company Update
Stock Data
Major Shareholders
Consensus
Stock Price
0.0
50.0
100.0
150.0
200.0
250.0
300.0
350.0
0
2000
4000
6000
8000
10000
12000
14000
Nov-15 Jan-16 Mar-16 May-16 Jul-16 Sep-16
(Rpbn)Avg. 5 Day MA Trading Value (RHS)Series1

PT Trimegah Securities Tbk - www.trimegah.com MARKET OUTLOOK 178
Income Statement (Rpbn)
Year end Dec 2014 2015 2016F 2017F 2018F
Revenue 26,987 26,948 26,062 26,640 31,081
Revenue Growth (%) 10 0 -3 2 17
Gross Profit 11,579 10,646 10,078 10,169 11,917
Opr. Profit 6,947 5,899 5,374 5,498 6,530
EBITDA 8,210 7,326 7,000 7,244 8,386
EBITDA Growth (%) 2 -11 -4 3 16
Net Int Inc/(Exp) -97 -129 -196 -344 -306
Gain/(loss) Forex 0 0 0 0 0
Other Inc/(Exp) 227 80 142 143 164
Pre-tax Profit 7,077 5,851 5,319 5,298 6,388
Tax -1,510 -1,325 -1,186 -1,139 -1,425
Minority Int. -8 -4 -21 -19 -21
Extra. Items 0 0 0 0 0
Reported Net Profit 5,560 4,521 4,112 4,140 4,943
Core Net Profit 5,560 4,521 4,112 4,140 4,943
growth (%) 4 -19 -9 1 19
Dividend per share 407 375 306 279 333
growth (%) 11 -8 -18 -9 19
Dividend payout ratio 43 49 44 40 40
Balance Sheet (Rpbn)
Year end Dec 2014 2015 2016F 2017F 2018F
Cash and eq. 5,032 3,992 2,360 3,993 6,626
Other curr asset 6,617 6,547 6,438 6,670 7,649
Net fixed asset 20,221 25,168 27,542 28,796 29,690
Other asset 2,462 2,447 1,833 1,916 2,050
Total asset 34,332 38,153 38,173 41,374 46,014
ST debt 598 846 640 731 772
Other curr liab 4,674 5,754 4,034 4,282 5,018
LT debt 3,798 3,809 3,985 4,276 4,771
Other LT Liab 257 304 91 94 105
Minority interest 958 1,021 1,117 1,360 1,420
Total Liabilities 9,327 10,712 8,750 9,383 10,666
Shareholders Eq. 24,046 26,420 28,305 30,631 33,928
Net (debt) / cash -636 663 2,264 1,014 -1,083
Total cap employed 28,442 31,074 32,930 35,638 39,471
Net Working capital 6,377 3,940 4,125 5,650 8,485
Debt 4,396 4,655 4,625 5,007 5,543
Cash Flow (Rpbn)
Year end Dec 2014 2015 2016F 2017F 2018F
Core Net Profit 5,560 4,521 4,112 4,140 4,943
Depr / Amort 1,263 1,427 1,626 1,746 1,856
Chg in Working Cap -559 959 -776 24 -236
CF's from oprs 6,263 6,908 4,962 5,909 6,563
Capex -1,323 -5,054 -2,444 -1,306 -942
Others -1,749 -1,283 -928 -1,784 -1,949
CF's from investing -3,072 -6,337 -3,372 -3,091 -2,891
Net change in debt -49 259 58 59 -14
Others -2,323 -1,870 -3,280 -1,245 -1,024
CF's from financing -2,373 -1,611 -3,222 -1,186 -1,039
Net cash flow 819 -1,040 -1,631 1,633 2,633
Cash at BoY 4,213 5,032 3,992 2,360 3,993
Cash at EoY 5,032 3,992 2,360 3,993 6,626
Free Cashflow 4,940 1,854 2,518 4,603 5,621
Key Ratio Analysis
Year end Dec 2014 2015 2016F 2017F 2018F
Profitability
Gross Margin (%) 42.9 39.5 38.7 38.2 38.3
Opr Margin (%) 25.7 21.9 20.6 20.6 21.0
EBITDA Margin (%) 30.4 27.2 26.9 27.2 27.0
Core Net Margin (%) 20.6 16.8 15.8 15.5 15.9
ROAE (%) 24.8 17.9 15.0 14.0 15.3
ROAA (%) 17.1 12.5 10.8 10.4 11.3
Stability Current ratio (x) 2.2 1.6 1.9 2.1 2.5
Net Debt to Equity (x) 0.0 0.0 0.1 0.0 0.0
Net Debt to EBITDA (x) -0.1 0.0 0.3 0.1 -0.1
Interest Coverage (x) 18.1 15.9 12.8 11.6 12.3
Efficiency A/P (days) 64.6 75.2 51.9 55.0 57.4
A/R (days) 40.9 45.7 39.6 40.1 40.4
Inventory (days) 63.8 57.6 69.3 69.1 67.8
Interim Result (Rpbn) Capital History
Date
Aug-91 IPO @ Rp7,000
Jul-95 3:1 Rights @ Rp.3,275
Aug-07 1:10 Stock Split
3Q15 4Q15 1Q16 2Q16 3Q16
Sales 6,474 7,833 6,021 6,449 6,612
Gross Profit 2,507 3,133 2,425 2,563 2,586
Opr. Profit 1,309 1,800 1,234 1,330 1,338
Net profit 1,013 1,323 1,034 931 973
Gross Margins (%) 38.7 40.0 40.3 39.7 39.1
Opr Margins (%) 20.2 23.0 20.5 20.6 20.2
Net Margins (%) 15.6 16.9 17.2 14.4 14.7

MARKET OUTLOOK PT Trimegah Securities Tbk - www.trimegah.com 179
Maintain Neutral—Revise TP to Rp16,400
We maintain neutral call on INTP with TP of Rp16,400, on the back of 1)
poor realised and expected demand growth from its strongest market,
2) larger than expected decline in ASP, 3) more efficient P14 plant.
Downside risk to our call is further decline of demand in Java, especially
Western Java region, significant rise in coal and energy price, and pro-
longed ASP decline, while upside risk includes rising cement ASP and
elimination of new smaller competitors.
Limited potential demand growth in West Java
In Jakarta, Banten, and West Java area, where INTP holds ~46% mar-
ket share (vs. SMGR at ~20%), 10M16 demand declined ~8% YoY.
Despite INTP having terminals and facilities in outside Java, lower mar-
ket share at those regions mean INTP would not be the main beneficiary
of the superior growth in Outside Java. Likewise, with the government’s
plan of massive infrastructure development in outside Java, we expect
limited growth in INTP’s cement sales.
Worsening ASP
INTP’s ASP has declined 9.4% YTD, much larger than SMGR’s 2.3%
decline. This led us to revise our 2017F ASP assumption, leading to a
9.8% and 18.6% decrease in 2017F revenue and net profit, respective-
ly. We believe the main contributor to above-average ASP decline is
negative growth in INTP’s home market: West Java. As we expect lim-
ited growth in West Java region, we expect slower recovery in ASP for
INTP.
More efficient plant
With the inauguration of INTP’s new plant in Oct-16, we also expect
improving cost-savings measures in FY17. In this low utilisation environ-
ment, switching from old plants to a new and more efficient price should
help to retain—if not improve—margins.
Maintain neutral with TP: Rp16,400 (6.8% upside)
We revise our TP to Rp16,400, implying 16.4x 2017F PE, and change
our valuation method to PE multiples only (Previous: combination of DCF
and PE). Currently, INTP trades at 15.4x 2017F PE.
Indocement Tunggal Prakarsa provides
cement and readymix as well as the
aggregates. The company’s main plant
is located in Java, especially in West
Java area.
Share Price Rp15,350
Sector Cement
Price Target Rp16,400 (6.8%)
Year end Dec 2014 2015 2016F 2017F 2018F
Revenues (Rpbn) 19,996 17,798 15,738 17,226 17,832
Net Profit (Rpbn) 5,494 4,505 3,971 3,672 4,098
EPS (Rp) 1,492 1,224 1,079 998 1,113
EPS Growth (%) 10 -18 -11.8 -7.5 12
DPS (Rp) 1,350 415 863 798 891
BVPS (Rp) 6,676 6,483 7,147 7,892 8,789
EV/EBITDA (x) 6.7 8.0 8.1 7.0 5.9
P/E (x) 10.3 12.5 14.2 15.4 13.8
Div Yield (%) 8.8 2.7 5.6 5.2 5.8
Indocement Tunggal Prakarsa The best still yet to come
Neutral Rp16,400
Billy Theodorus
Reuters Code INTP.JK
Bloomberg Code INTP.IJ
Issued Shares (m) 3,681
Mkt Cap (Rpbn) 56,507
Avg. Value Daily
6 month (Rpm) 32.1
52-Wk range 22800 / 14275
Birchwood Omnia Limited, England 51.0%
PT Mekar Perkasa 13.0%
Public 36.0%
EPS 16F 17F
Consensus (Rp) 1,157 1,068
TRIM vs Cons. (%) -6.7% -6.6%
Company Update
Stock Data
Major Shareholders
Consensus
Stock Price
Companies Data
0.0
20.0
40.0
60.0
80.0
100.0
120.0
0
5000
10000
15000
20000
25000
Nov-15 Jan-16 Mar-16 May-16 Jul-16 Sep-16
(Rpbn)Avg. 5 Day MA Trading Value (RHS)Series1

PT Trimegah Securities Tbk - www.trimegah.com MARKET OUTLOOK 180
Figure 92. Changes in INTP’s Forecast
(IDR bn) After Before Change
2017F 2018F 2017F 2018F 2017F 2018F
Revenue 17,226 17,832 19,088 19,836 -9.75% -10.10%
Gross profit 6,588 6,983 7,931 8,359 -16.93% -16.46%
Gross margin 38.24% 39.16% 41.55% 42.14%
Operating profit 4,130 4,472 5,207 5,566 -20.69% -19.66%
Op. profit margin 23.97% 25.08% 27.28% 28.06%
Pre-tax profit 4,896 5,464 6,016 6,634 -18.61% -17.63%
Pre-tax margin 28.42% 30.64% 31.52% 33.44%
Net profit 3,672 4,098 4,512 4,975 -18.61% -17.63%
Core margin 21.32% 22.98% 23.64% 25.08%
As can be seen in Figure 92, the change in revenue, and net profit forecast are substantial, with –9.8% and -
18.6% change in revenue and net profit, respectively. This major changes are largely due to a combination of
significant change in ASP estimate as well as upward revision of coal price assumptions. Gross profit also
changed shrank considerably due to lower revenue and higher COGS.
Source: TRIM Research

PT Trimegah Securities Tbk - www.trimegah.com MARKET OUTLOOK 181
Income Statement (Rpbn)
Year end Dec 2014 2015 2016F 2017F 2018F
Revenue 19,996 17,798 15,738 17,226 17,832
Revenue Growth (%) 7 -11 -12 9 4
Gross Profit 9,106 7,909 6,249 6,588 6,983
Opr. Profit 5,880 5,029 3,749 4,130 4,472
EBITDA 6,758 5,975 5,667 6,174 6,796
EBITDA Growth (%) 0 -12 -5 9 10
Net Int Inc/(Exp) 993 710 580 680 897
Gain/(loss) Forex 0 0 0 0 0
Other Inc/(Exp) 146 53 84 87 95
Pre-tax Profit 7,018 5,792 4,413 4,896 5,464
Tax -1,521 -1,288 -441 -1,224 -1,366
Minority Int. -3 0 0 0 0
Extra. Items 0 0 0 0 0
Reported Net Profit 5,494 4,505 3,971 3,672 4,098
Core Net Profit 5,494 4,505 3,309 3,672 4,098
growth (%) 10 -18 -27 11 12
Dividend per share 1,350 415 863 798 891
growth (%) 50 -69 108 -8 12
Dividend payout ratio 90 34 80 80 80
Balance Sheet (Rpbn)
Year end Dec 2014 2015 2016F 2017F 2018F
Cash and eq. 11,256 8,656 10,877 13,580 16,544
Other curr asset 4,831 4,478 3,820 4,236 4,405
Net fixed asset 12,144 13,814 14,335 14,553 14,799
Other asset 654 691 476 511 553
Total asset 28,885 27,638 29,508 32,881 36,301
ST debt 49 60 108 110 52
Other curr liab 3,211 2,628 2,116 2,659 2,817
LT debt 76 61 72 73 35
Other LT Liab 971 1,024 903 988 1,044
Minority interest 0 0 0 0 0
Total Liabilities 4,308 3,772 3,199 3,830 3,948
Shareholders Eq. 24,577 23,866 26,310 29,051 32,353
Net (debt) / cash -11,131 -8,534 -10,697 -13,397 -16,457
Total cap employed 24,702 23,987 26,489 29,234 32,440
Net Working capital 12,827 10,446 12,473 15,048 18,080
Debt 125 121 180 183 87
Cash Flow (Rpbn)
Year end Dec 2014 2015 2016F 2017F 2018F
Core Net Profit 5,494 4,505 3,971 3,672 4,098
Depr / Amort 878 946 1,860 1,982 2,253
Chg in Working Cap -41 -231 146 126 -10
CF's from oprs 6,331 5,220 5,977 5,781 6,342
Capex -3,770 -2,666 -2,347 -2,197 -2,509
Others -141 13 181 -38 -33
CF's from investing -3,911 -2,653 -2,167 -2,235 -2,542
Net change in debt -35 -4 59 3 -96
Others -3,724 -5,163 -1,648 -846 -740
CF's from financing -3,759 -5,167 -1,589 -843 -836
Net cash flow -1,339 -2,601 2,221 2,703 2,964
Cash at BoY 12,595 11,256 8,656 10,877 13,580
Cash at EoY 11,256 8,656 10,877 13,580 16,544
Free Cashflow 2,561 2,553 3,630 3,584 3,833
Key Ratio Analysis
Year end Dec 2014 2015 2016F 2017F 2018F
Profitability
Gross Margin (%) 45.5 44.4 39.7 38.2 39.2
Opr Margin (%) 29.4 28.3 23.8 24.0 25.1
EBITDA Margin (%) 33.8 33.6 36.0 35.8 38.1
Core Net Margin (%) 27.5 25.3 21.0 21.3 23.0
ROAE (%) 23.2 18.6 15.8 13.3 13.3
ROAA (%) 19.8 15.9 13.9 11.8 11.8
Stability Current ratio (x) 4.9 4.9 6.6 6.4 7.3
Net Debt to Equity (x) -0.5 -0.4 -0.4 -0.5 -0.5
Net Debt to EBITDA (x) -1.6 -1.4 -1.9 -2.2 -2.4
Interest Coverage (x) 273.1 189.5 143.8 150.2 343.3
Efficiency A/P (days) 36.1 41.5 33.7 35.6 36.5
A/R (days) 46.7 52.6 47.1 48.0 48.5
Inventory (days) 51.9 58.0 56.4 55.0 54.8
Interim Result (Rpbn) Capital History
Date
Dec-89 IPO @ Rp10,000
Aug-94 1:1 Bonus Issue
Aug-96 1:1 Stock Split
Mar-01 Rights Issue @ Rp1,200
May-03 Warrant Series-C Conversion
3Q15 4Q15 1Q16 2Q16 3Q16
Sales 4,011 4,912 3,929 3,813 3,605
Gross Profit 1,758 2,157 1,699 1,536 1,492
Opr. Profit 1,088 1,383 1,078 873 838
Net profit 909 1,138 958 1,471 719
Gross Margins (%) 43.8 43.9 43.2 40.3 41.4
Opr Margins (%) 27.1 28.2 27.4 22.9 23.3
Net Margins (%) 22.7 23.2 24.4 38.6 19.9

PT Trimegah Securities Tbk - www.trimegah.com MARKET OUTLOOK 182
Coal Sector

MARKET OUTLOOK PT Trimegah Securities Tbk - www.trimegah.com 183
Overweight; Top picks are PTBA, ADRO, and DOID We maintain our coal sector call with Overweight on the back of: 1) Healthier coal price level of USD75/72.5/70 per tonne in 2017/18/19, 2.) Strong 2017-18 earnings growth amid coal price recovery, low fuel cost,
abundant of net cash piling and relatively low overhead costs, 3.) Very cheap 2017-18 valuations. Our coal universe is trading at undemanding 2017-18 P/E of 9.1x/9.0x, -36/37% discount to industry’s 5 years histori-cal forward P/E*. Current EV/EBITDA is trading at a bargain with 2017-18 EV/EBITDA trading at both 3.9x/3.8x, -36%/37% discount to 5 years historical forward. Our top picks are PTBA, ADRO, and DOID.
Maintaining our coal price assumption We maintain our Newcastle coal price forecast of USD75/72.5 per ton in 2017-18 respectively and expect coal price to decline from 2018-21 with USD65/ton as our long-term price from 2021 onwards. China as the larg-est coal producer (~50% global) has the capability to maintain coal price
and China has strong intention to maintain coal price at profitable level.
Our forecast factors in China’s policy and Asia’s increasing demand (especially for high efficiency low emission supercritical power plants). We expect coal price may remain high until 1Q17 as most miners need more time to increase production amid China’s plan to ease working day until Mar’17 and higher demand due to colder upcoming winter. Entering the new healthy up-cycle era
Reasons of a new healthy up-cycle is shown from: 1.) UNTR heavy equip-ment (HE) orders are on 3 months waiting list, never happened since 5 years ago! (HE sales is an early indicator of where the coal cycle is head-ing), 2.) Better cost structure given lower fuel costs (~30% of mining cost), 3.) Healthier supply side: conservative production plans guidance
from major companies.
Investment metrics PTBA has the cheapest EV/reserve, 3rd cheapest P/E, largest ROAE, less susceptible towards coal and oil price movement. ADRO is most cost efficient coal miners and 2nd cheapest EV/EBITDA. UNTR has a dominant market share in the heavy equipment (~33%) and mining contracting business (~50%), a justified premium. ITMG offers attractive dividend
yield and has relatively cheap valuations despite its liquidity issue. DOID is a wise choice for investors seeking for unlocked value. Key risks to our call
1.) A swift change in China’s supply cut policy, 2) Higher than expected oil price
Coal Sector The Healthy Up-cycle Era of Coal
MARKET CAP
Companies Data
* excluding DOID and HRUM due to historical negative earnings
Rec.
TP Sh.Pr. Ups./ Earnings PE (x) EV/EBITDA (x) Div. yield ROAE PEG (x)
(Rp/sh) (Rp/sh) (%) CAGR('16-19) 2017 2018 2017 2018 2017 2018 2017 2018 2017
UNTR BUY 25,000 21,500 16% 16% 11.3 10.8 4.7 4.4 4.0% 4.4% 17.9% 17.0% 0.24
ADRO BUY 2,000 1,680 19% 21% 7.9 8.4 3.1 3.2 3.2% 6.3% 15.4% 13.2% 0.08
PTBA BUY 16,000 11,550 39% 29% 6.5 6.8 4.5 4.7 2.4% 5.4% 33.3% 25.7% 0.05
ITMG BUY 18,600 15,800 18% 22% 5.8 6.1 2.1 2.2 5.8% 12.0% 23.9% 20.4% 0.05
HRUM BUY 2,900 2,280 27% 33% 13.3 11.2 3.5 3.0 2.4% 4.5% 8.8% 10.0% 0.15
DOID BUY 800 515 55% 38% 4.4 3.5 3.6 3.2 0.0% 0.0% 45.3% 37.6% 0.04
Weighted avg. - total 9.1 9.0 3.9 3.8 3.6% 5.7% 20.2% 17.7%
Weighted avg. - mining contractors 10.9 10.4 4.7 4.3 3.8% 4.2% 19.2% 18.0%
Weighted avg. - coal miners 7.5 7.8 3.3 3.4 3.4% 6.9% 21.1% 17.5%
3 months ADTV
Willinoy Sitorus
Sandro Sirait
Overweight

PT Trimegah Securities Tbk - www.trimegah.com MARKET OUTLOOK 184
Coal Price Outlook
Our coal price assumption
We recently increased our 2016-17 Newcastle coal price estimate by +15%/+21% from USD56/62 per ton to
USD64.6/75 per ton respectively. We expect coal price to decline –3.6% per year from 2018 to 2021 with
USD65/tonne as our long-term price from 2021 onwards. Our coal price assumption mainly factors in China’s
government intervention by coal supply cut and South East Asia’s increasing demand (especially from Indonesia).
Short-term coal price correction is plausible given the ~+37% 1 month-rally is additionally driven by seasonality
or temporary event factors such as China’s winter season and La-Nina weather disruption.
China government intervention plays a big role to the coal price rally...
The only concern about this coal’s spectacular rally this year is that China’s government intervention through
supply cut plays a significant role. The rally is not purely a natural market behaviour of supply and demand.
China as the largest coal producer and coal consumer in the world have a big influence in coal price.
The price increase is also driven by China’s decision to reduce coal mine operating days from 330 days a year to
276, decreasing production by 10% YoY. Given China’s domestic shortage, there has been a surge in coal im-
ports. China imported 21.6 million tonnes of coal in Oct’16, up >55% YoY according to official customs data.
Inventory levels at China’s major coal port Qinhuangdao reached 6.06mn tons in Nov’16, 65% higher than 2016
average, but it is still 9% lower than 2015 average. 10M16 China coal imports increased 18% YoY to 201.9 mil-
lion tonnes compared to 10M15 of 170.4 million tonnes.
… and other supply issue and demand factors which happens concurrently
Newcastle coal price have reached USD100/ton for the first time since Mar’ 12, taking the rally to ~+100% in-
crease on a YTD basis. We view that China is in a dilemma to normalize such coal price rally in the short-term (2-
3 months) by boosting production given that the supply cut event happens concurrently with China’s winter sea-
son.
Figure 93. Trimegah coal price forecast
Source: Bloomberg, Trimegah Research
Coal price to normal-
ize at USD75/tonne
in 2017 and will
gradually fall to
USD65/ton by 2021
and will be used as
o u r l o n g - t e r m
benchmark price

PT Trimegah Securities Tbk - www.trimegah.com MARKET OUTLOOK 185
Coal price to remain high throughout this year despite China’s policy reversal
We present a monthly average coal price forecast throughout this year and next year. We expect coal price
should sustain at USD90-120/tonne throughout this year (Nov–Dec’ 16) and would gradually fall by next year to
USD83/tonne in Mar’ 17 and USD65/tonne by Jun’ 16 before gradually picking up to USD70/tonne in Sep’ 17 and
USD85/tonne by Dec’ 17. Our monthly projection accounts seasonality, stronger demand and China’s govern-
ment intervention program (assume to continue) factors.
China’s National Development and Reform Commission announced last month that coal mines that comply the
quality standards can operate for 330 days a year in Nov’16-Mar’17 from 276 days previously. Note that the new
limit will be effective until the end of the winter season and thus the long-term supply cut program will continue.
We expect the coal price will remain high until 1Q17 despite the policy reversal as miners need more time to
boost its production and the demand would be higher as winter this year is expected to be colder, even to be the
coldest since 2012 which is affected by climate pattern of La Nina.
Figure 94. Trimegah monthly coal price forecast
Source: Bloomberg, Trimegah Research
We expect coal price
to hover at high level
throughout Nov-
Dec’16 before expe-
riencing gradual
correction in subse-
quent months
Figure 95. China coal production 9M16 declined by 11% YoY
Source: Bloomberg, Trimegah Research
Need more time for
China to re-balance its
production level in
order to normalize coal
p r i c e a t t h e
~USD75/tonne level
51 51 51 50 51 5463
6772
91100
120
110
95
85
75
6560 60 60
6570
7583
45
55
65
75
85
95
105
115
125
Jan' 16
Feb' 16
Mar' 1
6
Apr' 1
6
May' 16
Jun' 16
Jul' 1
6
Aug' 16
Sep' 16
Oct' 1
6
Nov' 16f
Dec' 16f
Jan' 17f
Feb' 17f
Mar' 1
7f
Apr' 1
7f
May' 17f
Jun' 17f
Jul' 1
7f
Aug' 17f
Sep' 17f
Oct' 1
7f
Nov' 17f
Dec' 17f
Monthly average coal price forecast
(USD/tonne) Peak level in Dec' 16
Bottom level mid-2017
Revive to peak level

PT Trimegah Securities Tbk - www.trimegah.com MARKET OUTLOOK 186
Source: Bloomberg, various sources, Trimegah research
China’s inventory
level in Qinhuangdao
port is still below
2015’s average.
Figure 96. China inventory in October declined by 11% YoY
China coal import
10M16 surged by
18% YoY following
the production de-
cline since Apr’16.
Figure 97. China coal import
Source: Bloomberg, Trimegah Research
Source: Bloomberg, various sources, Trimegah research
We still expect coal
price rally may ex-
tend this year as
tight supply will
meet higher demand
in winter season..
Figure 98. China coal output seasonality

PT Trimegah Securities Tbk - www.trimegah.com MARKET OUTLOOK 187
What coal price level is China comfortable with?
Early 2016, China issued a policy to eliminate polluted and inefficient coal producers. This policy intentionally
supports the large, relatively cleaner and cost efficient mines’ profitability in China of which some of them are
state-owned (SOEs). Note that even a giant coal mine in China such as Shenhua mine has an ROE of a mere
~5%, suggesting that small and inefficient coal miners are bleeding. We view that China intends to help selected
miners’ profitability level to avoid bank loans default at the expense of shutting down small miners that have less
visibility in debt repayments.
We highlight that the total debt of large China coal miners as of July’16 amounts to RMB3.7tn
(USD444bn—note that this amount is equivalent to ~50% if Indonesia’s GDP) with average debt to
equity of more than 2x according to Fitch press release. In other words, China has a strong economic
interest of keeping coal price at favorable level!
China’s government intervention policy plays a big part of the coal price rally. Back in Sept’ 16, China govern-
ment announced its comfortable coal price level at RMB450/ton (USD66.4/ton), which is equivalent with 6,000
CV quality of USD72/ton. In fact, Newcastle coal price has shoot up to USD109/tonne, a 51% increase to China’s
implied guidance of USD72/tonne. We expect average coal price to be USD75/tonne in 2017, a healthy price
level for the big coal mining players in China and Indonesia as well.
Many countries are building coal-fired power plants with better technology!
There have been prolonged issues on the future of coal given pollution, climate change concerns, and the in-
crease usage of renewable energy. We would like to set the tone. Many countries are still building power plants
regardless of those particular issues! Based on our data from Greenpeace as of July 2016, 350GW of coal power
capacity is currently under construction. Also note that the total number of coal power capacity that has been
announced + pre-permit + permitted as of July’16 are 932GW! This is 48% of current operating total coal power
capacity of 1,939GW. Despite the ratification of Paris global climate agreement, the world is still build-
ing more coal-fired power plants!!!
We have seen increase of demand for high efficiency low emission coal (HELE), a technology that tackles the
prolonged issue of coal in regards to pollution. High efficiency low emission coal (HELE) technology is a group of
technologies made to increase the efficiency of coal-fired power plants by reducing CO2 and other green house
gas emissions such as Nox, SO2, and PM.
According to Greenpeace data, majority (66%) of existing power plants uses subcritical power plants which cause
heavy pollution. Nowadays, we see a trend of higher usage of ultra-supercritical power plants which is a low
emission power plant. As of Jul’ 16, 88% of power plant projects under constructions are super critical and ultra-
supercritical. Even companies such as ADRO and UNTR venture to these low-emission type of power plants.
Figure 99. Proposed Coal Plants by Country (GW)
Source: Greenpeace *data as of July’16
Country Announced + Pre- permit
+ Permitted Construction Shelved Operating
China 406 205 113 895
India 178 65 111 206
Turkey 70 4 14 16
Indonesia 40 8 9 26
Vietnam 31 16 0 13
Japan 19 3 0 44
Pakistan 18 3 5 0
Other countries 170 46 64 739
Total Countries 932 350 317 1940

MARKET OUTLOOK PT Trimegah Securities Tbk - www.trimegah.com 188
Adaro Energy The Most Cost-Discipline Player
Sandro Sirait
Maintain BUY on ADRO with TP IDR2,000
We increase our earning estimates and our SOP-based TP backed by: 1)
Higher coal price assumption, 2) Rise in free cash flow over the past 3
years. Our SOP valuation consists of DCF method for its coal mine seg-
ment (stretched to 2026 assuming reserves are depleted by that year)
with WACC assumption of 8.4% and ~10% of our TP include our BPI
and TPI power plants with power plants equity value of IDR~6trn. ADRO
is trading at 7.9x/8.4x 2017-18 P/E, which is a 45%/43% discount to 5-
years average historical forward P/E.
The most cost disciplined player among our coal universe
Amid coal price downturn from 2012 to 2015, ADRO is able to cut its
stripping ratio by –5% CAGR 2011-16F thanks to ADRO’s strong long-
term mine plan (ensuring low-hanging fruit reserves are not over ex-
ploited during coal boom). This enables ADRO to maintain cash margin
(ASP less cash cost) at a stable USD19-21/tonne level from 2014-
2016F. With the appropriate capex level over the past 5 years coupled
with excellent cost efficiency measures, we expect ADRO’s 2016 FCF
yield to be ~9% (the 2nd highest after ITMG).
Going into down-stream power plant—positive for the long-run
Following Batang 2x1,000MW power plant’s financial closing 3 months
ago, we expect the project to commence by 2020-21. We had a site visit
to Batang (Central Java) last month and we saw the project is at the
initial stage of construction. We project a conservative 6.6% IRR for the
project (higher than 2015’s ROAE of 5%). Given ADRO’s strong FCF, we
believe going into downstream projects is still a wise move albeit coal
price rally as it would enable ADRO to capture a captive domestic mar-
ket for its coal sales in the long-run.
Coal and oil price sensitivity analysis
Coal price sensitivity analysis suggests for every +/- 1% in coal price
will bring +/- 3.2% change in EPS and +/-2.5% in target price. Oil price
sensitivity analysis suggests for every +/- 1% in oil price will bring -/
+0.5% change in EPS and -/+0.4% in target price.
Companies Data
PT Adaro Energy Tbk is a coal mining
company. The Company and its subsidi-
aries currently deal in coal mining and
trade, coal infrastructure and logistics,
and mining contractor services.
Share Price Rp1,680
Sector Coal
Price Target Rp2,000 (19%)
BUY Rp2,000
Reuters Code ADRO.JK
Bloomberg Code ADRO.IJ
Issued Shares 31,986
Mkt Cap. (Rpbn) 53,736
Avg. Value Daily 6
Month (Rpbn) 75.8
52-Wk range 1735 / 437
Adaro Strategic Investment 44%
Garibaldi Thohir 6.1%
Public 49.9%
Core EPS 16F 17F
Consensus (Rp) 108.8 149.6
TRIM vs. Cons. (%) -2% 41%
Company Update
Stock Data
Major Shareholders
Consensus
Stock Price
Year end Dec 2014 2015 2016F 2017F 2018F
Revenue (USDmn) 3,325 2,684 2,618 3,599 3,590
Net profit (USDmn) 178 152 251 495 466
Core profit (USDmn) 218 196 251 495 466
EPS Growth -15% -9% 73% 98% -6%
Core EPS Growth -11.2% -2.3% 29.6% 97.5% -5.9%
P/E (x) 24.6 27.2 15.7 7.9 8.4
Core P/E (x) 19.8 20.3 15.7 7.9 8.4
P/BV (x) 1.6 1.4 1.3 1.1 1.1
Div. Yield 1.7% 1.9% 1.9% 3.2% 6.3%
EBITDA growth 1.8% -15.8% 13.5% 53.9% -4.4%
EV/EBITDA 4.54 5.39 4.75 3.09 3.23

PT Trimegah Securities Tbk - www.trimegah.com MARKET OUTLOOK 189
Income Statement (USDmn)
Year end Dec 2014 2015 2016F 2017F 2018F
Revenue 3,325 2,684 2,618 3,599 3,590
Revenue growth 1.2% -19.3% -2.5% 37.5% -0.2%
Cost of revenue 2,606 2,141 1,979 2,473 2,530
Gross profit 720 543 639 1,125 1,060
Opex 163 133 135 186 185
Op. Profit 557 410 504 940 875
Op. profit growth -2.4% -26.3% 22.9% 86.5% -6.9%
EBITDA 873 735 834 1,284 1,228
EBITDA growth 1.8% -15.8% 13.5% 53.9% -4.4%
Net int. inc./(exp) -164 -49 -48 -40 -28
Gain/(loss) Forex -13 -16 0 0 0
Assoc. earnings 0 0 0 0 0
Other inc./(exp.) -57 -65 0 0 0
Pre-tax profit 322 280 456 900 847
Pre-tax growth -24.0% -13.0% 62.8% 97.5% -5.9%
Tax -138 -129 -205 -405 -381
Minority Int. -5 1 0 0 0
Net profit 178 152 251 495 466
Net profit growth -24.4% -14.3% 64.4% 97.5% -5.9%
Balance Sheet (USDmn)
Cash Flow (USDmn) Key Ratio Analysis
Year end Dec 2014 2015 2016F 2017F 2018F
Profitability Gross Margin (%) 22% 20% 24% 31% 30%
Opr Margin (%) 17% 15% 19% 26% 24%
EBITDA Margin (%) 26% 27% 32% 36% 34%
Core Net Margin (%) 7% 7% 10% 14% 13%
ROAE (%) 7% 5% 8% 15% 13%
ROAA (%) 3% 2% 4% 8% 7%
Stability
Current ratio (x) 1.6 2.4 3.7 4.4 4.9
Net Debt to Equity (x) 0.42 0.30 0.19 0.01 (0.10)
Net Debt to EBITDA (x) 1.3 1.2 0.7 0.0 -0.3
Interest Coverage (x) 2.9 6.8 8.5 17.6 18.7
Efficiency
Receivables (days) 49 33 39 39 39
Inventory (days) 31 27 31 31 31
A/P (days) 11 10 10 10 10
Interim Results (USDmn) Capital History
Date
16-Jul-2008 IPO@IDR1,100
Year end Dec 3Q15 4Q15 1Q16 2Q16 3Q16
Sales 713 572 586 589 602
Gross Profit 138 107 154 149 163
EBITDA 187 167 192 202 211
Opr. Profit 107 80 113 117 128
Net profit 61 -28 60 63 87
Gross Margins (%) 19% 19% 26% 25% 27%
EBITDA Margins (%) 26% 29% 33% 34% 35%
Opr Margins (%) 15% 14% 19% 20% 21%
Net Margins (%) 9% -5% 10% 11% 14%
Year end Dec 2014 2015 2016F 2017F 2018F
Cash 745 702 860 1,205 1,437
Receivables - net 286 196 225 309 308
Inventory 97 73 71 98 97
Other current asset 144 122 122 122 122
Current assets 1,272 1,093 1,277 1,734 1,964
Net fixed asset 3,715 3,494 3,389 3,180 3,012
Other non-cur asset 128 121 121 121 121
Non-current assets 5,142 4,866 4,741 4,532 4,364
Total asset 6,414 5,959 6,018 6,266 6,328
ST debt 208 123 0 0 0
Other curr liab 566 332 345 397 403
Current liabilities 775 454 345 397 403
LT debt 1,688 1,429 1,423 1,250 1,088
Other LT Liab 693 722 722 722 722
Non-curr. liabilities 2,381 2,151 2,146 1,972 1,810
Total liabilities 3,156 2,606 2,490 2,369 2,213
Minority interest 492 487 487 487 487
Sh. equity 2,766 2,866 3,040 3,410 3,629
Net debt / (cash) 1,151 849 564 44 -349
Net Working capital 497 638 933 1,337 1,561
Year end Dec 2014 2015 2016F 2017F 2018F
EBIT 557 410 504 940 875
Dep. & amort. 317 325 330 344 353
Change In non-cash
working cap. 144 -98 -14 -59 7
Others -123 53 0 0 0
CF operations 592 512 567 781 826
Capex -113 -98 -225 -136 -185
Others 87 -20 20 0 0
CF investing -26 -118 -205 -136 -185
Net change in debt -325 -344 -128 -174 -162
Equity raised 0 0 0 0 0
Dividends -75 -75 -76 -125 -248
Others -172 -79 -76 -125 -248
CF financing -496 -423 -205 -299 -410
Net cash flow 70 -30 157 346 231
Others -5 -13 0 0 0
Cash at BoY 681 745 703 860 1,205
Cash at EoY 745 703 860 1,205 1,437
Free Cashflow 665 349 368 667 656

MARKET OUTLOOK PT Trimegah Securities Tbk - www.trimegah.com 190
Maintain BUY with TP of IDR16,000
We increase our earning estimates and our SOP-based TP backed by: 1)
Higher coal price assumption (should be positive for domestic ASP), 2)
The highest long-term production growth among peers. Our SOP-based
TP consist of 1.) Primary business’ NAV of IDR14,644/share, 2.) Banjar-
sari power plant NAV of IDR1,133 and 3.) Banko Tengah power plant
NAV of IDR220/share. PTBA is trading at 6.5x/6.8x 2017-18 P/E, a
49%/47% discount to 5-years historical forward P/E.
Locking reserves value from improving infrastructure
PTBA has been booking stellar production growth trend over the past 5
years. (PTBA booked 10% 2011-2015 production growth CAGR vs
ADRO’s 2%, ITMG’s 3%). With PTBA’s improved infrastructure (eg;
increase railway capacity to 45m tonnes by 2019 from 15m tonnes in
2015), we expect coal extraction trend to linger in the next 5 years
catering Indonesia’s 35,000MW power plant needs in the long-run. PTBA
has the largest reserves compared to its peers amounting to 3.3bn
tonnes (vs ITMG 220m tonnes, ADRO 1.1bn tonnes), translating to the
cheapest EV/reserves of USD0.62/ton among peers (vs ADRO’s USD4.1/
ton, ITMG’s USD 4.8/ton).
Upside risks
We attended PTBA analyst meeting recently. Several positive takeaways
that we have not included in our earnings are: 1) Railway capacity
ramp up, 2) Usage of electric heavy equipment which would reduce fuel
usage, 3.) Favorable pricing of 2017 domestic coal ASP (they said they
are finalizing its agreement with PLN to use such favorable 3 months
average of Indonesia Coal Price from Oct’ 16—Dec’ 16 to be used for
next year’s domestic selling price). The company expects the double
track railway expansion to be finished by 2019. PTBA just bought 4
fleets of electrical mining heavy equipment from Belarusia.
Coal and oil price sensitivity analysis
Coal price sensitivity analysis suggests for every +/-1% in coal price will
bring +/-2.8% change in EPS and +/-2.0% in Target price. Oil price
sensitivity analysis suggests for every +/-1% in oil price will bring
-/+0.2% change in EPS and -/+0.4% in Target price.
Tambang Batubara Bukit Asam The Highest Production Growth & Cheapest EV/reserve
Sandro Sirait
Companies Data
PT Tambang Batubara Bukit Asam Tbk
provides coal mining activities. The Com-
pany offers services including general
surveying, exploration, exploitation, pro-
duction, transportation, and marketing of
coal.
Share Price Rp11,550
Sector Coal
Price Target Rp16,000 (39%)
BUY 16,000
Reuters Code PTBA.JK
Bloomberg Code PTBA.IJ
Issued Shares 2,304
Mkt Cap. (Rpbn) 26,613
Avg. Value Daily 6
Month (Rpbn) 44.1
52-Wk range 13775 / 4150
Republic of Indonesia 65%
Public 26.5%
Treasury Stock 8.5%
Core EPS 16F 17F
Consensus (Rp) 791 1,142
TRIM vs. Cons. (%) -1% 55%
Company Update
Stock Data
Major Shareholders
Consensus
Stock Price
Year end Dec 2014 2015 2016F 2017F 2018F
Revenue (IDRbn) 13,078 13,734 14,107 19,530 20,278
Net profit (IDRbn) 1,861 2,036 1,812 4,079 3,912
Core profit (IDRbn) 1,861 2,036 1,812 4,079 3,912
EPS Growth 1.9% 9.4% -11.0% 125.2% -4.1%
Core EPS Growth 1.9% 9.4% -11.0% 125.2% -4.1%
P/E (x) 14.3 13.1 14.7 6.5 6.8
Core P/E (x) 14.3 13.1 14.7 6.5 6.8
P/BV (x) 3.17 2.90 2.53 1.90 1.62
Div. Yield 3.8% 2.7% 2.5% 2.4% 5.4%
EBITDA growth -2% 21% -1% 118% -3%
EV/EBITDA 11.83 9.77 9.88 4.54 4.69

PT Trimegah Securities Tbk - www.trimegah.com MARKET OUTLOOK 191
Income Statement (Rpbn)
Year end Dec 2014 2015 2016F 2017F 2018F
Revenue 13,078 13,734 14,107 19,530 20,278
Revenue growth 16.7% 5.0% 2.7% 38.4% 3.8%
Cost of revenue 9,156 9,594 9,889 11,540 12,472
Gross profit 3,922 4,140 4,218 7,990 7,807
Opex 1,873 1,725 1,878 2,599 2,699
Op. Profit 2,049 2,414 2,339 5,391 5,108
Op. profit growth -40.1% -4.8% 17.8% -3.1% 130.4%
EBITDA 2,225 2,693 2,663 5,801 5,613
EBITDA growth -1.8% 21.0% -1.1% 117.8% -3.2%
Net int. inc./(exp) 219 115 27 -32 10
Gain/(loss) Forex 0 0 0 1 0
Assoc. earnings 146 134 55 85 103
Other inc./(exp.) 365 249 81 53 113
Pre-tax profit 2,414 2,664 2,421 5,444 5,221
Pre-tax growth -1.9% 10.3% -9.1% 124.9% -4.1%
Tax -550 -627 -605 -1,361 -1,305
Minority Int. 3 1 4 4 4
Net profit 1,861 2,036 1,812 4,079 3,912
Net profit growth 1.9% 9.4% -11.0% 125.2% -4.1%
Balance Sheet (Rpbn)
Year end Dec 2014 2015 2016F 2017F 2018F
Cash 4,039 3,115 936 2,726 3,868
Receivables - net 1,439 1,596 1,663 2,240 2,357
Inventory 1,033 1,233 1,172 1,640 1,736
Other curr asset 905 1,654 1,656 1,657 1,658
Current assets 7,417 7,598 5,426 8,263 9,619
Net fixed asset 3,988 5,579 7,230 8,968 10,694
Other non curr. asset 2,460 2,430 2,430 2,430 2,430
Non-cur assets 7,444 9,296 10,907 12,645 14,370
Total asset 14,861 16,894 16,333 20,908 23,990
ST debt 1,294 1,352 0 0 0
Other curr liab 1,793 2,014 2,014 2,014 2,014
Current liabilities 2,755 2,684 2,651 3,298 3,484
LT debt 962 670 637 1,285 1,470
Other LT Liab 1,793 2,014 2,014 2,014 2,014
Non-curr. liab 2,755 2,684 2,651 3,298 3,484
Total liabilities 5,509 5,368 5,301 6,596 6,967
Minority interest 117 113 113 113 113
Sh. equity 8,408 9,175 10,538 13,983 16,467
Net debt / (cash) -1,784 -1,093 -299 -1,442 -2,398
Net Working capital 3,836 2,676 2,398 4,755 5,702
Cash Flow (Rpbn)
Year end Dec 2014 2015 2016F 2017F 2018F
EBIT 2,049 2,414 2,339 5,391 5,108
Depr / Amort 176 279 324 411 505
Chg in Working Cap 104 -178 550 567 -195
Others 186 -462 -1 -1 -1
CF's from oprs 1,976 1,898 1,534 3,840 4,511
Capex -1,398 -1,975 -1,975 -2,148 -2,231
Others -638 862 314 85 103
CF's from investing -2,035 -1,113 -1,661 -2,063 -2,127
Net change in debt 2,178 -233 -1,385 648 185
Equity raised 0 0 0 0 0
Dividends -1,004 -706 -668 -634 -1,428
Others -436 -856 0 0 0
CF's from financing 737 -1,795 -2,053 14 -1,242
Net cash flow 678 -1,011 -2,180 1,791 1,142
Others 17,652 86,647 0 0 0
Cash at BoY 3,344 4,039 3,115 936 2,726
Cash at EoY 4,039 3,115 936 2,726 3,868
Free Cashflow 256 328 -447 538 1,100
Key Ratio Analysis
Year end Dec 2014 2015 2016F 2017F 2018F
Profitability
Gross Margin (%) 30% 30% 30% 41% 38%
Opr Margin (%) 16% 18% 17% 28% 25%
EBITDA Margin (%) 17% 20% 19% 30% 28%
Net Margin (%) 14% 15% 13% 21% 19%
ROAE (%) 23% 23% 18% 33% 26%
ROAA (%) 14% 13% 11% 22% 17%
Stability
Current ratio (x) 2.1 1.5 1.8 2.4 2.5
Net Debt to Equity (x) -0.2 -0.1 -0.0 -0.1 -0.1
Net Debt to EBITDA (x) -0.8 -0.4 -0.1 -0.2 -0.4
Interest Coverage (x) -42.1 -15.3 -23.9 -77.9 -51.5
Efficiency
Receivables (days) 40 42 43 42 42
Inventory (days) 29 33 30 31 31
A/P (days) 70 106 83 86 92
Interim Result (Rpbn) Capital History
Date
12-Mar-02 IPO @ Rp. 575
28-Dec-05 Warrant Conversion
Year end Dec 3Q15 4Q15 1Q16 2Q16 3Q16
Sales 3,990 3,232 3,545 3,214 3,283
Gross Profit 1,250 1,176 814 836 795
EBITDA 1,002 766 485 609 604
Opr. Profit 905 616 461 456 417
Net profit 710 530 333 379 340
Gross Margins (%) 31% 36% 23% 26% 24%
EBITDA Margins (%) 25% 24% 14% 19% 18%
Opr Margins (%) 23% 19% 13% 14% 13%
Net Margins (%) 18% 16% 9% 12% 10%

MARKET OUTLOOK PT Trimegah Securities Tbk - www.trimegah.com 192
Maintain BUY call with TP of IDR18,600
We derive our DCF-based TP using 8.9% WACC assumption and assume
coal production to end at 2023. We feel ITMG has been under looked
over the past 1 year due to its disability to lower strip ratio over the
past 6 years and limited reserves as well (only ~8 years of mine life).
ITMG offers the most attractive dividend yield. ITMG is currently trading
at 5.8x/6.1x 2017-18 P/E, a 57%/55% discount to its 5-years historical
forward P/E.
Reserves may be limited, but the asset is high quality
Using ITMG’s 2015 production, ITMG only has 8 years of mine life re-
serves left. Yet, ITMG has relatively high coal CV (calorific value) which
tends to relatively deviate higher towards coal benchmark price when
coal price rallies. ITMG still has low-hanging fruit strategy to boost its
Bharinto production (96m tonnes worth of reserves) by smoothening its
60km road connectivity. We expect overall production growth to be
relatively flat for the next 5 years.
Strong balance sheet=Highest FCF yield=Highest Dividend yield
We like ITMG as it consistently offers high dividend payout (5-years
historical ranges at 60%-100% dividend payout). Its attractive dividend
yield of ~6% (assuming ~70% dividend payout ratio based on 2016
earnings) is the highest among other coal mining companies. Given its
strong balance sheet (1H16 cash of USD270mn with zero debt), we see
the company has flexibility to opt for inorganic growth by acquiring coal
mines in order to boost production.
Coal and oil price sensitivity analysis
Coal price sensitivity analysis suggests for every +/-1% in coal price will
bring +/-4.0% change in EPS and +/-3.4% in Target price. Oil price
sensitivity analysis suggests for every +/-1% in oil price will bring
-/+0.8% change in EPS and -/+0.7% in Target price.
Indo Tambangraya Megah The Perfect Cash Cow To Your Coal Portfolio Mix
Sandro Sirait
Companies Data
PT Indo Tambangraya Megah Tbk pro-
vides integrated coal mining, coal pro-
cessing and operational logistics. Its
mines are located in the provinces of
East, Central and South Kalimantan.
Share Price Rp15,800
Sector Coal Mining
Price Target Rp18,600 (17%)
BUY Rp18,600
Reuters Code ITMG.JK
Bloomberg Code ITMG.IJ
Issued Shares 1,130
Mkt Cap. (Rpbn) 17,853
Avg. Value Daily 6
Month (Rpbn) 22.0
52-Wk range 18350 / 4675
Republic of Indonesia 65%
Government of Singapore 6%
Public 29%
Core EPS 16F 17F
Consensus (Rp) 1,197 1,727
TRIM vs. Cons. (%) 14% 84%
Company Update
Stock Data
Major Shareholders
Consensus
Stock Price
Year end Dec 2014 2015 2016F 2017F 2018F
Revenue (USDm) 1,943 1,589 1,376 1,850 1,888
Net profit (USDm) 201 63 109 226 214
Core profit (USDm) 180 121 110 226 214
EPS Growth -12.8% -68.6% 72.9% 107.0% -5.3%
Core EPS Growth -29.3% -33.1% -9.1% 106.1% -5.2%
P/E (x) 7.2 21.8 12.0 5.8 6.1
Core P/E (x) 8.1 11.4 11.9 5.8 6.1
P/BV (x) 1.6 1.6 1.5 1.3 1.2
Div. Yield 13.3% 9.0% 5.5% 5.8% 12.0%
EBITDA growth -26% -14% -18% 74% -4%
EV/EBITDA 2.57 2.99 3.63 2.09 2.18

PT Trimegah Securities Tbk - www.trimegah.com MARKET OUTLOOK 193
Income Statement (USDmn) Balance Sheet (USDmn)
Year end Dec 2014 2015 2016F 2017F 2018F
Cash and equivalents 226 268 384 533 623
Receivables - net 186 119 117 148 156
Inventory 150 117 104 138 142
Other curr asset 8 8 8 8 8
Current assets 570 512 613 828 929
Net fixed asset 286 255 247 219 192
Other non curr. asset 145 147 147 147 147
Non-current assets 741 666 618 579 541
Total asset 1,310 1,178 1,232 1,406 1,470
ST debt 0 0 0 0 0
Other curr liab 364 284 276 301 308
Current liabilities 364 284 276 301 308
LT debt 0 0 0 0 0
Other LT Liab 62 59 84 84 84
Non-curr. liabili- 62 59 84 84 84
Total Liabilities 426 344 361 385 392
Minority interest 0 0 0 0 0
Shareholders Equi-
ty
885 835 871 1,021 1,078
Net debt / (cash) -226 -268 -384 -533 -623
Net Working capital 205 228 337 527 621
Cash Flow (USDmn)
Year end Dec 2014 2015 2016F 2017F 2018F
EBIT 237 194 142 295 276
Depr / Amort 63 64 70 73 77
Chg in Working Cap 104 19 7 -40 -5
Others -5 -46 39 10 9
CF's from oprs 191 193 227 270 297
Capex -35 -25 -38 -45 -50
Others -17 -10 0 0 0
CF's from investing -52 -35 -38 -45 -50
Net change in debt 0 0 0 0 0
Equity raised 0 0 0 0 0
Dividends -200 -115 -73 -76 -157
Others -200 -115 -73 -76 -157
CF's from financing -200 -115 -73 -76 -157
Net cash flow -61 43 116 149 90
Others -1 -2 0 0 0
Cash at BoY 289 226 268 384 533
Cash at EoY 226 268 384 533 623
Free Cashflow 339 229 166 236 258
Key Ratio Analysis
Year end Dec 2014 2015 2016F 2017F 2018F
Profitability Gross Margin (%) 21% 22% 20% 26% 24%
Opr Margin (%) 12% 12% 10% 16% 15%
EBITDA Margin (%) 15% 16% 15% 20% 19%
Net Margin (%) 10% 4% 8% 12% 11%
ROAE (%) 22% 7% 13% 24% 20%
ROAA (%) 15% 5% 9% 17% 15%
Stability
Current ratio (x) 1.6 1.8 2.2 2.7 3.0
Net Debt to Equity (x) -0.3 -0.3 -0.4 -0.5 -0.6
Net Debt to EBITDA (x) -0.8 -1.0 -1.8 -1.4 -1.8
Interest Coverage (x) na na na na na
Efficiency
Receivables (days) 35 27 31 29 30
Inventory (days) 28 27 28 27 27
A/P (days) 39 36 37 36 37
Interim Result (USDmn) Capital History
Date
18-Dec-07 IPO @ Rp. 14,000
Year end Dec 3Q15 4Q15 1Q16 2Q16 3Q16
Sales 382 383 331 278 349
Gross Profit 86 90 70 47 77
Opr. Profit 49 47 38 20 47
Net profit 25 -20 23 13 33
Gross Margins (%) 22.4% 23.6% 21.0% 16.8% 22.1%
Opr. Margins (%) 12.9% 12.3% 11.6% 7.2% 13.3%
Net Margins (%) 6.5% -5.2% 7.0% 4.8% 9.5%
Year end Dec 2014 2015 2016F 2017F 2018F
Revenue 1943 1589 1376 1850 1888
Revenue growth -11% -18% -13% 34% 2%
Cost of revenue 1534 1239 1100 1375 1428
Gross profit 409 350 276 475 460
Opex 172 157 134 180 184
Op. Profit 237 194 142 295 276
Op. profit growth -30% -18% -27% 108% -6%
EBITDA 299 258 212 368 353
EBITDA growth -26% -14% -18% 74% -4%
Net int. inc./(exp) 6 4 5 7 10
Gain/(loss) Forex 0 0 0 0 0
Assoc. earnings 0 0 0 0 0
Other inc./(exp.) 17 -34 0 0 0
Pre-tax profit 263 139 145 301 285
Pre-tax growth -18% -47% 4% 107% -5%
Tax -62 -76 -36 -75 -71
Minority Int. 0 0 0 0 0
Net profit 201 63 109 226 214
Net profit growth -13% -69% 73% 107% -5%

MARKET OUTLOOK PT Trimegah Securities Tbk - www.trimegah.com 194
Maintain BUY with TP IDR2,900
We derive our DCF-based TP (forecast to 2024) using 7.9% WACC & net
cash position of USD245mn in 2017. Although HRUM has only 9 years of
mine reserve life, HRUM offers cheap EV/reserve of USD4.85/ton (its 5-
year average EV/reserve is USD7.1/ton) given its large cash pile of
USD202m (IDR2.6trn) in 9M16 coupled with zero debt. Its cash position
itself equals to ~42% of its market cap.
Spot price play: main beneficiary of coal price rally
HRUM is the main beneficiary of the coal price rally as most of the coal
sales is based on spot price (95% of coal sales). Hence, it makes sense
for HRUM to boost sales in 3Q16 (3Q16 sales volume and ASP up
+14%/+8% YoY to take enjoy the coal price rally momentum).
Stripping to increase next year but cash cost to be stable
We expect cash cost/tonne to drop significantly this year to USD33.8/
tonne, -28.5% lower vs 2015’s USD47.3/tonne due to lower stripping
ratio and lower fuel cost. We expect HRUM would increase its stripping
ratio to 7.3x in 2017 (+26% YoY) amid coal price boom. Yet, we expect
cash cost to only increase by +6% in 2017 thanks to lower fuel cost.
Strong upside risk is short-term production volume boost
With HRUM’s almost 100% coal spot exposure amid high coal price,
there is upside potential that HRUM may significantly boost production
growth compared to our existing 2017 production volume forecast. Note
that during high coal price condition back in 2011-12, HRUM sales vol-
ume was 9-12m tonnes/year which is significantly higher compared to
our 2016-17’s target of only 3.0m/4.2m tonnes.
Coal and oil price sensitivity analysis
Coal price sensitivity analysis suggests for every +/-1% in coal price will
bring +/-3.4% change in EPS and +/-2.6% in Target price. Oil price
sensitivity analysis suggests for every +/-1% in oil price will bring
-/+0.6% change in EPS and -/+0.4% in Target price.
Year end Dec 2014 2015 2016 2017F 2018F
Revenue (USDm) 478 249 188 299 375
Net profit (USDm) 0 (19) 18 34 40
Core profit (USDm) 0 (19) 18 34 40
EPS Growth na na na 86% 19%
Core EPS Growth na na na 86% 19%
P/E (x) 1,085.7 na 24.9 13.3 11.2
Core P/E (x) 1,085.7 na 24.9 13.3 11.2
P/BV (x) 1.3 1.3 1.3 1.2 1.1
Div. Yield 5.4% 0.0% 0.0% 2.4% 4.5%
EBITDA growth -62% -67% 233% 67% 18%
EV/EBITDA 6.58 19.78 5.93 3.54 3.01
Harum Energy The Most Beneficial of Coal Rally, almost 100% Spot!
Sandro Sirait
Companies Data
PT. Harum Energy Tbk. (HRUM) operates
in coal mining and logistics activities in
East Kalimantan which produces thermal
coal with bituminous characteristics
which are mostly exported to overseas
markets.
Share Price Rp2,280
Sector Coal
Price Target Rp2,900 (27%)
BUY Rp2,900
Reuters Code HRUM.JK
Bloomberg Code HRUM.IJ
Issued Shares 2,704
Mkt Cap. (Rpbn) 6,164
Avg. Value Daily 6
Month (Rpbn) 22.1
52-Wk range 2700 / 585
PT Karunia Bara Perkasa 71%
Public 29%
Core EPS 16F 17F
Consensus (Rp) 68 109
TRIM vs. Cons. (%) 33% 57%
Company Update
Stock Data
Major Shareholders
Consensus
Stock Price

PT Trimegah Securities Tbk - www.trimegah.com MARKET OUTLOOK 195
Income Statement (USDmn) Balance Sheet (USDmn)
Cash Flow (USDmn) Key Ratio Analysis
Interim Result (USDmn) Capital History
Date
06-Okt-10 IPO @5200
Year end Dec 3Q15 4Q15 1Q16 2Q16 3Q16
Sales 53 45 44 36 49
Gross Profit 8 7 11 11 18
Opr. Profit -1 -4 1 5 10
Net profit -2 -20 1 3 6
Gross Margins (%) 15 17 24 30 37
Opr. Margins (%) -2 -10 3 15 21
Net Margins (%) -3 -45 3 8 13
Year end Dec 2014 2015 2016F 2017F 2018F
Revenue 478 249 188 299 375
Revenue growth -43% -48% -25% 59% 25%
Cost of revenue 391 203 140 215 272
Gross profit 87 46 48 84 103
Opex 66 45 24 38 48
Op. Profit 21 1 24 46 55
Op. profit growth -69% -97% 4050% 94% 20%
EBITDA 31 10 34 58 68
EBITDA growth -62% -67% 233% 67% 18%
Net int. inc./(exp) 3 1 2 3 3
Gain/(loss) Forex 0 0 0 0 0
Assoc. earnings -4 -4 2 5 5
Other inc./(exp.) 1 -2 0 -1 -1
Pre-tax profit 7 -18 28 53 63
Pre-tax growth -88% na na 86% 19%
Tax 5 1 7 13 15
Minority Int. -2 0 -3 -6 -7
Net profit 0 -19 18 34 40
Net profit growth 86% 19% 7% 6% 4%
Year end Dec 2014 2015 2016F 2017F 2018F
Cash 201 196 236 245 254
Receivables - net 32 10 13 21 26
Inventory 17 8 13 20 25
Other curr asset 31 12 5 8 10
Current assets 281 225 267 294 315
Net fixed asset 107 98 104 111 117
Other non curr. asset 23 46 10 15 19
Non-current assets 163 155 126 138 149
Total asset 444 381 393 432 464
ST debt 0 0 0 0 0
Other curr liab 79 33 27 41 52
Current liabilities 0 0 0 0 0
LT debt 4 5 5 5 5
Other LT Liab 4 5 5 5 5
Non-curr. liabilities 4 5 5 5 5
Total liabilities 83 37 31 46 57
Minority interest 74 71 64 71 76
Sh. equity 362 343 362 385 405
Net debt / (cash) -201 -196 -236 -245 -254
Net Working capital -20 -4 7 3 2
Year end Dec 2014 2015 2016F 2017F 2018F
EBIT 21 1 24 46 55
Dep. & amort. 10 10 11 12 13
Change In non-cash
working cap. -20 -4 7 3 2
Others -1 -2 -1 -29 -31
CF operations 50 12 41 31 39
Capex 1 -1 -6 -6 -7
Others 0 -12 1 -1 -1
CF investing 1 -13 -5 -7 -7
Net change in debt 0 0 0 0 0
Equity raised 0 0 0 0 0
Dividends -25 0 0 -11 -20
Others -32 -5 5 -15 -23
CF's from financing -32 -5 5 -15 -23
Net cash flow 20 -6 41 9 9
Others 0 0 0 0 0
Cash at BoY 181 201 196 236 245
Cash at EoY 201 196 236 245 254
Free Cashflow 52 13 21 49 60
Year end Dec 2014 2015 2016F 2017F 2018F
Profitability
Gross Margins (%) 18% 18% 25% 28% 28%
Op Margins (%) 4% 0% 13% 15% 15%
EBITDA Margins (%) 7% 4% 18% 19% 18%
Net Margins (%) 0% -8% 10% 11% 11%
ROE (%) 0% -6% 5% 9% 10%
ROA (%) 0% -5% 5% 8% 9%
Stability
Current ratio (x) 3.6 6.9 10.0 7.1 6.0
Net Debt/Equity (x) -0.6 -0.6 -0.7 -0.6 -0.6
Net Debt to EBITDA
(x)
Int Coverage (x) 20.5 6.8 0.3 10.4 20.2
Efficiency
A/P days 43 43 50 50 50
A/R days 23 23 25 25 25
Inventory days 34 34 34 34 34

MARKET OUTLOOK PT Trimegah Securities Tbk - www.trimegah.com 196
Reiterate our BUY call with TP of IDR25,000
We slightly lower our TP to IDR25,000 (from (IDR26,000) as we in-
crease our RFR assumption to 8% (from 6.8%). Our SOP based TP uses
13-years DCF forecast before terminal value using 13.1% WACC and 2%
long-term growth rate. UNTR is currently trading at 11.3x/10.8x 2017-
18 P/E, a 18%/21% discount to its 5-years historical forward P/E.
Why we like the company
We reiterate the facts that UNTR is much of a better position to enjoy
the coal up-cycle compared to 5-6 years ago amidst coal boom given:
1.) Better cost efficiencies (lower overhead costs), 2.) Able to stretch
useful life of heavy equipment given its technology to maintain fleets at
healthy condition for a longer period, 3.) Strong FCF of IDR8.97trn in
2015, 53% CAGR FCF from 2010 to 2015!, 4.) Strong balance sheet
with 9M16 net cash position of IDR17.3trn, equivalent to 21% of market
cap. Amid coal price rally, we expect volume and ASP growth from all
cylinders (mining service, heavy equipment sales and coal mining).
Heavy equipment sales to grow next year
We expect UNTR’s 2017 heavy equipment (HE) sales to grow by +10%
YoY. A testament to our HE growth is our channel-check that suggests
large orders for Komatsu HEs with 3 months waiting list (the first time
since 5 years ago!). We believe that heavy equipment sales is the early
signal of particular upward/downward cycle in the coal mining industry.
Mining contracting tariff to recover next year
We expect mining contracting tariff to conservatively increase by ~+3%
YoY to USD2.5/bcm. Our sensitivity analysis suggests that a change in
our 2017 mining tariff by +/-10% would impact earnings by +/-30%.
Its coal mine segment should benefit from coal price rally too
UNTR also has a coal mining segment (under TTA) with 9 mines in pos-
session (total reserves of 395m tonnes). Currently only 1 mine is oper-
ating (ABB mine) which was acquired back in 2011. ~80% of its coal
production is exported with majority using spot price. Its coal mining
segment contributes 8%-12% of revenue. A +/-10% 2017 coal price
change would impact UNTR’s earnings by +/-1%.
United Tractors
The Most Dominant Coal Service Player
Willinoy Sitorus
Companies Data
PT United Tractors has 4 major business
units: constructing machinery, mining
contracting (PAMA), coal mining, and
construction industry (Acset)
Share Price Rp21,500
Sector Machinery-Constr & Mining
Price Target Rp25,000 (16%)
BUY Rp25,000
Reuters Code UNTR.JK
Bloomberg Code UNTR.IJ
Issued Shares 3,730
Mkt Cap. (Rpbn) 80,198
Avg. Value Daily 6
Month (Rpbn) 88.9
52-Wk range 23975 / 12550
PT. Astra International Tbk 59.50%
Public 40.50%
Core EPS 16F 17F
Consensus (Rp) 1,231 1,465
TRIM vs. Cons. (%) 5.4% 30.3%
Company Update
Stock Data
Major Shareholders
Consensus
Stock Price Year end Dec 2014 2015 2016F 2017F 2018F
Revenue (IDRbn) 53,142 49,347 49,063 56,651 60,877
Net profit (IDRbn) 5,372 3,853 4,836 7,117 7,454
Core profit (IDRbn) 7,253 7,121 5,188 7,117 7,454
EPS Growth 11.1% -28.3% 25.5% 47.2% 4.7%
Core EPS Growth 47.7% -1.8% -27.2% 37.2% 4.7%
P/E (x) 14.9 20.8 16.6 11.3 10.8
Core P/E (x) 11.1 11.3 15.5 11.3 10.8
P/BV (x) 2.2 2.1 2.1 1.9 1.8
Div. Yield 2.5% 3.7% 3.2% 4.0% 4.4%
EV/EBITDA 5.7 5.4 6.3 4.7 4.4
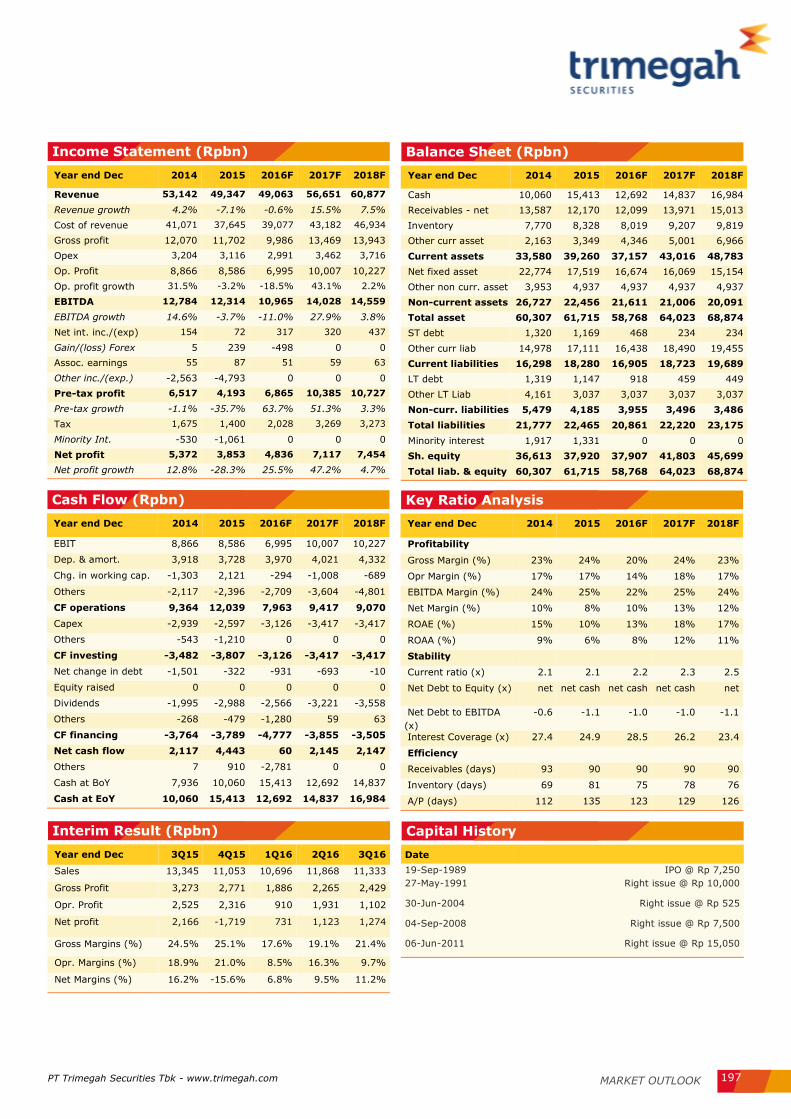
PT Trimegah Securities Tbk - www.trimegah.com MARKET OUTLOOK 197
Income Statement (Rpbn)
Year end Dec 2014 2015 2016F 2017F 2018F
Revenue 53,142 49,347 49,063 56,651 60,877
Revenue growth 4.2% -7.1% -0.6% 15.5% 7.5%
Cost of revenue 41,071 37,645 39,077 43,182 46,934
Gross profit 12,070 11,702 9,986 13,469 13,943
Opex 3,204 3,116 2,991 3,462 3,716
Op. Profit 8,866 8,586 6,995 10,007 10,227
Op. profit growth 31.5% -3.2% -18.5% 43.1% 2.2%
EBITDA 12,784 12,314 10,965 14,028 14,559
EBITDA growth 14.6% -3.7% -11.0% 27.9% 3.8%
Net int. inc./(exp) 154 72 317 320 437
Gain/(loss) Forex 5 239 -498 0 0
Assoc. earnings 55 87 51 59 63
Other inc./(exp.) -2,563 -4,793 0 0 0
Pre-tax profit 6,517 4,193 6,865 10,385 10,727
Pre-tax growth -1.1% -35.7% 63.7% 51.3% 3.3%
Tax 1,675 1,400 2,028 3,269 3,273
Minority Int. -530 -1,061 0 0 0
Net profit 5,372 3,853 4,836 7,117 7,454
Net profit growth 12.8% -28.3% 25.5% 47.2% 4.7%
Balance Sheet (Rpbn)
Year end Dec 2014 2015 2016F 2017F 2018F
Cash 10,060 15,413 12,692 14,837 16,984
Receivables - net 13,587 12,170 12,099 13,971 15,013
Inventory 7,770 8,328 8,019 9,207 9,819
Other curr asset 2,163 3,349 4,346 5,001 6,966
Current assets 33,580 39,260 37,157 43,016 48,783
Net fixed asset 22,774 17,519 16,674 16,069 15,154
Other non curr. asset 3,953 4,937 4,937 4,937 4,937
Non-current assets 26,727 22,456 21,611 21,006 20,091
Total asset 60,307 61,715 58,768 64,023 68,874
ST debt 1,320 1,169 468 234 234
Other curr liab 14,978 17,111 16,438 18,490 19,455
Current liabilities 16,298 18,280 16,905 18,723 19,689
LT debt 1,319 1,147 918 459 449
Other LT Liab 4,161 3,037 3,037 3,037 3,037
Non-curr. liabilities 5,479 4,185 3,955 3,496 3,486
Total liabilities 21,777 22,465 20,861 22,220 23,175
Minority interest 1,917 1,331 0 0 0
Sh. equity 36,613 37,920 37,907 41,803 45,699
Total liab. & equity 60,307 61,715 58,768 64,023 68,874
Cash Flow (Rpbn)
Year end Dec 2014 2015 2016F 2017F 2018F
EBIT 8,866 8,586 6,995 10,007 10,227
Dep. & amort. 3,918 3,728 3,970 4,021 4,332
Chg. in working cap. -1,303 2,121 -294 -1,008 -689
Others -2,117 -2,396 -2,709 -3,604 -4,801
CF operations 9,364 12,039 7,963 9,417 9,070
Capex -2,939 -2,597 -3,126 -3,417 -3,417
Others -543 -1,210 0 0 0
CF investing -3,482 -3,807 -3,126 -3,417 -3,417
Net change in debt -1,501 -322 -931 -693 -10
Equity raised 0 0 0 0 0
Dividends -1,995 -2,988 -2,566 -3,221 -3,558
Others -268 -479 -1,280 59 63
CF financing -3,764 -3,789 -4,777 -3,855 -3,505
Net cash flow 2,117 4,443 60 2,145 2,147
Others 7 910 -2,781 0 0
Cash at BoY 7,936 10,060 15,413 12,692 14,837
Cash at EoY 10,060 15,413 12,692 14,837 16,984
Key Ratio Analysis
Year end Dec 2014 2015 2016F 2017F 2018F
Profitability Gross Margin (%) 23% 24% 20% 24% 23%
Opr Margin (%) 17% 17% 14% 18% 17%
EBITDA Margin (%) 24% 25% 22% 25% 24%
Net Margin (%) 10% 8% 10% 13% 12%
ROAE (%) 15% 10% 13% 18% 17%
ROAA (%) 9% 6% 8% 12% 11%
Stability
Current ratio (x) 2.1 2.1 2.2 2.3 2.5
Net Debt to Equity (x) net net cash net cash net cash net
Net Debt to EBITDA
(x)
-0.6 -1.1 -1.0 -1.0 -1.1
Interest Coverage (x) 27.4 24.9 28.5 26.2 23.4
Efficiency
Receivables (days) 93 90 90 90 90
Inventory (days) 69 81 75 78 76
A/P (days) 112 135 123 129 126
Interim Result (Rpbn) Capital History
Date
19-Sep-1989 IPO @ Rp 7,250
27-May-1991 Right issue @ Rp 10,000
30-Jun-2004 Right issue @ Rp 525
04-Sep-2008 Right issue @ Rp 7,500
06-Jun-2011 Right issue @ Rp 15,050
Year end Dec 3Q15 4Q15 1Q16 2Q16 3Q16
Sales 13,345 11,053 10,696 11,868 11,333
Gross Profit 3,273 2,771 1,886 2,265 2,429
Opr. Profit 2,525 2,316 910 1,931 1,102
Net profit 2,166 -1,719 731 1,123 1,274
Gross Margins (%) 24.5% 25.1% 17.6% 19.1% 21.4%
Opr. Margins (%) 18.9% 21.0% 8.5% 16.3% 9.7%
Net Margins (%) 16.2% -15.6% 6.8% 9.5% 11.2%

MARKET OUTLOOK PT Trimegah Securities Tbk - www.trimegah.com 198
Maintain BUY with TP of IDR800
Our DCF-based TP forecast is stretched to 2027 using 6.7% WACC as-
sumption. DOID offers attractive upside on the back of: 1) Stronger
tariff rebound as stronger coal price should also improve coal miners'
profitability, 2) Higher earnings predictability coming from longer term
overburden removal contract until 2025, 3) Undemanding valuation as
DOID is trading at 3.6x EV/EBITDA 2017F, a 34% discount to UNTR’s
EV/EBITDA. DOID’s overburden removal is 40% the size of UNTR’s over-
burden, yet DOID’s EV is only ~15% of UNTR’s enterprise value. With
stronger cash flow and improving balance sheet, it is only a matter of
time for its true value to be unlocked.
We increase our TP by 14% from IDR700 to IDR800
We derive a higher TP as we take into account the newly signed long-
term contracts from Berau (from 2020 to 2025) and Tadjahan Antang
Mineral (from 2018 to 2024). We adjust our 2016/17/18F core profit
estimate by +34%/+44%/+59% to USD36/71/89mn respectively sup-
ported by higher overburden volumes.
Higher earnings predictability
DOID managed to secure a big long-term contract with Berau Coal
worth USD3bn recently which extends its life of mine contract from 2020
to 2025. DOID also signed contract with Tadjahan Antang Mineral worth
USD281mn, extending its contract from 2018 to 2020. By those two
contracts, DOID has secured USD1bn of EBITDA (vs DOID’s market cap
is only ~USD300mn). DOID’s total order book is 2.4bn bcm. Total con-
tracted revenue for the next ten years now for DOID is USD4.8bn vs
previously USD2.5bn.
Further potential upside and downside risk
Upside risk for DOID are: 1.) Upcoming new contracts from mining and
non-mining customers (note that DOID just received a USD4mn non-
mining contract from a power plant infrastructure project), 2.) DOID’s
ample room to upwardly adjust mining tariff (~25% cheaper than Pama)
would be a competitive advantage to gain new contracts. Its key down-
side risk is lower than expected coal price (our 2017 average coal price
assumption is USD75/tonne).
Delta Dunia Makmur Emerging True Value
Sandro Sirait
Companies Data
PT Delta Dunia Makmur Tbk is the hold-
ing company of PT Bukit Makmur Mandiri
Utama (BUMA), which is the second larg-
est coal mining contractor in Indonesia.
Share Price Rp515
Sector Mining
Price Target Rp800 (55%)
BUY Rp800
Reuters Code DOID.JK
Bloomberg Code DOID.IJ
Issued Shares 8,311
Mkt Cap. (Rpbn) 4,280
Avg. Value Daily 6
Month (Rpbn) 34.0
52-Wk range 585 / 50
Northstar Tambang Persada 39.4%
Public 60.6%
EPS 16F 17F
Consensus (Rp) NA NA
TRIM vs Cons. (%) NA NA
Company Update
Stock Data
Major Shareholders
Consensus
Stock Price
Year end Dec 2014 2015 2016F 2017F 2018F
Revenue (USDmn) 607 566 565 703 797
Net profit (USDmn) 15 (8) 36 71 89
Core profit (USDmn) 16 25 36 71 89
EPS Growth na na na 98.6% 25.2%
Core EPS Growth 426.4% 54.3% 41.6% 98.6% 25.2%
P/E (x) 22.6 -39.7 8.8 4.4 3.5
Core P/E (x) 21.4 13.1 8.8 4.4 3.5
P/BV (x) 3.7 3.7 2.6 1.6 1.1
Div. Yield 0.0% 0.0% 0.0% 0.0% 0.0%
EBITDA growth -1% 1% 2% 26% 14%
EV/EBITDA 4.68 4.65 4.55 3.60 3.16

PT Trimegah Securities Tbk - www.trimegah.com MARKET OUTLOOK 199
Income Statement (USDmn)
Year end Dec 2014 2015 2016F 2017F 2018F
Revenue 607 566 565 703 797
Revenue growth -13% -7% 0% 24% 13%
Cost of revenue -485 -440 -440 -523 -587
Gross profit 123 126 125 180 210
Opex -43 -38 -35 -45 -51
Op. Profit 79 88 90 134 159
Op. profit growth 24% 10% 3% 49% 18%
EBITDA 185 186 190 241 274
EBITDA growth -1% 1% 2% 26% 14%
Net int. inc./(exp) 45 48 47 48 48
Gain/(loss) Forex -1 -14 0 0 0
Assoc. earnings 0 0 0 0 0
Other inc./(exp.) -13 -16 0 0 0
Pre-tax profit 27 -6 47 94 118
Pre-tax growth -196% na na 99% 25%
Tax -12 -3 -12 -24 -30
Minority Int. 0 0 0 0 0
Net profit 15 -8 36 71 89
Net profit growth -153% na na 99% 25%
Balance Sheet (USDmn)
Year end Dec 2014 2015 2016F 2017F 2018F
Cash 75 71 130 109 174
Receivables - net 145 139 139 173 196
Inventory 24 20 20 24 26
Other curr asset 57 78 78 78 78
Current assets 302 308 367 384 475
Net fixed asset 427 379 359 373 378
Other non curr. asset 57 38 38 38 38
Non-current assets 603 524 504 518 522
Total asset 905 832 871 902 997
ST debt 57 47 47 47 47
Other curr liab 31 26 26 26 26
Current liabilities 127 103 103 108 112
LT debt 661 614 618 573 576
Other LT Liab 24 30 30 30 30
Non-curr. liabilities 686 644 648 603 606
Total liabilities 813 747 750 710 717
Minority interest 0 0 0 0 0
Sh. equity 92 85 121 191 280
Net debt / (cash) 643 591 535 511 449
Net Working capital 175 205 264 276 363
Cash Flow (USDmn) Key Ratio Analysis
Interim Result (USDmn) Capital History
Date
15-Jun-01 IPO@Rp150
14-Jul-04 Right issue@Rp110
13-Jul-11 Right issue@Rp900
Year end Dec 2014 2015 2016F 2017F 2018F
EBIT 185 186 190 241 274
Dep. & amort. 106 98 100 106 115
Change In non-cash
working cap. -31 8 0 -33 -22
Others 4 -37 0 0 0
CF operations 77 119 136 144 182
Capex -40 -46 -80 -120 -120
Others -17 3 0 0 0
CF investing -58 -44 -80 -120 -120
Net change in debt -160 -77 3 -45 3
Equity raised 0 0 0 0 0
Dividends 0 0 0 0 0
Others 0 0 0 0 0
CF financing -160 -77 3 -45 3
Net cash flow -140 -2 59 -21 65
Others 0 -3 0 0 0
Cash at BoY 215 75 71 130 109
Cash at EoY 75 71 130 109 174
Free Cashflow 80 185 88 54 92
3Q15 4Q15 1Q16 2Q16 3Q16
Sales 152 147 127 132 159
Gross Profit 43 32 22 29 48
EBITDA 57 47 38 43 58
Opr. Profit 33 23 15 19 35
Net profit 7 -5 -2 5 22
Gross Margins 28% 22% 17% 22% 30%
EBITDA Margin 38% 32% 30% 32% 37%
Opr. Margins 22% 16% 11% 14% 22%
Net Margins 4% -3% -1% 4% 14%
Year end Dec 2014 2015 2016F 2017F 2018F
Profitability Gross Margin (%) 20.2% 22.2% 22.2% 25.6% 26.4%
Opr Margin (%) 13.1% 15.5% 15.9% 19.1% 19.9%
EBITDA Margin (%) 30.4% 32.9% 33.7% 34.2% 34.4%
Net Margin (%) 2.5% -1.5% 6.3% 10.1% 11.1%
ROAE (%) 19.3% -9.4% 34.6% 45.3% 37.6%
ROAA (%) 1.6% -1.0% 4.2% 8.0% 9.3%
ROIC (%) 2.1% -1.2% 5.4% 10.1% 12.1%
Stability
Current ratio (x) 9.8 11.9 14.1 14.8 18.3
Net Debt to Equity (x) 7.0 7.0 4.4 2.7 1.6
Net Debt to EBITDA (x) 3.5 3.2 2.8 2.1 1.6
Interest Coverage (x) 1.9 1.9 2.0 3.0 3.6
Efficiency
Receivables (days) 87 90 90 90 90
Inventory (days) 18 16 16 16 16
A/P (days) 22 22 22 22 22

PT Trimegah Securities Tbk - www.trimegah.com MARKET OUTLOOK 200
Others

MARKET OUTLOOK PT Trimegah Securities Tbk - www.trimegah.com 201
Reiterate BUY on JPFA with TP of IDR2,500
We continue to like JPFA as our top pick in poultry industry. The busi-
ness continues to exhibit a turnaround story as we expect a higher DOC
price in 4Q16 following another festive season. In Oct’16, we recorded
DOC price at IDR6,100 (+8% MoM), according to Arboge. Broiler price
might be slightly lower QoQ, but we view the price will remain stable at
above IDR17,000 (compared to COGS level at around IDR15,500-
16,000). Hence, we believe JPFA’s 2016F segment will post a good
margin, even comparable to the golden year of poultry (before the over-
supply condition). We expect the turnaround story to continue next
year, as Govt has control current supply (as reflected through the stable
market price) and the upcoming ones (through limitation of imported
GPS or Grand Parent Stock). JPFA currently trades at an undemanding
valuation of 7.8x 2017F PE (vs CPIN at 15.0x and MAIN at 8.6x). Our
new TP of IDR2,500 implies 11.1x 2017F PE, a discount of 32% (based
on avg. 5-years historical discount) to CPIN’s valuation.
Re-financing plan with another bond issuance
JPFA will issue a 3-years bond by end of 2016F of IDR1trn with coupon
rate of 9-9.5%. The proceeds will then be used for: 1) refinancing JPFA
bond stage I of IDR1.5trn that will mature by Jan/Feb 2017, 2) bank
loan repayment, and 3) working capital. In 2018F, JPFA will issue anoth-
er 5-years bond of IDR2trn with coupon rate of 9.5-10.0% to re-finance
its USD bond that will mature by May 2018F. Thanks to a lower bank
loan and higher equity level, JPFA’s net debt to equity will be down to
0.5/0.2x in 2016/17F (vs 1.1x in 2015).
Cartel accusation from KPPU: Impact to 2016F earnings <1%
Following court decision on cartel issue towards poultry companies, JPFA
is required to pay fine of IDR25bn (which will be recorded in 4Q16).
CPIN will also required to pay fine of IDR25bn, but MAIN of IDR10.8bn.
The fine is fortunately give less impact towards JPFA as it reduces our
2016F earnings by merely 0.79% (vs CPIN and MAIN by 0.68% and
5.12% respectively).
Year end Dec 2014 2015 2016F 2017F 2018F
Sales (Rpbn) 24,459 25,023 27,012 28,353 31,073
EBITDA (Rpbn) 1,688 1,921 4,204 4,498 5,003
Net Profit (Rpbn) 332 468 2,324 2,549 2,860
EPS (Rp) 29 41 205 225 252
EPS Growth (%) -44% 41% 396% 10% 12%
DPS (Rp) 9 15 45 45 50
BVPS (Rp) 419 495 781 866 1,068
EV/EBITDA (x) 12.0 10.2 4.4 3.6 3.0
P/E (x) 54.1 38.4 7.7 7.1 6.3
Div Yield (%) 0.6% 0.9% 2.8% 2.8% 3.2%
Japfa Comfeed Indonesia A surprise from the chicken business
Companies Data
Japfa is currently the second largest ani-
mal feed producer in Indonesia with
market share of ~22%. Its business in-
clude upstream, midstream, and down-
stream of poultry, beef, and aquaculture.
Share Price Rp1,585
Sector Poultry
Price Target Rp2,500 (+58%)
BUY Rp2,500
Reuters Code JPFA.JK
Bloomberg Code JPFA.IJ
Issued Shares 11,340
Mkt Cap. (Rpbn) 17,974
Avg. Value Daily 6
Month (Rpbn) 12.8
52-Wk range 1975 / 430
Japfa Ltd. 51.0%
KKR Jade Investments Pte Ltd 12.0%
Public (<5%) 36.8%
Treasury stock 0.2%
EPS 16F 17F
Consensus (Rp) 154 163
TRIM vs Cons. (%) 33.2% 38.1%
Company Update
Stock Data
Major Shareholders
Consensus
Stock Price
Patricia Gabriela
0.0
5.0
10.0
15.0
20.0
25.0
30.0
0
500
1000
1500
2000
2500
Nov-15 Jan-16 Mar-16 May-16 Jul-16 Sep-16
(Rpbn)Avg. 5 Day MA Trading Value (RHS)Series1

PT Trimegah Securities Tbk - www.trimegah.com MARKET OUTLOOK 202
Forecast changes
JPFA has posted a remarkable 9M16 result, hence we tweaked up our number on JPFA. Volume wise, we reduced
animal feeds and aquaculture as we see a softer demand up to 9M16. However, we expect a higher margin on all
of its segment (animal feeds, DOC, broiler, and cattle), except in aquaculture as the price came lower than ex-
pected. All in all, our JPFA’s revenue forecast down by 1/4% in 2016/17F on the back of slower volume.
Gross profit improved by 260/310bps in 2016/17F thanks to a higher than expected market price; primarily a
jump in cattle price that reach above IDR90,000 in 3Q16. Nevertheless, we view the price will be back to its nor-
mal level at around IDR40,000 in 2017F. We also forecast a lower 2016/17F interest expense as company has
paid off its bank loan amounted to IDR1.7trn. Our new forecast has upped JPFA’s 2016/17F earnings by 68/56%,
mainly thanks to margin expansion.
Figure 100. Forecast changes
Source: TRIM Research
Old New Change (%)
2016F 2017F 2018F 2016F 2017F 2018F 2016F 2017F 2018F
Volume
Animal feeds (mn tons) 2.8 2.9 3.1 2.7 2.8 2.9 -5% -4% -7%
DOC (mn birds) 573 595 663 589 623 663 3% 5% 0%
Live bird (‘000 tons) 570 600 638 581 600 638 2% 0% 0%
Aquaculture (‘000 tons) 239 254 270 226 239 254 -5% -6% -6%
Live cattle (‘000 tons) 30 31 31 30 31 31 0% 0% 0%
Revenue 27,164 29,464 33,204 27,012 28,353 31,073 -1% -4% -6%
Animal feeds 16,421 17,221 19,278 15,729 16,650 18,139 -4% -3% -6%
DOC 3,870 4,403 5,304 3,976 4,548 5,238 3% 3% -1%
Live bird 10,384 11,160 12,100 10,571 11,160 12,100 2% 0% 0%
Aquaculture 2,695 3,078 3,514 2,303 2,504 2,748 -15% -19% -22%
Live cattle 1,225 1,343 1,492 1,856 1,282 1,411 52% -5% -5%
Trading and others 1,625 1,820 2,002 1,342 1,409 1,522 -17% -23% -24%
Elimination (9,055) (9,561) (10,486) (8,766) (9,201) (10,083) -3% -4% -4%
Gross profit 5,152 5,666 6,670 5,840 6,318 6,976 13% 11% 5%
EBIT 2,648 2,935 3,428 3,580 3,824 4,274 35% 30% 25%
Net profit 1,381 1,638 1,979 2,324 2,549 2,860 68% 56% 45%
EPS 122 144 175 205 225 252 68% 56% 45%
Margin (%)
Gross 19.0% 19.2% 20.1% 21.6% 22.3% 22.4%
EBIT 9.7% 10.0% 10.3% 13.3% 13.5% 13.8%
Net 5.1% 5.6% 6.0% 8.6% 9.0% 9.2%

PT Trimegah Securities Tbk - www.trimegah.com MARKET OUTLOOK 203
Income Statement (Rpbn)
Year end Dec 2014 2015 2016F 2017F 2018F
Revenue 24,459 25,023 27,012 28,353 31,073
Revenue Growth (%) 14.2% 2.3% 8.0% 5.0% 9.6%
Gross Profit 3,426 3,993 5,840 6,318 6,976
Opr. Profit 1,276 1,728 3,324 3,639 4,080
EBITDA 1,688 1,921 4,204 4,498 5,003
EBITDA Growth (%) -4.2% 13.8% 118.8% 7.0% 11.2%
Net Int Inc/(Exp) (678) (663) (414) (358) (394)
Gain/(loss) Forex (78) (479) 200 100 100
Other Inc/(Exp) 22 112 56 85 93
Pre-tax Profit 543 698 3,167 3,466 3,879
Tax (158) (173) (786) (860) (963)
Minority Int. 52 56 56 56 56
Extra. Items - - - - -
Reported Net Profit 332 468 2,324 2,549 2,860
Core Net Profit 410 947 2,124 2,449 2,760
growth (%) -44.2% 40.9% 396.4% 9.7% 12.2%
Dividend per share 10 15 45 45 50
growth (%) -50.0% 50.0% 200.6% -0.3% 12.2%
Dividend payout ratio 32.0% 34.1% 22.0% 20.0% 20.0%
Balance Sheet (Rpbn)
Year end Dec 2014 2015 2016F 2017F 2018F
Cash and eq. 768 901 769 2,754 4,031
Other curr asset 7,941 8,703 8,753 9,310 10,161
Net fixed asset 6,362 6,809 7,002 7,226 7,484
Other asset 688 746 818 657 676
Total asset 15,759 17,159 17,343 19,957 22,352
ST debt 2,491 2,064 709 432 442
Other curr liab 2,425 3,288 2,857 2,958 3,200
LT debt 4,742 4,757 2,941 4,204 3,510
Other LT Liab 921 940 940 940 940
Minority interest 425 498 1,037 1,596 2,145
Total Liabilities 10,579 11,050 7,448 8,535 8,093
Shareholders Eq. 4,755 5,612 8,858 9,826 12,114
Net (debt) / cash 6,465 5,920 2,881 1,872 (79)
Total cap employed 10,843 11,807 13,776 16,566 18,710
Net Working capital 3,793 4,251 5,956 8,684 10,550
Debt 7,233 6,821 3,650 4,637 3,952
Cash Flow (Rpbn)
Year end Dec 2014 2015 2016F 2017F 2018F
Net Profit 332 468 2,324 2,549 2,860
Depr / Amort 468 561 624 674 730
Chg in Working Cap 341 102 (482) (455) (609)
CF's from oprs 1,141 1,131 2,466 2,768 2,981
Capex (1,557) (1,008) (817) (898) (988)
Others (29) (58) (72) 161 (19)
CF's from investing (1,586) (1,066) (889) (737) (1,007)
Dividend (106) (160) (511) (510) (572)
Others (430) 199 (1,198) 474 (135)
CF's from financing (537) 39 (1,710) (36) (707)
Net cash flow (982) 104 (132) 1,995 1,267
Cash at BoY 1,746 769 901 769 2,764
Cash at EoY 769 901 769 2,764 4,031
Free Cashflow (416) 123 1,650 1,870 1,993
Key Ratio Analysis
Year end Dec 2014 2015 2016F 2017F 2018F
Profitability
Gross Margin (%) 14.0 16.0 21.6 22.3 22.4
Opr Margin (%) 5.2 6.9 12.3 12.8 13.1
EBITDA Margin (%) 6.9 7.7 15.6 15.9 16.1
Core Net Margin (%) 1.7 3.8 7.9 8.6 8.9
ROAE (%) 7.0 9.0 32.1 27.3 26.1
ROAA (%) 2.2 2.8 13.5 13.7 13.5
Stability Current ratio (x) 1.8 1.8 2.7 3.6 3.9
Net Debt to Equity (x) 1.4 1.1 0.3 0.2 (0.0)
Net Debt to EBITDA (x) 3.8 3.1 0.7 0.4 (0.0)
Interest Coverage (x) 1.8 2.0 8.3 10.2 10.4
Efficiency A/P (days) 28 43 47 42 40
A/R (days) 19 19 18 18 18
Inventory (days) 86 95 98 93 91
Interim Result (Rpbn) Capital History
Date
23-Oct-89 IPO@Rp1,000
19-Apr-13 Stock split
3Q15 4Q15 1Q16 2Q16 3Q16
Net Sales 6,587 6,287 6,434 7,108 7,059
Gross Profit 1.205 1,285 1,117 1,596 1,685
EBITDA 550 999 712 1,173 1,364
Opr. Profit 407 853 570 989 1,190
Net Profit 125 616 277 687 761
Core Profit 471 481 150 697 716
Gross Margins (%) 18.3% 20.4% 17.4% 22.5% 23.9%
EBITDA Margins (%) 8.4% 15.9% 11.1% 16.5% 19.3%
Opr Margins (%) 6.2% 13.6% 8.9% 13.9% 16.9%
Net Margins (%) 1.9% 9.8% 4.3% 9.7% 10.8%
Core Margins (%) 7.2% 7.6% 2.3% 9.8% 10.1%

MARKET OUTLOOK PT Trimegah Securities Tbk - www.trimegah.com 204
Beneficiary of coal price rally and low oil price condition
AKRA is a beneficiary of coal industry new up-cycle as 30% of AKRA’s
distribution volume is derived from coal mining companies. Note that coal
price has rallied ~100% YTD 2016. Not only big coal miners are benefit-
ing from coal price rally, but several small players are getting ready to
get back in to the coal game witnessed from UNTR’s heavy equipment 3
months waiting list (first ever since 5 years!). We expect 2017 petroleum
distribution volume to grow by +12.5% YoY amounting to 2.3m kl mainly
driven by the mining industry’s rise in production. This should offset any
potential margin squeeze should oil price bounce significantly. It is worth
noting that AKRA’s share price de-correlates against oil price by –0.77.
With growth on volumes from the mining industry coupled with visibility
on sustainable margin spread above IDR1,000/litre due to low oil price,
we believe AKRA holds solid footing for next year’s outlook.
JIIPE is a long-term positive
Although execution risk on JIIPE land sales remain, we are still bullish on
the project in the long-run given strong government focus on infrastruc-
ture investments. We expect AKRA to book marketing sales of 39ha in
2017 with ASP price of IDR2m/m2 (a justified premium). AKRA’s IDR627
worth of bonds will mature in Dec’ 17 (id AA-, 8.4% rate). However,
given AKRA’s strong balance sheet with 9M16 cash position of IDR903bn
and net gearing of 46.5%, we believe AKRA has the bargaining power for
a potential re-financing at lower rate or settle its face value with a rela-
tively mild disruption on its balance sheet.
Valuation
AKRA is currently trading at 2017-18 P/E of 20.1x/16.4x 2017-18 P/E,
+11.9% premium to 3-years historical forward P/E but –8.4% discount to
its 3-years historical forward P/E. Given its healthier balance sheet and
higher visibility on long-term recurring income coming from JIIPE cus-
tomers, we believe a re-rating is justified. We have a BUY call with SOP
based TP of IDR7,300 with JIIPE contributing ~IDR1.5trn (~5%) of total
SOP value.
AKR Corporindo Time To Outperform in 2017
BUY Rp7,300
PT Arthakencana Rayatama 59.2%
Public 40.8%
Company Update
Stock Data
Major Shareholders
Stock Price Companies Data
Willinoy Sitorus
PT AKR Corporindo Tbk distributes chemical
products such as caustic soda, Polyvinyl
Chloride (PVC) resin, sorbitol, soda ash, and
sodium sulfate. Through its subsidiaries, the Company also manufactures chemicals,
operates storage tanks and warehouses, a
storage tanks and warehouses, and provides
logistic services.
Share Price Rp6,450
Sector Logistics & Distribution
Price Target Rp7,300 (+13%)
Reuters Code AKRA.JK
Bloomberg Code AKRA.IJ
Issued Shares 3,992
Mkt Cap. (Rpbn) 25,747
Avg. Value Daily 6
Month (Rpbn)
33.0
52-Wk range 8450 / 5725
Year end Dec 2014 2015 2016E 2017E 2018E
Revenue (Rp bn) 22,468 19,765 15,328 19,113 23,791
Net profit (Rp bn) 810 1,034 1,105 1,282 1,570
EPS (Rp bn) 209 262 277 321 393
EPS growth (%) 24.9 27.6 6.9 16.0 22.4
P/E (x) 30.9 24.6 23.3 20.1 16.4
P/B (x) 4.6 4.2 3.8 3.4 3.0
EV/EBITDA (x) 20.9 15.4 15.0 11.8 10.0
Div yield (%) 1.0 2.0 1.8 1.7 2.0
Consensus
EPS 16E 17E
Consensus (Rp) 282 322
TRIM vs Cons. (%) -1.7% -0.3%
0.0
50.0
100.0
150.0
200.0
250.0
0
1000
2000
3000
4000
5000
6000
7000
8000
9000
Nov-15 Jan-16 Mar-16 May-16 Jul-16 Sep-16
(Rpbn)Avg. 5 Day MA Trading Value (RHS)Series1

PT Trimegah Securities Tbk - www.trimegah.com MARKET OUTLOOK 205
Figure 105. Historical forward P/E
Source: Company, Trimegah research, Bloomberg
Source: Company
Figure 101. Quarterly revenue & op. profit Figure 102. Quarterly Net profit
Source: Company
5,7315,4794,801
5,4724,7614,731
3,5723,7963,584
282 273 403 375 309 358 272 404 307
4.9% 5.0%
8.4%
6.8% 6.5%
7.6% 7.6%
10.6%
8.6%
0.0%
2.0%
4.0%
6.0%
8.0%
10.0%
12.0%
0
2,000
4,000
6,000
8,000
10,000
12,000
3Q14 4Q14 1Q15 2Q15 3Q15 4Q15 1Q16 2Q16 3Q16
Revenue Op. profit Op. margin (RHS)
(IDR bn)
203231
295 310
213 221255
331
208
3.5%4.2%
6.1%5.7%
4.5% 4.7%
7.1%
8.7%
5.8%
-2.0%
0.0%
2.0%
4.0%
6.0%
8.0%
10.0%
0
50
100
150
200
250
300
350
400
450
500
550
3Q14 4Q14 1Q15 2Q15 3Q15 4Q15 1Q16 2Q16 3Q16
Net profit Net margin (RHS)
(IDR bn)
Source: Company
Figure 103. Revenue breakdown, 9M16 Figure 104. Revenue breakdown, 9M15
Source: Company
Petroleum
67%
Chemical
22%
Manufacturing
4%
Logistics
5%Industrial
estate land2%
Others0%
Petroleum
74%
Chemical17%
Manufacturing
4%
Logistics
4%Industrial
estate land
1%
Others
0%
15.0
18.0
21.0
24.0
27.0
30.0
Historical forward P/E Average
(x)

PT Trimegah Securities Tbk - www.trimegah.com MARKET OUTLOOK 206
Income Statement (IDRbn) Balance Sheet (IDRbn)
Cash Flow (IDRbn)
Interim results
Year end Dec 2014 2015 2016F 2017F 2018F
Revenue 22,468 19,765 15,328 19,113 23,791
Growth (%) 0.6% -12.0% -22.4% 24.7% 24.5%
Gross profit 1,732 2,216 2,130 2,724 3,229
Op. profit 1,036 1,408 1,471 1,921 2,277
EBITDA 1,352 1,820 1,908 2,390 2,776
Growth (%) 4.4% 34.6% 4.9% 25.2% 16.2%
Net int. inc./(exp) -77 -25 -57 -74 -58
Gain/(loss) forex 16 -63 70 0 0
Other inc./(exp.) 18 7 5 3 3
Pre-tax profit 993 1,327 1,489 1,850 2,222
Tax 203 268 314 390 465
Minority int. 20 -25 -70 -179 -188
Net profit 810 1,034 1,105 1,282 1,570
Growth (%) 24.9% 27.6% 6.9% 16.0% 22.4%
Year end Dec 2014 2015 2016F 2017F 2018F
Cash and equivalents 897 1,290 1,182 762 943
Other current assets 5,804 5,996 5,836 6,928 8,401
Net fixed asset 4,390 4,469 4,560 4,620 4,726
Other asset 3,699 3,448 3,598 3,498 3,398
Total asset 14,790 15,203 15,177 15,808 17,468
ST debt 1,612 946 1,144 1,009 809
Other curr. liab . 4,572 3,926 3,047 3,661 4,464
LT debt 2,515 2,911 2,852 2,164 2,164
Other LT liab. 132 135 135 135 135
Minority interest 571 1,196 1,196 1,196 1,196
Total liabilities 8,831 7,917 7,178 6,969 7,572
Shareholders equity 5,389 6,090 6,803 7,643 8,700
Net debt/(cash) 3,230 2,566 2,814 2,411 2,030
Debt 4,126 3,856 3,996 3,173 2,973
Year end Dec 2014 2015 2016F 2017F 2018F
Net profit 810 1,034 1,105 1,282 1,570
Depr. / amort. 316 411 437 468 499
Chg in working
cap. 1,204 661 -354 -85 -101
Others 453 748 -29 -38 -38
CF operations 2,783 2,854 1,159 1,627 1,930
Capex -480 -491 -528 -528 -605
Others -1,016 -1,368 -487 -254 -431
CF investing -1,495 -1,858 -1,015 -782 -1,036
Net change in debt -1,019 -270 140 -823 -200
Dividend -254 -512 -473 -442 -513
Others 62 172 82 0 0
CF financing -1,211 -611 -252 -1,265 -713
Net cash flow 76 385 -107 -420 181
Cash at BoY 820 897 1,290 1,182 762
Cash at EoY 897 1,290 1,182 762 943
Year end Dec 3Q15 4Q15 1Q16 2Q16 3Q16
Sales 4,761 4,731 3,572 3,796 3,584
Gross profit 490 576 442 567 465
Opr. profit 324 307 276 399 307
Net profit 240 188 255 330 209
Gross margin (%) 10.3% 12.2% 12.4% 14.9% 13.0%
Opr. margin (%) 6.8% 6.5% 7.7% 10.5% 8.6%
Net margin (%) 5.0% 4.0% 7.1% 8.7% 5.8%
Year end Dec 2014 2015 2016F 2017F 2018F
Profitability Gross Margin (%) 7.7% 11.2% 13.9% 14.3% 13.6%
Opr Margin (%) 4.6% 7.1% 9.6% 10.1% 9.6%
EBITDA Margin (%) 6.0% 9.2% 12.4% 12.5% 11.7%
Core Net Margin (%) 3.5% 5.5% 6.7% 6.7% 6.6%
ROAE (%) 15.9% 18.0% 17.1% 17.7% 19.2%
ROAA (%) 5.5% 6.9% 7.3% 8.3% 9.4%
Stability
Current ratio (x) 1.1 1.5 1.7 1.6 1.8
Net Debt to Equity (x) 0.6 0.4 0.4 0.3 0.2
Net Debt to EBITDA
(x) 2.4 1.4 1.5 1.0 0.7
Interest Coverage (x) 7.5 12.2 15.0 19.1 25.1
Efficiency
A/P (days) 70 71 69 69 69
A/R (days) 70 56 63 60 58
Inventory (days) 70 71 69 69 69
Key Ratio Analysis
Capital History
Date
Equity offering amounting to
IDR443bn (02/02/10)
Placing price - IDR1,055

MARKET OUTLOOK PT Trimegah Securities Tbk - www.trimegah.com 207
Gas price cut issue well priced in, only upside on the cards
We have a BUY with EV/IC based TP of IDR3,300 (from IDR2,650) as we
upgrade 2017-18 earnings by +10.7%/+15.0% respectively on higher
volumes (+2.8%/+11.6% to 830mmscfd/901mmscfd in 2017-18 re-
spectively) and higher oil price (we expect 2017 oil price of USD60/
barrel, up 28% YoY). Our EV/IC TP methodology uses 7.1% WACC,
2023 terminal ROIC of 12% and LT growth of 2%. Our BUY call is prem-
ised on: 1.) Higher certainty on the net effect of gas price cut going
forward (most likely neutral impact to PGAS in our view), 2.) The visible
PGAS & Pertagas M&A would provide a long-term positive synergy in
booking gas volume growth (would transform to a dominant player in
upstream & mid-stream). PGAS is trading at 10.2x/9.1x 2016-17 core P/
E, 40%/46% discount to 3-years historical forward P/E.
PGAS-Pertamina M&A is a positive catalyst rather than negative
PGAS upstream gas supply is heavily dependent on Conoco Phillip’s gas
supply in Grissik (~80% of PGAS’ gas supply from distribution & trans-
mission) and reserves life is questionable over the long-run. Hence, it
would be better for PGAS to be acquired by Pertamina as Pertamina has
the largest O&G 2P reserves in Indonesia and its assets are well spread
across Indonesia. Also, ~15% of PGAS gas supply comes from Pertami-
na. Hence when its long-term contract expires by ~2019, there is a high
probability that Pertamina may refuse to extend its contract with PGAS.
Thus, we safely say that PGAS would not be in a better position anyway
should this M&A deal is called-off. With this M&A, the structure will cre-
ate a monopoly or if not, a very dominant integrated SOE giant in the
O&G upstream and distribution sector. This would ensure strong gas
infrastructure acceleration as a back bone to economic growth. The M&A
deal will likely take effect by end of this year.
We expect gas price cut would mildly affect distribution spread
The govt plans to cut gas price for fertilizer, steel and petrochemical
industries to USD6/mmbtu which will be effective by 1 Jan’ 17. These
industries contributes around ~17% of PGAS’ distribution volumes. We
expect the gas price cuts would only apply for companies that have
direct access to gas well head and if PGAS gas price is affected, most
likely a gas price cut from the upstream well-head would follow suit
ensuring margins would remain intact in our view.
PGAS is a state owned company which
distributed 802mmscfd of gas in FY15. It
holds a market share of more than 75%
in the gas distribution business.
Share Price Rp2,620
Sector Gas
Price Target Rp3,300 (+26%)
Year end Dec 2014 2015 2016E 2017E 2018E
Revenue (USDm) 3,253 3,069 2,970 3,210 3,521
Core profit (USDm) 668 474 455 508 582
Core profit growth -14.0% -29.1% -3.9% 11.7% 14.5%
Core EPS (IDR) 338 253 257 288 329
BVPS (IDR) 1,475 1,682 1,831 2,037 2,248
Core P/E (x) 7.8 10.3 10.2 9.1 8.0
P/B (x) 1.8 1.6 1.4 1.3 1.2
EV/EBITDA (x) 5.5 7.6 7.0 6.0 5.1
Div. yield (%) 8.7 5.7 3.4 3.5 4.3
Perusahaan Gas Negara The Inflection Point Of Earnings Recovery
BUY Rp3,300
Willinoy Sitorus
Reuters Code PGAS.JK
Bloomberg Code PGAS.IJ
Issued Shares 24,242
Mkt Cap. (Rpbn) 63,513
Avg. Value Daily 6
Month (Rpbn) 145.2
52-Wk range 3520 / 2170
Republic of Indonesia 57.0%
Public 43.0%
EPS 16F 17F
Consensus (IDR) 226 236
TRIM vs Cons. (%) 10.8% 18.3%
Company Update
Stock Data
Major Shareholders
Consensus
Stock Price
Companies Data
0.0
50.0
100.0
150.0
200.0
250.0
300.0
350.0
400.0
450.0
500.0
0
500
1000
1500
2000
2500
3000
3500
4000
Nov-15 Jan-16 Mar-16 May-16 Jul-16 Sep-16
(Rpbn)Avg. 5 Day MA Trading Value (RHS)Series1

PT Trimegah Securities Tbk - www.trimegah.com MARKET OUTLOOK 208
Figure 106. Earnings and operational figures revision
Source: Trimegah research
Figure 107. Gas margin spread sensitivity analysis
Source: Trimegah research
(USDm) New Old Change
2017F 2018F 2017F 2018F 2017F 2018F
Revenue 3,210 3,521 3,204 3,490 0.2% 0.9%
Gross profit 1,067 1,185 1,076 1,163 -0.9% 1.8%
Gross margin 33.2% 33.6% 33.6% 33.3%
Operating profit 653 733 613 661 6.5% 11.0%
Op. profit margin 20.3% 20.8% 19.1% 18.9%
Pre-tax profit 631 723 578 637 9.1% 13.5%
Pre-tax margin 19.7% 20.5% 18.1% 18.2%
Core profit 508 582 459 506 10.7% 15.0%
Net margin 15.8% 16.5% 14.3% 14.5%
Distribution volume (mmscfd) 830 901 815 808 1.8% 11.6%
Distribution ASP (USD/mmbtu) 9.1 9.2 9.2 9.1 -1.2% 0.8%
Gas purchase (USD/mmbtu) 6.1 6.2 6.2 6.3 -1.4% -1.3%
Margin spread (USD/mmbtu) 3.0 3.0 3.0 2.8 -0.8% 5.4%
Margin spread Trimegah Earnings revision Target* Chg. In
(USD/mmbtu) Core profit (USDm) price target price
2017F 2018F 2017F 2018F 2017F 2018F (IDR) (IDR)
15.0% 3.5 3.4 602 685 18.5% 17.7% 3,330 11%
10.0% 3.3 3.3 569 648 11.9% 11.4% 3,220 7%
5.0% 3.2 3.1 542 619 6.6% 6.3% 3,110 4%
Base case 3.0 3.0 508 582 0.0% 0.0% 3,000 0.0%
-5.0% 2.9 2.8 475 545 -6.6% -6.3% 2,880 -4%
-10.0% 2.7 2.7 441 509 -13.2% -12.6% 2,770 -8%
-15.0% 2.6 2.5 408 472 -19.8% -18.9% 2,660 -11%

PT Trimegah Securities Tbk - www.trimegah.com MARKET OUTLOOK 209
Income Statement (USDm)
Year end Dec 2014 2015 2016F 2017F 2018F
Revenue 3,253 3,069 2,970 3,210 3,521
Revenue growth (%) 8.4% -5.7% -3.2% 8.1% 9.7%
Gross Profit 1,285 963 963 1,067 1,185
Opr. profit 854 574 595 653 733
EBITDA 1,073 850 887 974 1,057
EBITDA growth (%) -3% -21% 4% 10% 8%
Net int. inc/(exp.) -42 -101 -92 -84 -73
Gain/(loss) forex 49 -14 -56 0 0
Other inc./(exp) 73 -14 62 63 63
Pre-tax Profit 935 445 509 631 723
Tax 224 43 102 126 145
Minority interest 0 2 3 3 3
Extra. items 0 0 0 0 0
Core profit 668 474 455 508 582
Core profit growth
(%)
-14% -29% -4% 12% 14%
Balance Sheet (USDm)
Year end Dec 2014 2015 2016F 2017F 2018F
Cash and equivalents 1,131 1,136 1,242 1,378 1,528
Trade receivables 295 287 277 300 329
Inventory 63 43 41 44 48
Other curr. assets 247 257 257 258 259
PPE 1,826 1,929 2,245 2,338 2,337
O&G properties 1,417 1,636 1,502 1,346 1,199
Other assets 712 1,207 1,261 1,313 1,365
Total assets 5,690 6,495 6,826 6,976 7,065
ST debt 48 122 88 88 88
Other curr. liab. 621 546 540 548 558
LT debt/bonds 1,805 2,587 2,710 2,510 2,210
Other LT liab. 340 218 218 218 218
Total liabilities 2,814 3,472 3,556 3,364 3,074
Minority interest 0 2 6 9 13
Total equity 2,875 3,020 3,264 3,603 3,978
Total liab. & equity 5,690 6,495 6,826 6,976 7,065
Cash Flow (USDm)
Year end Dec 2014 2015 2016F 2017F 2018F
Core net profit 668 474 455 508 582
Depr. / amort. 111 428 319 345 349
Chg. in working cap. -113 6 6 -18 -22
Others 122 -379 -51 -8 -8
CF's from oprs 787 528 729 828 900
Capex -1,434 -751 -501 -281 -201
ST investments -7 28 0 0 0
Others 122 -399 -54 -52 -52
CF's from investing -1,318 -1,122 -555 -333 -253
Net change in debt 1,219 856 89 -200 -300
Others -686 -261 -157 -158 -197
CF's from financing 533 595 -68 -358 -497
Net cash flow 2 1 106 136 150
Forex/others -105 3 0 0 0
Cash at BoY 1,234 1,131 1,136 1,242 1,378
Cash at EoY 1,131 1,136 1,242 1,378 1,528
Key Ratio Analysis
Year end Dec 2014 2015 2016F 2017F 2018F
Profitability Gross margin (%) 39.5% 31.4% 32.4% 33.2% 33.6%
Op. margin (%) 26.2% 18.7% 20.0% 20.3% 20.8%
EBITDA margin (%) 33.0% 27.7% 29.9% 30.3% 30.0%
Core net margin (%) 20.5% 15.4% 15.3% 15.8% 16.5%
ROAE (%) 25.9% 13.6% 12.8% 14.6% 15.2%
ROAA (%) 14.5% 6.6% 6.1% 7.3% 8.2%
Stability
Current ratio (x) 2.6 2.6 2.9 3.1 3.3
Net debt to equity (x) 0.3 0.5 0.5 0.3 0.2
Net debt to EBITDA (x) 0.8 2.0 1.9 1.4 0.9
Interest coverage (x) 11.6 4.8 5.4 6.2 7.7
Efficiency
A/R (days) 31 35 35 33 33
Inventory (days) 7 9 8 7 7
A/P (days) 137 116 118 108 100
Capital History
Date
IPO date - 15/12/03 IPO @ Rp. 1,500
Interim Results (USDm)
Year end Dec 3Q15 4Q15 1Q16 2Q16 3Q16
Sales 722 931 720 719 716
Gross profit 224 260 224 223 219
Op. profit 133 143 158 104 132
Pre-tax profit 100 59 133 45 117
Net profit 79 95 101 52 90
Gross margin (%) 31.0% 28.0% 31.0% 31.0% 30.5%
Op. margin (%) 18.3% 15.4% 21.9% 14.5% 18.5%
Net margin (%) 10.9% 10.2% 14.0% 7.2% 12.5%

MARKET OUTLOOK PT Trimegah Securities Tbk - www.trimegah.com 210
J Resources Asia Pacific Hedge against uncertainty
Sandro Sirait
Maintain BUY with TP of IDR400 (52% ups)
We derive our TP from DCF-based valuation method, with WACC of
6.0%, assuming its life of mine until 2029 with 0% long term growth
afterwards. Our TP implies 10.8x/8.3x PE and 4.9x/4.5x EV/EBITDA
2017/18F. We recommend this stock as a hedge against uncertainty
backed by: 1) The only pure-gold player in Indonesia, 2) High exposure
to gold price with 100% spot transaction, 3) Higher global gold price
amid upcoming global uncertainty. PSAB currently trades at 9.2x/7.2x
PE and 4.9x/4.4x EV/EBITDA 2017/18F.
Expect higher gold price amid global uncertainty
Global political and economic uncertainty has increased significantly
over the past year. The win of Donald Trump as the president of the
United States of America is part of the reason. The new-elect president
is well known for its controversial promise about USA’s protectionism,
fight climate change, dump global free trades, and so on. But, Trump’s
policy execution remains unclear and may build more uncertainty. This
would cause a shift into safe-haven investments such as cash and gold.
Our key assumption
We assume gold price will be USD1,250 per oz in 2016 and as the long-
term gold price assumption. We expect gold sales volume will be 200K
oz in 2016F, 18% lower than 2015, and will increase by 20%/13% to
240/270K oz in 2017/18F respectively. Net profit will reach
USD46/61mn by 2017-18 with solid EBITDA margin of 53%/52%. PSA-
B’s increasing free cash flow will increase company’s ability to repay its
debt and further lower its interest expense. Net debt to equity ratio
would go down from 1.2x in 2014 to 0.9x in 2016. We also assume that
PSAB will get additional 1,700K oz in its reserve supported by continu-
ous exploration effort. This extends its life of mine until 2029.
Potential risk for PSAB
We see that the upside and downside risk will be from the volatility of
gold price and the lower/higher than expected gold sales volume.
PT J Resources Asia Pasifik Tbk is an In-
donesia-based company engaged in gold
mining.
Share Price Rp262
Sector Mining
Price Target Rp400 (68%)
Year end Dec 2014 2015F 2016F 2017F 2018F
Sales 280 287 250 300 338
EBITDA 119 143 120 160 174
Net Profit 26 31 26 47 62
EPS (Rp) 13.3 16.1 13.2 24.2 31.7
Core Profit 26 31 26 47 62
Core EPS (Rp) 13.3 16.1 13.2 24.2 31.7
Core EPS Growth (%) NA 20.8% -17.9% 83.3% 30.9%
EV/EBITDA (x) 6.5 5.5 6.5 4.9 4.5
P/BV (x) 2.1 1.9 1.7 1.5 1.3
Core P/E (x) 19.7 16.3 19.9 10.8 8.3
DPS (Rp) 0.0 0.0 0.0 0.0 0.0
Div Yield (%) 0.0 0.0 0.0 0.0 0.0
BUY Rp400
Reuters Code PSAB.JK
Bloomberg Code PSAB.IJ
Issued Shares 26,460
Mkt Cap. (Rpbn) 6,933
Avg. Value Daily 6
Month (Rpbn) 6.9
52-Wk range 414 / 173
Adaro Strategic Investment 43.9%
Garibaldi Thohir 6.2%
Public 35.2%
Core EPS 16F 17F
Consensus (Rp) na Na
TRIM vs Cons. (%) na Na
Company Update
Stock Data
Major Shareholders
Consensus
Companies Data (USDmn)
Share Price

PT Trimegah Securities Tbk - www.trimegah.com MARKET OUTLOOK 211
Income Statement (USDmn)
Year end Dec 2014 2015 2016F 2017F 2018F
Revenue 280 287 250 300 338
Revenue Growth
(%)
259.8
%
2.3% -12.8% 20.0% 12.5%
Gross Profit 129 149 124 168 187
Opr. Profit 85 101 82 118 131
EBITDA 119 143 120 160 174
EBITDA Growth (%) NA 20.0% -15.7% 33.1% 9.1%
Net Int Inc/(Exp) -28 -28 -28 -28 -25
Gain/(loss) Forex 0 0 0 0 0
Other Inc/(Exp) -40 -43 -40 -40 -36
Pre-tax Profit 46 58 43 78 95
Tax -20 -26 -17 -31 -33
Minority Int. 0 0 0 0 0
Extra. Items
Net Profit 26 31 26 47 62
Core Net Profit 26 31 26 47 62
Growth (%) na 20.8% -17.9% 83.3% 30.9%
Dividend per share 0.00 0.00 0.00 0.00 0.00
growth (%) NA NA NA NA NA
Dividend payout
ratio
0.00 0.00 0.00 0.00 0.00
Balance Sheet (USDmn)
Year end Dec 2014 2015 2016F 2017F 2018F
Cash and equivalents 11 6 53 42 31
Other curr asset 58 62 56 64 70
Net fixed asset 279 266 313 317 318
Other asset 509 495 490 499 510
Total asset 857 829 913 923 929
ST debt 100 150 30 30 30
Other curr liab 79 83 81 82 85
LT debt 219 105 290 260 210
Other LT Liab 174 174 174 174 174
Minority interest 38 46 46 46 46
Total Liabilities 571 512 575 547 500
Shareholders Equity 247 272 292 330 383
Net debt / (cash) 308 249 268 248 210
Total cap employed 161 161 161 161 161
Net Working capital -110 -165 -1 -5 -15
Debt 319 255 320 290 240
Cash Flow (USDmn)
Year end Dec 2014 2015 2016F 2017F 2018F
Net Profit 85 101 82 118 131
Depr / Amort 33 41 38 42 44
Chg in Working Cap 30 0 3 -7 -2
Others -41 -28 -57 -71 -69
CF's from oprs 108 114 67 82 103
Capex -83 -31 -70 -30 -30
Others -5 2 -10 -11 -12
CF's from investing -89 -29 -80 -55 -56
Net change in debt 26 -64 65 -30 -50
Others -61 -26 -6 -8 -9
CF's from financing -34 -90 60 -38 -59
Net cash flow -15 -5 47 -11 -12
Cash at BoY 27 11 6 27 46
Cash at EoY 11 6 53 42 31
Free Cashflow -26 87 21 76 96
Key Ratio Analysis
Year end Dec 2014 2015 2016F 2017F 2018F
Profitability Gross Margin (%) 46% 52% 50% 56% 55%
Opr Margin (%) 30% 35% 33% 39% 39%
EBITDA Margin (%) 42% 50% 48% 53% 52%
Core Net Margin (%) 9.2% 10.9% 10.3% 15.7% 18.2%
ROAE (%) 11.0% 12.1% 9.1% 15.1% 17.3%
ROAA (%) 3.1% 3.7% 2.9% 5.1% 6.7%
Stability Current ratio (x) 0.4 0.3 1.0 1.0 0.9
Net Debt to Equity (x) 1.2 0.9 0.9 0.8 0.5
Net Debt to EBITDA (x) 2.6 1.7 2.2 1.6 1.2
Interest Coverage (x) 3.0 3.6 2.9 3.9 5.0
Efficiency A/P (days) 106.6 69.5 69.5 69.5 69.5
A/R (days) 3.0 2.4 2.4 2.4 2.4
Inventory (days) 60.1 53.7 53.7 53.7 53.7
Interim Result (USDmn)
3Q15 4Q15 1Q16 2Q16 3Q16
Sales 81 56 65 56 59
Gross Profit 51 21 36 34 34
EBITDA 45 13 31 26 27
Opr. Profit 38 7 25 21 20
Net profit 11 -5 4 5 8
Gross Margins (%) 64% 37% 55% 61% 58%
EBITDA Margins (%) 55% 24% 48% 47% 45%
Opr Margins (%) 47% 12% 39% 38% 34%
Net Margins (%) 13% -9% 6% 9% 13%
Capital History
Date
IPO @250 22-Apr-03
Additional Share HMETD 27-Jan-12
Bonus Warrant 26-Sep-14
Stock Split 1:5 16-Jun-16
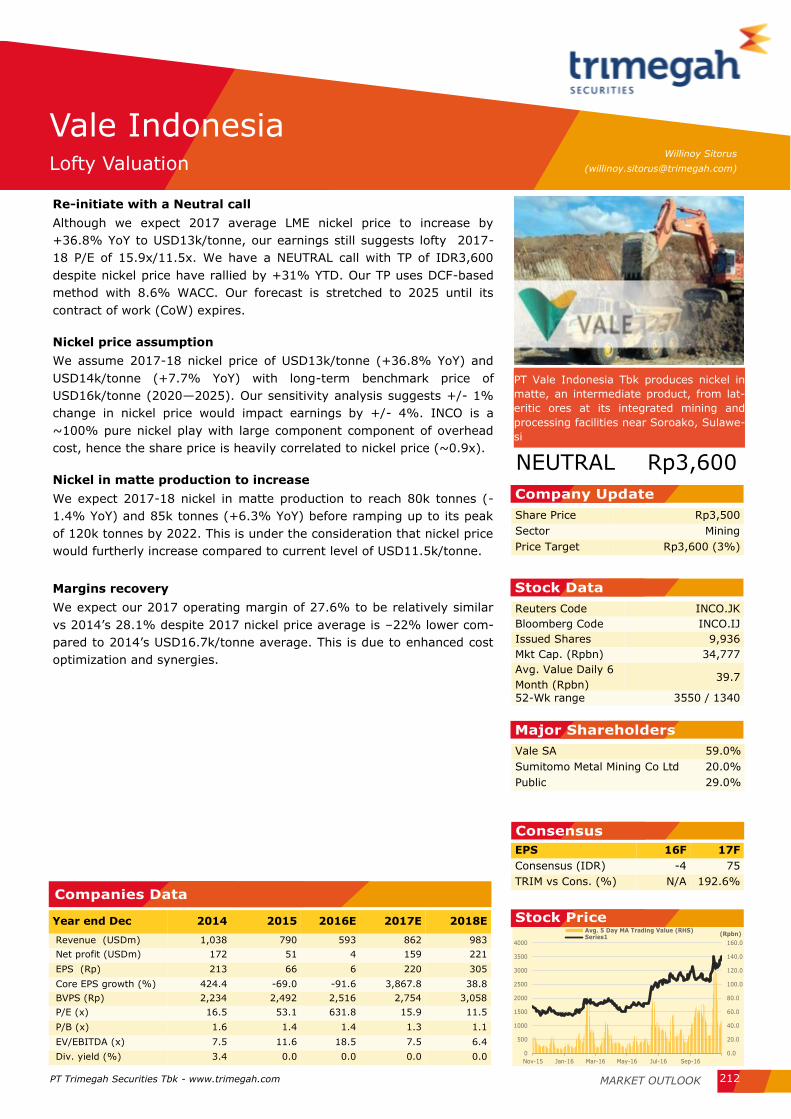
MARKET OUTLOOK PT Trimegah Securities Tbk - www.trimegah.com 212
Re-initiate with a Neutral call
Although we expect 2017 average LME nickel price to increase by
+36.8% YoY to USD13k/tonne, our earnings still suggests lofty 2017-
18 P/E of 15.9x/11.5x. We have a NEUTRAL call with TP of IDR3,600
despite nickel price have rallied by +31% YTD. Our TP uses DCF-based
method with 8.6% WACC. Our forecast is stretched to 2025 until its
contract of work (CoW) expires.
Nickel price assumption
We assume 2017-18 nickel price of USD13k/tonne (+36.8% YoY) and
USD14k/tonne (+7.7% YoY) with long-term benchmark price of
USD16k/tonne (2020—2025). Our sensitivity analysis suggests +/- 1%
change in nickel price would impact earnings by +/- 4%. INCO is a
~100% pure nickel play with large component component of overhead
cost, hence the share price is heavily correlated to nickel price (~0.9x).
Nickel in matte production to increase
We expect 2017-18 nickel in matte production to reach 80k tonnes (-
1.4% YoY) and 85k tonnes (+6.3% YoY) before ramping up to its peak
of 120k tonnes by 2022. This is under the consideration that nickel price
would furtherly increase compared to current level of USD11.5k/tonne.
Margins recovery
We expect our 2017 operating margin of 27.6% to be relatively similar
vs 2014’s 28.1% despite 2017 nickel price average is –22% lower com-
pared to 2014’s USD16.7k/tonne average. This is due to enhanced cost
optimization and synergies.
Share Price Rp3,500
Sector Mining
Price Target Rp3,600 (3%)
Year end Dec 2014 2015 2016E 2017E 2018E
Revenue (USDm) 1,038 790 593 862 983
Net profit (USDm) 172 51 4 159 221
EPS (Rp) 213 66 6 220 305
Core EPS growth (%) 424.4 -69.0 -91.6 3,867.8 38.8
BVPS (Rp) 2,234 2,492 2,516 2,754 3,058
P/E (x) 16.5 53.1 631.8 15.9 11.5
P/B (x) 1.6 1.4 1.4 1.3 1.1
EV/EBITDA (x) 7.5 11.6 18.5 7.5 6.4
Div. yield (%) 3.4 0.0 0.0 0.0 0.0
Vale Indonesia Lofty Valuation
NEUTRAL Rp3,600
Willinoy Sitorus
Reuters Code INCO.JK
Bloomberg Code INCO.IJ
Issued Shares 9,936
Mkt Cap. (Rpbn) 34,777
Avg. Value Daily 6
Month (Rpbn) 39.7
52-Wk range 3550 / 1340
Vale SA 59.0%
Sumitomo Metal Mining Co Ltd 20.0%
Public 29.0%
EPS 16F 17F
Consensus (IDR) -4 75
TRIM vs Cons. (%) N/A 192.6%
Company Update
Stock Data
Major Shareholders
Consensus
Stock Price
Companies Data
0.0
20.0
40.0
60.0
80.0
100.0
120.0
140.0
160.0
0
500
1000
1500
2000
2500
3000
3500
4000
Nov-15 Jan-16 Mar-16 May-16 Jul-16 Sep-16
(Rpbn)Avg. 5 Day MA Trading Value (RHS)Series1
PT Vale Indonesia Tbk produces nickel in
matte, an intermediate product, from lat-
eritic ores at its integrated mining and
processing facilities near Soroako, Sulawe-
si

PT Trimegah Securities Tbk - www.trimegah.com MARKET OUTLOOK 213
Income Statement (USDm)
Year end Dec 2014 2015F 2016F 2017F 2018F
Revenue 1,038 790 593 862 983
Growth (%) 13% -24% -25% 45% 14%
Gross Profit 307 118 39 250 335
Opr. Profit 292 107 31 238 321
EBITDA 372 226 153 364 450
Growth (%) 75% -45% -32% 137% 24%
Net Int Inc/(Exp) (12) (9) (5) (5) (6)
Gain/(loss) Forex
0
-
(1)
(0)
-
Other Inc/(Exp) (44) (28) (20) (20) (20)
Pre-tax Profit 237 70 5 212 295
Tax 65 19 1 53 74
Minority Int.
-
-
-
-
-
Extra. Items
-
-
-
-
-
Net Profit 172 51 4 159 221
Growth (%) 346% -71% -92% 3855% 39%
Balance Sheet (USDm)
Year end Dec 2013 2014 2015F 2016F 2017F
Cash and equivalents 200 302 195 442 395
Other curr asset 357 319 405 175 457
Net fixed asset 1,652 1,609 1,603 1,580 1,554
Other asset 72 104 86 86 86
Total asset 2,281 2,334 2,289 2,283 2,493
ST debt 36 36 36 22 27
Other curr liab 133 172 112 87 101
LT debt 183 147 110 140 170
Other LT Liab 215 194 197 197 197
Minority interest
-
-
-
-
-
Total Liabilities 567 549 455 445 495
Shareholders Equity 1,714 1,785 1,834 1,838 1,997
Net debt / (cash) 19 0 -49 -280 -198
Total cap employed 2,112 2,126 2,141 2,175 2,364
Net Working capital 389 413 451 508 724
Debt 219 183 146 162 197
Cash Flow (USDm)
Year end Dec 2014 2015F 2016F 2017F 2018F
Net profit 172 51 4 159 221
Depr / amort. 120 119 123 126 129
Chg in work. Cap. -16 61 3 -30 -14
Others 73 -204 186 -233 -90
CF's from oprs 349 27 315 22 247
Capex -76 -114 -100 -100 -90
Others -32 18 0 0 0
CF's from investing -109 -96 -100 -100 -90
Net change in debt 0 -0 69 -1 -3
Others -138 -39 -37 32 31
CF's from financing -138 -39 32 31 28
Net cash flow 102 -108 247 -47 185
Cash at BoY 200 302 195 442 395
Cash at EoY 302 195 442 395 580
Free Cashflow 199 54 -67 107 217
Key Ratio Analysis
Year end Dec 2013 2014 2015F 2016F 2017F
Profitability Gross Margin (%) 15.2% 29.5% 15.0% 6.5% 29.0%
Opr Margin (%) 13.8% 28.1% 13.5% 5.1% 27.6%
EBITDA Margin (%) 25.6% 39.7% 28.6% 25.9% 42.2%
Net Margin (%) 4.2% 16.6% 6.4% 0.7% 18.5%
ROAE (%) 2.3% 9.8% 2.8% 0.2% 8.3%
ROAA (%) 1.7% 7.5% 2.2% 0.2% 6.7%
Stability
Current ratio (x) 3.3 3.0 4.0 5.7 6.6
Net debt to equity (x) 0.0 net
cash
net cash net
cash
net
cash
Net debt to EBITDA (x) 0.1 -0.3 -0.2 -1.8 -0.5
Interest coverage (x) 8.6 23.3 10.8 6.6 44.2
Efficiency
A/P (days) 35 37 47 47 47
A/R (days) 26 33 36 36 36
Inventory (days) 71 70 57 70 70
Capital History
Date
Placement (8/26/09) Price @ Rp. 4,500
Interim Results (USDm)
Year end Dec 3Q15 4Q15 1Q16 2Q16 3Q16
Revenue 203 177 109 138 159
Gross profit 36 2 -14 1 24
Opr. profit 33 -0 -17 -2 21
Net profit 10 -1 -15 -5 13
Gross margin (%) 17.5% 1.1% -13.0% 0.6% 15.0%
Opr. margin (%) 16.0% 0.0% -15.9% -1.5% 13.3%
Net margin (%) 4.9% -0.8% -14.2% -3.3% 8.2%

PT Trimegah Securities Tbk
Gedung Artha Graha 18th Floor
Jl. Jend. Sudirman Kav. 52-53
Jakarta 12190, Indonesia
t. +62-21 2924 9088
f. +62-21 2924 9150
www.trimegah.com
DISCLAIMER
This report has been prepared by PT Trimegah Securities Tbk on behalf of itself and its affiliated companies and is provided for information
purposes only. Under no circumstances is it to be used or considered as an offer to sell, or a solicitation of any offer to buy. This report has
been produced independently and the forecasts, opinions and expectations contained herein are entirely those of Trimegah Securities.
While all reasonable care has been taken to ensure that information contained herein is not untrue or misleading at the time of publication,
Trimegah Securities makes no representation as to its accuracy or completeness and it should not be relied upon as such. This report is
provided solely for the information of clients of Trimegah Securities who are expected to make their own investment decisions without reliance
on this report. Neither Trimegah Securities nor any officer or employee of Trimegah Securities accept any liability whatsoever for any direct or
consequential loss arising from any use of this report or its contents. Trimegah Securities and/or persons connected with it may have acted
upon or used the information herein contained, or the research or analysis on which it is based, before publication. Trimegah Securities may in
future participate in an offering of the company’s equity securities.


