
2016 Community Scorecard
Prepared for: City of Nedlands
Prepared by: Catalyse Pty Ltd
1 September 2016
© Copyright CATALYSE® Pty Ltd 2016

Strategic Insights 3
The study 17
Overall performance 22
Governance and communications 26
Community development 40
Built environment 56
Natural environment 72
Overview of community variances 81
Moving forward 84
Contents

Strategic Insights

Overall Performance | City of Nedlands
Place to live
86 out of 100
Governing
Organisation
58 out of 100
4

72
82 78 76 75 75 75 74 74 73 73 73 73 71
68 67 66
54
73 71 70 68
63 61 60 60
55 53
Overall Performance | industry comparisons
WA Average
Overall Performance Index Score
average of ‘place to live’ and ‘governing organisation’
5
City of Nedlands 72
High 82
Average 69
The ‘Overall Performance Index Score’ is a combined measure of the City of Nedlands as a
‘place to live’ and as a ‘governing organisation’. The City of Nedlands’s overall performance
index score is 72 out of 100, 3 index points above the industry average for Western Australia.
City of Nedlands
Metropolitan Councils
Regional Councils
How to read the Benchmark Matrix TM
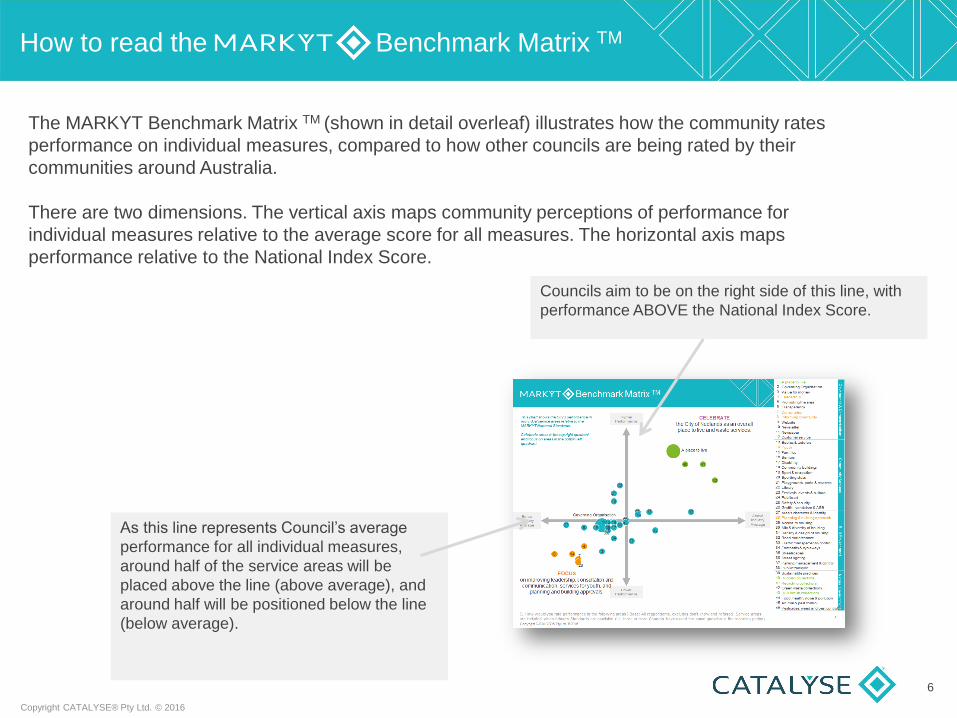
The MARKYT Benchmark Matrix TM (shown in detail overleaf) illustrates how the community rates
performance on individual measures, compared to how other councils are being rated by their
communities around Australia.
There are two dimensions. The vertical axis maps community perceptions of performance for
individual measures relative to the average score for all measures. The horizontal axis maps
performance relative to the National Index Score.
Councils aim to be on the right side of this line, with
performance ABOVE the National Index Score.
As this line represents Council’s average
performance for all individual measures,
around half of the service areas will be
placed above the line (above average), and
around half will be positioned below the line
(below average).
6
Copyright CATALYSE® Pty Ltd. © 2016

A place to live
Governing Organisation
3
4
7 8
9 10
12
14
15
16
17
18
19
21
22
23
25
28
29
32
33
34 35
36
37
38
39
40 41
43
44
45
Benchmark Matrix TM
7
Above
Industry
Average
Below
Industry
Average
Higher
Performance
Lower
Performance
1 A place to live
Govern
ance &
Com
mu
nic
atio
ns
2 Governing Organisation
3 Value for money
4 Leadership
5 Promoting the area
6 Transparency
7 Consultation
8 Informing community
9 Website
10 Newsletter
11 Newpaper
12 Customer service
13 Babies & toddlers
Com
munity
Serv
ices
14 Youth
15 Families
16 Seniors
17 Disability
18 Community buildings
19 Sport & recreation
20 Sporting clubs
21 Playgrounds, parks & reserves
22 Library
23 Festivals, events & cultural
24 Public art
25 Safety & security
26 Graffiti, vandalism & ASB
27 Area's character & identity
Built E
nviro
nm
ent
28 Planning & building approvals
29 Access to housing
30 Mix & diversity of housing
31 Density & design of housing
32 Road maintenance
33 Traffic management & control
34 Footpaths & cycleways
35 Streetscapes
36 Street lighting
37 Parking management & control
38 Public transport
39 Sustainable practices
Natu
ral E
nviro
nm
ent
40 Rubbish collections
41 Recycling collections
42 Green waste collections
43 Bulk rubish collections
44 Food, health, noise & pollution
45 Animal & pest control
46 Pesticides: weed and pest control
FOCUS
on improving leadership, consultation and
communication, services for youth, and
planning and building approvals.
CELEBRATE
the City of Nedlands as an overall
place to live and waste services.
This chart shows the City’s performance in
individual service areas relative to the
MARKYT National Standards.
Celebrate areas in the top right quadrant
and focus on areas in the bottom left
quadrant.
Copyright CATALYSE® Pty Ltd. © 2016
Q. How would you rate performance in the following areas? Base: All respondents, excludes don’t know and refused.
Service areas are included when MARKYT Industry Standards are available.
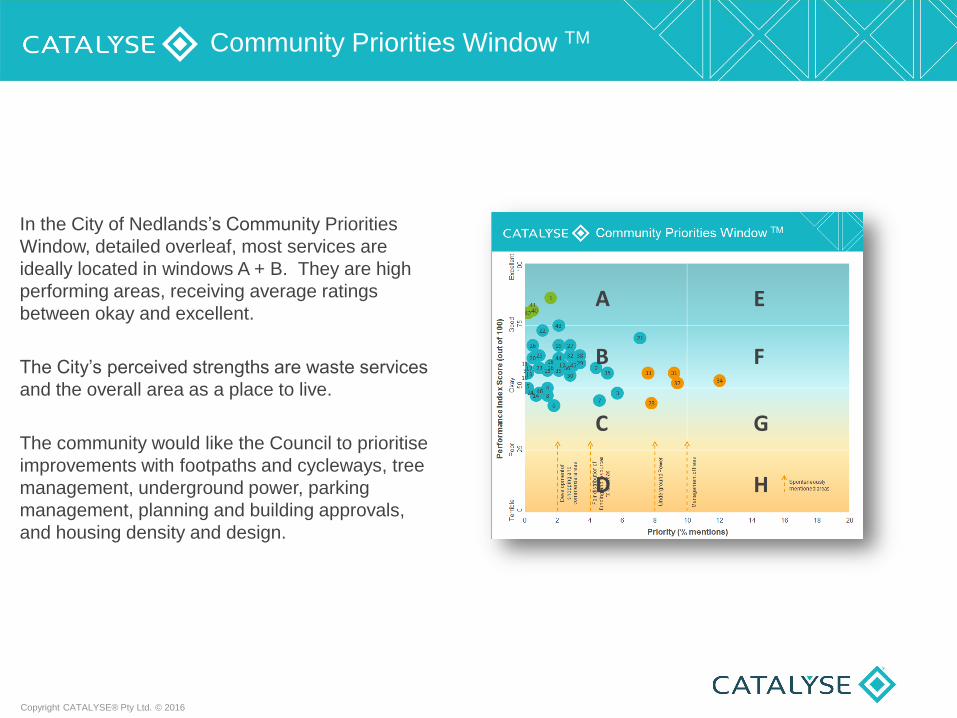
In the City of Nedlands’s Community Priorities
Window, detailed overleaf, most services are
ideally located in windows A + B. They are high
performing areas, receiving average ratings
between okay and excellent.
The City’s perceived strengths are waste services
and the overall area as a place to live.
The community would like the Council to prioritise
improvements with footpaths and cycleways, tree
management, underground power, parking
management, planning and building approvals,
and housing density and design.
Community Priorities Window TM
A
B
C
D
E
F
G
H
Copyright CATALYSE® Pty Ltd. © 2016

Community Priorities Window TM
Priority (% mentions)
Pe
rfo
rma
nce In
de
x S
co
re (
ou
t o
f 1
00
)
9
Terr
ible
0
Poor
25
Okay
50
Good
75
Excelle
nt
100
Q. How satisfied are you with [SERVICE AREA]: Base: All respondents, excludes refused and don’t know(n = varies)
Q. Which areas would you most like the City of Nedlands to focus on improving? Base: All respondents(n = 435)
Copyright CATALYSE® Pty Ltd. © 2016
1 A place to live
Govern
ance &
Com
mu
nic
atio
ns
2 Governing Organisation
3 Value for money
4 Leadership
5 Promoting the area
6 Transparency
7 Consultation
8 Informing community
9 Website
10 Newsletter
11 Newpaper
12 Customer service
13 Babies & toddlers
Com
munity
Serv
ices
14 Youth
15 Families
16 Seniors
17 Disability
18 Community buildings
19 Sport & recreation
20 Sporting clubs
21 Playgrounds, parks & reserves
22 Library
23 Festivals, events & cultural
24 Public art
25 Safety & security
26 Graffiti, vandalism & ASB
27 Area's character & identity
Built E
nviro
nm
ent
28 Planning & building approvals
29 Access to housing
30 Mix & diversity of housing
31 Density & design of housing
32 Road maintenance
33 Traffic management & control
34 Footpaths & cycleways
35 Streetscapes
36 Street lighting
37 Parking management & control
38 Public transport
39 Sustainable practices
Natu
ral E
nviro
nm
ent
40 Rubbish collections
41 Recycling collections
42 Green waste collections
43 Bulk rubish collections
44 Food, health, noise & pollution
45 Animal & pest control
46 Pesticides: weed and pest control
1
2
3 4 5
6 7
8
9 10
11 12
13
14
15 16 17 18
19
20
21 22
23
24
25
26 27
28
29
30 31
32
33 34
35 36
37
38
39
40 41
42
43
44 45
46
0 2 4 6 8 10 12 14 16 18 20
Ma
na
ge
me
nt
of
tre
es
Underg
round P
ow
er
Fa
ir d
istr
ibutio
n o
f
fundin
g a
nd r
esourc
es
to a
ll are
as
Develo
pm
ent
of
shoppin
g a
nd
com
me
rcia
l are
as
Spontaneously
mentioned areas

Respondents want improvements to the conditions of existing footpaths, including making them more accessible for less mobile people. They would also like more footpaths and cycle ways to be built, improved cycling infrastructure and new pedestrian crossings over Stirling Highway.
Improving footpaths in the city. There are many uneven footpaths.
Replacement of old footpaths and new footpaths (where there aren't any).
Access on footpaths etc. for less able bodied. Really a matter of upgrading or putting in paving.
More pedestrian crossings on Stirling Highway…
Improving infrastructure for cycling. Bike paths, bike racks at all shopping areas. Bike paths should ideally not be shared with pedestrians.
Promoting cycling and providing more bike paths.
Cycle paths, in particular dedicated cycle lanes/roads for children to ride to school.
Respondents would like Council to support and encourage more walking and cycling as they feel it would enhance the local community and the amenity of the local area, especially for families with young children.
“Actively promoting and designing a more progressive community and lifestyle in the future including good pedestrian and cycling transportation…
Improving cycling infrastructure - not so much for lycra-clad cyclists, but for families, children, the elderly, and people making intra-suburb trips (which are currently made by car,
but could be made on bike if there were better paths, end of trip facilities and signage). Our aim should be for our suburb to be known for the number of cyclists on our roads
- including unaccompanied children because it is so safe for them.
Footpaths and cycleways
Q. Which areas would you most like the City of Nedlands to focus on improving? 10
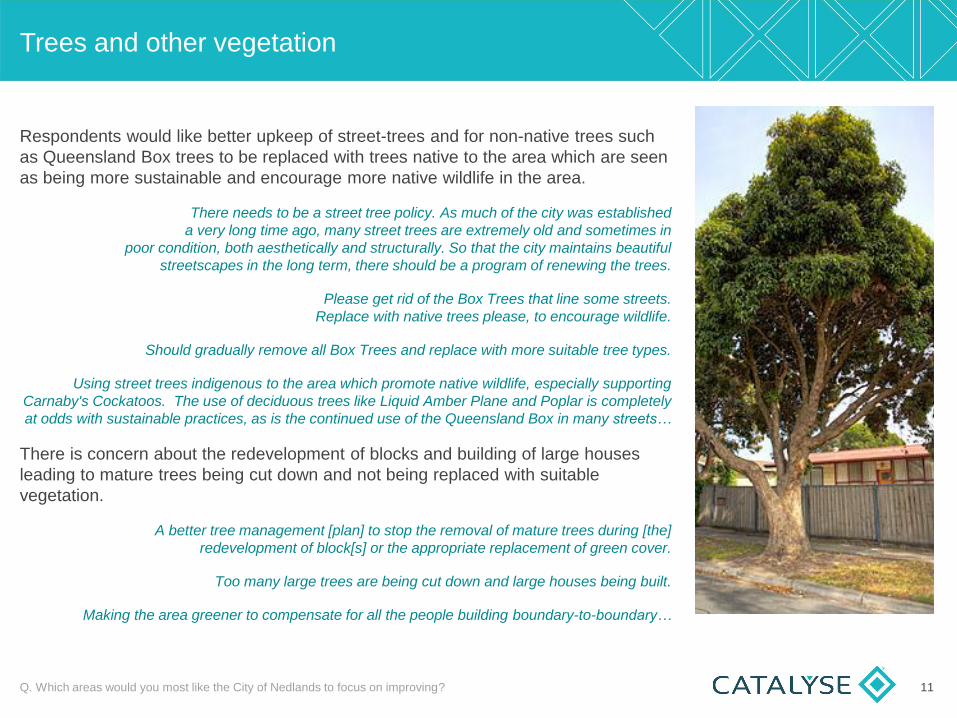
Respondents would like better upkeep of street-trees and for non-native trees such
as Queensland Box trees to be replaced with trees native to the area which are seen
as being more sustainable and encourage more native wildlife in the area.
There needs to be a street tree policy. As much of the city was established
a very long time ago, many street trees are extremely old and sometimes in
poor condition, both aesthetically and structurally. So that the city maintains beautiful
streetscapes in the long term, there should be a program of renewing the trees.
Please get rid of the Box Trees that line some streets.
Replace with native trees please, to encourage wildlife.
Should gradually remove all Box Trees and replace with more suitable tree types.
Using street trees indigenous to the area which promote native wildlife, especially supporting
Carnaby's Cockatoos. The use of deciduous trees like Liquid Amber Plane and Poplar is completely
at odds with sustainable practices, as is the continued use of the Queensland Box in many streets…
There is concern about the redevelopment of blocks and building of large houses
leading to mature trees being cut down and not being replaced with suitable
vegetation.
A better tree management [plan] to stop the removal of mature trees during [the]
redevelopment of block[s] or the appropriate replacement of green cover.
Too many large trees are being cut down and large houses being built.
Making the area greener to compensate for all the people building boundary-to-boundary…
Trees and other vegetation
11 Q. Which areas would you most like the City of Nedlands to focus on improving?

Respondents would like better enforcement of parking regulations, in particular with
street parking around UWA, the hospitals and other community facilities.
Stricter policing of parking.
Tighten infringement parking - fine, car wheeling, ranger - please do your job.
Sort out street parking by university students and visitors on Hillway. Often block our driveway, throw
rubbish on the verge, etc. Please have 2 hour car park restrictions on all of Hillway.
Better balance of parking around [the] hospital as there is currently too much parking by patients too
cheap to use hospital parking. It would also be good to limit vehicle parking on verges to 2 vehicles
per household, so streets did not look like parking lots. This is a particular problem at rental houses.
Reduce on street parking congestion in areas such as along Edward St,
where there is a community centre operating.
I have a concern that in Dalkeith Rd, north of Carrington St, that Council approved and signed
parking adjacent to the footpath and where our bins are placed for removal, regularly parked
vehicles obstruct the trucks that remove our waste. I believe the parking of vehicles should be on the
cemetery side of the road, as it is in Karella St.
Some parking management issues where through traffic have difficulty getting efficient and safe
passage - such as Smyth Rd (Stirling Highway end).
Parking management and control
12 Q. Which areas would you most like the City of Nedlands to focus on improving?

Some respondents would like increased density in the local area with the option to subdivide
their blocks so that they can stay in the area as they get older and wish to downsize. Some
would like increased density in the form of new apartment developments in central locations.
Infill - to allow people to stay in the area when they are growing older and children have left the family home.
Improve the density of housing so we do not have to move
out of the area now that we do not require a full size home.
Allow limited infill housing development, i.e. duplex (green title) on corner blocks.
The City should have already in place a planning scheme to encourage medium-high
density residential in suitable sets, e.g. Captain Stirling Hotel site. (It is very poor that the
community had to mobilise on this issue in the content of an old 'draft' strategy).
Should allow granny flats on large blocks to retain gardens and discourage huge houses.
Higher density close to hospitals, with free and more disabled parking. (I am OK as I have bought a granny cart
motorised, but many older people have a strict budget). High density (4-6 levels) along main routes.
Others are opposed to increases in density and certain types of subdivisions in their local
area. They feel that the character and identity of the local area, as well as vegetation and
green spaces, should be maintained.
Keep densities low and retain the larger blocks. Do not allow battle-axe subdivisions in particular.
Ensure low density housing and sustainable green urban environment which Nedlands is known for.
Restrict infill. Keep the existing identity and amenity.
More green spaces in the new developments. Houses are on top of
each other and not enough community gardens or spaces.
Housing density and design
13 Q. Which areas would you most like the City of Nedlands to focus on improving?

In line with feelings about housing density, some residents would like planning and
building approvals to allow for subdivisions and smaller block sizes, while others
would prefer to maintain the character and identity of the area.
Provide suitable zoning for Housing types for empty-nesters downsizing.
Improve efforts to maintain family housing areas, countering pressure for infill,
In areas close to primary schools, and keep residents in affected areas informed.
Other concerns include the approval of new builds which affect trees and vegetation
or privacy from overlooking. There is also a desire for improved levels of customer
service and processing times for applications, as well as the consideration of
alternative design and development plans.
Stop the building of new houses that need to destroy trees in the established gardens.
More consideration should be given to neighbours when buildings are
proposed which overlook neighbouring properties' bedrooms or
outdoor entertaining areas. Opaque windows should be used more...
Planning and building approvals - terrible customer service.
When placing permission to plan in at the Council a quicker process would be appreciated.
Open to more development and housing plans.
Quality of planning and building staff [members] understanding of solar passive design.
Planning and building approvals
14 Q. Which areas would you most like the City of Nedlands to focus on improving?

Residents would like the Council to work with the State Government to reduce
congestion on main roads, in particular on and around Stirling Highway.
Traffic management (with Dept. of Transport) e.g. hospital area.
Work with Main Roads to rectify blockages at the Broadway/Stirling Hwy
intersection (reconfigure traffic lanes; don't remove parking places).
Stirling Hwy is too busy.
The main traffic issues stem from trying to force all traffic onto Stirling highway, with
multiple pinch-points and no alternative routes for other destinations because
connecting streets are blocked/re-routed (e.g. Robinson St). All traffic between
Stirling highway and railway road has to travel down Leura avenue or loch St,
neither of which is wide enough to take large vehicles while allowing for parking.
They also want local traffic reduced and better managed to improve safety.
Reducing the amount of traffic taking shortcuts through local streets,
such as Loftus, Napier and Ord to avoid Loch St lights.
Restrict traffic volumes and speeds in residential streets such as Bruce Street.
Traffic management in residential areas - keep vehicle movement slowed by speed humps etc.
Calming the traffic in residential streets. Some residential streets carry excess
traffic which, in many cases, travels in excess of the speed limit.
Traffic Management in Gallop Road (Reduce volume, reduce speed, improve safety).
Traffic management and control
15 Q. Which areas would you most like the City of Nedlands to focus on improving?

Respondents would like underground power for all areas of the City of Nedlands and
for there to be fair distribution of the costs associated with installation. They desire
clear and prompt timeframes for installation in their areas.
Providing underground power for ALL City of Nedlands residents.
Underground power throughout the City - not just in the current areas. Funding by
State Govt/City split as with past recipients. This is a clear inequity across the City.
Underground power to the remaining streets should be completed, and costed
more fairly for owners, considering the charges made in previous years.
Underground power - accelerate the progress with a consistent cost sharing program/policy.
I would like to see underground power in our area very soon.
We have been given a number of time frames and none have been met.
The City of Nedlands must, as soon as possible,
address the issue of underground power for Hollywood Ward...
Some residents believe that removal of the overhead power lines will promote street
tree growth and will save the Council money in regards to tree pruning.
Underground power in all areas to promote the growth of trees and shade. This would
reduce the annual costs to the City and ratepayers of pruning under power lines.
Underground power in all areas, to allow better tree growth and shade and climate
benefits. The underground power would reduce the high cost to the Council in
pruning under the power line and call outs caused by limbs on the power lines.
Underground power
16 Q. Which areas would you most like the City of Nedlands to focus on improving?

The Study

The Study
In July-August 2016, the City of Nedlands administered
the CATALYSE® Community Scorecard to evaluate
community priorities and measure Council’s performance
against key indicators in the Strategic Community Plan.
Previously, the City has conducted the CATALYSE
Community Perceptions Survey. This study was
conducted by phone using an 11 point performance
scale.
This year, in response to social changes, the City has
adopted a MARKYT accredited, multi-channel approach
for data collection that uses a 5 point performance scale.
Invitations were issued to 2,000 randomly selected
households by mail and 2,000 residents by email. The
scorecard was also promoted locally via the City’s
communication channels.
435 residents submitted a response reducing the
sampling error to ±4.7% at the 95% confidence interval.
Data has been analysed using SPSS. Where sub-totals
add to ±1% of the parts, this is due to rounding errors to
zero decimal places.
95
3
2
17
29
31
23
47
53
46
7
20
17
21
2
3
34
24
39
11
5
Own
Rent
No response
Dalkeith Ward
Melvista Ward
Hollywood Ward
Coastal Ward
Male
Female
No children living in household
Child aged 0-5 in household
Child aged 6-12 in household
Child aged 13-18 in household
Child aged 19+ in household
No response
Respondent age: 18-34 years
35-54 years
55-64 years
65+ years
Disability or impairment
Non-English speaking background
18
% of respondents
WA Standards
Metropolitan Regional
19
CATALYSE has conducted Community Perceptions Surveys and Community Scorecards for more than 40 councils across WA.
When three or more councils have asked a comparable question, we publish the high score to enable participating councils to
recognise and learn from the industry leaders. In this report, the ‘high score’ is calculated from WA councils that have completed
an accredited study with CATALYSE within the past two years. Participating councils are listed below.
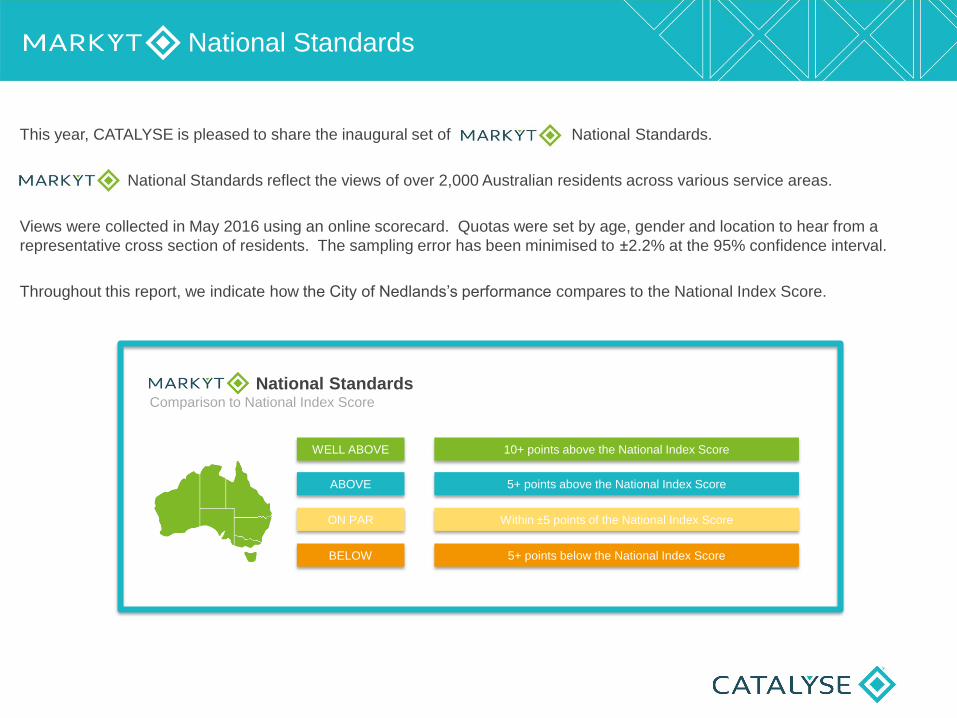
This year, CATALYSE is pleased to share the inaugural set of National Standards.
National Standards reflect the views of over 2,000 Australian residents across various service areas.
Views were collected in May 2016 using an online scorecard. Quotas were set by age, gender and location to hear from a
representative cross section of residents. The sampling error has been minimised to ±2.2% at the 95% confidence interval.
Throughout this report, we indicate how the City of Nedlands’s performance compares to the National Index Score.
National Standards
National Standards Comparison to National Index Score
ABOVE
ON PAR
BELOW
WELL ABOVE
5+ points above the National Index Score
Within ±5 points of the National Index Score
5+ points below the National Index Score
10+ points above the National Index Score

How to read this report
21
MARKYT National Standards
show the Council’s performance
compares to the National Index
Score.
The chart shows community
perceptions of performance on a five
point scale from excellent to terrible.
Variance across the community shows how results vary across
the community based on the Performance Index Score
The table highlights variances in different population groups that are
5 points above (+) or below (-) the Council’s overall Performance
Index Score for that measure.
Trend analysis shows how the Performance Index Score varies over
time. Please note: 2010 and 2014 performance results are from phone
surveys using an 11 point satisfaction scale. 2016 results use a new
MARKYT accredited multi-channel approach with a 5 point performance
scale. This is a best practice approach that enables comparison with
National Standards.
For the agree-disagree questions, the scale has remained consistent.
The MARKYT Accredited
Performance Index Score is a
score out of 100 using the following
formula:
(average score – 1)
4
x 100
Council Score is the Council’s
performance index score.
Industry High is the highest score
achieved by councils in WA that
have completed a comparable
study with CATALYSE over the past
two years.
WA Average is the average score
among WA councils that have
completed a comparable study with
CATALYSE over the past two
years.

Overall Performance
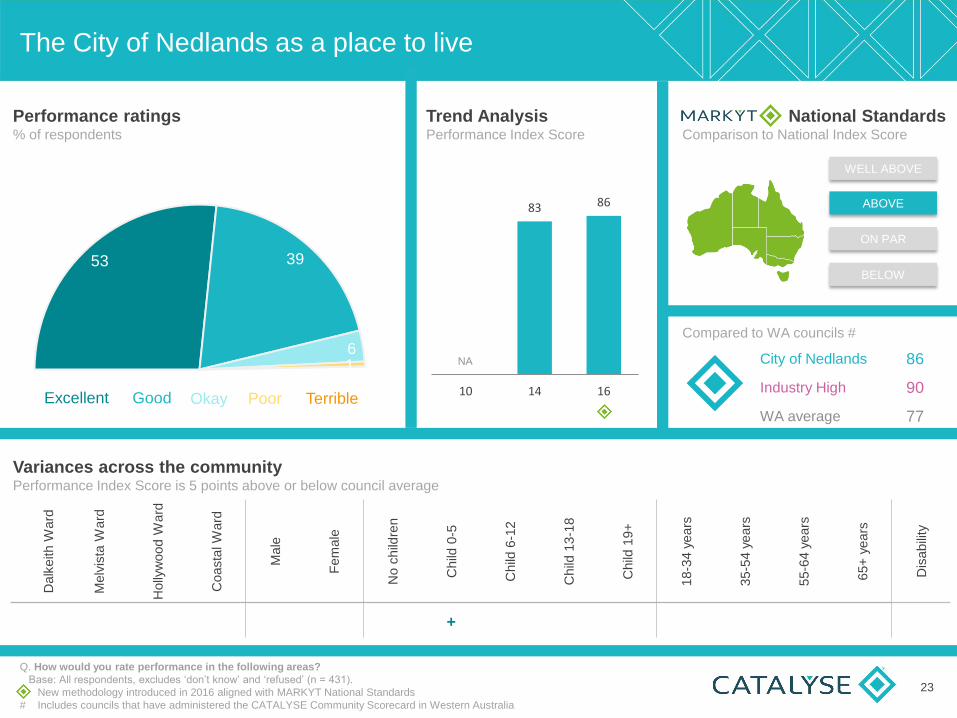
The City of Nedlands as a place to live
Q. How would you rate performance in the following areas?
Base: All respondents, excludes ‘don’t know’ and ‘refused’ (n = 431).
New methodology introduced in 2016 aligned with MARKYT National Standards
# Includes councils that have administered the CATALYSE Community Scorecard in Western Australia
53 39
6 1 0
100
Performance ratings % of respondents
Good Okay Excellent Poor Terrible
Trend Analysis Performance Index Score
83 86
10 14 16
National Standards Comparison to National Index Score
City of Nedlands 86
Industry High 90
WA average 77
ABOVE
ON PAR
BELOW
WELL ABOVE
Compared to WA councils #
Variances across the community Performance Index Score is 5 points above or below council average
Dalk
eith W
ard
Melv
ista
Ward
Holly
wood W
ard
Coasta
l W
ard
Male
Fem
ale
No c
hild
ren
Child
0-5
Child
6-1
2
Child
13-1
8
Child
19+
18-3
4 y
ears
35-5
4 y
ears
55-6
4 y
ears
65+
years
Dis
abili
ty
+
23
NA
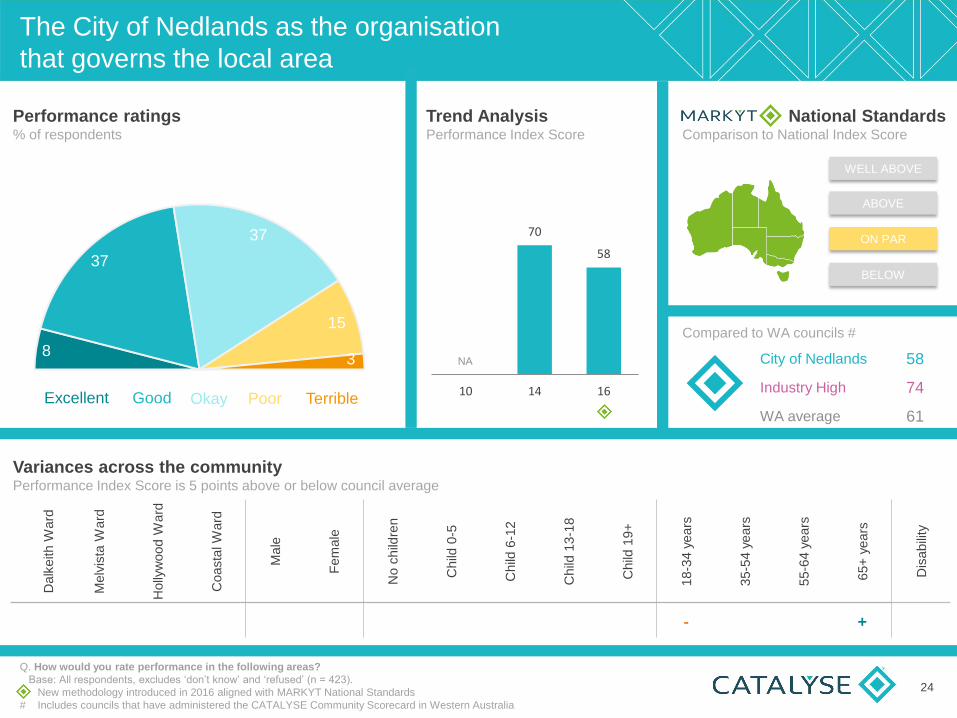
The City of Nedlands as the organisation
that governs the local area
Q. How would you rate performance in the following areas?
Base: All respondents, excludes ‘don’t know’ and ‘refused’ (n = 423).
New methodology introduced in 2016 aligned with MARKYT National Standards
# Includes councils that have administered the CATALYSE Community Scorecard in Western Australia
8
37
37
15
3
100
Performance ratings % of respondents
Good Okay Excellent Poor Terrible
Trend Analysis Performance Index Score
70
58
10 14 16
National Standards Comparison to National Index Score
City of Nedlands 58
Industry High 74
WA average 61
ABOVE
ON PAR
BELOW
WELL ABOVE
Compared to WA councils #
Variances across the community Performance Index Score is 5 points above or below council average
Dalk
eith W
ard
Melv
ista
Ward
Holly
wood W
ard
Coasta
l W
ard
Male
Fem
ale
No c
hild
ren
Child
0-5
Child
6-1
2
Child
13-1
8
Child
19+
18-3
4 y
ears
35-5
4 y
ears
55-6
4 y
ears
65+
years
Dis
abili
ty
- +
24
NA

Value for money from Council rates
Q. How would you rate performance in the following areas?
Base: All respondents, excludes ‘don’t know’ and ‘refused’ (n = 414).
New methodology introduced in 2016 aligned with MARKYT National Standards
# Includes councils that have administered the CATALYSE Community Scorecard in Western Australia
4
22
42
26
6
100
Performance ratings % of respondents
Good Okay Excellent Poor Terrible
Trend Analysis Performance Index Score
63 64
48
10 14 16
National Standards Comparison to National Index Score
City of Nedlands 48
Industry High 69
WA average 51
ABOVE
ON PAR
BELOW
WELL ABOVE
Compared to WA councils #
Variances across the community Performance Index Score is 5 points above or below council average
Dalk
eith W
ard
Melv
ista
Ward
Holly
wood W
ard
Coasta
l W
ard
Male
Fem
ale
No c
hild
ren
Child
0-5
Child
6-1
2
Child
13-1
8
Child
19+
18-3
4 y
ears
35-5
4 y
ears
55-6
4 y
ears
65+
years
Dis
abili
ty
- - +
25

Governance and Communications

Council’s leadership within the community
Q. How would you rate performance in the following areas?
Base: All respondents, excludes ‘don’t know’ and ‘refused’ (n = 373).
New methodology introduced in 2016 aligned with MARKYT National Standards
# Includes councils that have administered the CATALYSE Community Scorecard in Western Australia
3
26
41
24
5
100
Performance ratings % of respondents
Good Okay Excellent Poor Terrible
Trend Analysis Performance Index Score
51 57
50
10 14 16
National Standards Comparison to National Index Score
City of Nedlands 50
Industry High 74
WA average 54
ABOVE
ON PAR
BELOW
WELL ABOVE
Compared to WA councils #
Variances across the community Performance Index Score is 5 points above or below council average
Dalk
eith W
ard
Melv
ista
Ward
Holly
wood W
ard
Coasta
l W
ard
Male
Fem
ale
No c
hild
ren
Child
0-5
Child
6-1
2
Child
13-1
8
Child
19+
18-3
4 y
ears
35-5
4 y
ears
55-6
4 y
ears
65+
years
Dis
abili
ty
- +
27
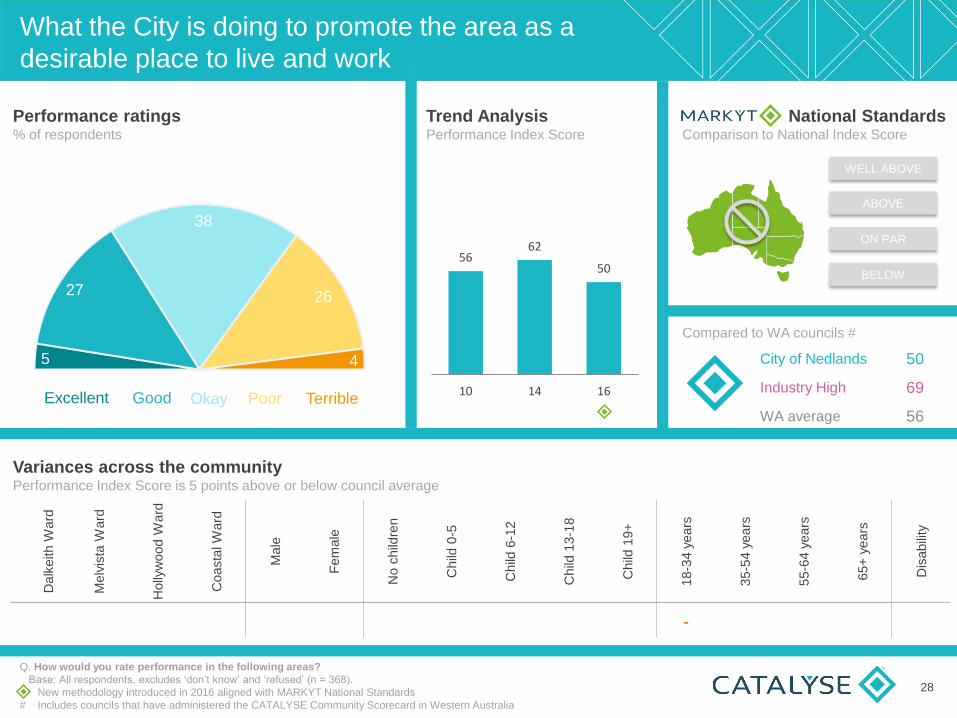
What the City is doing to promote the area as a
desirable place to live and work
Q. How would you rate performance in the following areas?
Base: All respondents, excludes ‘don’t know’ and ‘refused’ (n = 368).
New methodology introduced in 2016 aligned with MARKYT National Standards
# Includes councils that have administered the CATALYSE Community Scorecard in Western Australia
5
27
38
26
4
100
Performance ratings % of respondents
Good Okay Excellent Poor Terrible
Trend Analysis Performance Index Score
56 62
50
10 14 16
National Standards Comparison to National Index Score
City of Nedlands 50
Industry High 69
WA average 56
ABOVE
ON PAR
BELOW
WELL ABOVE
Compared to WA councils #
Variances across the community Performance Index Score is 5 points above or below council average
Dalk
eith W
ard
Melv
ista
Ward
Holly
wood W
ard
Coasta
l W
ard
Male
Fem
ale
No c
hild
ren
Child
0-5
Child
6-1
2
Child
13-1
8
Child
19+
18-3
4 y
ears
35-5
4 y
ears
55-6
4 y
ears
65+
years
Dis
abili
ty
-
28

30
53
31
10 14 16
The City of Nedlands has developed and
communicated a clear vision for the area
6
25
35
22
11
100
Somewhat
agree Neutral/
unsure
Strongly
agree
Variances across the community 5% points above or below council average
Somewhat
disagree
Strongly
disagree
Trend Analysis % agree
National Standards Comparison to National Score - % agree
ABOVE
ON PAR
BELOW
WELL ABOVE
Compared to WA councils #
Q. How strongly do you agree or disagree with the following statements?
Base: All respondents, excludes ‘refused’ (n = 434).
New methodology introduced in 2016 aligned with MARKYT National Standards; question remains the same
# Includes councils that have administered the CATALYSE Community Scorecard in Western Australia
Level of agreement % of respondents
Dalk
eith W
ard
Melv
ista
Ward
Holly
wood
Ward
Coasta
l W
ard
Male
Fem
ale
No c
hild
ren
Child
0-5
Child
6-1
2
Child
13-1
8
Child
19+
18-3
4 y
ears
35-5
4 y
ears
55-6
4 y
ears
65+
years
Dis
abili
ty
- + - - - +
29
City of Nedlands 31
Industry High 70
WA average 39
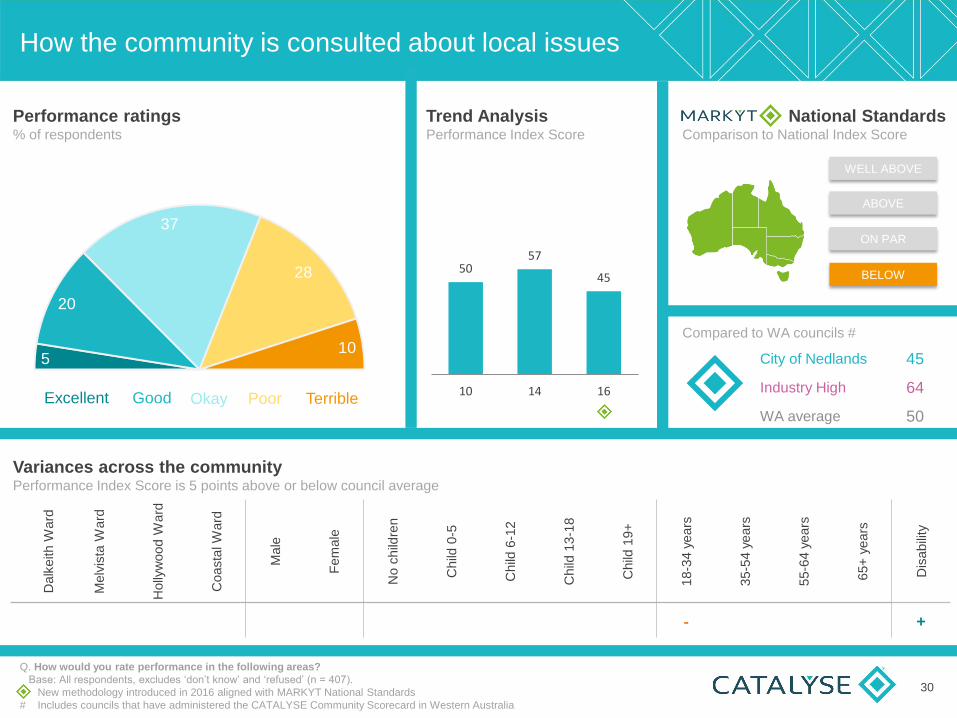
How the community is consulted about local issues
Q. How would you rate performance in the following areas?
Base: All respondents, excludes ‘don’t know’ and ‘refused’ (n = 407).
New methodology introduced in 2016 aligned with MARKYT National Standards
# Includes councils that have administered the CATALYSE Community Scorecard in Western Australia
5
20
37
28
10
100
Performance ratings % of respondents
Good Okay Excellent Poor Terrible
Trend Analysis Performance Index Score
50 57
45
10 14 16
National Standards Comparison to National Index Score
City of Nedlands 45
Industry High 64
WA average 50
ABOVE
ON PAR
BELOW
WELL ABOVE
Compared to WA councils #
Variances across the community Performance Index Score is 5 points above or below council average
Dalk
eith W
ard
Melv
ista
Ward
Holly
wood W
ard
Coasta
l W
ard
Male
Fem
ale
No c
hild
ren
Child
0-5
Child
6-1
2
Child
13-1
8
Child
19+
18-3
4 y
ears
35-5
4 y
ears
55-6
4 y
ears
65+
years
Dis
abili
ty
- +
30

38
49
29
10 14 16
Elected Members (the Councillors) have a good
understanding of community needs
8
21
39
20
11
100
Somewhat
agree Neutral/
unsure
Strongly
agree
Variances across the community 5% points above or below council average
Somewhat
disagree
Strongly
disagree
Trend Analysis % agree
National Standards Comparison to National Score - % agree
ABOVE
ON PAR
BELOW
WELL ABOVE
Compared to WA councils #
Q. How strongly do you agree or disagree with the following statements?
Base: All respondents, excludes ‘refused’ (n = 431).
New methodology introduced in 2016 aligned with MARKYT National Standards ; question remains the same
# Includes councils that have administered the CATALYSE Community Scorecard in Western Australia
Level of agreement % of respondents
Dalk
eith W
ard
Melv
ista
Ward
Holly
wood
Ward
Coasta
l W
ard
Male
Fem
ale
No c
hild
ren
Child
0-5
Child
6-1
2
Child
13-1
8
Child
19+
18-3
4 y
ears
35-5
4 y
ears
55-6
4 y
ears
65+
years
Dis
abili
ty
+ - - + - - +
31
City of Nedlands 29
Industry High 60
WA average 41

46
57
41
10 14 16
Staff at the City of Nedlands have a good
understanding of community needs
10
31
36
16
7
100
Somewhat
agree Neutral/
unsure
Strongly
agree
Variances across the community 5% points above or below council average
Somewhat
disagree
Strongly
disagree
Trend Analysis % agree
National Standards Comparison to National Score - % agree
ABOVE
ON PAR
BELOW
WELL ABOVE
Compared to WA councils #
Q. How strongly do you agree or disagree with the following statements?
Base: All respondents, excludes ‘refused’ (n = 434).
New methodology introduced in 2016 aligned with MARKYT National Standards ; question remains the same
# Includes councils that have administered the CATALYSE Community Scorecard in Western Australia
Level of agreement % of respondents
Dalk
eith W
ard
Melv
ista
Ward
Holly
wood
Ward
Coasta
l W
ard
Male
Fem
ale
No c
hild
ren
Child
0-5
Child
6-1
2
Child
13-1
8
Child
19+
18-3
4 y
ears
35-5
4 y
ears
55-6
4 y
ears
65+
years
Dis
abili
ty
+ - - - - - - + +
32
City of Nedlands 41
Industry High 66
WA average 45
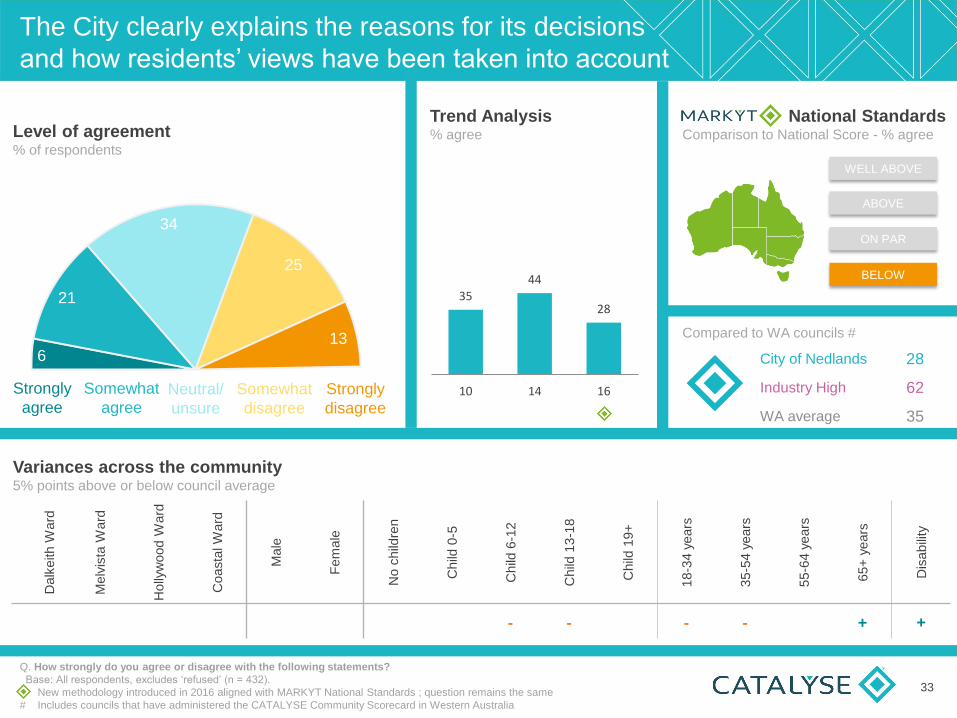
35 44
28
10 14 16
The City clearly explains the reasons for its decisions
and how residents’ views have been taken into account
6
21
34
25
13
100
Somewhat
agree Neutral/
unsure
Strongly
agree
Variances across the community 5% points above or below council average
Somewhat
disagree
Strongly
disagree
Trend Analysis % agree
National Standards Comparison to National Score - % agree
ABOVE
ON PAR
BELOW
WELL ABOVE
Compared to WA councils #
Q. How strongly do you agree or disagree with the following statements?
Base: All respondents, excludes ‘refused’ (n = 432).
New methodology introduced in 2016 aligned with MARKYT National Standards ; question remains the same
# Includes councils that have administered the CATALYSE Community Scorecard in Western Australia
Level of agreement % of respondents
Dalk
eith W
ard
Melv
ista
Ward
Holly
wood
Ward
Coasta
l W
ard
Male
Fem
ale
No c
hild
ren
Child
0-5
Child
6-1
2
Child
13-1
8
Child
19+
18-3
4 y
ears
35-5
4 y
ears
55-6
4 y
ears
65+
years
Dis
abili
ty
- - - - + +
33
City of Nedlands 28
Industry High 62
WA average 35
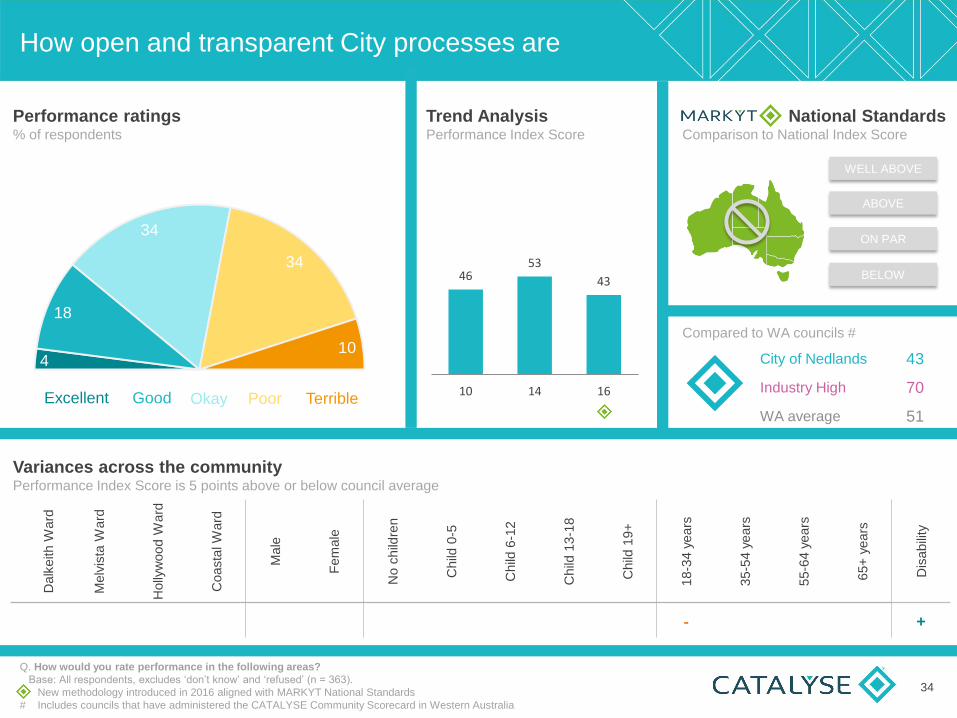
How open and transparent City processes are
Q. How would you rate performance in the following areas?
Base: All respondents, excludes ‘don’t know’ and ‘refused’ (n = 363).
New methodology introduced in 2016 aligned with MARKYT National Standards
# Includes councils that have administered the CATALYSE Community Scorecard in Western Australia
4
18
34
34
10
100
Performance ratings % of respondents
Good Okay Excellent Poor Terrible
Trend Analysis Performance Index Score
46 53
43
10 14 16
National Standards Comparison to National Index Score
City of Nedlands 43
Industry High 70
WA average 51
ABOVE
ON PAR
BELOW
WELL ABOVE
Compared to WA councils #
Variances across the community Performance Index Score is 5 points above or below council average
Dalk
eith W
ard
Melv
ista
Ward
Holly
wood W
ard
Coasta
l W
ard
Male
Fem
ale
No c
hild
ren
Child
0-5
Child
6-1
2
Child
13-1
8
Child
19+
18-3
4 y
ears
35-5
4 y
ears
55-6
4 y
ears
65+
years
Dis
abili
ty
- +
34

How the community is informed about local issues
Q. How would you rate performance in the following areas?
Base: All respondents, excludes ‘don’t know’ and ‘refused’ (n = 409).
New methodology introduced in 2016 aligned with MARKYT National Standards
# Includes councils that have administered the CATALYSE Community Scorecard in Western Australia
4
21
38
30
7
100
Performance ratings % of respondents
Good Okay Excellent Poor Terrible
Trend Analysis Performance Index Score
53 59
47
10 14 16
National Standards Comparison to National Index Score
City of Nedlands 47
Industry High 68
WA average 53
ABOVE
ON PAR
BELOW
WELL ABOVE
Compared to WA councils #
Variances across the community Performance Index Score is 5 points above or below council average
Dalk
eith W
ard
Melv
ista
Ward
Holly
wood W
ard
Coasta
l W
ard
Male
Fem
ale
No c
hild
ren
Child
0-5
Child
6-1
2
Child
13-1
8
Child
19+
18-3
4 y
ears
35-5
4 y
ears
55-6
4 y
ears
65+
years
Dis
abili
ty
- +
35
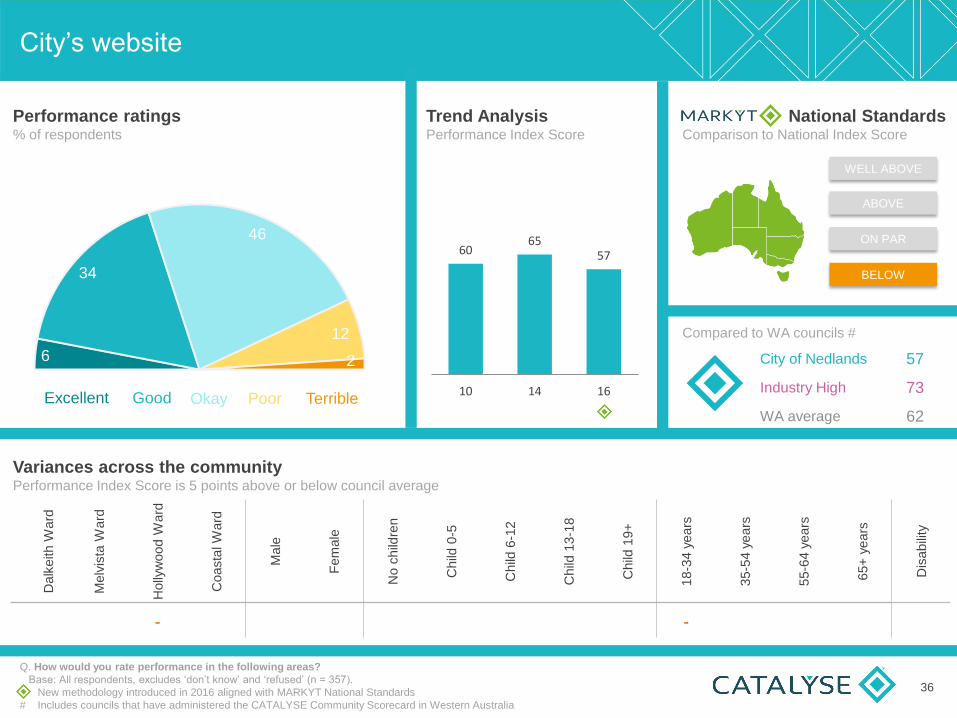
City’s website
Q. How would you rate performance in the following areas?
Base: All respondents, excludes ‘don’t know’ and ‘refused’ (n = 357).
New methodology introduced in 2016 aligned with MARKYT National Standards
# Includes councils that have administered the CATALYSE Community Scorecard in Western Australia
6
34
46
12
2
100
Performance ratings % of respondents
Good Okay Excellent Poor Terrible
Trend Analysis Performance Index Score
60 65
57
10 14 16
National Standards Comparison to National Index Score
City of Nedlands 57
Industry High 73
WA average 62
ABOVE
ON PAR
BELOW
WELL ABOVE
Compared to WA councils #
Variances across the community Performance Index Score is 5 points above or below council average
Dalk
eith W
ard
Melv
ista
Ward
Holly
wood W
ard
Coasta
l W
ard
Male
Fem
ale
No c
hild
ren
Child
0-5
Child
6-1
2
Child
13-1
8
Child
19+
18-3
4 y
ears
35-5
4 y
ears
55-6
4 y
ears
65+
years
Dis
abili
ty
- -
36

Nedlands News – the City’s newsletter
Q. How would you rate performance in the following areas?
Base: All respondents, excludes ‘don’t know’ and ‘refused’ (n = 370).
New methodology introduced in 2016 aligned with MARKYT National Standards
# Includes councils that have administered the CATALYSE Community Scorecard in Western Australia
5
32
48
12
2
100
Performance ratings % of respondents
Good Okay Excellent Poor Terrible
Trend Analysis Performance Index Score
57 62
56
10 14 16
National Standards Comparison to National Index Score
City of Nedlands 56
Industry High 76
WA average 64
ABOVE
ON PAR
BELOW
WELL ABOVE
Compared to WA councils #
Variances across the community Performance Index Score is 5 points above or below council average
Dalk
eith W
ard
Melv
ista
Ward
Holly
wood W
ard
Coasta
l W
ard
Male
Fem
ale
No c
hild
ren
Child
0-5
Child
6-1
2
Child
13-1
8
Child
19+
18-3
4 y
ears
35-5
4 y
ears
55-6
4 y
ears
65+
years
Dis
abili
ty
- +
37

Nedlands News Update – the monthly update in
the Post Newspaper
Q. How would you rate performance in the following areas?
Base: All respondents, excludes ‘don’t know’ and ‘refused’ (n = 366).
New methodology introduced in 2016 aligned with MARKYT National Standards
# Includes councils that have administered the CATALYSE Community Scorecard in Western Australia
6
35
45
13
1
100
Performance ratings % of respondents
Good Okay Excellent Poor Terrible
Trend Analysis Performance Index Score
58
10 14 16
National Standards Comparison to National Index Score
City of Nedlands 58
Industry High 69
WA average 60
ABOVE
ON PAR
BELOW
WELL ABOVE
Compared to WA councils #
Variances across the community Performance Index Score is 5 points above or below council average
Dalk
eith W
ard
Melv
ista
Ward
Holly
wood W
ard
Coasta
l W
ard
Male
Fem
ale
No c
hild
ren
Child
0-5
Child
6-1
2
Child
13-1
8
Child
19+
18-3
4 y
ears
35-5
4 y
ears
55-6
4 y
ears
65+
years
Dis
abili
ty
- +
38
NA NA
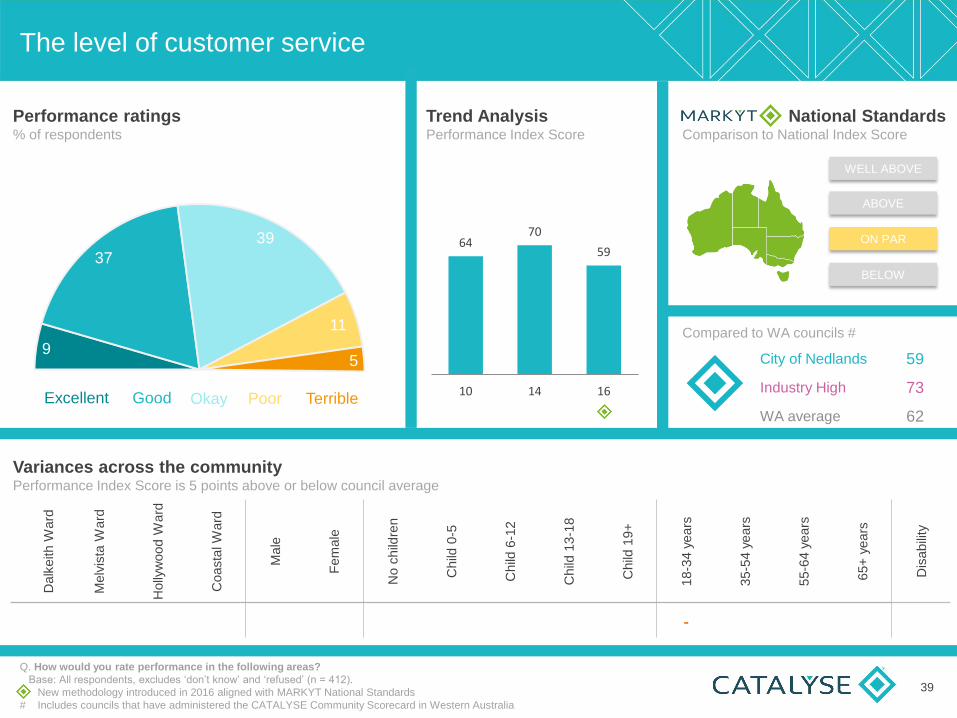
The level of customer service
Q. How would you rate performance in the following areas?
Base: All respondents, excludes ‘don’t know’ and ‘refused’ (n = 412).
New methodology introduced in 2016 aligned with MARKYT National Standards
# Includes councils that have administered the CATALYSE Community Scorecard in Western Australia
9
37
39
11
5
100
Performance ratings % of respondents
Good Okay Excellent Poor Terrible
Trend Analysis Performance Index Score
64 70
59
10 14 16
National Standards Comparison to National Index Score
City of Nedlands 59
Industry High 73
WA average 62
ABOVE
ON PAR
BELOW
WELL ABOVE
Compared to WA councils #
Variances across the community Performance Index Score is 5 points above or below council average
Dalk
eith W
ard
Melv
ista
Ward
Holly
wood W
ard
Coasta
l W
ard
Male
Fem
ale
No c
hild
ren
Child
0-5
Child
6-1
2
Child
13-1
8
Child
19+
18-3
4 y
ears
35-5
4 y
ears
55-6
4 y
ears
65+
years
Dis
abili
ty
-
39

Community Development
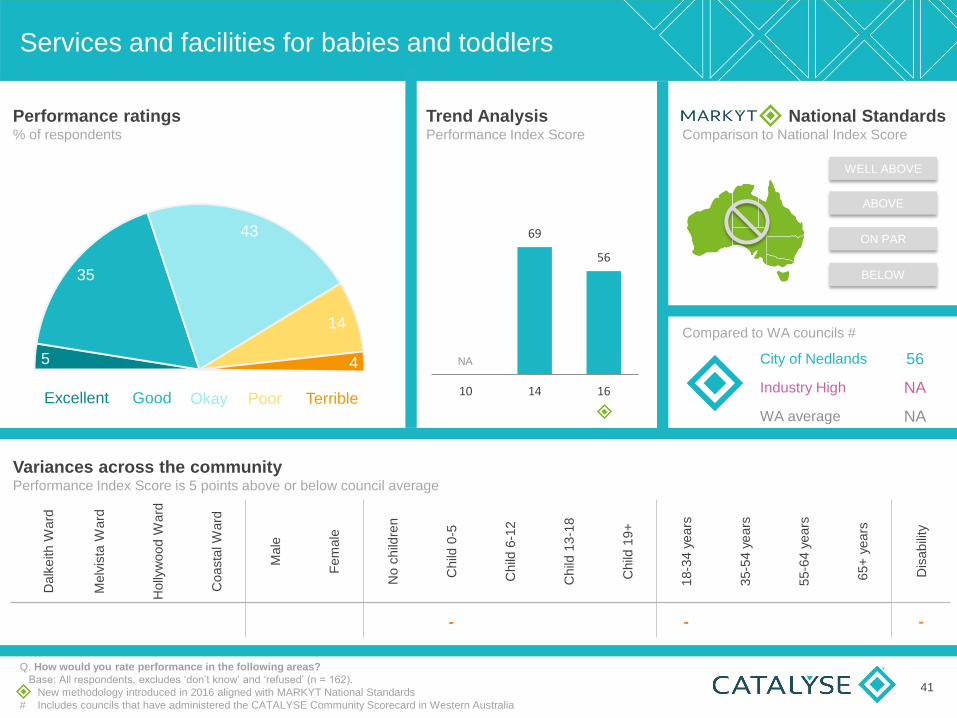
Services and facilities for babies and toddlers
Q. How would you rate performance in the following areas?
Base: All respondents, excludes ‘don’t know’ and ‘refused’ (n = 162).
New methodology introduced in 2016 aligned with MARKYT National Standards
# Includes councils that have administered the CATALYSE Community Scorecard in Western Australia
5
35
43
14
4
100
Performance ratings % of respondents
Good Okay Excellent Poor Terrible
Trend Analysis Performance Index Score
69
56
10 14 16
National Standards Comparison to National Index Score
City of Nedlands 56
Industry High NA
WA average NA
ABOVE
ON PAR
BELOW
WELL ABOVE
Compared to WA councils #
Variances across the community Performance Index Score is 5 points above or below council average
Dalk
eith W
ard
Melv
ista
Ward
Holly
wood W
ard
Coasta
l W
ard
Male
Fem
ale
No c
hild
ren
Child
0-5
Child
6-1
2
Child
13-1
8
Child
19+
18-3
4 y
ears
35-5
4 y
ears
55-6
4 y
ears
65+
years
Dis
abili
ty
- - -
41
NA

Services and facilities for youth
Q. How would you rate performance in the following areas?
Base: All respondents, excludes ‘don’t know’ and ‘refused’ (n = 222).
New methodology introduced in 2016 aligned with MARKYT National Standards
# Includes councils that have administered the CATALYSE Community Scorecard in Western Australia
3
23
41
29
5
100
Performance ratings % of respondents
Good Okay Excellent Poor Terrible
Trend Analysis Performance Index Score
57 62
47
10 14 16
National Standards Comparison to National Index Score
City of Nedlands 47
Industry High 73
WA average 54
ABOVE
ON PAR
BELOW
WELL ABOVE
Compared to WA councils #
Variances across the community Performance Index Score is 5 points above or below council average
Dalk
eith W
ard
Melv
ista
Ward
Holly
wood W
ard
Coasta
l W
ard
Male
Fem
ale
No c
hild
ren
Child
0-5
Child
6-1
2
Child
13-1
8
Child
19+
18-3
4 y
ears
35-5
4 y
ears
55-6
4 y
ears
65+
years
Dis
abili
ty
+ - + - - +
42

Services and facilities for families
Q. How would you rate performance in the following areas?
Base: All respondents, excludes ‘don’t know’ and ‘refused’ (n = 307).
New methodology introduced in 2016 aligned with MARKYT National Standards
# Includes councils that have administered the CATALYSE Community Scorecard in Western Australia
7
35
42
14
2
100
Performance ratings % of respondents
Good Okay Excellent Poor Terrible
Trend Analysis Performance Index Score
66 70
57
10 14 16
National Standards Comparison to National Index Score
City of Nedlands 57
Industry High 74
WA average 60
ABOVE
ON PAR
BELOW
WELL ABOVE
Compared to WA councils #
Variances across the community Performance Index Score is 5 points above or below council average
Dalk
eith W
ard
Melv
ista
Ward
Holly
wood W
ard
Coasta
l W
ard
Male
Fem
ale
No c
hild
ren
Child
0-5
Child
6-1
2
Child
13-1
8
Child
19+
18-3
4 y
ears
35-5
4 y
ears
55-6
4 y
ears
65+
years
Dis
abili
ty
43

Facilities, services and care available for seniors
Q. How would you rate performance in the following areas?
Base: All respondents, excludes ‘don’t know’ and ‘refused’ (n = 247).
New methodology introduced in 2016 aligned with MARKYT National Standards
# Includes councils that have administered the CATALYSE Community Scorecard in Western Australia
9
40 34
13
4
100
Performance ratings % of respondents
Good Okay Excellent Poor Terrible
Trend Analysis Performance Index Score
66 71
59
10 14 16
National Standards Comparison to National Index Score
City of Nedlands 59
Industry High 77
WA average 61
ABOVE
ON PAR
BELOW
WELL ABOVE
Compared to WA councils #
Variances across the community Performance Index Score is 5 points above or below council average
Dalk
eith W
ard
Melv
ista
Ward
Holly
wood W
ard
Coasta
l W
ard
Male
Fem
ale
No c
hild
ren
Child
0-5
Child
6-1
2
Child
13-1
8
Child
19+
18-3
4 y
ears
35-5
4 y
ears
55-6
4 y
ears
65+
years
Dis
abili
ty
+ - + +
44

Access to services and facilities for people with a disability
Q. How would you rate performance in the following areas?
Base: All respondents, excludes ‘don’t know’ and ‘refused’ (n = 192).
New methodology introduced in 2016 aligned with MARKYT National Standards
# Includes councils that have administered the CATALYSE Community Scorecard in Western Australia
8
34
41
13
4
100
Performance ratings % of respondents
Good Okay Excellent Poor Terrible
Trend Analysis Performance Index Score
66 66 57
10 14 16
National Standards Comparison to National Index Score
City of Nedlands 57
Industry High 73
WA average 58
ABOVE
ON PAR
BELOW
WELL ABOVE
Compared to WA councils #
Variances across the community Performance Index Score is 5 points above or below council average
Dalk
eith W
ard
Melv
ista
Ward
Holly
wood W
ard
Coasta
l W
ard
Male
Fem
ale
No c
hild
ren
Child
0-5
Child
6-1
2
Child
13-1
8
Child
19+
18-3
4 y
ears
35-5
4 y
ears
55-6
4 y
ears
65+
years
Dis
abili
ty
- - -
45

Community buildings, halls & toilets
Q. How would you rate performance in the following areas?
Base: All respondents, excludes ‘don’t know’ and ‘refused’ (n = 374).
New methodology introduced in 2016 aligned with MARKYT National Standards
# Includes councils that have administered the CATALYSE Community Scorecard in Western Australia
6
39
42
12
2
100
Performance ratings % of respondents
Good Okay Excellent Poor Terrible
Trend Analysis Performance Index Score
60 65
59
10 14 16
National Standards Comparison to National Index Score
City of Nedlands 59
Industry High 73
WA average 62
ABOVE
ON PAR
BELOW
WELL ABOVE
Compared to WA councils #
Variances across the community Performance Index Score is 5 points above or below council average
Dalk
eith W
ard
Melv
ista
Ward
Holly
wood W
ard
Coasta
l W
ard
Male
Fem
ale
No c
hild
ren
Child
0-5
Child
6-1
2
Child
13-1
8
Child
19+
18-3
4 y
ears
35-5
4 y
ears
55-6
4 y
ears
65+
years
Dis
abili
ty
+
46

Sport & recreation facilities
Q. How would you rate performance in the following areas?
Base: All respondents, excludes ‘don’t know’ and ‘refused’ (n = 394).
New methodology introduced in 2016 aligned with MARKYT National Standards
# Includes councils that have administered the CATALYSE Community Scorecard in Western Australia
15
47
28
8 1
100
Performance ratings % of respondents
Good Okay Excellent Poor Terrible
Trend Analysis Performance Index Score
67 73
67
10 14 16
National Standards Comparison to National Index Score
City of Nedlands 67
Industry High 81
WA average 68
ABOVE
ON PAR
BELOW
WELL ABOVE
Compared to WA councils #
Variances across the community Performance Index Score is 5 points above or below council average
Dalk
eith W
ard
Melv
ista
Ward
Holly
wood W
ard
Coasta
l W
ard
Male
Fem
ale
No c
hild
ren
Child
0-5
Child
6-1
2
Child
13-1
8
Child
19+
18-3
4 y
ears
35-5
4 y
ears
55-6
4 y
ears
65+
years
Dis
abili
ty
- - +
47

Level of support provided for local sporting clubs
Q. How would you rate performance in the following areas?
Base: All respondents, excludes ‘don’t know’ and ‘refused’ (n = 234).
New methodology introduced in 2016 aligned with MARKYT National Standards
# Includes councils that have administered the CATALYSE Community Scorecard in Western Australia
11
41 33
11
3
100
Performance ratings % of respondents
Good Okay Excellent Poor Terrible
Trend Analysis Performance Index Score
62
10 14 16
National Standards Comparison to National Index Score
City of Nedlands 62
Industry High NA
WA average NA
ABOVE
ON PAR
BELOW
WELL ABOVE
Compared to WA councils #
Variances across the community Performance Index Score is 5 points above or below council average
Dalk
eith W
ard
Melv
ista
Ward
Holly
wood W
ard
Coasta
l W
ard
Male
Fem
ale
No c
hild
ren
Child
0-5
Child
6-1
2
Child
13-1
8
Child
19+
18-3
4 y
ears
35-5
4 y
ears
55-6
4 y
ears
65+
years
Dis
abili
ty
- + +
48
NA NA
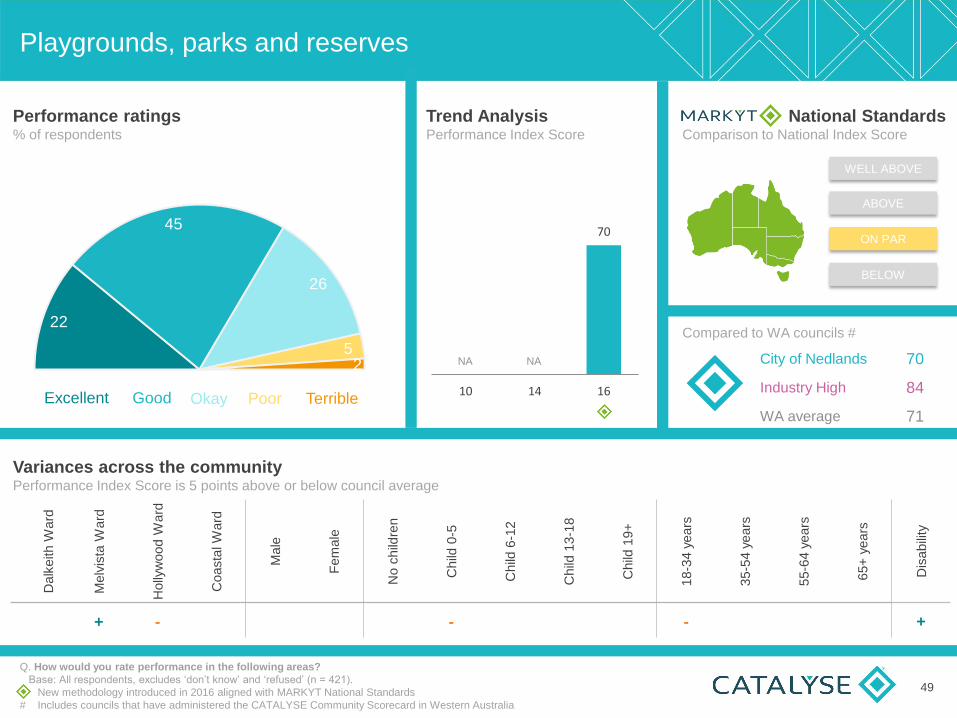
Playgrounds, parks and reserves
Q. How would you rate performance in the following areas?
Base: All respondents, excludes ‘don’t know’ and ‘refused’ (n = 421).
New methodology introduced in 2016 aligned with MARKYT National Standards
# Includes councils that have administered the CATALYSE Community Scorecard in Western Australia
22
45
26
5 2
100
Performance ratings % of respondents
Good Okay Excellent Poor Terrible
Trend Analysis Performance Index Score
70
10 14 16
National Standards Comparison to National Index Score
City of Nedlands 70
Industry High 84
WA average 71
ABOVE
ON PAR
BELOW
WELL ABOVE
Compared to WA councils #
Variances across the community Performance Index Score is 5 points above or below council average
Dalk
eith W
ard
Melv
ista
Ward
Holly
wood W
ard
Coasta
l W
ard
Male
Fem
ale
No c
hild
ren
Child
0-5
Child
6-1
2
Child
13-1
8
Child
19+
18-3
4 y
ears
35-5
4 y
ears
55-6
4 y
ears
65+
years
Dis
abili
ty
+ - - - +
49
NA NA

Library and information services
Q. How would you rate performance in the following areas?
Base: All respondents, excludes ‘don’t know’ and ‘refused’ (n = 390).
New methodology introduced in 2016 aligned with MARKYT National Standards
# Includes councils that have administered the CATALYSE Community Scorecard in Western Australia
25
47
21
5 1
100
Performance ratings % of respondents
Good Okay Excellent Poor Terrible
Trend Analysis Performance Index Score
76 78 73
10 14 16
National Standards Comparison to National Index Score
City of Nedlands 73
Industry High 83
WA average 74
ABOVE
ON PAR
BELOW
WELL ABOVE
Compared to WA councils #
Variances across the community Performance Index Score is 5 points above or below council average
Dalk
eith W
ard
Melv
ista
Ward
Holly
wood W
ard
Coasta
l W
ard
Male
Fem
ale
No c
hild
ren
Child
0-5
Child
6-1
2
Child
13-1
8
Child
19+
18-3
4 y
ears
35-5
4 y
ears
55-6
4 y
ears
65+
years
Dis
abili
ty
- - +
50

Festivals, events and cultural activities
Q. How would you rate performance in the following areas?
Base: All respondents, excludes ‘don’t know’ and ‘refused’ (n = 359).
New methodology introduced in 2016 aligned with MARKYT National Standards
# Includes councils that have administered the CATALYSE Community Scorecard in Western Australia
6
38
40
14
2
100
Performance ratings % of respondents
Good Okay Excellent Poor Terrible
Trend Analysis Performance Index Score
61 64 58
10 14 16
National Standards Comparison to National Index Score
City of Nedlands 58
Industry High 83
WA average 65
ABOVE
ON PAR
BELOW
WELL ABOVE
Compared to WA councils #
Variances across the community Performance Index Score is 5 points above or below council average
Dalk
eith W
ard
Melv
ista
Ward
Holly
wood W
ard
Coasta
l W
ard
Male
Fem
ale
No c
hild
ren
Child
0-5
Child
6-1
2
Child
13-1
8
Child
19+
18-3
4 y
ears
35-5
4 y
ears
55-6
4 y
ears
65+
years
Dis
abili
ty
-
51

Public art
Q. How would you rate performance in the following areas?
Base: All respondents, excludes ‘don’t know’ and ‘refused’ (n = 298).
New methodology introduced in 2016 aligned with MARKYT National Standards
# Includes councils that have administered the CATALYSE Community Scorecard in Western Australia
4
26
42
25
4
100
Performance ratings % of respondents
Good Okay Excellent Poor Terrible
Trend Analysis Performance Index Score
50
10 14 16
National Standards Comparison to National Index Score
City of Nedlands 50
Industry High NA
WA average NA
ABOVE
ON PAR
BELOW
WELL ABOVE
Compared to WA councils #
Variances across the community Performance Index Score is 5 points above or below council average
Dalk
eith W
ard
Melv
ista
Ward
Holly
wood W
ard
Coasta
l W
ard
Male
Fem
ale
No c
hild
ren
Child
0-5
Child
6-1
2
Child
13-1
8
Child
19+
18-3
4 y
ears
35-5
4 y
ears
55-6
4 y
ears
65+
years
Dis
abili
ty
- +
52
NA NA
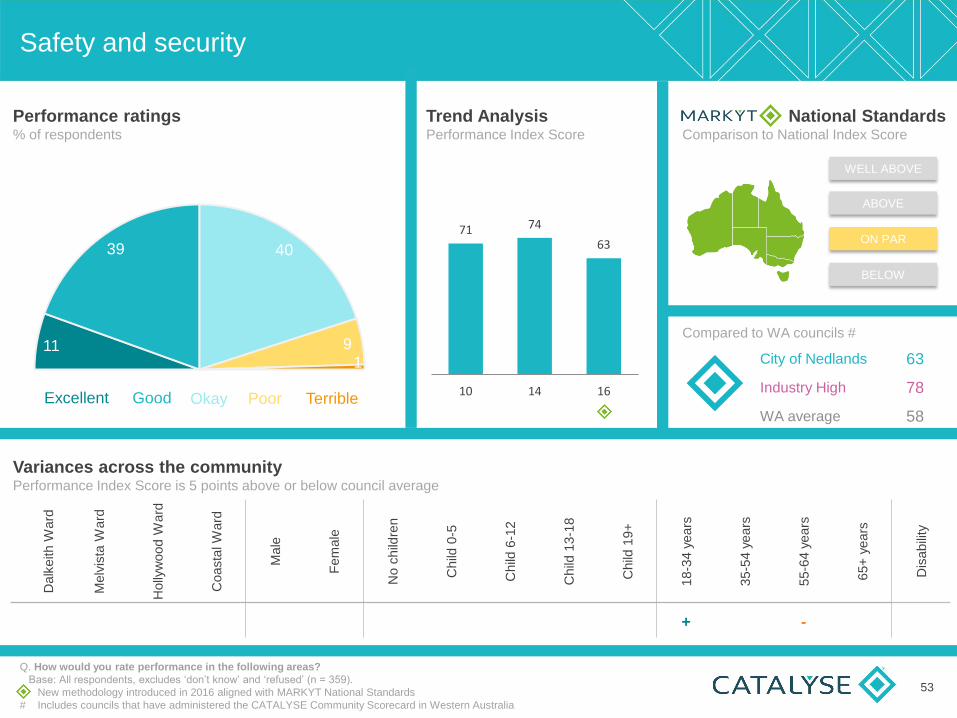
Safety and security
Q. How would you rate performance in the following areas?
Base: All respondents, excludes ‘don’t know’ and ‘refused’ (n = 359).
New methodology introduced in 2016 aligned with MARKYT National Standards
# Includes councils that have administered the CATALYSE Community Scorecard in Western Australia
11
39 40
9 1
100
Performance ratings % of respondents
Good Okay Excellent Poor Terrible
Trend Analysis Performance Index Score
71 74
63
10 14 16
National Standards Comparison to National Index Score
City of Nedlands 63
Industry High 78
WA average 58
ABOVE
ON PAR
BELOW
WELL ABOVE
Compared to WA councils #
Variances across the community Performance Index Score is 5 points above or below council average
Dalk
eith W
ard
Melv
ista
Ward
Holly
wood W
ard
Coasta
l W
ard
Male
Fem
ale
No c
hild
ren
Child
0-5
Child
6-1
2
Child
13-1
8
Child
19+
18-3
4 y
ears
35-5
4 y
ears
55-6
4 y
ears
65+
years
Dis
abili
ty
+ -
53

Control of graffiti, vandalism and anti-social behaviour
Q. How would you rate performance in the following areas?
Base: All respondents, excludes ‘don’t know’ and ‘refused’ (n = 382).
New methodology introduced in 2016 aligned with MARKYT National Standards
# Includes councils that have administered the CATALYSE Community Scorecard in Western Australia
15
48
30
8
0
100
Performance ratings % of respondents
Good Okay Excellent Poor Terrible
Trend Analysis Performance Index Score
72 75 67
10 14 16
National Standards Comparison to National Index Score
City of Nedlands 67
Industry High 76
WA average 58
ABOVE
ON PAR
BELOW
WELL ABOVE
Compared to WA councils #
Variances across the community Performance Index Score is 5 points above or below council average
Dalk
eith W
ard
Melv
ista
Ward
Holly
wood W
ard
Coasta
l W
ard
Male
Fem
ale
No c
hild
ren
Child
0-5
Child
6-1
2
Child
13-1
8
Child
19+
18-3
4 y
ears
35-5
4 y
ears
55-6
4 y
ears
65+
years
Dis
abili
ty
+ +
54

Participation in unpaid voluntary work
Industry Comparisons ^ % volunteered
Q. Over the past 12 months, has anyone in your household done any unpaid voluntary work? This includes welfare work, involvement in committees, helping out with local sporting clubs, canteen duties, etc.
Base: All respondents, excludes ‘unsure’ and ‘no response’ (n = 412)
^. CATALYSE Industry Standards * NB: Small sample size
Variances across the community % volunteered
City of Nedlands 55
High 80
Average 58
Volunteered in past 12 months % of respondents
55
45 Yes
No
55
CWS
Dalk
eith W
ard
Melv
ista
Ward
Holly
wood W
ard
Coasta
l W
ard
Male
Fem
ale
No c
hild
ren
Child
0-5
Child
6-1
2
Child
13-1
8
Child
19+
18-3
4 y
ears
35-5
4 y
ears
55-6
4 y
ears
65+
years
Dis
abili
ty
60% 59% 49% 55% 55% 55% 50% 63% 67% 65% 49% 90%* 64% 48% 49% 51%
Trend Analysis Performance Index Score
61 55
10 14 16
NA
Built Environment

The area's character and identity
Q. How would you rate performance in the following areas?
Base: All respondents, excludes ‘don’t know’ and ‘refused’ (n = 422).
New methodology introduced in 2016 aligned with MARKYT National Standards
# Includes councils that have administered the CATALYSE Community Scorecard in Western Australia
18
41
31
8
2
100
Performance ratings % of respondents
Good Okay Excellent Poor Terrible
Trend Analysis Performance Index Score
71 74 67
10 14 16
National Standards Comparison to National Index Score
City of Nedlands 67
Industry High 77
WA average 63
ABOVE
ON PAR
BELOW
WELL ABOVE
Compared to WA councils #
Variances across the community Performance Index Score is 5 points above or below council average
Dalk
eith W
ard
Melv
ista
Ward
Holly
wood W
ard
Coasta
l W
ard
Male
Fem
ale
No c
hild
ren
Child
0-5
Child
6-1
2
Child
13-1
8
Child
19+
18-3
4 y
ears
35-5
4 y
ears
55-6
4 y
ears
65+
years
Dis
abili
ty
+ -
57

Planning and building approvals
Q. How would you rate performance in the following areas?
Base: All respondents, excludes ‘don’t know’ and ‘refused’ (n = 316).
New methodology introduced in 2016 aligned with MARKYT National Standards
# Includes councils that have administered the CATALYSE Community Scorecard in Western Australia
3
21
36
27
13
100
Performance ratings % of respondents
Good Okay Excellent Poor Terrible
Trend Analysis Performance Index Score
50 52 44
10 14 16
National Standards Comparison to National Index Score
City of Nedlands 44
Industry High 63
WA average 49
ABOVE
ON PAR
BELOW
WELL ABOVE
Compared to WA councils #
Variances across the community Performance Index Score is 5 points above or below council average
Dalk
eith W
ard
Melv
ista
Ward
Holly
wood W
ard
Coasta
l W
ard
Male
Fem
ale
No c
hild
ren
Child
0-5
Child
6-1
2
Child
13-1
8
Child
19+
18-3
4 y
ears
35-5
4 y
ears
55-6
4 y
ears
65+
years
Dis
abili
ty
+ - - - +
58
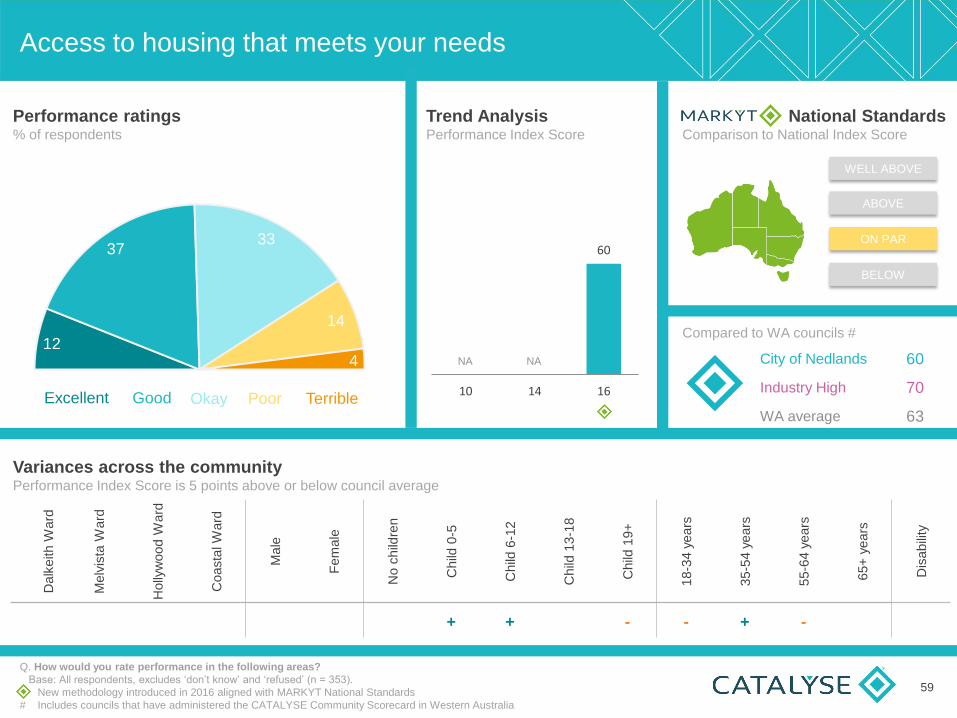
Access to housing that meets your needs
Q. How would you rate performance in the following areas?
Base: All respondents, excludes ‘don’t know’ and ‘refused’ (n = 353).
New methodology introduced in 2016 aligned with MARKYT National Standards
# Includes councils that have administered the CATALYSE Community Scorecard in Western Australia
12
37 33
14
4
100
Performance ratings % of respondents
Good Okay Excellent Poor Terrible
Trend Analysis Performance Index Score
60
10 14 16
National Standards Comparison to National Index Score
City of Nedlands 60
Industry High 70
WA average 63
ABOVE
ON PAR
BELOW
WELL ABOVE
Compared to WA councils #
Variances across the community Performance Index Score is 5 points above or below council average
Dalk
eith W
ard
Melv
ista
Ward
Holly
wood W
ard
Coasta
l W
ard
Male
Fem
ale
No c
hild
ren
Child
0-5
Child
6-1
2
Child
13-1
8
Child
19+
18-3
4 y
ears
35-5
4 y
ears
55-6
4 y
ears
65+
years
Dis
abili
ty
+ + - - + -
59
NA NA

Mix and diversity of housing types in your local area
Q. How would you rate performance in the following areas?
Base: All respondents, excludes ‘don’t know’ and ‘refused’ (n = 394).
New methodology introduced in 2016 aligned with MARKYT National Standards
# Includes councils that have administered the CATALYSE Community Scorecard in Western Australia
9
33
34
19
6
100
Performance ratings % of respondents
Good Okay Excellent Poor Terrible
Trend Analysis Performance Index Score
62 64
55
10 14 16
National Standards Comparison to National Index Score
City of Nedlands 55
Industry High 70
WA average 64
ABOVE
ON PAR
BELOW
WELL ABOVE
Compared to WA councils #
Variances across the community Performance Index Score is 5 points above or below council average
Dalk
eith W
ard
Melv
ista
Ward
Holly
wood W
ard
Coasta
l W
ard
Male
Fem
ale
No c
hild
ren
Child
0-5
Child
6-1
2
Child
13-1
8
Child
19+
18-3
4 y
ears
35-5
4 y
ears
55-6
4 y
ears
65+
years
Dis
abili
ty
+ + + + -
60

Density and design of housing in your local area
Q. How would you rate performance in the following areas?
Base: All respondents, excludes ‘don’t know’ and ‘refused’ (n = 414).
New methodology introduced in 2016 aligned with MARKYT National Standards
# Includes councils that have administered the CATALYSE Community Scorecard in Western Australia
11
33
32
17
7
100
Performance ratings % of respondents
Good Okay Excellent Poor Terrible
Trend Analysis Performance Index Score
61 64 56
10 14 16
National Standards Comparison to National Index Score
City of Nedlands 56
Industry High 69
WA average 62
ABOVE
ON PAR
BELOW
WELL ABOVE
Compared to WA councils #
Variances across the community Performance Index Score is 5 points above or below council average
Dalk
eith W
ard
Melv
ista
Ward
Holly
wood W
ard
Coasta
l W
ard
Male
Fem
ale
No c
hild
ren
Child
0-5
Child
6-1
2
Child
13-1
8
Child
19+
18-3
4 y
ears
35-5
4 y
ears
55-6
4 y
ears
65+
years
Dis
abili
ty
+ + -
61
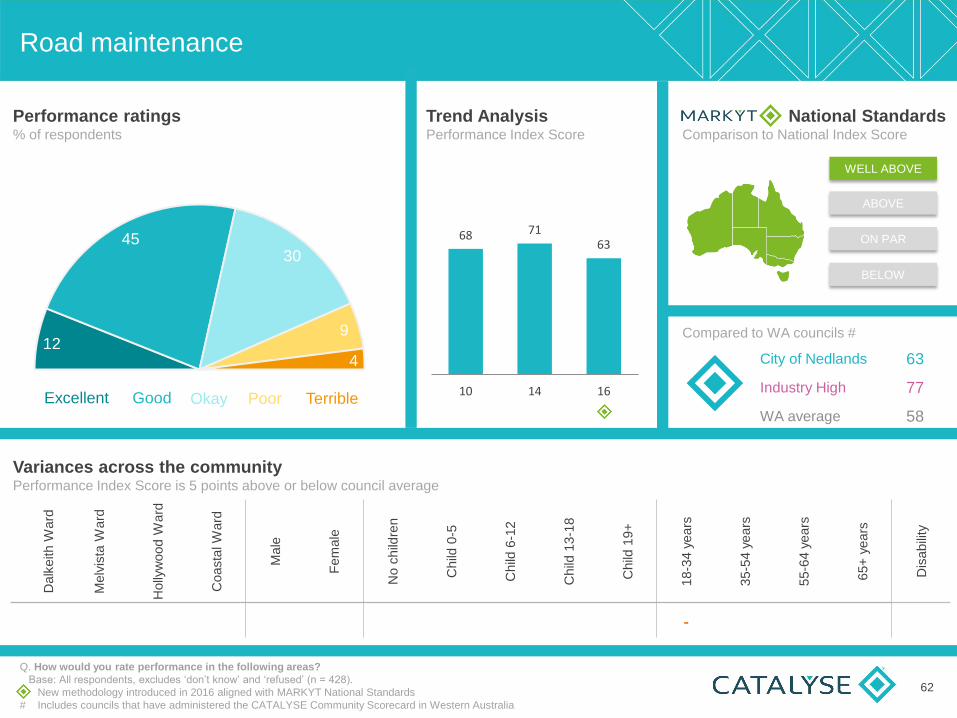
Road maintenance
Q. How would you rate performance in the following areas?
Base: All respondents, excludes ‘don’t know’ and ‘refused’ (n = 428).
New methodology introduced in 2016 aligned with MARKYT National Standards
# Includes councils that have administered the CATALYSE Community Scorecard in Western Australia
12
45 30
9
4
100
Performance ratings % of respondents
Good Okay Excellent Poor Terrible
Trend Analysis Performance Index Score
68 71 63
10 14 16
National Standards Comparison to National Index Score
City of Nedlands 63
Industry High 77
WA average 58
ABOVE
ON PAR
BELOW
WELL ABOVE
Compared to WA councils #
Variances across the community Performance Index Score is 5 points above or below council average
Dalk
eith W
ard
Melv
ista
Ward
Holly
wood W
ard
Coasta
l W
ard
Male
Fem
ale
No c
hild
ren
Child
0-5
Child
6-1
2
Child
13-1
8
Child
19+
18-3
4 y
ears
35-5
4 y
ears
55-6
4 y
ears
65+
years
Dis
abili
ty
-
62
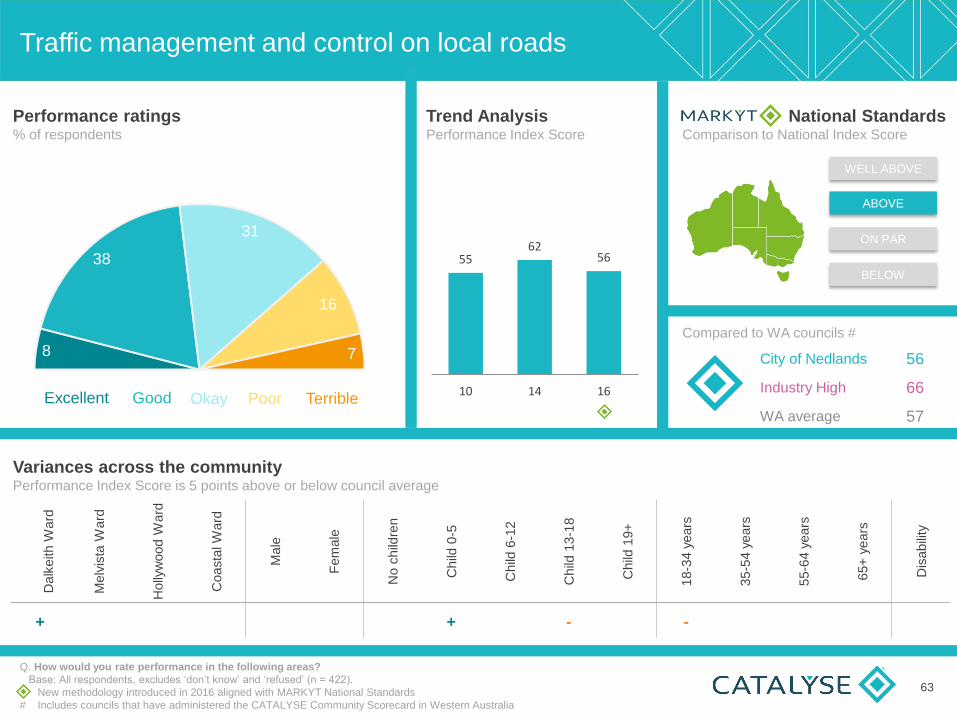
Traffic management and control on local roads
Q. How would you rate performance in the following areas?
Base: All respondents, excludes ‘don’t know’ and ‘refused’ (n = 422).
New methodology introduced in 2016 aligned with MARKYT National Standards
# Includes councils that have administered the CATALYSE Community Scorecard in Western Australia
8
38
31
16
7
100
Performance ratings % of respondents
Good Okay Excellent Poor Terrible
Trend Analysis Performance Index Score
55 62
56
10 14 16
National Standards Comparison to National Index Score
City of Nedlands 56
Industry High 66
WA average 57
ABOVE
ON PAR
BELOW
WELL ABOVE
Compared to WA councils #
Variances across the community Performance Index Score is 5 points above or below council average
Dalk
eith W
ard
Melv
ista
Ward
Holly
wood W
ard
Coasta
l W
ard
Male
Fem
ale
No c
hild
ren
Child
0-5
Child
6-1
2
Child
13-1
8
Child
19+
18-3
4 y
ears
35-5
4 y
ears
55-6
4 y
ears
65+
years
Dis
abili
ty
+ + - -
63

Footpaths and cycleways
Q. How would you rate performance in the following areas?
Base: All respondents, excludes ‘don’t know’ and ‘refused’ (n = 424).
New methodology introduced in 2016 aligned with MARKYT National Standards
# Includes councils that have administered the CATALYSE Community Scorecard in Western Australia
6
35
32
17
9
100
Performance ratings % of respondents
Good Okay Excellent Poor Terrible
Trend Analysis Performance Index Score
61 65
53
10 14 16
National Standards Comparison to National Index Score
City of Nedlands 53
Industry High 72
WA average 57
ABOVE
ON PAR
BELOW
WELL ABOVE
Compared to WA councils #
Variances across the community Performance Index Score is 5 points above or below council average
Dalk
eith W
ard
Melv
ista
Ward
Holly
wood W
ard
Coasta
l W
ard
Male
Fem
ale
No c
hild
ren
Child
0-5
Child
6-1
2
Child
13-1
8
Child
19+
18-3
4 y
ears
35-5
4 y
ears
55-6
4 y
ears
65+
years
Dis
abili
ty
64

Streetscapes
Q. How would you rate performance in the following areas?
Base: All respondents, excludes ‘don’t know’ and ‘refused’ (n = 422).
New methodology introduced in 2016 aligned with MARKYT National Standards
# Includes councils that have administered the CATALYSE Community Scorecard in Western Australia
8
32
39
17
4
100
Performance ratings % of respondents
Good Okay Excellent Poor Terrible
Trend Analysis Performance Index Score
67
56
10 14 16
National Standards Comparison to National Index Score
City of Nedlands 56
Industry High 72
WA average 57
ABOVE
ON PAR
BELOW
WELL ABOVE
Compared to WA councils #
Variances across the community Performance Index Score is 5 points above or below council average
Dalk
eith W
ard
Melv
ista
Ward
Holly
wood W
ard
Coasta
l W
ard
Male
Fem
ale
No c
hild
ren
Child
0-5
Child
6-1
2
Child
13-1
8
Child
19+
18-3
4 y
ears
35-5
4 y
ears
55-6
4 y
ears
65+
years
Dis
abili
ty
-
65
NA
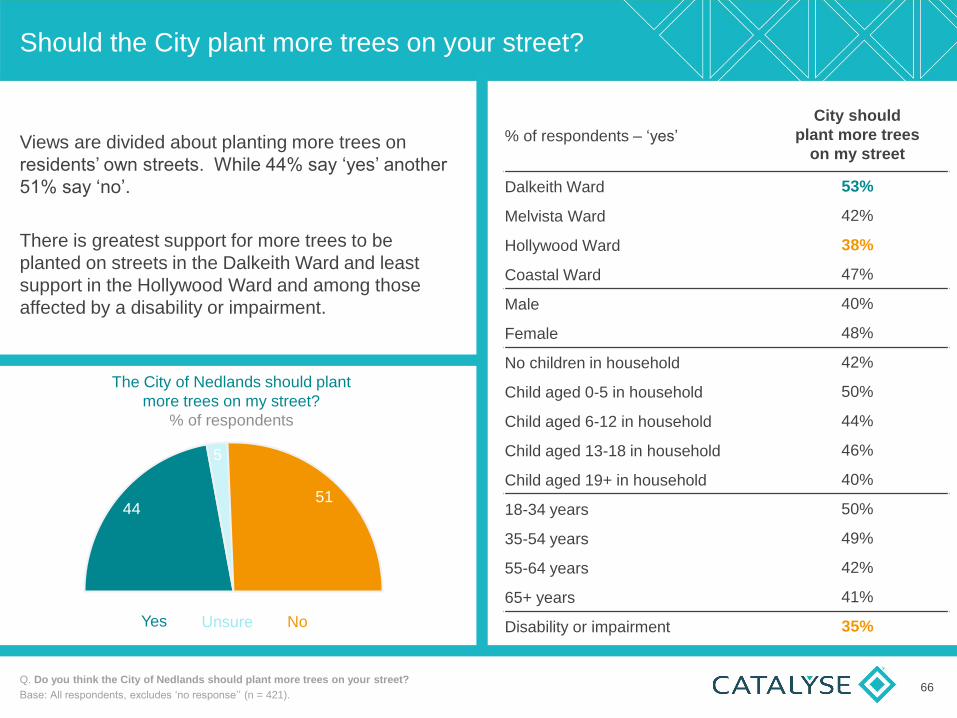
Should the City plant more trees on your street?
44
5
51
Unsure Yes No
The City of Nedlands should plant
more trees on my street?
% of respondents
Q. Do you think the City of Nedlands should plant more trees on your street?
Base: All respondents, excludes ‘no response’’ (n = 421).
Views are divided about planting more trees on
residents’ own streets. While 44% say ‘yes’ another
51% say ‘no’.
There is greatest support for more trees to be
planted on streets in the Dalkeith Ward and least
support in the Hollywood Ward and among those
affected by a disability or impairment.
% of respondents – ‘yes’
City should
plant more trees
on my street
Dalkeith Ward 53%
Melvista Ward 42%
Hollywood Ward 38%
Coastal Ward 47%
Male 40%
Female 48%
No children in household 42%
Child aged 0-5 in household 50%
Child aged 6-12 in household 44%
Child aged 13-18 in household 46%
Child aged 19+ in household 40%
18-34 years 50%
35-54 years 49%
55-64 years 42%
65+ years 41%
Disability or impairment 35%
66

Should the City be more proactive in supplying
and replacing street trees?
63 12
25
Unsure Yes No
The City of Nedlands should be more proactive in
supplying and replacing street trees?
% of respondents
Q. Do you think the City of Nedlands should be more proactive in supplying and replacing street trees?
Base: All respondents, excludes ‘no response’’ (n = 420).
63% of residents think the City should be more
proactive in supplying and replacing street trees.
Support is highest among 18-34 year olds and lowest
among those in the Hollywood Ward and residents
affected by a disability or impairment.
% of respondents – ‘yes’
City should be more
proactive in supplying
& replacing street trees
Dalkeith Ward 67%
Melvista Ward 64%
Hollywood Ward 56%
Coastal Ward 67%
Male 61%
Female 64%
No children in household 60%
Child aged 0-5 in household 59%
Child aged 6-12 in household 60%
Child aged 13-18 in household 61%
Child aged 19+ in household 68%
18-34 years 80%
35-54 years 62%
55-64 years 68%
65+ years 60%
Disability or impairment 52%
67

Street lighting
Q. How would you rate performance in the following areas?
Base: All respondents, excludes ‘don’t know’ and ‘refused’ (n = 427).
New methodology introduced in 2016 aligned with MARKYT National Standards
# Includes councils that have administered the CATALYSE Community Scorecard in Western Australia
7
41
33
14
5
100
Performance ratings % of respondents
Good Okay Excellent Poor Terrible
Trend Analysis Performance Index Score
58
10 14 16
National Standards Comparison to National Index Score
City of Nedlands 58
Industry High 75
WA average 60
ABOVE
ON PAR
BELOW
WELL ABOVE
Compared to WA councils #
Variances across the community Performance Index Score is 5 points above or below council average
Dalk
eith W
ard
Melv
ista
Ward
Holly
wood W
ard
Coasta
l W
ard
Male
Fem
ale
No c
hild
ren
Child
0-5
Child
6-1
2
Child
13-1
8
Child
19+
18-3
4 y
ears
35-5
4 y
ears
55-6
4 y
ears
65+
years
Dis
abili
ty
+ - -
68
NA NA

Parking management and control
Q. How would you rate performance in the following areas?
Base: All respondents, excludes ‘don’t know’ and ‘refused’ (n = 405).
New methodology introduced in 2016 aligned with MARKYT National Standards
# Includes councils that have administered the CATALYSE Community Scorecard in Western Australia
4
33
41
12
9
100
Performance ratings % of respondents
Good Okay Excellent Poor Terrible
Trend Analysis Performance Index Score
56 61
52
10 14 16
National Standards Comparison to National Index Score
City of Nedlands 52
Industry High 68
WA average 54
ABOVE
ON PAR
BELOW
WELL ABOVE
Compared to WA councils #
Variances across the community Performance Index Score is 5 points above or below council average
Dalk
eith W
ard
Melv
ista
Ward
Holly
wood W
ard
Coasta
l W
ard
Male
Fem
ale
No c
hild
ren
Child
0-5
Child
6-1
2
Child
13-1
8
Child
19+
18-3
4 y
ears
35-5
4 y
ears
55-6
4 y
ears
65+
years
Dis
abili
ty
-
69

Should the City tighten parking restrictions in
residential areas?
40
11
49
Unsure Yes No
The City of Nedlands should tighten
parking restrictions in residential areas
% of respondents
Q. Do you think the City of Nedlands should tighten parking restrictions in residential areas?
Base: All respondents, excludes ‘no response’’ (n = 422).
Views are divided about tightening parking restrictions in residential areas. While 49% say ‘no’, another 40% say ‘yes’.
There is greater support for tightening restrictions in the Melvista and Hollywood Wards, and among seniors.
Support is lower among those in the Coast Ward and with young children.
% of respondents - ‘yes’
City should tighten
parking restrictions in
residential areas
Dalkeith Ward 37%
Melvista Ward 47%
Hollywood Ward 44%
Coastal Ward 27%
Male 42%
Female 37%
No children in household 43%
Child aged 0-5 in household 19%
Child aged 6-12 in household 38%
Child aged 13-18 in household 39%
Child aged 19+ in household 34%
18-34 years 10%
35-54 years 37%
55-64 years 27%
65+ years 51%
Disability or impairment 40%
70
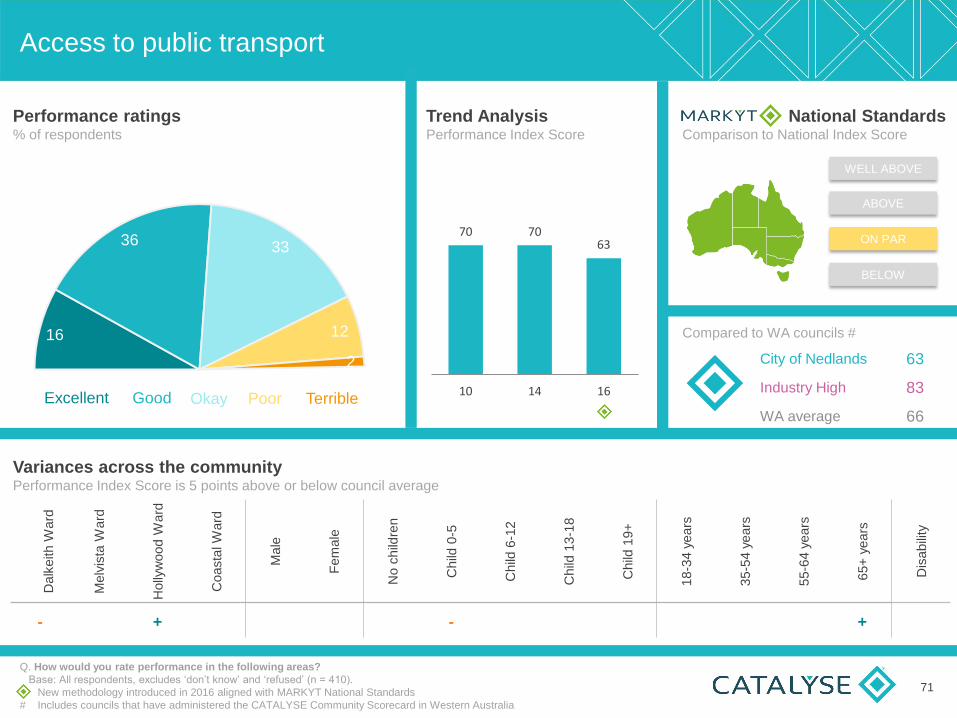
Access to public transport
Q. How would you rate performance in the following areas?
Base: All respondents, excludes ‘don’t know’ and ‘refused’ (n = 410).
New methodology introduced in 2016 aligned with MARKYT National Standards
# Includes councils that have administered the CATALYSE Community Scorecard in Western Australia
16
36 33
12
2
100
Performance ratings % of respondents
Good Okay Excellent Poor Terrible
Trend Analysis Performance Index Score
70 70 63
10 14 16
National Standards Comparison to National Index Score
City of Nedlands 63
Industry High 83
WA average 66
ABOVE
ON PAR
BELOW
WELL ABOVE
Compared to WA councils #
Variances across the community Performance Index Score is 5 points above or below council average
Dalk
eith W
ard
Melv
ista
Ward
Holly
wood W
ard
Coasta
l W
ard
Male
Fem
ale
No c
hild
ren
Child
0-5
Child
6-1
2
Child
13-1
8
Child
19+
18-3
4 y
ears
35-5
4 y
ears
55-6
4 y
ears
65+
years
Dis
abili
ty
- + - +
71

Natural Environment
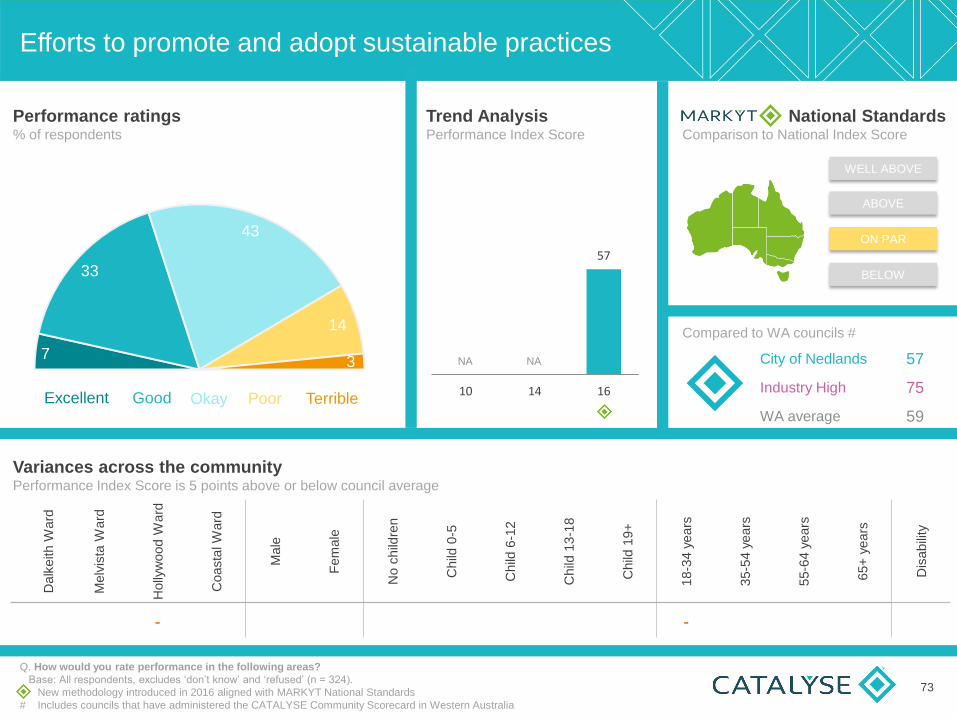
Efforts to promote and adopt sustainable practices
Q. How would you rate performance in the following areas?
Base: All respondents, excludes ‘don’t know’ and ‘refused’ (n = 324).
New methodology introduced in 2016 aligned with MARKYT National Standards
# Includes councils that have administered the CATALYSE Community Scorecard in Western Australia
7
33
43
14
3
100
Performance ratings % of respondents
Good Okay Excellent Poor Terrible
Trend Analysis Performance Index Score
57
10 14 16
National Standards Comparison to National Index Score
City of Nedlands 57
Industry High 75
WA average 59
ABOVE
ON PAR
BELOW
WELL ABOVE
Compared to WA councils #
Variances across the community Performance Index Score is 5 points above or below council average
Dalk
eith W
ard
Melv
ista
Ward
Holly
wood W
ard
Coasta
l W
ard
Male
Fem
ale
No c
hild
ren
Child
0-5
Child
6-1
2
Child
13-1
8
Child
19+
18-3
4 y
ears
35-5
4 y
ears
55-6
4 y
ears
65+
years
Dis
abili
ty
- -
73
NA NA

Weekly rubbish collections
Q. How would you rate performance in the following areas?
Base: All respondents, excludes ‘don’t know’ and ‘refused’ (n = 426).
New methodology introduced in 2016 aligned with MARKYT National Standards
# Includes councils that have administered the CATALYSE Community Scorecard in Western Australia
38
48
13
1 0
100
Performance ratings % of respondents
Good Okay Excellent Poor Terrible
Trend Analysis Performance Index Score
85 88 81
10 14 16
National Standards Comparison to National Index Score
City of Nedlands 81
Industry High 88
WA average 82
ABOVE
ON PAR
BELOW
WELL ABOVE
Compared to WA councils #
Variances across the community Performance Index Score is 5 points above or below council average
Dalk
eith W
ard
Melv
ista
Ward
Holly
wood W
ard
Coasta
l W
ard
Male
Fem
ale
No c
hild
ren
Child
0-5
Child
6-1
2
Child
13-1
8
Child
19+
18-3
4 y
ears
35-5
4 y
ears
55-6
4 y
ears
65+
years
Dis
abili
ty
74

Fortnightly recycling collections
Q. How would you rate performance in the following areas?
Base: All respondents, excludes ‘don’t know’ and ‘refused’ (n = 427).
New methodology introduced in 2016 aligned with MARKYT National Standards
# Includes councils that have administered the CATALYSE Community Scorecard in Western Australia
38
47
14
1 0
100
Performance ratings % of respondents
Good Okay Excellent Poor Terrible
Trend Analysis Performance Index Score
84 84 81
10 14 16
National Standards Comparison to National Index Score
City of Nedlands 81
Industry High 89
WA average 78
ABOVE
ON PAR
BELOW
WELL ABOVE
Compared to WA councils #
Variances across the community Performance Index Score is 5 points above or below council average
Dalk
eith W
ard
Melv
ista
Ward
Holly
wood W
ard
Coasta
l W
ard
Male
Fem
ale
No c
hild
ren
Child
0-5
Child
6-1
2
Child
13-1
8
Child
19+
18-3
4 y
ears
35-5
4 y
ears
55-6
4 y
ears
65+
years
Dis
abili
ty
-
75

Fortnightly green waste collections
Q. How would you rate performance in the following areas?
Base: All respondents, excludes ‘don’t know’ and ‘refused’ (n = 420).
New methodology introduced in 2016 aligned with MARKYT National Standards
# Includes councils that have administered the CATALYSE Community Scorecard in Western Australia
39
46
14
1 0
100
Performance ratings % of respondents
Good Okay Excellent Poor Terrible
Trend Analysis Performance Index Score
86 80
10 14 16
National Standards Comparison to National Index Score
City of Nedlands 80
Industry High NA
WA average NA
ABOVE
ON PAR
BELOW
WELL ABOVE
Compared to WA councils #
Variances across the community Performance Index Score is 5 points above or below council average
Dalk
eith W
ard
Melv
ista
Ward
Holly
wood W
ard
Coasta
l W
ard
Male
Fem
ale
No c
hild
ren
Child
0-5
Child
6-1
2
Child
13-1
8
Child
19+
18-3
4 y
ears
35-5
4 y
ears
55-6
4 y
ears
65+
years
Dis
abili
ty
-
76
NA
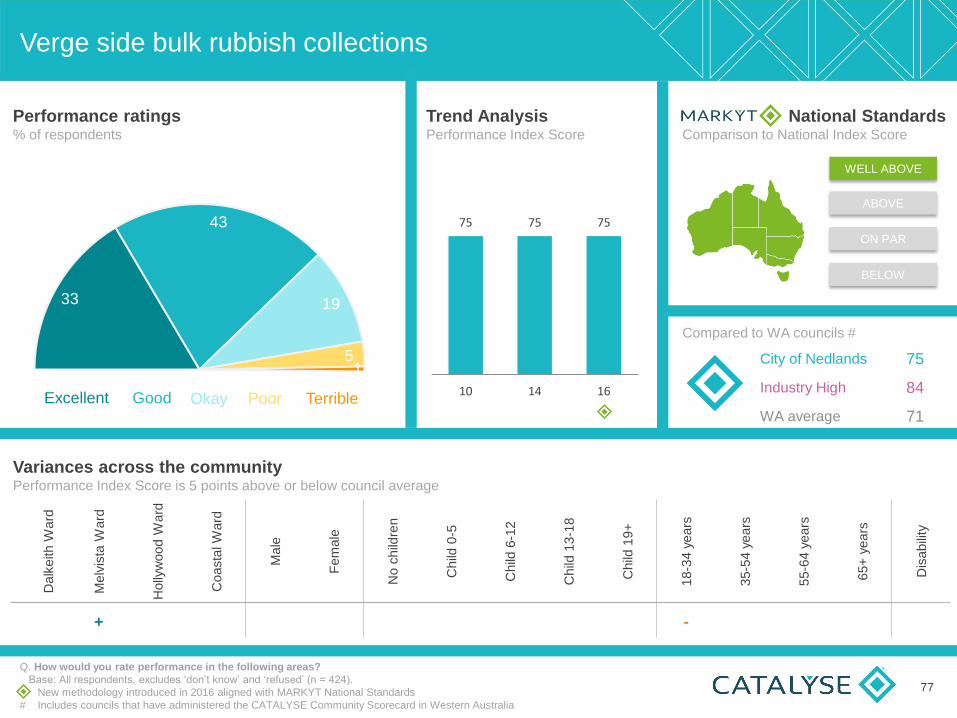
Verge side bulk rubbish collections
Q. How would you rate performance in the following areas?
Base: All respondents, excludes ‘don’t know’ and ‘refused’ (n = 424).
New methodology introduced in 2016 aligned with MARKYT National Standards
# Includes councils that have administered the CATALYSE Community Scorecard in Western Australia
33
43
19
5 1
100
Performance ratings % of respondents
Good Okay Excellent Poor Terrible
Trend Analysis Performance Index Score
75 75 75
10 14 16
National Standards Comparison to National Index Score
City of Nedlands 75
Industry High 84
WA average 71
ABOVE
ON PAR
BELOW
WELL ABOVE
Compared to WA councils #
Variances across the community Performance Index Score is 5 points above or below council average
Dalk
eith W
ard
Melv
ista
Ward
Holly
wood W
ard
Coasta
l W
ard
Male
Fem
ale
No c
hild
ren
Child
0-5
Child
6-1
2
Child
13-1
8
Child
19+
18-3
4 y
ears
35-5
4 y
ears
55-6
4 y
ears
65+
years
Dis
abili
ty
+ -
77

Management of food, health, noise and pollution issues
Q. How would you rate performance in the following areas?
Base: All respondents, excludes ‘don’t know’ and ‘refused’ (n = 298).
New methodology introduced in 2016 aligned with MARKYT National Standards
# Includes councils that have administered the CATALYSE Community Scorecard in Western Australia
10
43 36
9
2
100
Performance ratings % of respondents
Good Okay Excellent Poor Terrible
Trend Analysis Performance Index Score
63 66 62
10 14 16
National Standards Comparison to National Index Score
City of Nedlands 62
Industry High 73
WA average 58
ABOVE
ON PAR
BELOW
WELL ABOVE
Compared to WA councils #
Variances across the community Performance Index Score is 5 points above or below council average
Dalk
eith W
ard
Melv
ista
Ward
Holly
wood W
ard
Coasta
l W
ard
Male
Fem
ale
No c
hild
ren
Child
0-5
Child
6-1
2
Child
13-1
8
Child
19+
18-3
4 y
ears
35-5
4 y
ears
55-6
4 y
ears
65+
years
Dis
abili
ty
+
78

Animal and pest control
Q. How would you rate performance in the following areas?
Base: All respondents, excludes ‘don’t know’ and ‘refused’ (n = 303).
New methodology introduced in 2016 aligned with MARKYT National Standards
# Includes councils that have administered the CATALYSE Community Scorecard in Western Australia
9
38 38
12
4
100
Performance ratings % of respondents
Good Okay Excellent Poor Terrible
Trend Analysis Performance Index Score
66 67 59
10 14 16
National Standards Comparison to National Index Score
City of Nedlands 59
Industry High 76
WA average 58
ABOVE
ON PAR
BELOW
WELL ABOVE
Compared to WA councils #
Variances across the community Performance Index Score is 5 points above or below council average
Dalk
eith W
ard
Melv
ista
Ward
Holly
wood W
ard
Coasta
l W
ard
Male
Fem
ale
No c
hild
ren
Child
0-5
Child
6-1
2
Child
13-1
8
Child
19+
18-3
4 y
ears
35-5
4 y
ears
55-6
4 y
ears
65+
years
Dis
abili
ty
-
79

Use of, and communication about the use of
pesticides used for weed and pest control
Q. How would you rate performance in the following areas?
Base: All respondents, excludes ‘don’t know’ and ‘refused’ (n = 289).
New methodology introduced in 2016 aligned with MARKYT National Standards
# Includes councils that have administered the CATALYSE Community Scorecard in Western Australia
6
24
34
26
10
100
Performance ratings % of respondents
Good Okay Excellent Poor Terrible
Trend Analysis Performance Index Score
48
10 14 16
National Standards Comparison to National Index Score
City of Nedlands 48
Industry High NA
WA average NA
ABOVE
ON PAR
BELOW
WELL ABOVE
Compared to WA councils #
Variances across the community Performance Index Score is 5 points above or below council average
Dalk
eith W
ard
Melv
ista
Ward
Holly
wood W
ard
Coasta
l W
ard
Male
Fem
ale
No c
hild
ren
Child
0-5
Child
6-1
2
Child
13-1
8
Child
19+
18-3
4 y
ears
35-5
4 y
ears
55-6
4 y
ears
65+
years
Dis
abili
ty
- -
80
NA NA

Overview of Community Variances

Summary of community variances C
om
munity
Govern
ance
82
Dalk
eith
Ward
Melv
ista
Ward
Holly
wood
Ward
Coasta
l
Ward
Male
Fem
ale
No c
hild
ren
Child
0-5
Child
6-1
2
Child
13-1
8
Child
19+
18-3
4 y
ears
35-5
4 y
ears
55-6
4 y
ears
55+
years
Dis
abili
ty
A place to live +
Governing Organisation - + Value for money - - + Leadership - + Promoting the area - Transparency - + Consultation - + Informing community - + Website - - Newsletter - + Newpaper - + Customer service - Babies & toddlers - - - Youth + - + - - + Families
Seniors + - + + Disability - - - Community buildings + Sport & recreation - - + Sporting clubs - + + Playgrounds, parks & reserves + - - - + Library - - + Festivals, events & cultural - Public art - + Safety & security + - Graffiti, vandalism & ASB + +
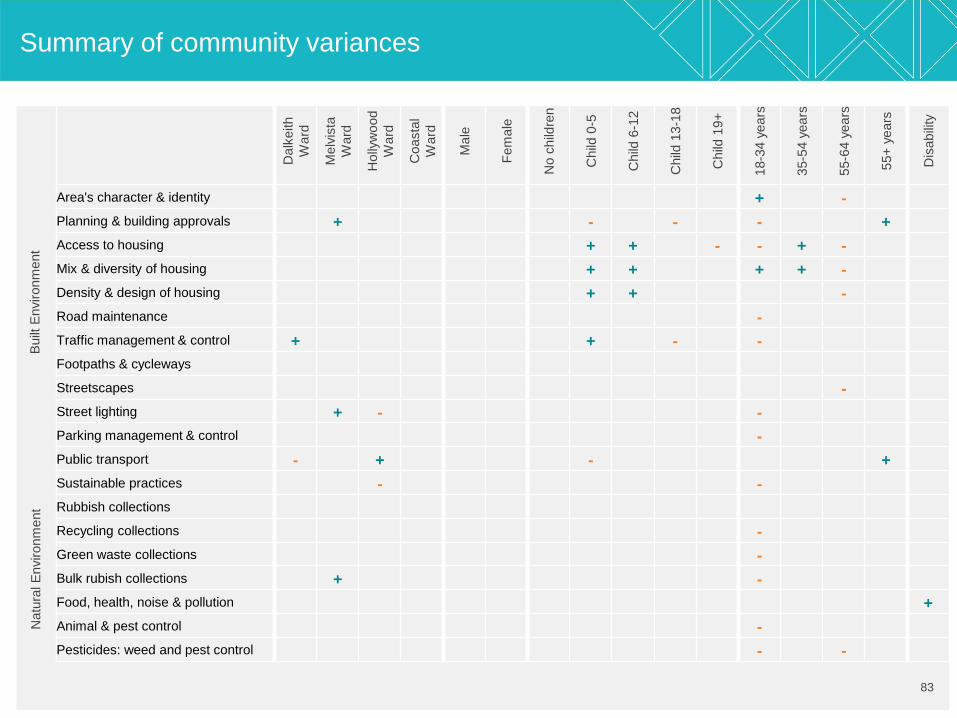
Summary of community variances B
uilt
Environm
ent
Natu
ral E
nvironm
ent
83
Dalk
eith
Ward
Melv
ista
Ward
Holly
wood
Ward
Coasta
l
Ward
Male
Fem
ale
No c
hild
ren
Child
0-5
Child
6-1
2
Child
13-1
8
Child
19+
18-3
4 y
ears
35-5
4 y
ears
55-6
4 y
ears
55+
years
Dis
abili
ty
Area's character & identity + -
Planning & building approvals + - - - +
Access to housing + + - - + -
Mix & diversity of housing + + + + -
Density & design of housing + + -
Road maintenance -
Traffic management & control + + - -
Footpaths & cycleways
Streetscapes -
Street lighting + - -
Parking management & control -
Public transport - + - +
Sustainable practices - -
Rubbish collections
Recycling collections -
Green waste collections -
Bulk rubish collections + -
Food, health, noise & pollution +
Animal & pest control -
Pesticides: weed and pest control - -

Moving Forward

Overall, the City of Nedlands continues to be a sound performer. As a place to live, the
City’s performance index score is above the MARKYT National Index Score, and as a
governing organisation, the City’s score is on par with the national standard.
The City has perceived strengths in waste services, road maintenance and traffic
management. These areas are all performing above the MARKYT National Index Scores.
Moving forward, the community would like the City to focus on 6 key priorities:
1. Footpaths and cycleways
2. The management of trees and other vegetation
3. Parking management and control
4. Traffic management and control
5. Planning and building approvals, especially relating to housing density and design
6. Underground power
The City may also like to review ways to improve leadership, consultation, communication,
and services for youth as these areas are performing below the national standards.
Moving Forward
85

www.catalyse.com.au
Office 3, 996 Hay Street, Perth WA 6000
PO Box 8007, Cloisters Square WA 6850
Phone +618 9226 5674
Email: [email protected]
ABN 20 108 620 855


