Download - 2015 Visitor Satisfaction Monitoring Report

2015
Visitor Satisfaction
Monitoring Report
First Quarter
(January – March)
Hawai‘i Convention Center
1801 Kalākaua Avenue
Honolulu, Hawai‘i 96815
(808) 973-2255
www.hawaiitourismauthority.org

Hawai‘i Tourism Authority 1 Visitor Satisfaction Monitoring Report
– First Quarter 2015
INTRODUCTION
This quarterly monitoring report presents selected preliminary statistics from the first quarter of the
2015 Visitor Satisfaction and Activity (VSAT) Survey. The survey measures the opinions of visitors
from six Major Market Areas (MMAs): U.S. West, U.S. East, Japan, Canada, Europe and Oceania,
regarding their satisfaction with Hawai‘i as a visitor destination.
The VSAT report highlights survey respondents’ evaluation of their vacation experience, including:
overall satisfaction with their most recent vacation to Hawai‘i, trip expectations, likelihood to
recommend Hawai‘i, likelihood to revisit Hawai‘i, reasons for not revisiting Hawai‘i, and satisfaction
by island.
Condition of Visitor Industry
There were 2,085,006 visitors who came by air to the Hawaiian Islands in the first quarter (January –
March) of 2015. This represented a growth of 2.9 percent compared to the first quarter of 2014.
Arrivals from U.S. West increased 8.5 percent to 787,333 visitors. However, the number of U.S. East
visitors declined 2.5 percent to 467,964 visitors. There was also a decrease in Japanese arrivals (-4.7%)
to 358,880 visitors. Canadian arrivals of 214,835 (+0.8%) were up slightly compared to a year ago.
Arrivals from Oceania climbed 21.5 percent to 111,857 visitors in the first quarter of 2015. There were
26,554 visitors from Europe, which was a 4.9 percent drop from the first quarter of 2014. The average
length of stay for all visitors to the state was 9.63 days, similar to the same quarter last year.
Arrivals increased on O‘ahu (+0.9% to 1,255,318 visitors), Maui (+4.8% to 636,965 visitors), Hawai‘i
Island (+2.5% to 389,044 visitors) and Kaua‘i (+6% to 284,367) compared to the first quarter of 2014.
Hawai‘i Tourism Authority 2 Visitor Satisfaction Monitoring Report
– First Quarter 2015
VISITOR SATISFACTION RATINGS
Visitor satisfaction is an important indicator of industry performance. Because it is based on visitor
evaluations, it provides vital feedback concerning how well services are delivered in Hawai‘i. Satisfying
visitors’ needs and expectations encourages return trips to the islands. Satisfied customers also
develop a fondness for the destination and tend to share their favorable assessment with others. Figure
1 Overall Ratings of Trip, shows the percent of respondents who rated their trip as excellent (7 or 8,
on an 8-point scale). The majority of visitors from the six MMAs continued to give the highest marks
for their overall experience in Hawai‘i.
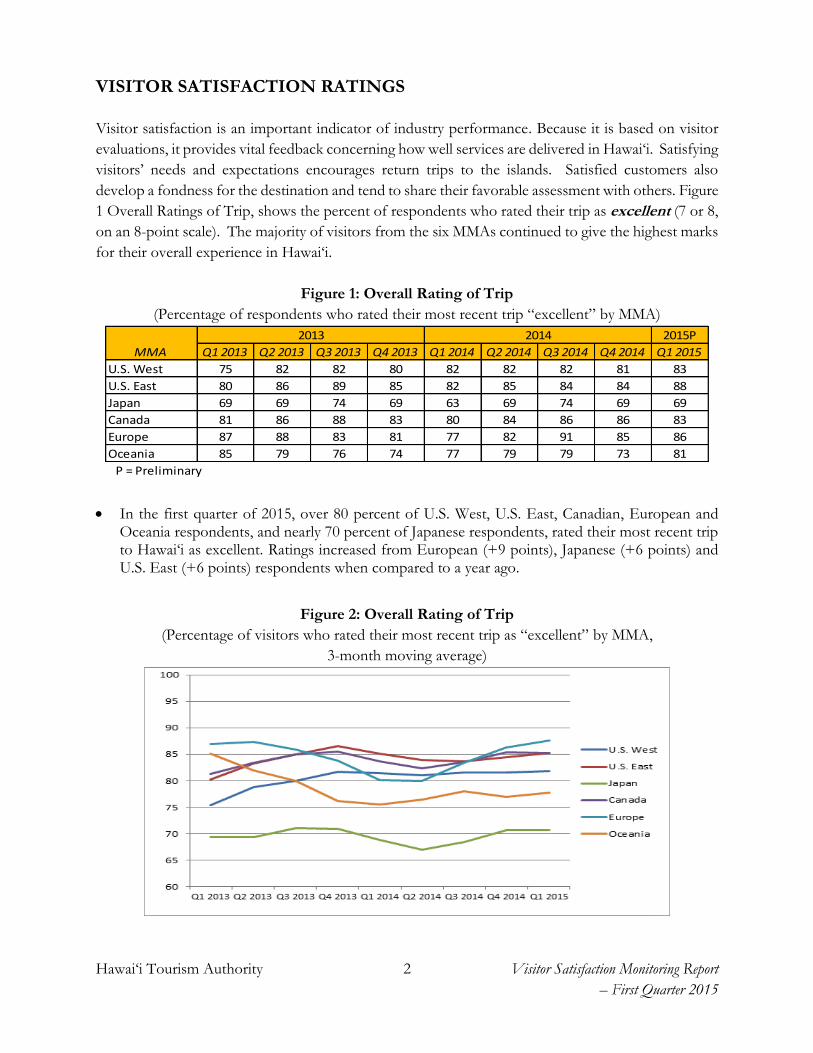
Figure 1: Overall Rating of Trip
(Percentage of respondents who rated their most recent trip “excellent” by MMA)
In the first quarter of 2015, over 80 percent of U.S. West, U.S. East, Canadian, European and Oceania respondents, and nearly 70 percent of Japanese respondents, rated their most recent trip to Hawai‘i as excellent. Ratings increased from European (+9 points), Japanese (+6 points) and U.S. East (+6 points) respondents when compared to a year ago.
Figure 2: Overall Rating of Trip
(Percentage of visitors who rated their most recent trip as “excellent” by MMA,
3-month moving average)
2015P
MMA Q1 2013 Q2 2013 Q3 2013 Q4 2013 Q1 2014 Q2 2014 Q3 2014 Q4 2014 Q1 2015
U.S. West 75 82 82 80 82 82 82 81 83
U.S. East 80 86 89 85 82 85 84 84 88
Japan 69 69 74 69 63 69 74 69 69
Canada 81 86 88 83 80 84 86 86 83
Europe 87 88 83 81 77 82 91 85 86
Oceania 85 79 76 74 77 79 79 73 81
P = Preliminary
2013 2014

Hawai‘i Tourism Authority 3 Visitor Satisfaction Monitoring Report
– First Quarter 2015
Figure 2 shows the trend lines for overall satisfaction of respondents in each MMA. The trend lines
represent three-quarter moving averages except for the data points for first quarter 2013 which
includes only first quarter 2013 data, and second quarter 2013 which is represents the calculated
average of first and second 2013 quarter ratings for each MMA.
For U.S. East, Japanese, Canadian and Oceania respondents, after small declines in the first and second
quarters of 2014, overall satisfaction ratings have stabilized in recent quarters. Ratings by European
respondents have been trending upward since the third quarter of 2014. Ratings from U.S. West
respondents have been fairly consistent, resulting in a flat trend line.
Exceeded Expectations
Visitors’ satisfaction is largely influenced by the level of service they received and by visitors’ own
needs, interests, and expectations. Therefore, it is important to measure how well the destination is
able to provide the expected experience. Overall, Hawai‘i’s ability to exceed expectations continues
to be strong and consistent. Few visitors (5% or less) felt that Hawai‘i “did not meet their
expectations” at all.
Figure 3: Trip Exceeds Expectations
(Percentage of visitors who said this trip “Exceeded Expectations” by MMA)
In the first quarter of 2015, 56 percent of European respondents said their recent trip to Hawai‘i exceeded expectations. This was an 8 point increase compared to the first quarter of 2014. Japanese visitors’ rating improved 5 points to 34 percent.
2015P
MMA Q1 2013 Q2 2013 Q3 2013 Q4 2013 Q1 2014 Q2 2014 Q3 2014 Q4 2014 Q1 2015
U.S. West 37 39 41 36 33 34 38 34 36
U.S. East 44 51 53 47 45 53 51 46 43
Japan 31 29 35 33 29 31 35 36 34
Canada 36 43 51 41 35 46 54 39 37
Europe 48 51 53 46 48 40 55 52 56
Oceania 44 40 38 38 38 33 37 40 43
P = Preliminary
2013 2014
Hawai‘i Tourism Authority 4 Visitor Satisfaction Monitoring Report
– First Quarter 2015
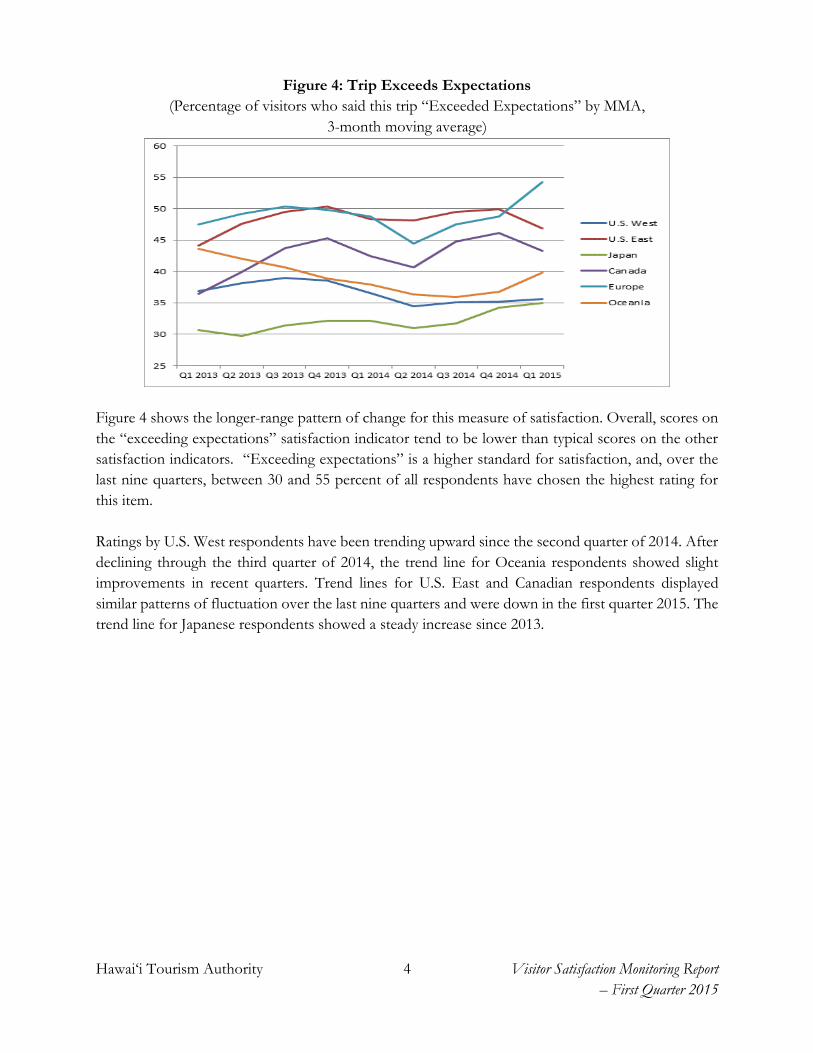
Figure 4: Trip Exceeds Expectations
(Percentage of visitors who said this trip “Exceeded Expectations” by MMA,
3-month moving average)
Figure 4 shows the longer-range pattern of change for this measure of satisfaction. Overall, scores on
the “exceeding expectations” satisfaction indicator tend to be lower than typical scores on the other
satisfaction indicators. “Exceeding expectations” is a higher standard for satisfaction, and, over the
last nine quarters, between 30 and 55 percent of all respondents have chosen the highest rating for
this item.
Ratings by U.S. West respondents have been trending upward since the second quarter of 2014. After
declining through the third quarter of 2014, the trend line for Oceania respondents showed slight
improvements in recent quarters. Trend lines for U.S. East and Canadian respondents displayed
similar patterns of fluctuation over the last nine quarters and were down in the first quarter 2015. The
trend line for Japanese respondents showed a steady increase since 2013.
Hawai‘i Tourism Authority 5 Visitor Satisfaction Monitoring Report
– First Quarter 2015
Very Likely to Recommend Hawai‘i
Visitors who are highly satisfied with their trip are more likely to recommend their destination to
friends and family. Relatively high percentages of visitors to Hawai‘i have reported that they would
be very likely to recommend this destination to others. Less than 3 percent of visitors from each
markets were “not too likely” or “not at all likely” to recommend Hawai‘i.
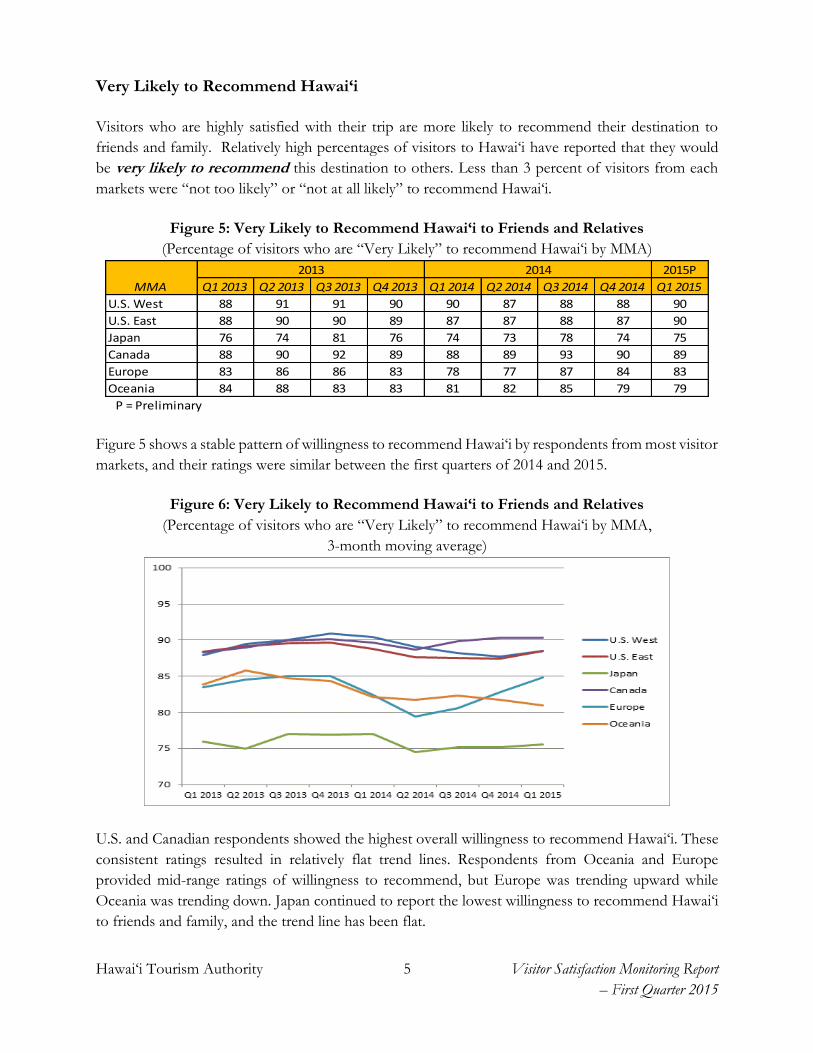
Figure 5: Very Likely to Recommend Hawai‘i to Friends and Relatives
(Percentage of visitors who are “Very Likely” to recommend Hawai‘i by MMA)
Figure 5 shows a stable pattern of willingness to recommend Hawai‘i by respondents from most visitor
markets, and their ratings were similar between the first quarters of 2014 and 2015.
Figure 6: Very Likely to Recommend Hawai‘i to Friends and Relatives
(Percentage of visitors who are “Very Likely” to recommend Hawai‘i by MMA,
3-month moving average)
U.S. and Canadian respondents showed the highest overall willingness to recommend Hawai‘i. These
consistent ratings resulted in relatively flat trend lines. Respondents from Oceania and Europe
provided mid-range ratings of willingness to recommend, but Europe was trending upward while
Oceania was trending down. Japan continued to report the lowest willingness to recommend Hawai‘i
to friends and family, and the trend line has been flat.
2015P
MMA Q1 2013 Q2 2013 Q3 2013 Q4 2013 Q1 2014 Q2 2014 Q3 2014 Q4 2014 Q1 2015
U.S. West 88 91 91 90 90 87 88 88 90
U.S. East 88 90 90 89 87 87 88 87 90
Japan 76 74 81 76 74 73 78 74 75
Canada 88 90 92 89 88 89 93 90 89
Europe 83 86 86 83 78 77 87 84 83
Oceania 84 88 83 83 81 82 85 79 79
P = Preliminary
2013 2014
Hawai‘i Tourism Authority 6 Visitor Satisfaction Monitoring Report
– First Quarter 2015
Likely to Revisit Hawai‘i
The satisfaction indicator Likelihood to Revisit Hawai‘i is useful in estimating future demand and
predicting numbers and characteristics of repeat visitors.
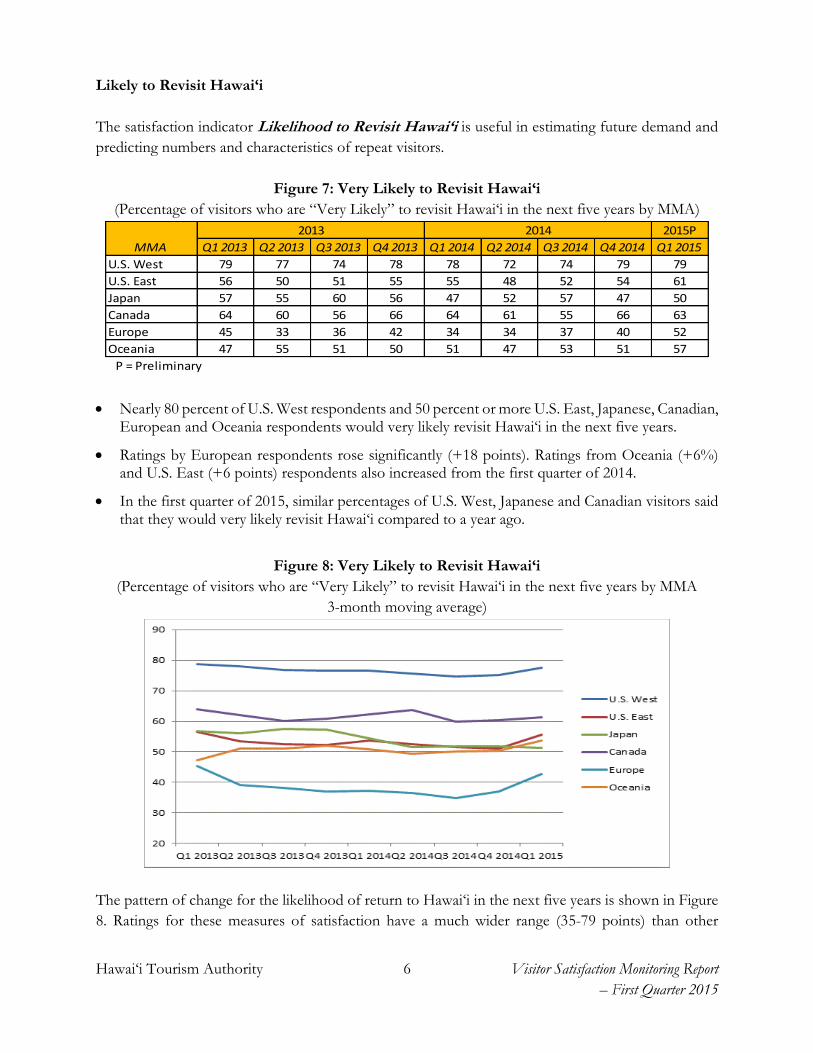
Figure 7: Very Likely to Revisit Hawai‘i
(Percentage of visitors who are “Very Likely” to revisit Hawai‘i in the next five years by MMA)
Nearly 80 percent of U.S. West respondents and 50 percent or more U.S. East, Japanese, Canadian, European and Oceania respondents would very likely revisit Hawai‘i in the next five years.
Ratings by European respondents rose significantly (+18 points). Ratings from Oceania (+6%) and U.S. East (+6 points) respondents also increased from the first quarter of 2014.
In the first quarter of 2015, similar percentages of U.S. West, Japanese and Canadian visitors said that they would very likely revisit Hawai‘i compared to a year ago.
Figure 8: Very Likely to Revisit Hawai‘i
(Percentage of visitors who are “Very Likely” to revisit Hawai‘i in the next five years by MMA
3-month moving average)
The pattern of change for the likelihood of return to Hawai‘i in the next five years is shown in Figure
8. Ratings for these measures of satisfaction have a much wider range (35-79 points) than other
2015P
MMA Q1 2013 Q2 2013 Q3 2013 Q4 2013 Q1 2014 Q2 2014 Q3 2014 Q4 2014 Q1 2015
U.S. West 79 77 74 78 78 72 74 79 79
U.S. East 56 50 51 55 55 48 52 54 61
Japan 57 55 60 56 47 52 57 47 50
Canada 64 60 56 66 64 61 55 66 63
Europe 45 33 36 42 34 34 37 40 52
Oceania 47 55 51 50 51 47 53 51 57
P = Preliminary
2013 2014
Hawai‘i Tourism Authority 7 Visitor Satisfaction Monitoring Report
– First Quarter 2015
measures of satisfaction. For U.S. West, U.S. East, Canada, Europe and Oceania, trend lines have
been relatively flat through 2014 and increased slightly in the first quarter of 2015. The trend line for
Japan has been fairly stable since the first quarter of 2014.
Reasons for Not Revisiting Hawai‘i
Visitors who said that they would not likely revisit Hawai‘i cited many reasons for that decision.
Understanding those reasons allows us to distinguish dissatisfied visitors (i.e., those who are unwilling
to return) from those who are unable to return due to health, financial, or other constraints.
In Figures 9 through 14, visitors’ reasons for not returning were separated into two groups: “barriers
to returning” and “performance issues.” Barriers appear at the top of each chart and performance
issues are at the bottom. “Not enough value for the price” is similar to “too expensive,” but is a
complaint about the quality of the product rather than its price tag. Note that the statistic reported for
each reason for not revisiting Hawai‘i is a percentage of those who were “not likely to revisit Hawai‘i.”
Across all visitor markets in the first quarter of 2015, very few (less than 5%) said that they will not
be returning due to poor service or unfriendly people.
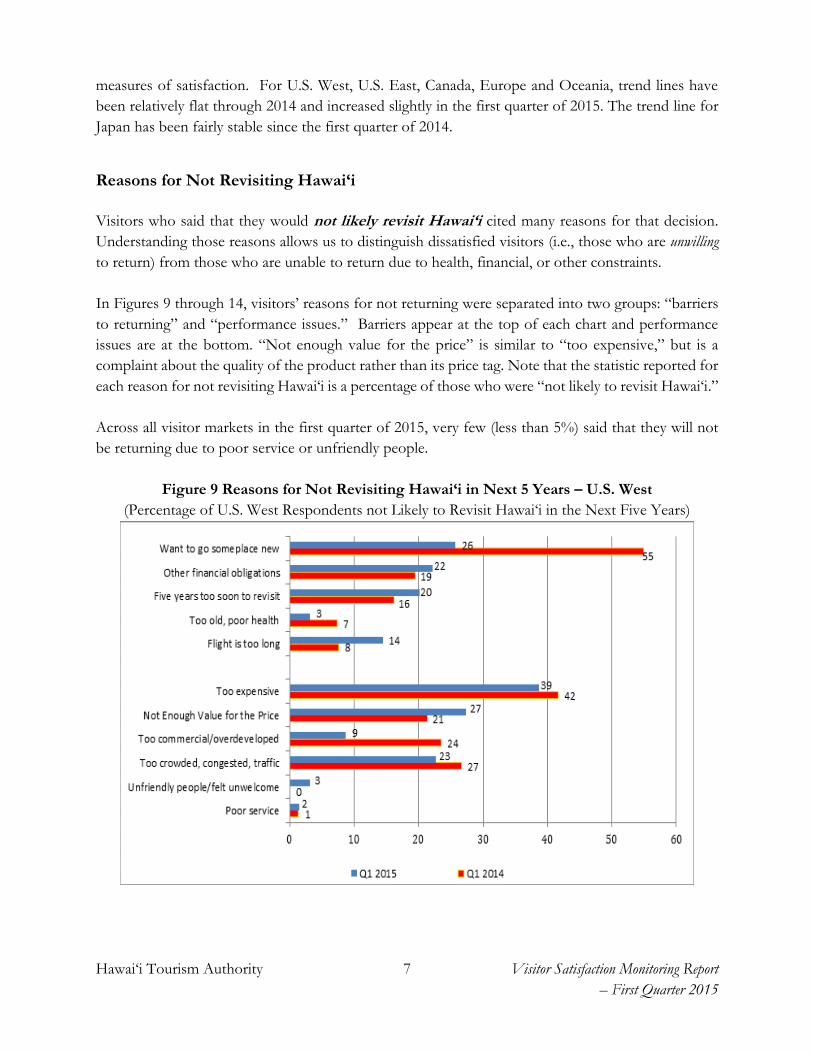
Figure 9 Reasons for Not Revisiting Hawai‘i in Next 5 Years – U.S. West
(Percentage of U.S. West Respondents not Likely to Revisit Hawai‘i in the Next Five Years)
Hawai‘i Tourism Authority 8 Visitor Satisfaction Monitoring Report
– First Quarter 2015
A much lower percentage of U.S. West respondents cited the desire to go someplace new (26%) as a barrier for returning to Hawai‘i compared to the first quarter of 2014 (55%). More visitors said that five years is too soon to revisit (+4 points to 20%) and the flight is too long (+6 points to 14%).
In terms of performance issues, 39 percent of U.S. West respondents said that they will not be returning because Hawai‘i is too expensive. More U.S. West respondents said that there is not enough value for the price (+6 points to 27%), but fewer said that Hawai‘i is too commercial/overdeveloped (-15 points to 9%), or too crowded/congested (-4 points to 23%) compared to the first quarter of 2014.
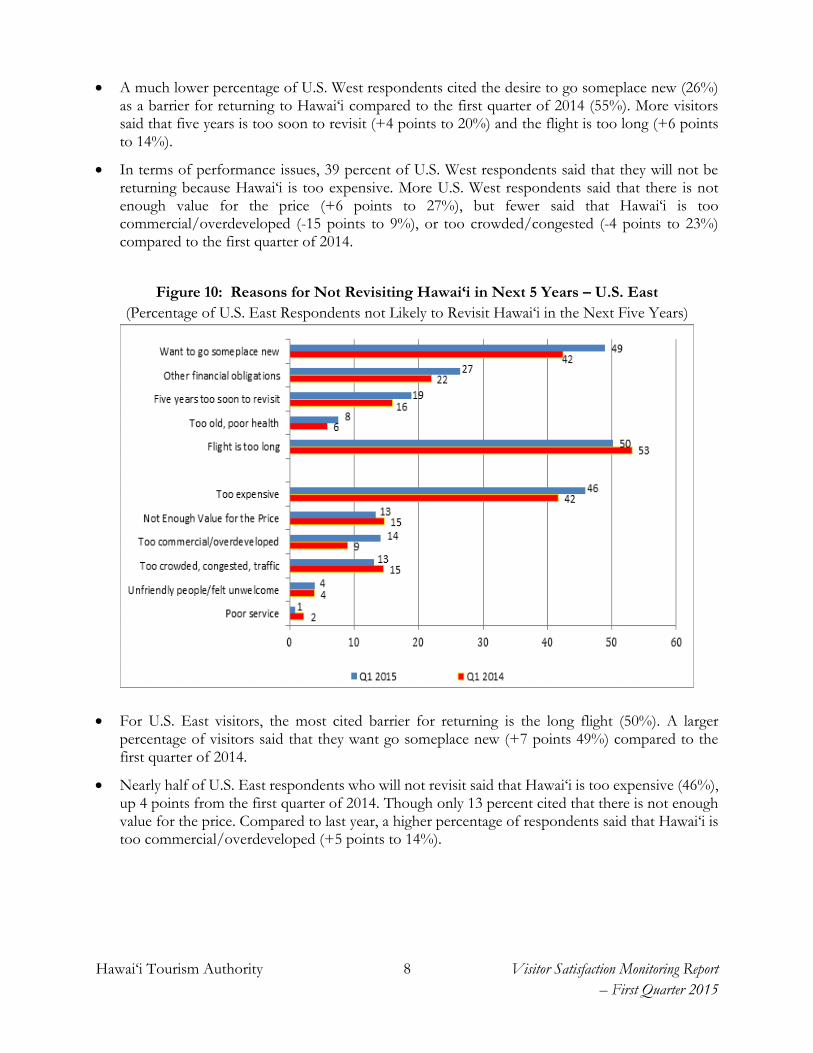
Figure 10: Reasons for Not Revisiting Hawai‘i in Next 5 Years – U.S. East
(Percentage of U.S. East Respondents not Likely to Revisit Hawai‘i in the Next Five Years)
For U.S. East visitors, the most cited barrier for returning is the long flight (50%). A larger percentage of visitors said that they want go someplace new (+7 points 49%) compared to the first quarter of 2014.
Nearly half of U.S. East respondents who will not revisit said that Hawai‘i is too expensive (46%), up 4 points from the first quarter of 2014. Though only 13 percent cited that there is not enough value for the price. Compared to last year, a higher percentage of respondents said that Hawai‘i is too commercial/overdeveloped (+5 points to 14%).
Hawai‘i Tourism Authority 9 Visitor Satisfaction Monitoring Report
– First Quarter 2015
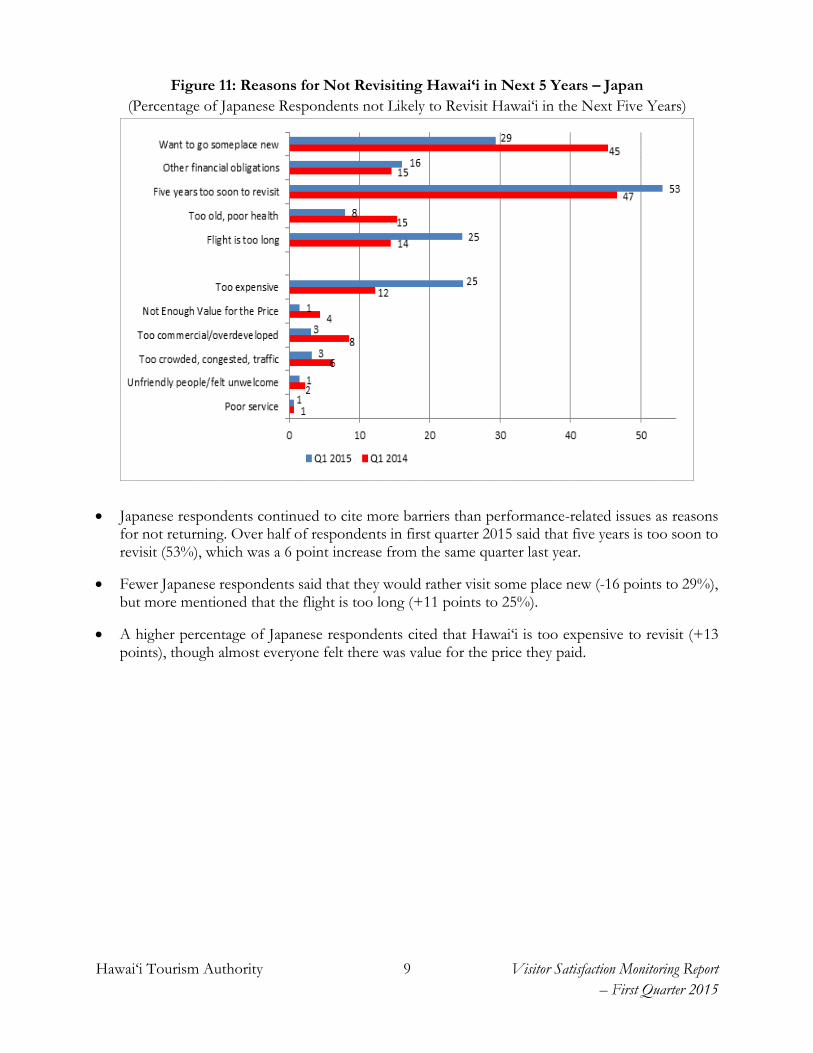
Figure 11: Reasons for Not Revisiting Hawai‘i in Next 5 Years – Japan
(Percentage of Japanese Respondents not Likely to Revisit Hawai‘i in the Next Five Years)
Japanese respondents continued to cite more barriers than performance-related issues as reasons for not returning. Over half of respondents in first quarter 2015 said that five years is too soon to revisit (53%), which was a 6 point increase from the same quarter last year.
Fewer Japanese respondents said that they would rather visit some place new (-16 points to 29%), but more mentioned that the flight is too long (+11 points to 25%).
A higher percentage of Japanese respondents cited that Hawai‘i is too expensive to revisit (+13 points), though almost everyone felt there was value for the price they paid.

Hawai‘i Tourism Authority 10 Visitor Satisfaction Monitoring Report
– First Quarter 2015
Figure 12: Reasons for Not Revisiting Hawai‘i in Next 5 Years – Canada
(Percentage of Canadian Respondents not Likely to Revisit Hawai‘i in the Next Five Years)
Among Canadian respondents, the desire to visit some place new (55%) was their main barrier to revisiting Hawai‘i, followed by the flight being too long (40%). More respondents cited other financial obligations (+5 points to 26%) and five years being too soon to revisit (+5% to 25%) compared to the first quarter of 2014.
The primary performance-related issue was the high cost (+6 points to 44%). An increase in the number of respondents also said that there is not enough value for the price (+6 points to 19%).

Hawai‘i Tourism Authority 11 Visitor Satisfaction Monitoring Report
– First Quarter 2015
Figure 13: Reasons for Not Revisiting Hawai‘i in Next 5 Years – Europe
(Percentage of European Respondents not Likely to Revisit Hawai‘i in the Next Five Years)
For European visitors, the primary reason for not returning to the islands continued to be the long flight (68%). Nearly half of the respondents cited the desire to go someplace new (48%). More European respondents mentioned other financial obligations (+11 points), but fewer said five years is too soon to revisit (-14 points) compared to the first quarter of 2014.
The high cost of coming to Hawai‘i (+4 points to 30%) was the most common performance-related reason for not returning. However, very few complained that there was not enough value for the price they paid.

Hawai‘i Tourism Authority 12 Visitor Satisfaction Monitoring Report
– First Quarter 2015
Figure 14: Reasons for Not Revisiting Hawai‘i in Next 5 Years – Oceania
(Percentage of Oceania Respondents not Likely to Revisit Hawai‘i in the Next Five Years)
Significantly more Oceania respondents cited the desire to go someplace new (+16 points to 65%) as a reason for not returning compared to the first quarter of 2014. A larger percentage of visitors also indicated other financial obligations (+17 points) as a barrier to revisiting Hawai‘i.
One fifth of the respondents felt that there was not enough value for the price they paid (21%). Fewer respondents said Hawai‘i is too expensive (-10 points), too commercial/overdeveloped (-8 points), and too crowded or congested (-13 points) compared to a year ago.

Hawai‘i Tourism Authority 13 Visitor Satisfaction Monitoring Report
– First Quarter 2015
Individual Island Experience
Each island in Hawai‘i has unique characteristics, activities, and products that attract different kinds
of visitors and produce varied visitor experiences. Visitor industry planners use these island-specific
satisfaction measurements to enhance the visitor products and services and to design communications
programs. The VSAT survey asks Hawai‘i visitors to rate their experience on each island they visited.
Figures 15 through 24 show respondents by visitor market who rated their island experience as
excellent over the last 9 quarters.
Figure 15: Island Experience Rated as Excellent – U.S.
(Percentage of U.S. Respondents by Island)
Among U.S. respondents, first quarter 2015 ratings improved 11 points for Kauai and 7 points for
O‘ahu compared to a year ago. Ratings for Hawai‘i Island and Maui changed very little from the first
quarter of 2014.
Figure 16: Island Experience Rated as Excellent – U.S.
(Percentage of U.S. Respondents by Island, 3-month moving average)
2015P
Island Q1 2013 Q2 2013 Q3 2013 Q4 2013 Q1 2014 Q2 2014 Q3 2014 Q4 2014 Q1 2015
O'ahu 56 57 60 57 50 55 58 52 57
Maui 62 73 70 67 67 71 71 69 69
Hawai'i Island 55 56 58 51 58 61 67 60 57
Kaua'i 65 72 74 63 62 75 78 72 73
P = Preliminary
2013 2014

Hawai‘i Tourism Authority 14 Visitor Satisfaction Monitoring Report
– First Quarter 2015
Figure 16 shows trend lines for the data in Figure 15. The trend lines represent three-quarter moving
averages except for the data points for first quarter 2013 which includes only first quarter 2013 data,
and second quarter 2013 which is represents the calculated average of first and second quarter 2013
ratings for each MMA.
For U.S. respondents, Kaua‘i and Maui consistently received higher ratings than O‘ahu and Hawai‘i
Island. Trend lines for Maui and O‘ahu have been relatively flat over the last two years. In contrast,
ratings for Kaua‘i and Hawai‘i Island increased in 2014. Kaua‘i’s ratings have surpassed Maui’s ratings
since the second quarter of 2014. Hawai‘i Island’s ratings have been higher than Oahu’s ratings since
the beginning of 2014.
Figure 17: Island Experience Rated as Excellent – Japan
(Percentage of Japanese Respondents by Island)
A higher percentage of Japanese respondents gave excellent ratings to Maui (+11 points) and O‘ahu
(+5 points) compared to the first quarter of 2014. Ratings for Hawai‘i Island and Kaua‘i each fell by
10 points versus the same time last year.
Figure 18: Island Experience Rated as Excellent – Japan
(Percentage of Japanese Respondents by Island, 3-month moving average)
2015P
Island Q1 2013 Q2 2013 Q3 2013 Q4 2013 Q1 2014 Q2 2014 Q3 2014 Q4 2014 Q1 2015
O'ahu 55 53 58 54 52 53 62 56 57
Maui 58 41 56 47 50 49 62 71 61
Hawai'i Island 50 48 55 50 59 63 64 56 49
Kaua'i 33 51 42 54 51 62 31 53 41
P = Preliminary
2013 2014
Hawai‘i Tourism Authority 15 Visitor Satisfaction Monitoring Report
– First Quarter 2015
The trend line for Kaua‘i has shown fluctuations over the last 9 quarters. Kaua‘i’s ratings have been
trending downward after peaking in the second quarter of 2014. The trend line for Hawai‘i Island has
also declined in recent quarters. O‘ahu’s ratings have been slowly trending upward since the second
quarter of 2014. Maui had the top rating for the fourth quarter of 2014 and the first quarter of 2015.
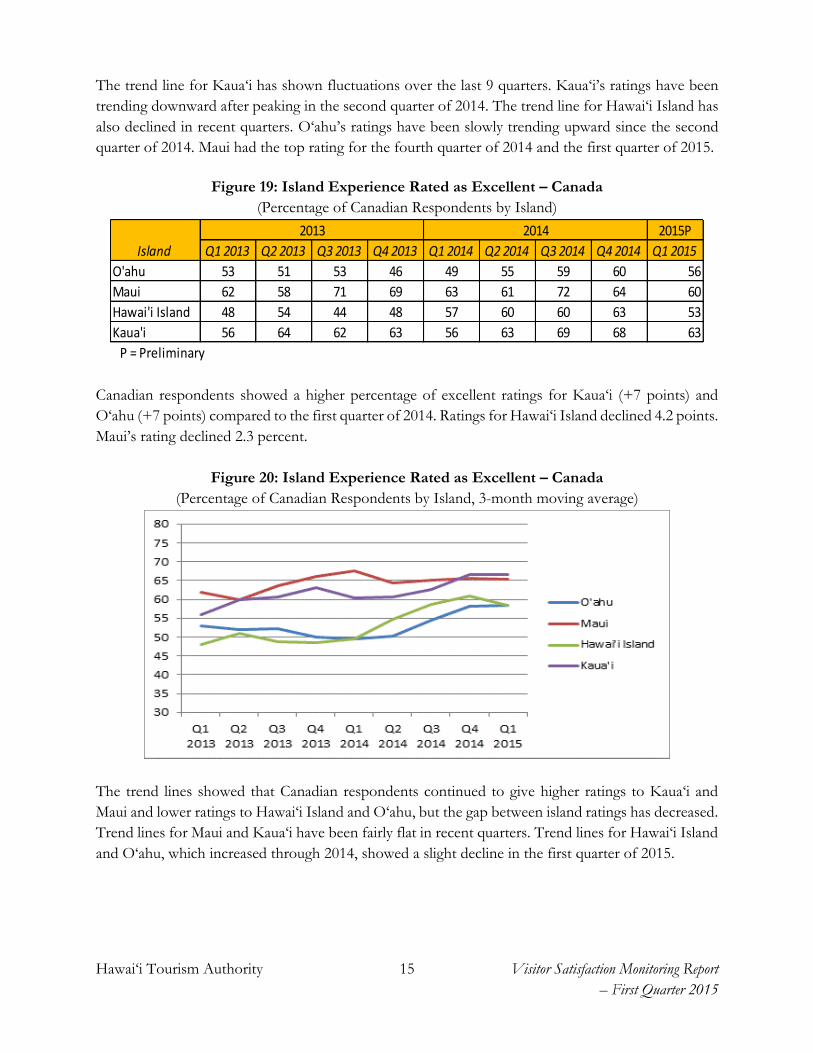
Figure 19: Island Experience Rated as Excellent – Canada
(Percentage of Canadian Respondents by Island)
Canadian respondents showed a higher percentage of excellent ratings for Kaua‘i (+7 points) and
O‘ahu (+7 points) compared to the first quarter of 2014. Ratings for Hawai‘i Island declined 4.2 points.
Maui’s rating declined 2.3 percent.
Figure 20: Island Experience Rated as Excellent – Canada
(Percentage of Canadian Respondents by Island, 3-month moving average)
The trend lines showed that Canadian respondents continued to give higher ratings to Kaua‘i and
Maui and lower ratings to Hawai‘i Island and O‘ahu, but the gap between island ratings has decreased.
Trend lines for Maui and Kaua‘i have been fairly flat in recent quarters. Trend lines for Hawai‘i Island
and O‘ahu, which increased through 2014, showed a slight decline in the first quarter of 2015.
2015P
Island Q1 2013 Q2 2013 Q3 2013 Q4 2013 Q1 2014 Q2 2014 Q3 2014 Q4 2014 Q1 2015
O'ahu 53 51 53 46 49 55 59 60 56
Maui 62 58 71 69 63 61 72 64 60
Hawai'i Island 48 54 44 48 57 60 60 63 53
Kaua'i 56 64 62 63 56 63 69 68 63
P = Preliminary
2013 2014
Hawai‘i Tourism Authority 16 Visitor Satisfaction Monitoring Report
– First Quarter 2015
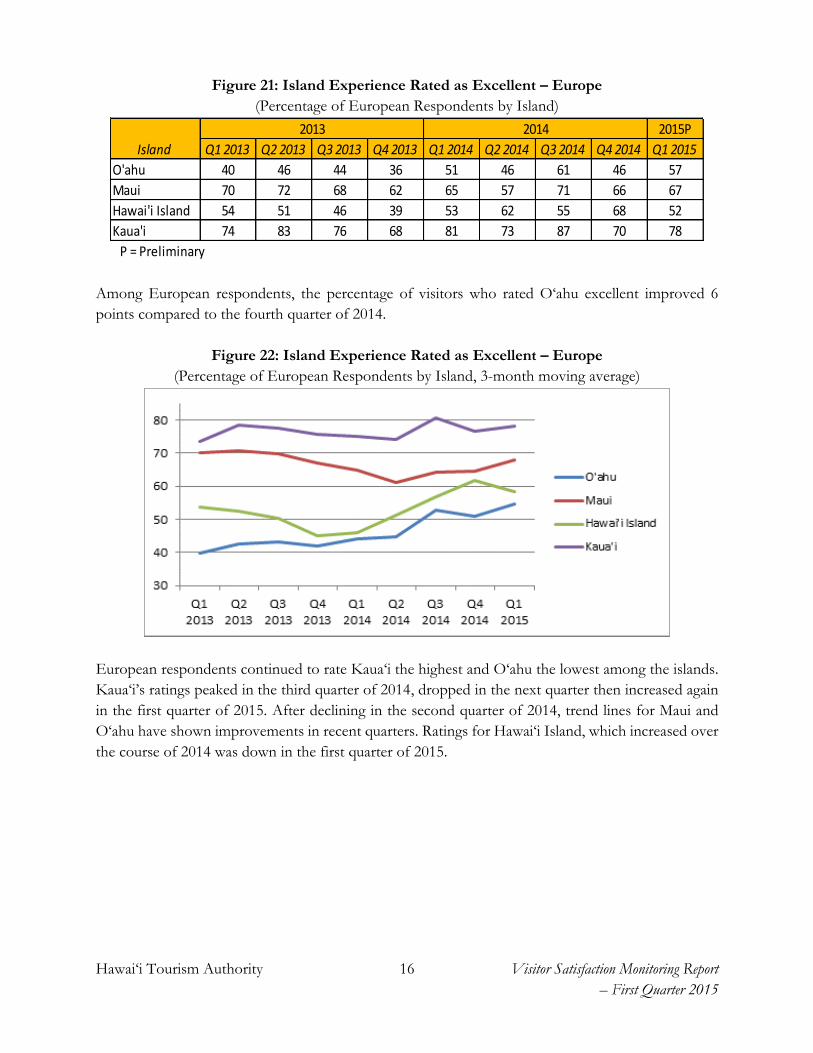
Figure 21: Island Experience Rated as Excellent – Europe
(Percentage of European Respondents by Island)
Among European respondents, the percentage of visitors who rated O‘ahu excellent improved 6
points compared to the fourth quarter of 2014.
Figure 22: Island Experience Rated as Excellent – Europe
(Percentage of European Respondents by Island, 3-month moving average)
European respondents continued to rate Kaua‘i the highest and O‘ahu the lowest among the islands.
Kaua‘i’s ratings peaked in the third quarter of 2014, dropped in the next quarter then increased again
in the first quarter of 2015. After declining in the second quarter of 2014, trend lines for Maui and
O‘ahu have shown improvements in recent quarters. Ratings for Hawai‘i Island, which increased over
the course of 2014 was down in the first quarter of 2015.
2015P
Island Q1 2013 Q2 2013 Q3 2013 Q4 2013 Q1 2014 Q2 2014 Q3 2014 Q4 2014 Q1 2015
O'ahu 40 46 44 36 51 46 61 46 57
Maui 70 72 68 62 65 57 71 66 67
Hawai'i Island 54 51 46 39 53 62 55 68 52
Kaua'i 74 83 76 68 81 73 87 70 78
P = Preliminary
2013 2014

Hawai‘i Tourism Authority 17 Visitor Satisfaction Monitoring Report
– First Quarter 2015
Figure 23: Island Experience Rated as Excellent – Oceania
(Percentage of Oceania Respondents by Island)
The percentage of excellent ratings from Oceania respondents were higher for Kaua‘i (+12 points),
Maui (+11 points) and O‘ahu (+8 points) compared to the first quarter of 2014, but ratings for Hawai‘i
Island declined 6 points.
Figure 24: Island Experience Rated as Excellent – Oceania
(Percentage of Oceania Respondents by Island, 3-month moving average)
Ratings for all islands have become more similar since the second quarter of 2014. Ratings for O‘ahu
and Maui were fairly consistent over the last two years. In contrast, ratings for Hawai‘i Islands, which
was the lowest among the islands, rose sharply in 2014. Hawai‘i Island ratings exceeded O‘ahu’s
ratings and matched Maui and Kaua‘i ratings since the third quarter of 2014.
2015P
Island Q1 2013 Q2 2013 Q3 2013 Q4 2013 Q1 2014 Q2 2014 Q3 2014 Q4 2014 Q1 2015
O'ahu 50 55 48 52 52 50 52 50 59
Maui 64 53 59 58 53 67 55 64 64
Hawai'i Island 38 54 39 44 48 62 58 66 42
Kaua'i 65 63 66 62 40 71 53 66 52
P = Preliminary
2013 2014
Hawai‘i Tourism Authority 18 Visitor Satisfaction Monitoring Report
– First Quarter 2015
Sources of Information used for Trip Planning
Visitors to Hawai‘i use a wide variety of resources to plan their trip to the islands. This section shows
the sources of information used by respondents in the first quarter of 2015 by visitor market.
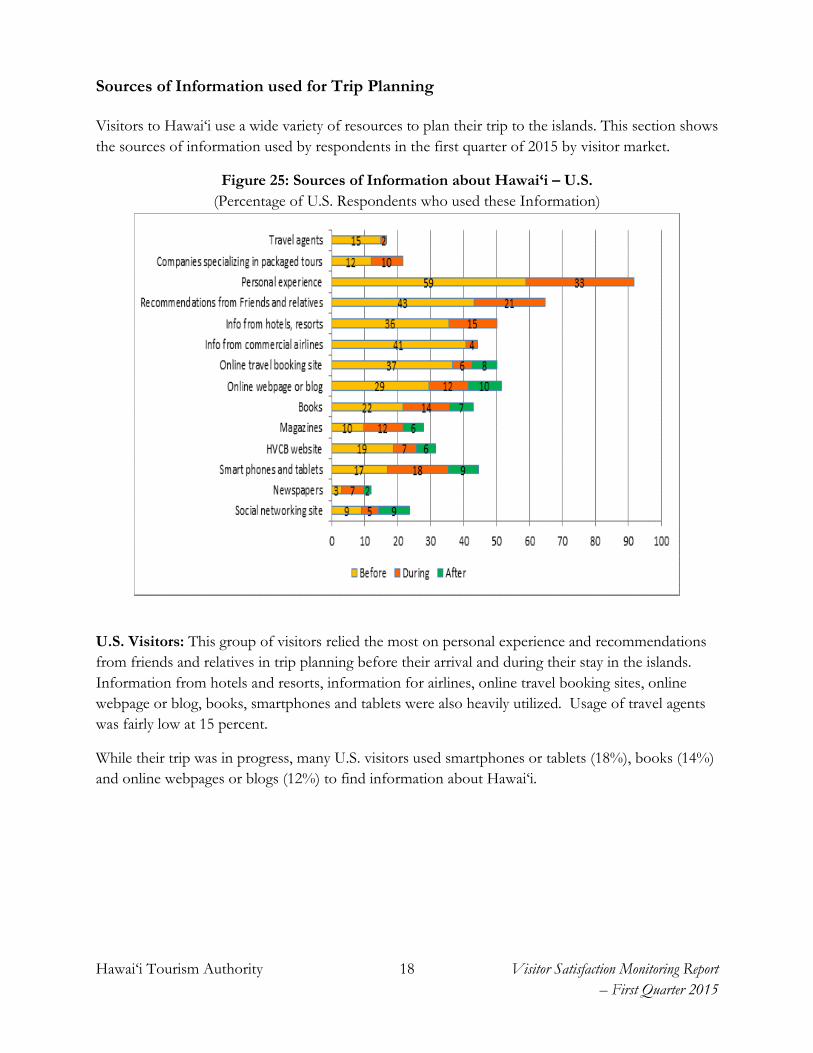
Figure 25: Sources of Information about Hawai‘i – U.S.
(Percentage of U.S. Respondents who used these Information)
U.S. Visitors: This group of visitors relied the most on personal experience and recommendations
from friends and relatives in trip planning before their arrival and during their stay in the islands.
Information from hotels and resorts, information for airlines, online travel booking sites, online
webpage or blog, books, smartphones and tablets were also heavily utilized. Usage of travel agents
was fairly low at 15 percent.
While their trip was in progress, many U.S. visitors used smartphones or tablets (18%), books (14%)
and online webpages or blogs (12%) to find information about Hawai‘i.
Hawai‘i Tourism Authority 19 Visitor Satisfaction Monitoring Report
– First Quarter 2015
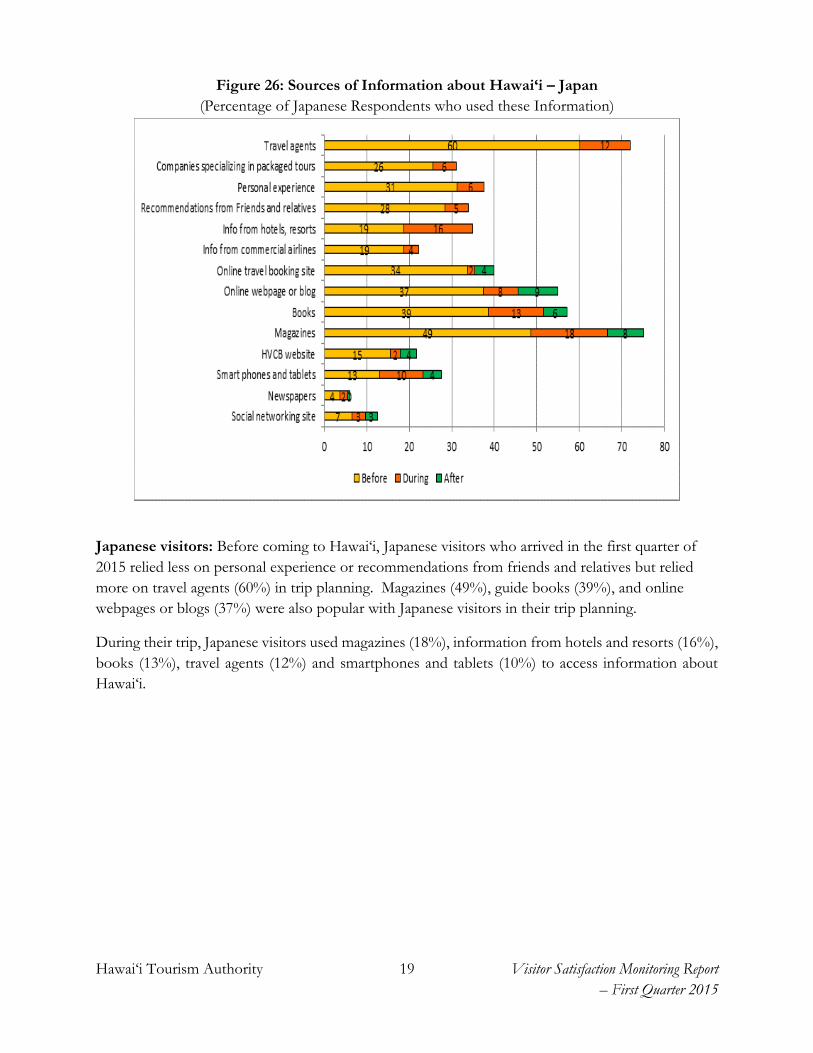
Figure 26: Sources of Information about Hawai‘i – Japan
(Percentage of Japanese Respondents who used these Information)
Japanese visitors: Before coming to Hawai‘i, Japanese visitors who arrived in the first quarter of
2015 relied less on personal experience or recommendations from friends and relatives but relied
more on travel agents (60%) in trip planning. Magazines (49%), guide books (39%), and online
webpages or blogs (37%) were also popular with Japanese visitors in their trip planning.
During their trip, Japanese visitors used magazines (18%), information from hotels and resorts (16%),
books (13%), travel agents (12%) and smartphones and tablets (10%) to access information about
Hawai‘i.

Hawai‘i Tourism Authority 20 Visitor Satisfaction Monitoring Report
– First Quarter 2015
Figure 27: Sources of Information about Hawai‘i – Canada
(Percentage of Canadian Respondents who used these Information)
Canadian visitors: Before their arrival, Canadian respondents visiting in the first quarter of 2015
relied most heavily on personal experience (57%), online travel booking sites (52%), information from
airlines (48%), and recommendations from friends or relatives (47%) when planning for their trip. In
addition, many Canadians used information from hotels and resorts (41%) and online webpages or
blogs covering Hawai‘i (41%). Only 18 percent used travel agents.
While their trip was in progress, many Canadian visitors relied on their personal experience (33%).
Some used companies specializing in packaged tours (21%), recommendations from friends or
relatives (20%), smartphones or tablets (17%), information from hotels and resorts (16%), books
(16%), magazines (15%) and online webpages or blogs (15%) as resources.

Hawai‘i Tourism Authority 21 Visitor Satisfaction Monitoring Report
– First Quarter 2015
Figure 28: Sources of Information about Hawai‘i – Europe
(Percentage of European Respondents who used these Information)
European Visitors: Among European respondents who visited in the first quarter of 2015, online
travel booking sites (50%) was the most frequently used source for trip planning. Personal experience
(46%), information from airlines (44%), guide books (44%), online webpages or blogs (43%), and
recommendations and friends and relatives (43%) were also popular resources. One out of three
respondents used travel agent.
Many European visitors used their personal experience (25%), guide books (26%), smart phones and
tablets (22%) as resources during their trip. A few European visitors also used online webpages or
blogs (19%) and guide books (16%) to seek information about Hawai‘i after their trip.

Hawai‘i Tourism Authority 22 Visitor Satisfaction Monitoring Report
– First Quarter 2015
Figure 29: Sources of Information about Hawai‘i – Oceania
(Percentage of Oceania Respondents who used these Information)
Oceania Visitors: Respondents from Oceania used travel agents (62%) as their primary source of
information for trip planning before arriving to Hawai‘i. Recommendations from family and friends
(57%), online travel booking sites (46%), information from airlines (43%), online webpages or blogs
(42%) and information from hotels and resorts (42%) were also important planning tools.
During their trip, many visitors from Oceania used information from hotels or resorts (33%) and
package tour companies (26%) and as resources about Hawai‘i.
Hawai‘i Tourism Authority 23 Visitor Satisfaction Monitoring Report
– First Quarter 2015
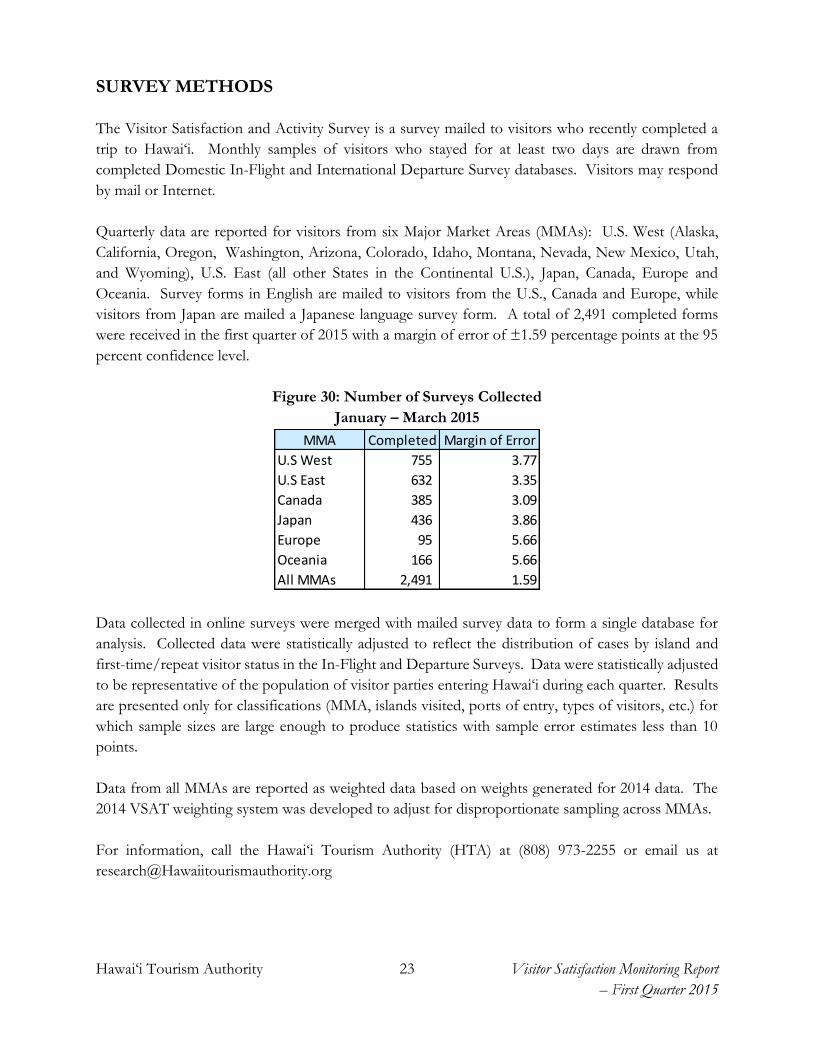
SURVEY METHODS
The Visitor Satisfaction and Activity Survey is a survey mailed to visitors who recently completed a
trip to Hawai‘i. Monthly samples of visitors who stayed for at least two days are drawn from
completed Domestic In-Flight and International Departure Survey databases. Visitors may respond
by mail or Internet.
Quarterly data are reported for visitors from six Major Market Areas (MMAs): U.S. West (Alaska,
California, Oregon, Washington, Arizona, Colorado, Idaho, Montana, Nevada, New Mexico, Utah,
and Wyoming), U.S. East (all other States in the Continental U.S.), Japan, Canada, Europe and
Oceania. Survey forms in English are mailed to visitors from the U.S., Canada and Europe, while
visitors from Japan are mailed a Japanese language survey form. A total of 2,491 completed forms
were received in the first quarter of 2015 with a margin of error of ±1.59 percentage points at the 95
percent confidence level.
Figure 30: Number of Surveys Collected
January – March 2015
Data collected in online surveys were merged with mailed survey data to form a single database for
analysis. Collected data were statistically adjusted to reflect the distribution of cases by island and
first-time/repeat visitor status in the In-Flight and Departure Surveys. Data were statistically adjusted
to be representative of the population of visitor parties entering Hawai‘i during each quarter. Results
are presented only for classifications (MMA, islands visited, ports of entry, types of visitors, etc.) for
which sample sizes are large enough to produce statistics with sample error estimates less than 10
points.
Data from all MMAs are reported as weighted data based on weights generated for 2014 data. The
2014 VSAT weighting system was developed to adjust for disproportionate sampling across MMAs.
For information, call the Hawai‘i Tourism Authority (HTA) at (808) 973-2255 or email us at
MMA Completed Margin of Error
U.S West 755 3.77
U.S East 632 3.35
Canada 385 3.09
Japan 436 3.86
Europe 95 5.66
Oceania 166 5.66
All MMAs 2,491 1.59


