
NF VALIDATION
AFNOR CERTIFICATION VALIDATION OF THE METHOD
ENTEROLERT‐E / QUANTI‐TRAY or QUANTI‐TRAY 2000
For the enumeration of intestinal enterococci
Protocol for bathing waters (fresh water and marine water)
SUMMARY REPORT ‐ MARCH 2015 – V1
Expert laboratory : Manufacturer : ISHA IDEXX Laboratories, Inc. 25 avenue de la République IDEXX Drive, Westbrook 91300 MASSY Maine 04 092 FRANCE USA
This report of analysis concerns only objects subjected to analysis. Its reproduction is authorized only in the form of complete photographic facsimile. It contains 46 pages. Only some assays reported in this document are covered by the accreditation of the Section Laboratory of COFRAC. They are identified by the symbol (*). Assays realized at ISHA : 25 avenue de la République, 91300 Massy, France.

Table of contents 1. Introduction ................................................................................................................................................. 4
1.1. Validation repository ........................................................................................................................... 4
1.2. Alternative method ............................................................................................................................. 4
1.3. Application scope ................................................................................................................................ 4
1.4. Reference method (*) .......................................................................................................................... 4
2. Method comparison study .......................................................................................................................... 5
2.1. Relative accuracy ................................................................................................................................. 5
2.1.1. Number and nature of samples ................................................................................................... 5
2.1.2. Raw results .................................................................................................................................. 5
2.1.3. Statistical exploitation ................................................................................................................. 6
2.1.4. Conclusion ................................................................................................................................... 6
2.2. Linearity ............................................................................................................................................... 6
2.2.1. Contamination levels ................................................................................................................... 7
2.2.2. Raw results .................................................................................................................................. 7
2.2.3. Statistical exploitation ................................................................................................................. 7
2.2.4. Conclusion ................................................................................................................................... 8
2.3. Detection and quantification limits ..................................................................................................... 8
2.3.1. Protocol ....................................................................................................................................... 8
2.3.2. Results ......................................................................................................................................... 8
2.3.3. Conclusion ................................................................................................................................... 9
2.4. Selectivity ............................................................................................................................................. 9
2.4.1. Protocols ...................................................................................................................................... 9
2.4.2. Results ......................................................................................................................................... 9
2.4.3. Conclusion ................................................................................................................................... 9
2.5. Practicability ........................................................................................................................................ 9
2.6. Conclusion ......................................................................................................................................... 10
3. Interlaboratory study ................................................................................................................................ 11
3.1. Interlaboratory study implementation .............................................................................................. 11
3.1.1. Participating laboratories .......................................................................................................... 11
3.1.2. Matrix and strain ....................................................................................................................... 11
3.1.3. Stability of the strain in the test matrix ..................................................................................... 11
3.1.4. Samples preparation and spiking .............................................................................................. 11
3.1.5. Samples labeling ........................................................................................................................ 12
3.1.6. Samples shipping, reception and analysis ................................................................................. 12
3.2. Results ............................................................................................................................................... 12
IDEXX - Enterolert-E Summary report - v1 March 2015
Institut Scientifique d'Hygiène et d'Analyse 2/46
3.2.1. Temperature and state of the samples at reception ................................................................ 12
3.2.2. Results from expert laboratory and participating laboratories ................................................. 13
3.2.3. Enumerations of culturable microorganisms ............................................................................ 14
3.3. Statistical interpretation .................................................................................................................... 14
3.3.1. Bias ............................................................................................................................................. 14
3.3.2. Accuracy profile ......................................................................................................................... 15
3.4. Conclusion ......................................................................................................................................... 16
4. Complementary assays .............................................................................................................................. 17
4.1. Results and interpretation ................................................................................................................. 17
4.1.1. Results from Enterolert‐E / Quanti‐Tray 2000 comparative study ............................................ 17
4.1.1.1. Raw results ........................................................................................................................ 17
4.1.1.2. Statistical interpretation .................................................................................................... 18
4.1.2. Results from Colilert‐18 / Quanti‐Tray study ............................................................................ 19
4.1.2.1. Raw results ........................................................................................................................ 19
4.1.2.2. Statistical interpretation .................................................................................................... 19
4.2. Conclusion ......................................................................................................................................... 20
5. Conclusion ................................................................................................................................................. 21
Appendices Appendix 1 : Alternative method protocol Appendix 2 : Reference method protocol Appendix 3 : Bacterial stress Appendix 4 : Relative accuracy results Appendix 5 : Linearity results Appendix 6 : LOD‐LOQ results Appendix 7 : Selectivity results Appendix 8 : Interlaboratory study results Appendix 9 : Culturable microorganisms enumerations Appendix 10 : complementary assays results and calculations
IDEXX - Enterolert-E Summary report - v1 March 2015
Institut Scientifique d'Hygiène et d'Analyse 3/46

1. Introduction This summary report presents the results of the validation study, under the brand NF Validation, of the method Enterolert‐E / Quanti‐Tray or Quanti‐Tray 2000 developed by IDEXX for the enumeration of enterococci in bathing waters.
1.1. Validation repository The method Enterolert‐E / Quanti‐Tray or Quanti‐Tray 2000 was compared to the reference method ISO 7899‐1 (1999) according to the Validation protocol for an alternative commercial method as compared with a reference method (revision 2 – May 2013). The validation study was divided in two parts: a comparative study followed by an interlaboratory study. Complementary assays were also realized in 2014 to allow the use of a Quanti‐Tray instead of a Quanti‐Tray 2000 with the method Enterolert‐E or Colilert‐18 for bathing water analysis. The results of this study are presented in the present report. The goal of the comparative study is to evaluate the performances of the alternative method against the reference method. The following parameters were studied:
‐ the relative accuracy, ‐ the linearity, ‐ the quantification limits, ‐ the selectivity, ‐ the practicability.
The goal of the interlaboratory study is to determine the performances of the alternative method in several laboratories in the real conditions of the “routine” application of the method.
1.2. Alternative method Enterolert‐E detects enterococci, such as E. faecium and E. faecalis, in fresh and marine water. It is based on IDEXX’s patented Defined Substrate Technology (DST). When enterococci utilize their ß‐glucosidase enzyme to metabolize Enterolert‐E’s nutrient‐indicator, 4‐methyl‐umbelliferyl ß‐D‐glucoside, the sample fluoresces. Enterolert‐E detects enterococci at 1 CFU per 100 mL sample within 24 hours. The alternative method protocol is presented in appendix 1.
1.3. Application scope The application scope of the alternative method concerns one category of waters: the bathing waters including: ‐ marine waters, ‐ fresh waters.
1.4. Reference method (*) The alternative method was compared to the standard ISO 7899‐1: Water quality ‐ Detection and enumeration of intestinal enterococci in surface and waste water ‐ Part 1: Miniaturized method (Most Probable Number) by inoculation in liquid medium. The protocol of the reference method is presented in appendix 2.
IDEXX - Enterolert-E Summary report - v1 March 2015
Institut Scientifique d'Hygiène et d'Analyse 4/46

2. Method comparison study
2.1. Relative accuracy The relative accuracy is the degree of correspondence between the response obtained by the reference method and the response obtained by the alternative method on the same samples.
2.1.1. Number and nature of samples One category of waters was tested in duplicate with the alternative method and the reference method. Samples analyzed are presented in table 1.
Category Water type Samples analyzed Samples exploited
Bathing waters
Marine water 16 13
Fresh water 20 16
Total 36 29
Table 1 : number and nature of samples analyzed
A total of 36 samples was analyzed and 29 were exploited. Samples that were not retained in the statistical analysis correspond to samples for which enumerations inferior to 10 CFU/100 mL or superior to the limit of detection were found for at least one of the replicates of the two methods. One naturally contaminated sample was analyzed. The others were artificially contaminated. The contamination levels used cover all the measuring range of the alternative method. The stress applied and the strains used are presented in appendix 3.
2.1.2. Raw results Raw results and statistical calculations are summarized in tables 2 and 3 and in appendix 4. Figure 1 shows the two‐dimensional graph for the test category. The y‐axis is reserved for the alternative method and the x‐ axis for the reference method. The representation of a line of equation “y = x“ figures dashed on the figures.
Figure 1 : two‐dimensional graph for relative accuracy (black line: y=x)
0,0
0,5
1,0
1,5
2,0
2,5
3,0
3,5
4,0
4,5
5,0
0,0 0,5 1,0 1,5 2,0 2,5 3,0 3,5 4,0 4,5 5,0
Alternative method (log MPN/100 mL)
Reference method (log MPN/100 mL)
IDEXX - Enterolert-E Summary report - v1 March 2015
Institut Scientifique d'Hygiène et d'Analyse 5/46

2.1.3. Statistical exploitation The relationship of relative accuracy between the reference method and the alternative method is evaluated with the linear model: 'y = a + bx '. This formula corresponds to the equation of the linear regression drawn from raw results obtained by experimentation, y representing the alternative method and x the reference method. There is a perfect accuracy (or there is no systematic bias) between the two methods if this equation is equal to the theoretical 'y = x' equation, which applies in the ideal model where the two methods behave similarly. The intercept is theoretically zero in this ideal model (hypothesis [a = 0]). The estimated intercept obtained with the two methods is checked using p {a = 0}. If the alternative method is a systematic bias against the reference method, the probability p {a = 0} is less than α = 0.05. The 'b' slope is theoretically equal to 1 in the ideal model (hypothesis [b = 1]). The estimated slope obtained with the two methods should pass by p {b = 1}. Statistically, if the alternative method does not give the same values as the reference method, the probability p {b = 1} is less than α = 0.05. The linear regression method is chosen over the value of the robustness of the ratio R of overall repeatability standard deviation:
‐ If Rob.R > 2, an ordinary least‐squares regression (OLS 1) is used with the x‐axis for the reference method, ‐ if Rob.R < 0.5, an ordinary least‐squares regression (OLS 2) is used with the x‐axis for the alternative method, ‐ If 0.5 < Rob.R < 2, orthogonal regression (GMFR) is used with the x‐axis to the reference method.
Rob.R Regression used T critical a t(a) b t(b) Probabilities (%)
Intercept at 0 Slope at 1
0,809 GMFR 2,045 ‐0,110 0,715 1,008 0,184 47,7 85,5
Table 2 : statistical data for the enumeration of intestinal enterococci in bathing waters
Bias (D) Repeatability
Average Median r rob. r
RM AM RM AM
‐0,088 ‐0,055 0,437 0,430 0,302 0,245
Table 3 : bias and repeatability of the two methods
2.1.4. Conclusion The equation for the regression line of the couple “enterococci ‐ bathing water” is as follows:
log Alt = 1,008 log Ref – 0,110 Hypothesis [a = 0 and b = 1] is accepted for the test category. Bias between the two methods is ‐0,055 log MPN/100 mL. The relative accuracy of the alternative method is satisfactory.
2.2. Linearity The linearity is the ability of the method when used with a given matrix to give results that are in proportion to the amount of analyte present in the sample, that is an increase in analyte corresponds to a linear or proportional increase in results.
IDEXX - Enterolert-E Summary report - v1 March 2015
Institut Scientifique d'Hygiène et d'Analyse 6/46

2.2.1. Contamination levels The couple matrix / strain is presented in table 4. For this couple, six levels of contamination were tested in duplicate by the reference method and the alternative method.
Strain Matrix Contamination level (CFU/100 mL)
Enterococcus faecalis Marine water 50 ‐ 200 ‐ 500 ‐ 1 000 ‐ 5 000 ‐ 20 000
Table 4 : couple matrix – strain analyzed
2.2.2. Raw results Raw results and statistical calculations are summarized in appendix 5. Graph of figure 2 show the values of each sample obtained by the alternative method and the reference method. The y‐axis is reserved for the alternative method and the x‐axis for the reference method. The representation of a line of equation 'y = x' figures dashed on the figures.
Figure 2 : two‐dimensional graph for linearity (black line: y=x)
2.2.3. Statistical exploitation Statistical interpretations are carried out in accordance with the requirements of standard NF ISO 16140 (see table 5). The linear regression method is chosen over the value of the robustness of the ratio R of overall repeatability standard deviation:
‐ If Rob.R > 2, an ordinary least‐squares regression (OLS 1) is used with the x‐axis for the reference method,
0,0
0,5
1,0
1,5
2,0
2,5
3,0
3,5
4,0
4,5
5,0
0,0 0,5 1,0 1,5 2,0 2,5 3,0 3,5 4,0 4,5 5,0
Alternative method (log MPN/100 mL)
Reference method (log MPN/100 mL)
IDEXX - Enterolert-E Summary report - v1 March 2015
Institut Scientifique d'Hygiène et d'Analyse 7/46

‐ if Rob.R < 0.5, an ordinary least‐squares regression (OLS 2) is used with the x‐axis for the alternative method, ‐ If 0.5 < Rob.R < 2, orthogonal regression (GMFR) is used with the x‐axis to the reference method.
Rob. R
Regression used
F critical
Rob. F
P (Rob.F)
Correlation coefficient (r)
Regression line
1,083 GMFR 4,53 4,953 0,041 0,993 1,038 log Ref – 0,149
Table 4 : statistical data of the couple matrix – strain analyzed
The relationship between the 2 methods is not linear: ‐ if Rob.F > critical F or, ‐ if P (Rob.F) < α (= 0,05).
2.2.4. Conclusion The relationship between the two methods is not linear. However, the correlation coefficient of the couple and the equation for the regression line are satisfactory. The linearity of the alternative method is satisfactory.
2.3. Detection and quantification limits The detection and quantification limits are checked in accordance with the standard EN ISO 16140. Three parameters are determined. Here are their ISO 16140 definitions:
‐ the critical level (LC) is the smallest amount which can be detected (not null), but not quantified as an exact value. Below this value, it cannot be sure that the true value is not null. At this level, the false negatives probability β is 50 % (β is the second type of statistical error). ‐ the detection limit (LOD) is higher than the critical level, because it involves a power, the probability 1 ‐ β, which has to be well over 50 %, for example 95 %. ‐ the quantification limit (LOQ) is the smallest amount of analyte, (that is the lowest actual number of organisms), which can be measured and quantified with defined precision and accuracy under the experimental conditions by the method under validation.
2.3.1. Protocol Detection and quantification limits were determined by analyzing a pure culture of an Enterococcus faecalis strain ENTC.1.5, isolated from a surface water, by the alternative method. Eight levels of contamination, with six repetitions for each level, have been studied in a sterilized water.
2.3.2. Results Raw results are presented in appendix 6 and the summary in the following tables.
Level (CFU/100 mL) Number of positive samples Standard deviation (s0) Bias (x0)
0 0 / 6 0 0
3 2 / 6 5,164 0
6 2 / 6 5,164 0
9 2 / 6 5,164 0
10 4 / 6 5,164 10
12 5 / 6 7,528 10
14 5 / 6 10,778 15
18 6 / 6 8,495 15
Table 5 : data (s0 and x0) for the enumeration of intestinal enterococci (underlined: the reference level)
IDEXX - Enterolert-E Summary report - v1 March 2015
Institut Scientifique d'Hygiène et d'Analyse 8/46

Parameter Formulas Value
Critical level 1,65 So +Xo 18,5 MPN / 100 mL
Detection limit 3,3 So+Xo 27,0 MPN / 100 mL
Quantification limit 10 So + Xo 61,6 MPN / 100 mL
Table 6 : LC, LOD and LOQ values of the alternative method for the enumeration of intestinal enterococci
2.3.3. Conclusion The limit of detection and limit of quantification of the alternative method are satisfactory.
2.4. Selectivity The selectivity of the alternative method is evaluated by its inclusivity and its exclusivity. Inclusivity is the ability of the alternative method to detect the target analyte from a wide range of strains. Exclusivity is the lack of interference by a relevant range of non‐target strains with the alternative method.
2.4.1. Protocols Thirty target strains and thirty non target strains (from national, international and internal collections) were analyzed. The tests were conducted according to the protocol of the alternative method. The contamination levels used for inclusivity were between 30 and 100 CFU / 100mL and for exclusivity 103 to 105 times higher than the level of detection of the alternative method (approximately 104 CFU / 100 mL).
2.4.2. Results The results are presented in appendix 7. Thirty strains of enterococci tested are detected by the alternative method. No non target strain showed cross‐reaction with the alternative method.
2.4.3. Conclusion The selectivity of the method is satisfactory.
2.5. Practicability The practicability is studied by filling in the 13 criteria defined by the Technical Board.
Procedure for conditioning the elements of the method Enterolert‐E reagent is packaged in sealed individual capsules. TheQuanti‐Tray and Quanti‐Tray 2000 are conditioned by 10 in sterile plastic bags.
Reagent volume Several formats are available (20 tests, 100 tests or 200 tests).
Conditions of storage of the elements (expiry date for unopened products) Enterolert‐E storage temperature is between 2 and 25 ° C. The storage temperature of the Quanti ‐ Tray 2000 is between 4 and 30 ° C. Products have a 12 months DLC.
Modalities of use after the first use (expiry dates for use) Each Quanti‐Tray and each Enterolert‐E capsule serves a unique analysis and must not be re‐used.
IDEXX - Enterolert-E Summary report - v1 March 2015
Institut Scientifique d'Hygiène et d'Analyse 9/46

Specific equipment or premises required A Quanti‐Tray Sealer model 2X is required.
Reagents ready‐to‐use or to be reconstituted There is no reagent to restore.
Period required to train an operator not initiated into the method The use of the method Enterolert‐E / Quanti‐Tray 2000 requires no specific training. The duration of training is estimated at 1 hour.
Real‐time handling and flexibility of the method depending on the number of samples to be analyzed. The duration of an analysis by the method NF EN ISO 7899‐1 is about 1.5 min using disposable filtration units of 3.5 min using non‐disposable filtration units. The duration of use of the method Enterolert‐E / Quanti‐Tray or Quanti‐Tray 2000 is about 2 min (time including: dissolution of the Enterolert‐E waiting time and the time for sealing the Quanti‐Tray). Neither the alternative method nor the reference method require a confirmation step.
Time required for obtaining the results Time‐to‐result for the method Enterolert‐E / Quanti‐Tray or Quanti‐Tray 2000 is 24 ‐ 28 hours. Time‐to‐result for the method EN ISO 7899‐1 is 48 – 72 hours.
Operator qualification type The qualification of the operator is similar to the qualification needed for the reference method.
Phases shared with the reference method None.
Means or traceability of the analysis results for the user No traceability procedure is proposed. The laboratory shall use its internal procedures.
Obligation to maintain specific apparatus for the user None.
2.6. Conclusion The linearity and the relative accuracy of the method Enterolert‐E / Quanti‐Tray 2000 for the enumeration of intestinal enterococci in bathing waters are satisfactory. Bias between the two methods is acceptable. The limits of detection and quantification of the method are satisfactory. The method Enterolert‐E / Quanti‐Tray 2000 for the enumeration of intestinal enterococci is specific and selective. Results are obtained in 24 to 28 hours with the alternative method against 36 to 72 hours with the reference method.
IDEXX - Enterolert-E Summary report - v1 March 2015
Institut Scientifique d'Hygiène et d'Analyse 10/46

3. Interlaboratory study
3.1. Interlaboratory study implementation
3.1.1. Participating laboratories The interlaboratory study was realized by the expert laboratory and fourteen participating laboratories. Each laboratory received the instructions relative to the organization of the study a week before its beginning.
3.1.2. Matrix and strain A marine water was used as test matrix. It was contaminated with a strain of Enterococcus faecalis (ENTC.1.6) isolated from a surface water. The absence of enterococci in this matrix before the contamination was checked using the reference method.
3.1.3. Stability of the strain in the test matrix The stability of the strain in the matrix was evaluated for 3 days at 5±3°C. Results of the enumerations are presented in table 1.
Level 1 Level 2 Level 3
D0 77 1 007 4 368
D1 46 858 2 536
D2 30 606 2 140
Table 1 : results of the enumerations in CFU/100 mL of the strain Enterococcus faecalis ENTC.1.6 in marine water for 3 days at 5±3°C (*)
A diminution of the concentration of the tested strain is observed from day 0 to day 2 at 5±3°C in the matrix.
3.1.4. Samples preparation and spiking The matrix was inoculated with the target strain suspension to obtain 4 contamination levels: ‐ level 0 : 0 CFU/100 mL,
‐ level 1 : from 15 to 50 CFU/100 mL, ‐ level 2 : from 250 to 500 CFU/100 mL, ‐ level 3 : from 1000 to 1500 CFU/100 mL.
The matrix was distributed at 50 mL in sterile bottles. Every bottle was individually spiked and homogenized. Eight samples per laboratory were prepared (2 samples per contamination level). Each laboratory received 8 samples to analyze, 1 sample to quantify culturable microorganisms and 1 water sample containing a temperature probe. The results of the enumerations of culturable microorganisms, the target levels and the real levels of contamination are presented in table 2.
Level Culturable microorganisms (CFU/mL) Enterococcus faecalis ENTC.1.10 (CFU /100 mL)
22°C 36°C Target level Real level at D0
0
142 66
/ /
1 75 70
2 800 760
3 4 000 3 400
Table 2 : target level, real level and endogenous flora of the matrix
IDEXX - Enterolert-E Summary report - v1 March 2015
Institut Scientifique d'Hygiène et d'Analyse 11/46

3.1.5. Samples labeling The labeling of the vials was realized as follows: a code to identify the laboratory: from A to N (cf. table 3) and a code to identify each sample, only known by the expert laboratory. The samples and the temperature control vials (water sample with a temperature probe) were stored at 5°C before shipping.
Level (CFU / 100 mL) Sample code
0 1 / 4
15 to 50 5 / 7
250 to 500 2 / 6
1000 to 1500 3 / 8
Table 3 : sample code by contamination level
3.1.6. Samples shipping, reception and analysis The samples were shipped in a coolbox the 8th of December 2014. The coolboxes were received in 24 hours for twelve laboratories and in 48 hours for one laboratory. Laboratory I received the samples in 72 hours. This lab did not thus participate in the study. The control temperature was recorded upon receipt of the package and the temperature probe sent to the expert laboratory. The samples were analyzed the 10th of December. The expert laboratory concurrently analyzed a set of samples under the same conditions with both methods. Analyses were thus realized by thirteen laboratories.
3.2. Results
3.2.1. Temperature and state of the samples at reception The temperature readings at reception, the state of the samples and probes data are shown in table 4.
Laboratory Temperature State of the samples Probe temperature
Mean SD
A 10,4°C Correct 3,0°C 0,6°C
B 2,6°C Correct 0,2°C 0,3°C
C 5,8°C Correct 2,6°C 0,8°C
D 8,5°C Correct 1,4°C 0,7°C
E 4,0°C Correct 0,6°C 0,3°C
F 3,8°C Correct ‐1,5°C 2,1°C
G 6,1°C Correct 2,2°C 0,8°C
H 2,4°C Correct 2,4°C 1,0°C
J 4,8°C Correct 3,3°C 1,0°C
K 4,6°C Correct 1,9°C 1,4°C
L 6,3°C Correct 1,9°C 1,0°C
M 6,6°C Correct 1,5°C 0,6°C
N 5,4°C Correct 1,6°C 0,9°C
Table 4 : temperature and state of the samples upon reception
IDEXX - Enterolert-E Summary report - v1 March 2015
Institut Scientifique d'Hygiène et d'Analyse 12/46

Temperatures are correct for 10 laboratories. Laboratories A and D showed temperatures superior to 8°C. The analyses of the thermal profiles of the probes showed that the shipping of the samples were realized at a correct temperature, with means between 1,4°C and 3,0°C.
3.2.2. Results from expert laboratory and participating laboratories The overall results are presented in table 5. Detailed results are provided in appendix 8. For level 0, all results of the reference method were inferior to 15 MPN/100 mL and all results of the alternative method were inferior to 10 MPN/100 mL.
Labo‐ratory
Level 1 Level 2 Level 3
RM AM RM AM RM AM
R1 R2 R1 R2 R1 R2 R1 R2 R1 R2 R1 R2
A 46 61 20 52 648 495 282 341 838 2194 857 862
B 109 77 52 41 640 461 384 327 2759 2182 1354 2755
C 126 15 20 20 594 485 512 441 2604 2140 2247 2014
D 77 46 75 31 509 534 395 495 1797 1927 2098 1500
E 61 110 63 52 612 712 246 441 2873 2792 1483 1467
F 61 46 121 20 390 585 563 650 1599 2536 1553 1722
G 94 15 31 52 559 697 727 512 2023 2206 3255 2282
H <15 15 75 31 476 606 465 605 1716 2087 2359 1850
J 77 46 41 41 718 621 644 691 1929 2079 2489 2187
K 94 30 52 41 383 485 602 345 1984 1838 1850 1145
L 61 46 63 52 489 480 480 529 2130 1567 2014 2014
M 77 46 31 20 485 485 241 278 1494 1523 1187 1010
N 46 61 52 63 600 627 399 305 2640 2444 2098 712
Expert (*)
46 61 86 52 559 627 556 464 2263 2249 2613 1918
Table 5 : results of the interlaboratory study (MPN/100 mL)
Laboratory H found one replicate of the level 1 inferior to 15 MPN/100 mL with the reference method. Consequently this lab was not included in the statistical analysis of the data, because of the impossibility of the transformation of this result in logarithm. The data obtained by the twelve remaining laboratories are presented in the two dimensional graph of the figure 3 in log MPN/100 mL for a better appreciation of the data (y = x in dotted line).
IDEXX - Enterolert-E Summary report - v1 March 2015
Institut Scientifique d'Hygiène et d'Analyse 13/46

Figure 3 : two‐dimensional graph (MPN/100 mL)
3.2.3. Enumerations of culturable microorganisms For the whole laboratories, the enumerations at 22°C vary between 27 and 190 CFU/mL. Concerning the enumerations at 36°C, the results were varying between 24 and 180 CFU/mL. The results of each lab are shown in appendix 9.
3.3. Statistical interpretation
3.3.1. Bias Table 6 presents the target value, the mean, and the bias for each level of contamination.
Values log MPN/100 mL
Levels 1 ‐ low 2 ‐ medium 3 ‐ high
Target value 1,785 2,737 3,323
Mean 1,617 2,632 3,215
Relative bias ‐9,45% ‐3,84% ‐3,26%
Bias ‐0,169 ‐0,105 ‐0,108
Table 6 : calculations of the bias of the alternative method
The accuracy is estimated by the bias which varies between ‐0,169 log MPN/100 mL and ‐0,105 log MPN/100 mL.
0,0
0,5
1,0
1,5
2,0
2,5
3,0
3,5
4,0
0,0 0,5 1,0 1,5 2,0 2,5 3,0 3,5 4,0
Alternative method (MPN/100 mL)
Reference method (MPN/100 mL)
Two‐dimensional graph RM vs AM
IDEXX - Enterolert-E Summary report - v1 March 2015
Institut Scientifique d'Hygiène et d'Analyse 14/46

The bias obtained during the comparative study was ‐0,055 log MPN/100 mL.
3.3.2. Accuracy profile Table 7 shows the tolerance values and limits of the alternative method for the different values of probability of tolerance and the limits of acceptability. Data are presented in log MPN/100 mL.
Tolerance probability Parameters log MPN/100 mL
Low Medium High
90%
Low tolerance value ‐0,536 ‐0,366 ‐0,414
High tolerance value 0,199 0,156 0,197
Low tolerance limit ‐0,600 ‐0,600 ‐0,600
High tolerance limit 0,600 0,600 0,600
80%
Low tolerance value ‐0,452 ‐0,305 ‐0,343
High tolerance value 0,114 0,095 0,126
Low tolerance limit ‐0,500 ‐0,500 ‐0,500
High tolerance limit 0,500 0,500 0,500
Table 7 : tolerance values for the alternative method
Figures 4 and 5 present the accuracy profiles.
Figure 4 : accuracy profile for a tolerance probability at 90% and acceptability limits at 0,6 log MPN/100 mL
‐1,0
‐0,8
‐0,6
‐0,4
‐0,2
0,0
0,2
0,4
0,6
0,8
1,0
1,5 1,7 1,9 2,1 2,3 2,5 2,7 2,9 3,1 3,3 3,5
Bias
Levels
Bias Low tolerance limit
High tolerance limit Low acceptability limit
High acceptability limit
IDEXX - Enterolert-E Summary report - v1 March 2015
Institut Scientifique d'Hygiène et d'Analyse 15/46

Figure 5 : accuracy profile for a tolerance probability at 80% and acceptability limits at 0,5 log MPN/100 mL
• Comments : For all the contamination levels, the tolerance interval is comprised between the acceptability interval for a 90% tolerance probability and a limit at 0,6 log MPN/100 mL or for a 80% tolerance probability and a limit at 0,5 log MPN/100 mL.
3.4. Conclusion The bias of the alternative method is slightly negative but relatively stable from the low level of contamination to the high level of contamination. For all levels of contamination, the tolerance limits are between the limits of acceptability, meaning that:
‐ at least 90% of the results will be between the limits of acceptability as defined at 0,6 log MPN/100 mL, ‐ or at least 80% of the results will be between the limits of acceptability as defined at 0,5 log MPN/100 mL
‐1,0
‐0,8
‐0,6
‐0,4
‐0,2
0,0
0,2
0,4
0,6
0,8
1,0
1,5 1,7 1,9 2,1 2,3 2,5 2,7 2,9 3,1 3,3 3,5
Bias
Levels
Bias Low tolerance limit
High tolerance limit Low acceptability limit
High acceptability limit
IDEXX - Enterolert-E Summary report - v1 March 2015
Institut Scientifique d'Hygiène et d'Analyse 16/46

4. Complementary assays The aim of the complementary assays are to compare the results obtained with Enterolert‐E or Colilert‐18 with the use of a Quanti‐Tray 2000 or the use of a Quanti‐Tray, in order to allow the use of both devices in the framework of a certification NF Validation concerning each IDEXX kit using a Quanti‐Tray or a Quanti‐Tray 2000.
4.1. Results and interpretation Two sets of results are available:
‐ ISHA data from the comparative study for the NF Validation certification of the method Enterolert‐E with Quanti‐Tray 2000, ‐ IDEXX data from an analysis of a tap water using Colilert‐18 associated with Quanti‐Tray 2000 and with Quanti‐Tray.
4.1.1. Results from Enterolert‐E / Quanti‐Tray 2000 comparative study
4.1.1.1. Raw results
Results have been collected from samples used in the comparative study for the validation of the method Enterolert‐E in the common enumeration range of the two devices, namely from 10 to 2000 MPN/100 mL. A minimum of 10 results was asked by the Technical Board: it’s a total of 18 samples that have been taken into account. Results are in appendix 10. A two‐dimensional graph is shown in figure 6, presenting the results obtained with the Quanti‐Tray 2000 (the “validated” Quanti‐Tray for the Enterolert‐E method) as the reference method.
Figure 6 : Comparison of results obtained with Quanti‐Tray 2000 and with Quanti‐Tray for the validation of the Enterolert‐E method
0,0
0,5
1,0
1,5
2,0
2,5
3,0
3,5
4,0
0,0 0,5 1,0 1,5 2,0 2,5 3,0 3,5 4,0
Quan
ti‐Tray (log MPN/100 m
L)
Quanti‐Tray 2000 (log MPN/100 mL)
IDEXX - Enterolert-E Summary report - v1 March 2015
Institut Scientifique d'Hygiène et d'Analyse 17/46

4.1.1.2. Statistical interpretation
Validation protocol for an alternative commercial method as compared with a reference method A statistical interpretation has been performed according to the requirements of the Validation protocol for an alternative commercial method as compared with a reference method, considering the Quanti‐Tray 2000 as the reference device and using the tests for the relative accuracy. Results are shown in appendix 10. According to this protocol, the relationship of relative accuracy between QT‐2000 and QT is evaluated with the linear model: 'y = a + bx'. This formula corresponds to the equation of the linear regression drawn from raw results obtained by experimentation, y representing the QT‐2000 devices and x the QT‐devices. There is a perfect accuracy (or there is no systematic bias) between the two methods if this equation is equal to the theoretical 'y = x' equation, which applies in the ideal model where the two methods behave similarly. The intercept is theoretically zero in this ideal model (hypothesis [a = 0]). The estimated intercept obtained with the two methods is checked using p {a = 0}. If the alternative method is a systematic bias against the reference method, the probability p {a = 0} is less than α = 0.05. The 'b' slope is theoretically equal to 1 in the ideal model (hypothesis [b = 1]). The estimated slope obtained with the two methods should pass by p {b = 1}. Statistically, if the alternative method does not give the same values as the reference method, the probability p {b = 1} is less than α = 0.05. The results of the statistical tests are shown in the table below.
Rob.R Regression used T critical a t(a) b t(b) Probabilities (%)
Intercept at 0 Slope at 1
1,416 GMFR 2,101 ‐0,097 0,460 1,040 0,523 64,8 60,4
The equation for the regression line is as follows: log Alt = 1,040 log Ref – 0,097 Hypothesis [a = 0 and b = 1] is accepted for the comparison of the enumeration of enterococci with the Enterolert‐E method using a Quanti‐Tray versus a Quanti‐Tray 2000.
Student‐Fisher test A Student‐Fisher test has been also performed from the data obtained during the validation of the Enterolert‐E method. The results of the test are shown in the table below:
t‐Test: Paired Two Sample for Means
Parameter Quanti‐Tray Quanti‐Tray 2000
Mean 1,998 2,015
Variance 0,280 0,259
Observations 36 36
Pearson Correlation 0,883
Hypothesized Mean Difference 0
df 35
t Stat ‐0,398
P(T<=t) one‐tail 0,346
t Critical one‐tail 1,690
P(T<=t) two‐tail 0,693
t Critical two‐tail 2,030
IDEXX - Enterolert-E Summary report - v1 March 2015
Institut Scientifique d'Hygiène et d'Analyse 18/46

Both one‐tailed and two‐tailed tests conclude that there is no statistically significant difference between the enumeration of enterococci with Quanti‐Tray or with Quanti‐Tray 2000 at α=0,05.
4.1.2. Results from Colilert‐18 / Quanti‐Tray study
4.1.2.1. Raw results
Results were obtained from IDEXX Company. An Escherichia coli suspension was spiked in a neutralized tap water from 30 to 180 CFU/100 mL and then analyzed with Colilert‐18 associated with Quanti‐Tray and with Quanti‐Tray 2000. Results are shown in appendix 10. Two two‐dimensional graphs are shown in figure 7, presenting the results obtained with the Quanti‐Tray (the “validated” Quanti‐Tray for the Colilert‐18 method in drinking waters) as the reference method.
Figure 7 : Comparison of results obtained with Quanti‐Tray 2000 and with Quanti‐Tray for the enumeration of Escherichia coli in tap water
4.1.2.2. Statistical interpretation
A Student‐Fisher test has been performed from the data obtained. The results are shown in the table below.
t‐Test: Paired Two Sample for Means
Parameter Quanti‐Tray Quanti‐Tray 2000
Mean 104,8 109,1
Variance 2119,6 3043,9
Observations 19 19
Pearson Correlation 0,892
Hypothesized Mean Difference 0
df 18
t Stat ‐0,745
P(T<=t) one‐tail 0,233
t Critical one‐tail 1,734
P(T<=t) two‐tail 0,466
t Critical two‐tail 2,101
0
50
100
150
200
250
0 50 100 150 200 250
Quanti‐Tray 2000 (MPN/100 mL)
Quanti‐Tray (MPN/100 mL)
0,0
0,5
1,0
1,5
2,0
2,5
0,0 0,5 1,0 1,5 2,0 2,5
Quanti‐Tray 2000 (log MPN/100 mL)
Quanti‐Tray (log MPN/100 mL)
IDEXX - Enterolert-E Summary report - v1 March 2015
Institut Scientifique d'Hygiène et d'Analyse 19/46

Both one‐tailed and two‐tailed tests conclude that there is no statistically significant difference between the enumeration of Escherichia coli with Quanti‐Tray or with Quanti‐Tray 2000 at α=0,05.
4.2. Conclusion The assays realized showed that the enumerations with the NF Validation certified IDEXX methods can be performed either with a Quanti‐Tray device or with a Quanti‐Tray 2000 device according to the expected concentration of the target analyte in the sample without introducing any bias in the measurement.
IDEXX - Enterolert-E Summary report - v1 March 2015
Institut Scientifique d'Hygiène et d'Analyse 20/46

5. Conclusion The validation study for the AFNOR Certification validation of the method Enterolert‐E for the enumeration of enterococci in bathing waters was realized in three steps in 2014 and 2015:
‐ a comparative study to compare the performance of the Enterolert‐E method to the reference method ISO 7899‐1, based on the determination of several parameters (linearity, relative accuracy, limits of detection and quantification and selectivity), ‐ complementary assays to validate the use of Quanti‐Tray and Quanti‐Tray 2000 with the method, ‐ an interlaboratory study to evaluate the performance of the method in several laboratories under real conditions that represent its routine application.
Concerning the comparative study, the linearity and the relative accuracy of the method Enterolert‐E / Quanti‐Tray 2000 for the enumeration of intestinal enterococci in bathing waters are satisfactory. Bias between the two methods is acceptable. The limits of detection and quantification of the method are satisfactory. The method Enterolert‐E / Quanti‐Tray 2000 for the enumeration of intestinal enterococci is specific and selective. Results are obtained in 24 to 28 hours with the alternative method against 36 to 72 hours with the reference method. Complementary assays showed that the enumerations with the NF Validation certified IDEXX methods can be performed either with a Quanti‐Tray device or with a Quanti‐Tray 2000 device according to the expected concentration of the target analyte in the sample without introducing any bias in the measurement. The interlaboratory study showed that the bias of the alternative method is slightly negative but relatively stable from the low level of contamination to the high level of contamination. For all levels of contamination, the tolerance limits are between the limits of acceptability, meaning that:
‐ at least 90% of the results will be between the limits of acceptability as defined at 0,6 log MPN/100 mL, ‐ or at least 80% of the results will be between the limits of acceptability as defined at 0,5 log MPN/100 mL.
Massy, the 27th of March 2015, François Le Nestour
Unit Innovation Biology Manager
IDEXX - Enterolert-E Summary report - v1 March 2015
Institut Scientifique d'Hygiène et d'Analyse 21/46

APPENDIX 1 ALTERNATIVE METHOD PROTOCOL
ENTEROLERT‐E / QUANTI‐TRAY OR QUANTI‐TRAY 2000
Step 1 Fill a test vial with 90 mL of sterile distilled water
Add the contents of one Enterolert‐E snap pack to the test vessel, cap vessel and shake until reagent is dissolved
Mix the sample of water thoroughly and transfer 10 ml to the test vessel, cap vessel and shake well Pour the contents of the test vessel into a Quanti‐Tray or a Quanti‐Tray 2000 and seal in a Quanti‐
Tray Sealer
Step 2 Place the sealed tray in a 41°C (+/‐ 0.5°C) incubator for 24–28 hours.
Step 3 Look for fluorescence with a 6‐watt, 365 nm, UV light within 5 inches of the sample in a dark
environment. Face light away from your eyes and towards the sample.
Step 4 Read results according to the Result Interpretation table below. Count the number of positive wells
and refer to the MPN table provided with the trays to obtain a Most Probable Number.
Appearance Result
Lack of fluorescence Negative for enterococci
Blue fluorescence Positive for enterococci
Step 5 To obtain the correct quantitative result, refer to the MPN table provided with the trays. Multiply
this value by the dilution factor of 10.
IDEXX - Enterolert-E Summary report - v1 March 2015
Institut Scientifique d'Hygiène et d'Analyse 22/46

APPENDIX 2 REFERENCE METHOD PROTOCOL
EN ISO 7899‐1 : 1999 Detection and enumeration of intestinal enterococci in surface and waste water
Part 1: Miniaturized method (Most Probable Number) by inoculation in liquid medium
9 mL of sample
Preparation of the dilution range 6 dilutions in synthetic sea salt diluent
16 wells per dilution (from 1/2 to 1/200 000)
Inoculation 200 µL per well containing the MUD medium
Incubation 36 to 72 hours at 44±0,5°C
Enumeration of the positive wells (fluorescent) by UV reading
Expression of the results: MPN / 100 mL of intestinal enterococci
IDEXX - Enterolert-E Summary report - v1 March 2015
Institut Scientifique d'Hygiène et d'Analyse 23/46

APPENDIX 3 BACTERIAL STRESS
Code Strain Origin Stress applied Stress intensity
ENTC.1.5 E. faecalis
River water
3 hypochlorite treatments + 20 min at 56°C 0,6
ENTC.1.8 E. faecalis
River water
3 hypochlorite treatments + 20 min at 56°C 0,8
ENTC.1.11 E. faecalis
River water
3 hypochlorite treatments + 8 days at 5°C + 20 min at 56°C 0,7
ENTC.6.2 E. durans
River water
3 hypochlorite treatments + 8 days at 5°C + 20 min at 56°C
1,2
ENTC.1.6 E. faecalis
River water
1 cycle freezing‐defrosting + 6 days at 5°C + 3 hypochlorite treatments
0,6
ENTC.1.9 E. faecalis
River water
1 cycle freezing‐defrosting + 6 days at 5°C + 3 hypochlorite treatments
0,8
ENTC.2.5 E. faecium
River water
1 cycle freezing‐defrosting + 6 days at 5°C + 3 hypochlorite treatments
0,5
ENTC.7.1 E. casseliflavus
River water
1 cycle freezing‐defrosting + 6 days at 5°C + 3 hypochlorite treatments
0,9
ENTC.7.3 E. casseliflavus
River water
3 cycles freezing‐defrosting + 6 days at 5°C + sodium hypochlorite
1,1
ENTC.2.8 E. faecium
River water
3 cycles freezing‐defrosting 0,7
ENTC.5.3 E. gallinarum
Waste water
3 cycles freezing‐defrosting + 6 days at 5°C 1,2
ENTC.2.9 E. faecium
River water
3 cycles freezing‐defrosting + 6 days at 5°C 0,8
ENTC.3.2 E. hirae
River water
3 cycles freezing‐defrosting + 6 days at 5°C 0,9
ENTC.4.1 E. avium Water
3 cycles freezing‐defrosting + 6 days at 5°C + sodium hypochlorite
1,0
IDEXX - Enterolert-E Summary report - v1 March 2015
Institut Scientifique d'Hygiène et d'Analyse 24/46

APPENDIX 4 RELATIVE ACCURACY RESULTS
IDEXX - Enterolert-E Summary report - v1 March 2015
Institut Scientifique d'Hygiène et d'Analyse 25/46

Total raw results
Number of
fluorescent
wells
MPN/100 mL
Number of
fluorescent
wells
MPN/100 mL
Number of
large
fluorescent
wells
Number of
small
fluorescent
wells
MPN/100 mL
Number of
large
fluorescent
wells
Number of
small
fluorescent
wells
MPN/100 mL 1/2 1/20 MPN/100 mL 1/2 1/20 MPN/100 mL
ID 1 MarineEnglish Channel, Perros‐Guirrec
(France)/ / 1 10 1 10 0 0 <10 0 0 <10 0 0 <15 0 0 <15
ID 2 Marine Atlantic Ocean, La Rochelle (France) / / 0 <10 0 <10 0 0 <10 0 0 <10 0 0 <15 0 0 <15
ID 3 MarineAtlantic Ocean, St‐Jean‐de‐Luz
(France)/ / 1 10 2 20 2 0 20 1 0 10 0 0 <15 0 0 <15
ID 4 Fresh Pond, Trivaux (France) ENTC.1.5 1000 49 1 652 47 1 298 44 4 1 054 47 13 1 785 43 6 1 188 43 1 1 049
ID 5 Fresh Pond, Villebon (France) ENTC.1.8 1000 49 1 652 51 >2005 44 6 1 119 45 9 1 314 55 6 1 976 56 4 1 980
ID 6 Fresh Pond, Meudon (France) ENTC.1.11 5000 51 >2005 51 >2005 49 27 5 172 49 19 3 255 63 13 4 573 64 10 4 753
ID 7 MarineEnglish Channel, Perros‐Guirrec
(France)ENTC.1.5 1000 50 2 005 51 >2005 39 6 836 39 13 1 010 50 10 1 722 54 10 2 065
ID 8 MarineAtlantic Ocean, St‐Jean‐de‐Luz
(France)ENTC.1.8 1000 43 945 46 1 184 43 9 1 145 46 6 1 291 60 7 2 715 55 9 2 121
ID 9 Marine Atlantic Ocean, La Rochelle (France) ENTC.1.5 1000 51 >2005 51 >2005 49 20 3 448 49 19 3 255 64 14 6 119 63 12 4 368
ID 10 Marine North Sea, Kristiansand (Norway) ENTC.6.2 10000 51 >2005 51 >2005 49 41 12 033 49 34 7 701 64 18 8 329 64 20 9 826
ID 11 Fresh Pond, Vert‐le‐Petit (France) ENTC.1.5 200 8 87 2 20 6 1 74 8 0 86 7 0 110 7 0 110
ID 12 Fresh River Seine, Saintry (France) ENTC.6.2 500 49 1 652 51 >2005 49 16 2 755 48 14 2 098 53 7 1 838 56 5 2 029
ID 13 Marine English Channel, Grainval (France) ENTC.1.8 500 8 87 12 137 3 0 31 14 1 173 15 2 287 6 1 109
ID 14 Marine English Channel, Yport (France) ENTC.1.11 500 50 2 005 51 >2005 49 16 2 755 48 21 2 851 59 7 2 536 62 9 3 421
ID 15 Marine English Channel, Vaucottes (France) ENTC.1.6 300 3 31 6 64 11 0 122 7 1 85 2 0 30 5 0 77
ID 16 Marine English Channel, Fécamp (France) ENTC.1.9 300 25 344 17 207 18 3 256 23 0 299 15 0 253 12 0 197
ID 17 Marine English Channel, Etretat (France) ENTC.2.5 300 11 124 6 64 5 4 94 7 1 85 15 0 253 14 0 234
ID 18 MarineMediterranean Sea, Vilanova I La
Geltrù (Spain)ENTC.1.6 300 9 99 8 87 4 1 52 6 0 63 5 0 77 5 1 93
ID 19 MarineMediterranean Sea, Sitges, Aiguadolç
beach (Spain)ENTC.1.9 300 17 207 20 254 17 1 216 10 0 110 11 2 212 21 0 375
ID 20 MarineMediterranean Sea, Sitges, Les
Botigues beach (Spain)ENTC.2.5 300 5 53 9 99 7 2 96 8 0 86 20 1 371 13 1 232
ID 21 MarineMediterranean Sea, Gavà, Gavà Mar
beach (Spain)ENTC.1.5 300 4 42 7 75 5 0 52 8 1 97 8 0 127 10 0 161
ID 22 Fresh Watercourse, Antony (France) / / 16 192 19 238 18 2 243 16 4 238 13 2 249 19 1 350
ID 23 Fresh River Bièvre, Igny (France) / / 0 <10 0 <10 0 0 <10 0 0 <10 0 0 <15 0 0 <15
ID 24 Fresh La Blanchette lake, Massy (France) ENTC.1.9 40 3 31 1 10 4 0 41 2 0 20 2 0 30 1 0 15
ID 25 Fresh Brassens pool, Massy (France) / / 0 <10 0 <10 0 0 <10 0 0 <10 0 0 <15 0 0 <15
ID 26 Fresh Bois de Briis pool, Massy (France) / / 0 <10 0 <10 0 0 <10 0 0 <10 0 0 <15 0 0 <15
ID 27 Fresh Goachères pool, Massy (France) ENTC.7.1 600 51 >2005 51 >2005 49 25 4 611 49 23 4 106 63 7 3 552 61 8 3 020
ID 28 Fresh River Bièvre, Igny (France) ENTC.7.3 93 5 53 5 53 7 0 75 6 1 74 3 0 46 4 2 92
ID 29 FreshRiver Marne, Nogent‐sur‐Marne
(France)ENTC.2.8 86 6 64 9 99 3 0 31 6 0 63 3 2 76 9 1 160
ID 30 Fresh Ponds of Cergy, Cergy (France) ENTC.5.3 58 9 99 6 64 7 0 75 9 0 98 5 0 77 3 0 46
ID 31 Fresh Aydat lake, Aydat (France) ENTC.2.9 73 9 99 6 64 3 0 31 6 1 74 5 0 77 1 0 15
ID 32 Fresh Villefort lake, Villefort (France) ENTC.3.2 63 2 20 2 20 0 0 <10 2 0 20 0 0 <10 0 0 <10
ID 33 Fresh River Allier, Longues (France) ENTC.2.8 1700 / / / / 46 7 1 333 45 9 1 314 49 2 1 372 46 5 1 305
ID 34 Fresh River Seine, Corbeil‐Essonne (France) ENTC.5.3 810 / / / / 32 3 538 31 4 529 34 2 750 35 4 828
ID 35 Fresh Brassens pool, Massy (France) ENTC.7.3 1700 / / / / 48 9 1 722 45 11 1 396 41 5 1 074 41 4 1 047
ID 36 FreshRiver Essonne, Ballancourt‐sur‐
Essonne (France)ENTC.4.1 30 2 20 1 10 1 0 10 2 0 20 1 0 15 1 0 15
R1 R2 R1 R2
N° Sample Strain
Contami‐
nation level
(CFU/100
mL)
Enterolert‐E
Water type
Reference method 7899‐1 (*)Quanti‐tray Quanti‐tray 2000
R1 R2
IDEXX - Enterolert-E Summary report - v1 March 2015
Institut Scientifique d'Hygiène et d'Analyse 26/46

Total exploitable results
Number of
fluorescent
wells
MPN/100
mL
log
MPN/100
mL
Number of
fluorescent
wells
MPN/100
mL
log
MPN/100
mL
Number of
large
fluorescent
wells
Number of
small
fluorescent
wells
MPN/100
mL
log
MPN/100
mL
Number of
large
fluorescent
wells
Number of
small
fluorescent
wells
MPN/100
mL
log
MPN/100
mL
1/2 1/20MPN/100
mL
log
MPN/100
mL
1/2 1/20MPN/100
mL
log
MPN/100
mL
ID 4 Fresh Pond, Trivaux (France) ENTC.1.5 1000 49 1 652 3,218 47 1 298 3,113 44 4 1 054 3,023 47 13 1 785 3,252 43 6 1 188 3,075 43 1 1 049 3,021
ID 5 Fresh Pond, Villebon (France) ENTC.1.8 1000 49 1 652 3,218 51 >2005 / 44 6 1 119 3,049 45 9 1 314 3,119 55 6 1 976 3,296 56 4 1 980 3,297
ID 6 Fresh Pond, Meudon (France) ENTC.1.11 5000 51 >2005 / 51 >2005 / 49 27 5 172 3,714 49 19 3 255 3,513 63 13 4 573 3,660 64 10 4 753 3,677
ID 7 MarineEnglish Channel, Perros‐Guirrec
(France)ENTC.1.5 1000 50 2 005 3,302 51 >2005 / 39 6 836 2,922 39 13 1 010 3,004 50 10 1 722 3,236 54 10 2 065 3,315
ID 8 MarineAtlantic Ocean, St‐Jean‐de‐Luz
(France)ENTC.1.8 1000 43 945 2,975 46 1 184 3,073 43 9 1 145 3,059 46 6 1 291 3,111 60 7 2 715 3,434 55 9 2 121 3,327
ID 9 MarineAtlantic Ocean, La Rochelle
(France)ENTC.1.5 1000 51 >2005 / 51 >2005 / 49 20 3 448 3,538 49 19 3 255 3,513 64 14 6 119 3,787 63 12 4 368 3,640
ID 10 Marine North Sea, Kristiansand (Norway) ENTC.6.2 10000 51 >2005 / 51 >2005 / 49 41 12 033 4,080 49 34 7 701 3,887 64 18 8 329 3,921 64 20 9 826 3,992
ID 11 Fresh Pond, Vert‐le‐Petit (France) ENTC.1.5 200 8 87 1,940 2 20 1,301 6 1 74 1,869 8 0 86 1,934 7 0 110 2,041 7 0 110 2,041
ID 12 Fresh River Seine, Saintry (France) ENTC.6.2 500 49 1 652 3,218 51 >2005 / 49 16 2 755 3,440 48 14 2 098 3,322 53 7 1 838 3,264 56 5 2 029 3,307
ID 13 Marine English Channel, Grainval (France) ENTC.1.8 500 8 87 1,940 12 137 2,137 3 0 31 1,491 14 1 173 2,238 15 2 287 2,458 6 1 109 2,037
ID 14 Marine English Channel, Yport (France) ENTC.1.11 500 50 2 005 3,302 51 >2005 / 49 16 2 755 3,440 48 21 2 851 3,455 59 7 2 536 3,404 62 9 3 421 3,534
ID 15 MarineEnglish Channel, Vaucottes
(France)ENTC.1.6 300 3 31 1,491 6 64 1,806 11 0 122 2,086 7 1 85 1,929 2 0 30 1,477 5 0 77 1,886
ID 16 Marine English Channel, Fécamp (France) ENTC.1.9 300 25 344 2,537 17 207 2,316 18 3 256 2,408 23 0 299 2,476 15 0 253 2,403 12 0 197 2,294
ID 17 Marine English Channel, Etretat (France) ENTC.2.5 300 11 124 2,093 6 64 1,806 5 4 94 1,973 7 1 85 1,929 15 0 253 2,403 14 0 234 2,369
ID 18 MarineMediterranean Sea, Vilanova I La
Geltrù (Spain)ENTC.1.6 300 9 99 1,996 8 87 1,940 4 1 52 1,716 6 0 63 1,799 5 0 77 1,886 5 1 93 1,968
ID 19 MarineMediterranean Sea, Sitges,
Aiguadolç beach (Spain)ENTC.1.9 300 17 207 2,316 20 254 2,405 17 1 216 2,334 10 0 110 2,041 11 2 212 2,326 21 0 375 2,574
ID 20 MarineMediterranean Sea, Sitges, Les
Botigues beach (Spain)ENTC.2.5 300 5 53 1,724 9 99 1,996 7 2 96 1,982 8 0 86 1,934 20 1 371 2,569 13 1 232 2,365
ID 21 MarineMediterranean Sea, Gavà, Gavà
Mar beach (Spain)ENTC.1.5 300 4 42 1,623 7 75 1,875 5 0 52 1,716 8 1 97 1,987 8 0 127 2,104 10 0 161 2,207
ID 22 Fresh Watercourse, Antony (France) / / 16 192 2,283 19 238 2,377 18 2 243 2,386 16 4 238 2,377 13 2 249 2,396 19 1 350 2,544
ID 24 FreshLa Blanchette lake, Massy
(France)ENTC.1.9 40 3 31 1,491 1 10 1,000 4 0 41 1,613 2 0 20 1,301 2 0 30 1,477 1 0 15 1,176
ID 27 Fresh Goachères pool, Massy (France) ENTC.7.1 600 51 >2005 / 51 >2005 / 49 25 4 611 3,664 49 23 4 106 3,613 63 7 3 552 3,550 61 8 3 020 3,480
ID 28 Fresh River Bièvre, Igny (France) ENTC.7.3 93 5 53 1,724 5 53 1,724 7 0 75 1,875 6 1 74 1,869 3 0 46 1,663 4 2 92 1,964
ID 29 FreshRiver Marne, Nogent‐sur‐Marne
(France)ENTC.2.8 86 6 64 1,806 9 99 1,996 3 0 31 1,491 6 0 63 1,799 3 2 76 1,881 9 1 160 2,204
ID 30 Fresh Ponds of Cergy, Cergy (France) ENTC.5.3 58 9 99 1,996 6 64 1,806 7 0 75 1,875 9 0 98 1,991 5 0 77 1,886 3 0 46 1,663
ID 31 Fresh Aydat lake, Aydat (France) ENTC.2.9 73 9 99 1,996 6 64 1,806 3 0 31 1,491 6 1 74 1,869 5 0 77 1,886 1 0 15 1,176
ID 33 Fresh River Allier, Longues (France) ENTC.2.8 1700 / / / / / / 46 7 1 333 3,125 45 9 1 314 3,119 49 2 1 372 3,137 46 5 1 305 3,116
ID 34 FreshRiver Seine, Corbeil‐Essonne
(France)ENTC.5.3 810 / / / / / / 32 3 538 2,731 31 4 529 2,723 34 2 750 2,875 35 4 828 2,918
ID 35 Fresh Brassens pool, Massy (France) ENTC.7.3 1700 / / / / / / 48 9 1 722 3,236 45 11 1 396 3,145 41 5 1 074 3,031 41 4 1 047 3,020
ID 36 FreshRiver Essonne, Ballancourt‐sur‐
Essonne (France)ENTC.4.1 30 2 20 1,301 1 10 1,000 1 0 10 1,000 2 0 20 1,301 1 0 15 1,176 1 0 15 1,176
Reference method ISO 7899‐1 (*)
R1 R2Quanti‐tray
R1 R2
N° Sample Strain
Contami‐
nation level
(CFU/100
mL)
Enterolert‐EQuanti‐tray 2000
R1 R2
Water type
IDEXX - Enterolert-E Summary report - v1 March 2015
Institut Scientifique d'Hygiène et d'Analyse 27/46

Sample Replicate 1 Replicate 2 M SD Sample Replicate 1 Replicate 2 M SD1 3,075 3,021 3,048 0,038 1 3,023 3,252 3,137 0,162 0,0892 3,296 3,297 3,296 0,001 2 3,049 3,119 3,084 0,049 -0,2133 3,660 3,677 3,669 0,012 3 3,714 3,513 3,613 0,142 -0,0554 3,236 3,315 3,275 0,056 4 2,922 3,004 2,963 0,058 -0,3125 3,434 3,327 3,380 0,076 5 3,059 3,111 3,085 0,037 -0,2956 3,787 3,640 3,713 0,104 6 3,538 3,513 3,525 0,018 -0,1887 3,921 3,992 3,956 0,051 7 4,080 3,887 3,983 0,137 0,0278 2,041 2,041 2,041 0,000 8 1,869 1,934 1,902 0,046 -0,1409 3,264 3,307 3,286 0,030 9 3,440 3,322 3,381 0,084 0,09510 2,458 2,037 2,248 0,297 10 1,491 2,238 1,865 0,528 -0,38311 3,404 3,534 3,469 0,092 11 3,440 3,455 3,448 0,011 -0,02212 1,477 1,886 1,682 0,289 12 2,086 1,929 2,008 0,111 0,32613 2,403 2,294 2,349 0,077 13 2,408 2,476 2,442 0,048 0,09314 2,403 2,369 2,386 0,024 14 1,973 1,929 1,951 0,031 -0,43515 1,886 1,968 1,927 0,058 15 1,716 1,799 1,758 0,059 -0,17016 2,326 2,574 2,450 0,175 16 2,334 2,041 2,188 0,207 -0,26217 2,569 2,365 2,467 0,144 17 1,982 1,934 1,958 0,034 -0,50918 2,104 2,207 2,155 0,073 18 1,716 1,987 1,851 0,191 -0,30419 2,396 2,544 2,470 0,105 19 2,386 2,377 2,381 0,006 -0,08920 1,477 1,176 1,327 0,213 20 1,613 1,301 1,457 0,220 0,13021 3,550 3,480 3,515 0,050 21 3,664 3,613 3,639 0,036 0,12322 1,663 1,964 1,813 0,213 22 1,875 1,869 1,872 0,004 0,05923 1,881 2,204 2,042 0,229 23 1,491 1,799 1,645 0,218 -0,39724 1,886 1,663 1,775 0,158 24 1,875 1,991 1,933 0,082 0,15925 1,886 1,176 1,531 0,502 25 1,491 1,869 1,680 0,267 0,14926 3,137 3,116 3,126 0,015 26 3,125 3,119 3,122 0,004 -0,00527 2,875 2,918 2,897 0,030 27 2,731 2,723 2,727 0,005 -0,16928 3,031 3,020 3,025 0,008 28 3,236 3,145 3,190 0,064 0,16529 1,176 1,176 1,176 0,000 29 1,000 1,301 1,151 0,213 -0,026
q= 29 Mx= 2,603 My= 2,515 M= -0,088n= 2 MEDx= 2,467 MEDy= 2,381 MED= -0,055
N=qn= 58 SDbx= 0,781 SDby= 0,788 BiasMEDwx = 0,073 MEDwy = 0,059
SDwx= 0,156 SDwy= 0,154rob. SDwx= 0,108 rob. SDwy= 0,087
Reference method Alternative method Difference
Relative accuracy - Enterococci - Bathing waters - Logarithmic data
IDEXX - Enterolert-E Summary report - v1 March 2015
Institut Scientifique d'Hygiène et d'Analyse 28/46

Method choiceGMFR Est. y Deviation
2,963 0,174R= 0,985 3,214 -0,130
rob. R= 0,809 3,589 0,024Sx= 0,782 3,193 -0,230Sy= 0,789 3,298 -0,214
3,635 -0,110r= 0,963 3,880 0,104b= 1,008 Res. SEM= 0,190 1,948 -0,047a= -0,110 Res. SD= 0,268 3,203 0,178
2,156 -0,2923,388 0,059
S(b)= 0,046 p(t;b=1)= 0,855 t(b)= 0,184 1,586 0,422S(a)= 0,154 p(t;a=0)= 0,477 t(a)= 0,715 2,258 0,184
2,296 -0,3451,834 -0,0762,361 -0,1732,378 -0,420
Reapetability 2,063 -0,212r 2,381 0,000
rob. r 1,228 0,2293,435 0,2041,718 0,1541,950 -0,3041,679 0,2541,434 0,2463,043 0,0792,811 -0,0842,941 0,2501,076 0,075
0,302 0,245
Reference method Alternative method0,437 0,430
IDEXX - Enterolert-E Summary report - v1 March 2015
Institut Scientifique d'Hygiène et d'Analyse 29/46

0,5 0,3940690494,5 4,427775363
Points correspond to the means of the repetitions for each sample
0
0,5
1
1,5
2
2,5
3
3,5
4
4,5
5
0 1 2 3 4 5
Alte
rnat
ive
met
hod
(log
MPN
/100
mL)
Reference method (log MPN/100 mL)
Relative accuracy - Enterococci - Bathing waters
IDEXX - Enterolert-E Summary report - v1 March 2015
Institut Scientifique d'Hygiène et d'Analyse 30/46

APPENDIX 5 LINEARITY RESULTS
IDEXX - Enterolert-E Summary report - v1 March 2015
Institut Scientifique d'Hygiène et d'Analyse 31/46

Large wells Small wellsMPN/100
mL
log
MPN/100
mL
Large wells Small wellsMPN/100
mL
log
MPN/100
mL
1/2 1/20MPN/100
mL
log
MPN/100
mL
1/2 1/20MPN/100
mL
log
MPN/100
mL
A Marine water E. faecalis 50 45 4 0 41 1,613 5 0 52 1,716 2 0 30 1,477 3 1 61 1,785
B Marine water E. faecalis 500 560 28 5 473 2,675 24 2 345 2,538 31 2 661 2,820 26 2 529 2,723
C Marine water E. faecalis 1000 990 39 3 767 2,885 35 6 683 2,834 38 6 981 2,992 44 4 1177 3,071
D Marine water E. faecalis 5000 5400 49 24 4352 3,639 49 31 6488 3,812 63 9 3843 3,585 64 10 4753 3,677
E Marine water E. faecalis 200 270 15 1 187 2,272 13 0 148 2,170 10 1 177 2,248 13 0 215 2,332
F Marine water E. faecalis 20000 27000 49 45 17329 4,239 49 45 17329 4,239 64 23 12687 4,103 64 27 18563 4,269
R2Real contamination
level (CFU/100 mL)N° Echantillon Strain
Target contamination
level (CFU/100 mL)
Alternative method Reference method (*)
R1 R2 R1
IDEXX - Enterolert-E Summary report - v1 March 2015
Institut Scientifique d'Hygiène et d'Analyse 32/46

Level Rep.1 Rep.2 M SD Rep.1 Rep.2 M SD1 1,477 1,785 1,6 0,218 1,613 1,716 1,7 0,0732 2,820 2,723 2,8 0,068 2,675 2,538 2,6 0,0973 2,992 3,071 3,0 0,056 2,885 2,834 2,9 0,0364 3,585 3,677 3,6 0,065 3,639 3,812 3,7 0,1235 2,248 2,332 2,3 0,060 2,272 2,170 2,2 0,0726 4,103 4,269 4,2 0,117 4,239 4,239 4,2 0,000
Mx = 2,924 My = 2,886q = 6 MEDx = 2,902 MEDy = 2,733n = 2 SDbx = 0,916 SDby = 0,954
N = qn = 12MEDwx = 0,067 MEDwy = 0,072
SDwx = 0,080 SDwy = 0,055rob. SDwx = 0,099 rob. SDwy = 0,107
Method choiceGMFR
R = 0,686rob.R = 1,083
Res.SEM = 0,122Res.SD = 0,172
Sx = 0,878 Est y DeviationSy = 0,911 1,545 0,120
2,728 -0,1222,998 -0,138
r = 0,993 3,620 0,105b = 1,038 2,229 -0,007a = -0,149 4,196 0,042
Sb = 0,062 p(t;b=1) = 0,555 t (b) = 0,611Sa = 0,188 p(t;a=0) = 0,448 t (a) = 0,789
Linéarité
F = 23,164 p(F) = 0,001rob.F = 4,953 rob.p(F) = 0,041
Linearity - Enterococci - Marine water - Log data
Reference method Alternative method
0
1
2
3
4
5
0 1 2 3 4 5
Alte
rnat
ive
met
hod
(log
MPN
/100
mL)
reference method (log MPN/100 mL)
Linearity - Enterococci - Marine water
IDEXX - Enterolert-E Summary report - v1 March 2015
Institut Scientifique d'Hygiène et d'Analyse 33/46

APPENDIX 6 LOD‐LOQ RESULTS
N° Contamination (CFU/100 mL)
Large wells
Small wells
MPN/100 mLNumber of positive
samples Standard deviation
Median
1
0
0 0 0
0/6 0,000 0,000
2 0 0 0
3 0 0 0
4 0 0 0
5 0 0 0
6 0 0 0
1
3
1 0 10
2/6 5,164 0,000
2 0 0 0
3 0 0 0
4 0 0 0
5 1 0 10
6 0 0 0
1
6
1 0 10
2/6 5,164 0,000
2 0 0 0
3 1 0 10
4 0 0 0
5 0 0 0
6 0 0 0
1
9
1 0 10
2/6 5,164 0,000
2 0 0 0
3 0 0 0
4 1 0 10
5 0 0 0
6 0 0 0
1
10
0 0 0
4/6 5,164 10,000
2 1 0 10
3 1 0 10
4 1 0 10
5 0 0 0
6 1 0 10
1
12
1 0 10
5/6 7,528 10,000
2 0 0 0
3 1 1 20
4 1 0 10
5 2 0 20
6 1 0 10
1
14
2 0 20
5/6 10,778 15,000
2 3 0 31
3 2 0 20
4 1 0 10
5 1 0 10
6 0 0 0
1
18
2 0 20
6/6 8,495 15,000
2 1 0 10
3 3 0 31
4 1 0 10
5 2 0 20
6 1 0 10
IDEXX - Enterolert-E Summary report - v1 March 2015
Institut Scientifique d'Hygiène et d'Analyse 34/46

APPENDIX 7 SELECTIVITY RESULTS
IDEXX - Enterolert-E Summary report - v1 March 2015
Institut Scientifique d'Hygiène et d'Analyse 35/46

N° Code Species OriginInoculation level
(CFU/100 mL)
Number of
large wells
Number of
small wells
Result (MPN/100
mL)
1 ENTC.1.2 Enterococcus faecalis ATCC 33186 35 4 0 41
2 ENTC.1.3 Enterococcus faecalis CIP 103214 55 6 0 63
3 ENTC.1.4 Enterococcus faecalis River water 62 3 0 31
4 ENTC.1.5 Enterococcus faecalis Surface water 52 5 0 52
5 ENTC.1.6 Enterococcus faecalis Surface water 57 5 1 63
6 ENTC.1.7 Enterococcus faecalis Surface water 142 11 2 145
7 ENTC.1.8 Enterococcus faecalis River water 70 1 0 10
8 ENTC.1.9 Enterococcus faecalis River water 45 4 0 41
9 ENTC.1.10 Enterococcus faecalis River water 120 8 2 108
10 ENTC.1.11 Enterococcus faecalis River water 45 7 1 85
11 ENTC.1.12 Enterococcus faecalis River water 150 12 1 146
12 ENTC.2.1 Enterococcus faecium Dairy industry 258 17 1 216
13 ENTC.2.2 Enterococcus faecium Aqueous environment 73 5 0 52
14 ENTC.2.4 Enterococcus faecium Surface water 53 5 0 52
15 ENTC.2.5 Enterococcus faecium Surface water 43 2 0 20
16 ENTC.2.6 Enterococcus faecium Surface water 41 2 0 20
17 ENTC.2.7 Enterococcus faecium River water 52 2 0 20
18 ENTC.2.8 Enterococcus faecium River water 66 3 0 31
19 ENTC.2.9 Enterococcus faecium River water 71 6 0 63
20 ENTC.6.1 Enterococcus durans Surface water 52 6 0 63
21 ENTC.6.2 Enterococcus durans River water 49 2 0 20
22 ENTC.4.1 Enterococcus avium Water 30 1 0 10
23 ENTC.5.1 Enterococcus gallinarum River water 49 4 0 41
24 ENTC.5.2 Enterococcus gallinarum River water 37 2 0 20
25 ENTC.5.3 Enterococcus gallinarum Effluent water 40 3 0 31
26 ENTC.3.1 Enterococcus hirae CIP 58.55 124 7 0 75
27 ENTC.3.2 Enterococcus hirae River water 177 7 1 85
28 ENTC.7.1 Enterococcus casselifavus River water 565 10 1 121
29 ENTC.7.2 Enterococcus casseliflavus River water 36 3 0 31
30 ENTC.7.3 Enterococcus casselifavus River water 42 2 0 20
Inclusivity
IDEXX - Enterolert-E Summary report - v1 March 2015
Institut Scientifique d'Hygiène et d'Analyse 36/46

N° Code Species OriginInoculation level
(CFU/100 mL)
Number of
large wells
Number of
small wells
Result (MPN/100
mL)
1 AERC.1.1 Aerococcus viridans CIP 54.145 2,1E+04 0 0 <10
2 AUR.1.1 Aureobacterium saperdae Evaporator 5,0E+05 0 0 <10
3 LACC.1.1 Lactococcus lactis Collection strain 4,0E+04 0 0 <10
4 MIC.1.2 Micrococcus luteus ATCC 4698 1,8E+04 0 0 <10
5 MIC.2.2 Micrococcus spp Surface water 5,0E+04 0 0 <10
6 MIC.2.3 Micrococcus spp Surface water 3,2E+04 0 0 <10
7 STA.1.6 Staphylococcus aureus Surface water 1,2E+04 0 0 <10
8 STA.5.1 Staphylococcus xylosus Surface water 2,1E+04 0 0 <10
9 STA.6.1 Staphylococcus capitis Surface water 3,6E+04 0 0 <10
10 STA.2.3 Staphylococcus epidermidis Surface water 5,0E+04 0 0 <10
11 STA.7.1 Staphylococcus sciuri Surface water 1,6E+04 0 0 <10
12 STA.2.1 Staphylococcus epidermidis Dairy product 5,0E+04 0 0 <10
13 STA.3.2 Staphylococcus haemolyticus Surface water 5,2E+04 0 0 <10
14 STA.4.1 Staphylococcus piscifermentans Evaporator 4,1E+04 0 0 <10
15 PED.1.1 Pediococcus acidilactici Souche de collection 5,2E+04 0 0 <10
16 PED.1.2 Pediococcus spp Surface water 2,6E+04 0 0 <10
17 RHO.1.1 Rhodococcus equi Collection strain 1,8E+04 0 0 <10
18 BAC.2.1 Bacillus circulans Dairy industry 5,0E+04 0 0 <10
19 BAC.4.2 Bacillus subtilis CIP 52.65 T 4,1E+04 0 0 <10
20 BAC.1.4 Bacillus cereus Collection strain 1,9E+04 0 0 <10
21 STE.1.1 Stenotrophomonas maltophilia Eau de fontaine 3,2E+04 0 0 <10
22 AER.1.1 Aeromonas hydrophila Well water 2,3E+04 0 0 <10
23 PSE.1.4 Pseudomonas aeruginosa Fountain water 1,1E+04 0 0 <10
24 ACI.2.1 Acinetobacter cloacae River water 1,9E+04 0 0 <10
25 RAH.1.2 Rahnella aquatilis River water 4,4E+04 0 0 <10
26 ESC.1.120 Escherichia coli River water 2,4E+04 0 0 <10
27 PRO.1.2 Proteus mirabilis Water 1,2E+04 0 0 <10
28 ENTB.2.2 Enterobacter cloacae Well water 2,0E+04 0 0 <10
29 PROV.1.1 Providencia stuartii HPA RM 1,1E+04 0 0 <10
30 XAN.1.1 Xanthomonas campestris Evaporator 3,6E+04 0 0 <10
Exclusivity
IDEXX - Enterolert-E Summary report - v1 March 2015
Institut Scientifique d'Hygiène et d'Analyse 37/46

1/2 1/20 Big wells Small wells
1 0 0 <15 / 0 0 <10 /
4 0 0 <15 / 0 0 <10 /
5 3 0 46 1,663 2 0 20 1,301
7 4 0 61 1,785 5 0 52 1,716
2 29 4 648 2,812 22 0 282 2,450
6 23 4 495 2,695 23 3 341 2,533
3 36 3 838 2,923 40 5 857 2,933
8 57 6 2194 3,341 38 9 862 2,936
1/2 1/20 Big wells Small wells
1 0 0 <15 / 0 0 <10 /
4 0 0 <15 / 0 0 <10 /
5 6 1 109 2,037 5 0 52 1,716
7 5 0 77 1,886 4 0 41 1,613
2 31 1 640 2,806 26 2 384 2,584
6 24 1 461 2,664 23 2 327 2,515
3 61 5 2759 3,441 45 10 1354 3,132
8 56 8 2182 3,339 49 16 2755 3,440
1/2 1/20 Big wells Small wells
1 0 0 <15 / 0 0 <10 /
4 0 0 <15 / 0 0 <10 /
5 7 1 126 2,100 2 0 20 1,301
7 1 0 15 1,176 2 0 20 1,301
2 27 4 594 2,774 31 3 512 2,709
6 25 1 485 2,686 28 3 441 2,644
3 59 8 2604 3,416 49 12 2247 3,352
8 57 5 2140 3,330 48 13 2014 3,304
1/2 1/20 Big wells Small wells
1 0 0 <15 / 0 0 <10 /
4 0 0 <15 / 0 0 <10 /
5 5 0 77 1,886 7 0 75 1,875
7 3 0 46 1,663 3 0 31 1,491
2 26 1 509 2,707 28 0 395 2,597
6 27 1 534 2,728 31 2 495 2,695
3 52 8 1797 3,255 48 14 2098 3,322
8 54 7 1927 3,285 47 8 1500 3,176
1/2 1/20 Big wells Small wells
1 0 0 <15 / 0 0 <10 /
4 0 0 <15 / 0 0 <10 /
5 4 0 61 1,785 6 0 63 1,799
7 7 0 110 2,041 4 1 52 1,716
2 30 1 612 2,787 19 1 246 2,391
6 32 3 712 2,852 28 3 441 2,644
3 60 9 2873 3,458 45 13 1483 3,171
8 60 8 2792 3,446 46 10 1467 3,166
E
Laboratory Sample number
Reference method Alternative method
Number of positive
samples per dilutionResult
(MPN/100 mL)
Result (log
MPN/100 mL)
Number of yellow and
fluorescent wellsResult
(MPN/100 mL)
Result (log
MPN/100 mL)
D
Result (log
MPN/100 mL)
Number of yellow and
fluorescent wellsResult
(MPN/100 mL)
Result (log
MPN/100 mL)
C
Laboratory Sample number
Reference method Alternative method
Number of positive
samples per dilution
B
Laboratory Sample number
Reference method Alternative method
Number of positive
samples per dilutionResult
(MPN/100 mL)
Result
(MPN/100 mL)
Result (log
MPN/100 mL)
Number of yellow and
fluorescent wellsResult
(MPN/100 mL)
Result (log
MPN/100 mL)
A
Laboratory Sample number
Reference method Alternative method
Number of positive
samples per dilutionResult
(MPN/100 mL)
Result (log
MPN/100 mL)
Number of yellow and
fluorescent wellsResult
(MPN/100 mL)
Result (log
MPN/100 mL)
APPENDIX 8
RAW RESULTS
Laboratory Sample number
Reference method Alternative method
Number of positive
samples per dilutionResult
(MPN/100 mL)
Result (log
MPN/100 mL)
Number of yellow and
fluorescent wellsResult
(MPN/100 mL)
Result (log
MPN/100 mL)
IDEXX - Enterolert-E Summary report - v1 March 2015
Institut Scientifique d'Hygiène et d'Analyse 38/46

1/2 1/20 Big wells Small wells
1 0 0 <15 / 0 0 <10 /
4 0 0 <15 / 0 0 <10 /
5 3 1 61 1,785 10 1 121 2,083
7 3 0 46 1,663 1 1 20 1,301
2 20 2 390 2,591 31 6 563 2,751
6 29 1 585 2,767 37 1 650 2,813
3 52 3 1599 3,204 47 9 1553 3,191
8 59 7 2536 3,404 48 9 1722 3,236
1/2 1/20 Big wells Small wells
1 0 0 <15 / 0 0 <10 /
4 0 0 <15 / 0 0 <10 /
5 6 0 94 1,973 3 0 31 1,491
7 1 0 15 1,176 4 1 52 1,716
2 28 1 559 2,747 38 3 727 2,862
6 33 1 697 2,843 31 3 512 2,709
3 55 7 2023 3,306 49 19 3255 3,513
8 58 4 2206 3,344 48 16 2282 3,358
1/2 1/20 Big wells Small wells
1 0 0 <15 / 0 0 <10 /
4 0 0 <15 / 0 0 <10 /
5 0 0 <15 / 7 0 75 1,875
7 0 1 15 1,176 3 0 31 1,491
2 23 3 476 2,678 27 6 465 2,667
6 29 2 606 2,782 35 2 605 2,782
3 52 6 1716 3,235 47 13 2359 3,373
8 57 4 2087 3,320 47 14 1850 3,267
1/2 1/20 Big wells Small wells
1 0 0 <15 / 0 0 <10 /
4 0 0 <15 / 0 0 <10 /
5 5 0 77 1,886 4 0 41 1,613
7 3 0 46 1,663 4 0 41 1,613
2 30 6 718 2,856 35 4 644 2,809
6 28 4 621 2,793 37 3 691 2,839
3 55 5 1929 3,285 48 18 2489 3,396
8 56 6 2079 3,318 48 15 2187 3,340
1/2 1/20 Big wells Small wells
1 0 0 <15 / 0 0 <10 /
4 0 0 <15 / 0 0 <10 /
5 6 0 94 1,973 5 0 52 1,716
7 2 0 30 1,477 4 0 41 1,613
2 18 4 383 2,583 33 5 602 2,780
6 25 1 485 2,686 24 2 345 2,538
3 27 2 1984 3,298 47 14 1850 3,267
8 54 5 1838 3,264 43 9 1145 3,059
K
Result (log
MPN/100 mL)
Number of yellow and
fluorescent wellsResult
(MPN/100 mL)
Result (log
MPN/100 mL)
J
Laboratory Sample number
Reference method Alternative method
Number of positive
samples per dilution
H
Laboratory Sample number
Reference method Alternative method
Number of positive
samples per dilutionResult
(MPN/100 mL)
Result
(MPN/100 mL)
Result (log
MPN/100 mL)
Number of yellow and
fluorescent wellsResult
(MPN/100 mL)
Result (log
MPN/100 mL)
G
Laboratory Sample number
Reference method Alternative method
Number of positive
samples per dilutionResult
(MPN/100 mL)
Result (log
MPN/100 mL)
Number of yellow and
fluorescent wellsResult
(MPN/100 mL)
Result (log
MPN/100 mL)
F
Laboratory Sample number
Reference method Alternative method
Number of positive
samples per dilutionResult
(MPN/100 mL)
Result (log
MPN/100 mL)
Number of yellow and
fluorescent wellsResult
(MPN/100 mL)
Result (log
MPN/100 mL)
Laboratory Sample number
Reference method Alternative method
Number of positive
samples per dilutionResult
(MPN/100 mL)
Result (log
MPN/100 mL)
Number of yellow and
fluorescent wellsResult
(MPN/100 mL)
Result (log
MPN/100 mL)
IDEXX - Enterolert-E Summary report - v1 March 2015
Institut Scientifique d'Hygiène et d'Analyse 39/46

1/2 1/20 Big wells Small wells
1 0 0 <15 / 0 0 <10 /
4 0 0 <15 / 0 0 <10 /
5 4 0 61 1,785 6 0 63 1,799
7 3 0 46 1,663 5 0 52 1,716
2 26 0 489 2,689 29 4 480 2,681
6 24 2 480 2,681 31 4 529 2,723
3 56 7 2130 3,328 48 13 2014 3,304
8 51 4 1567 3,195 48 13 2014 3,304
1/2 1/20 Big wells Small wells
1 0 0 <15 / 0 0 <10 /
4 0 0 <15 / 0 0 <10 /
5 4 1 77 1,886 3 0 31 1,491
7 3 0 46 1,663 2 0 20 1,301
2 25 1 485 2,686 17 3 241 2,382
6 25 1 485 2,686 17 6 278 2,444
3 51 2 1494 3,174 44 8 1187 3,074
8 52 1 1523 3,183 39 13 1010 3,004
1/2 1/20 Big wells Small wells
1 0 0 <15 / 0 0 <10 /
4 0 0 <15 / 0 0 <10 /
5 3 0 46 1,663 5 0 52 1,716
7 4 0 61 1,785 5 1 63 1,799
2 28 3 600 2,778 26 3 399 2,601
6 29 3 627 2,797 21 3 305 2,484
3 28 11 2640 3,422 48 14 2098 3,322
8 58 8 2444 3,388 37 4 712 2,852
1/2 1/20 Big wells Small wells
1 0 0 <15 / 0 0 <10 /
4 0 0 <15 / 0 0 <10 /
5 3 0 46 1,663 8 0 86 1,934
7 4 0 61 1,785 5 0 52 1,716
2 28 1 559 2,747 32 4 556 2,745
6 29 3 627 2,797 29 3 464 2,667
3 58 5 2263 3,355 49 15 2613 3,417
8 57 7 2249 3,352 47 15 1918 3,283
Number of yellow and Result
(MPN/100 mL)
Result (log
MPN/100 mL)
Expert
Result
(MPN/100 mL)
Result (log
MPN/100 mL)
N
Laboratory Sample number
Reference method (*) Alternative method
Number of positive Result
(MPN/100 mL)
Result (log
MPN/100 mL)
M
Laboratory Sample number
Reference method Alternative method
Number of positive
samples per dilutionResult
(MPN/100 mL)
Result (log
MPN/100 mL)
Number of yellow and
fluorescent wells
L
Laboratory Sample number
Reference method Alternative method
Number of positive
samples per dilutionResult
(MPN/100 mL)
Result (log
MPN/100 mL)
Number of yellow and
fluorescent wellsResult
(MPN/100 mL)
Result (log
MPN/100 mL)
Laboratory Sample number
Reference method Alternative method
Number of positive
samples per dilutionResult
(MPN/100 mL)
Result (log
MPN/100 mL)
Number of yellow and
fluorescent wellsResult
(MPN/100 mL)
Result (log
MPN/100 mL)
IDEXX - Enterolert-E Summary report - v1 March 2015
Institut Scientifique d'Hygiène et d'Analyse 40/46

APPENDIX 9 ENUMERATION OF CULTURABLE MICROORGANISMS
Laboratory Culturable microorganisms at 22°C Culturable microorganisms at 36°C
A 190 180
B 142 58
C 100 75
D 27 28
E 82 29
F 75 24
G 65 47
H 105 44
J 159 146
K 119 54
L 53 25
M 64 24
N 38 27
Expert 136 53
IDEXX - Enterolert-E Summary report - v1 March 2015
Institut Scientifique d'Hygiène et d'Analyse 41/46

Number of
fluorescent
wells
MPN/100 mLlog MPN/100
mL
Number of
fluorescent
wells
MPN/100 mLlog MPN/100
mL
Number of
large
fluorescent
wells
Number of
small
fluorescent
wells
MPN/100 mLlog MPN/100
mL
Number of
large
fluorescent
wells
Number of
small
fluorescent
wells
MPN/100 mLlog MPN/100
mL1/2 1/20 MPN/100 mL
log MPN/100
mL1/2 1/20 MPN/100 mL
log MPN/100
mL
ID 4 49 1 652 3,218 47 1 298 3,113 44 4 1 054 3,023 47 13 1 785 3,252 43 6 1 188 3,075 43 1 1 049 3,021
ID 8 43 945 2,975 46 1 184 3,073 43 9 1 145 3,059 46 6 1 291 3,111 60 7 2 715 3,434 55 9 2 121 3,327
ID 11 8 87 1,940 2 20 1,301 6 1 74 1,869 8 0 86 1,934 7 0 110 2,041 7 0 110 2,041
ID 13 8 87 1,940 12 137 2,137 3 0 31 1,491 14 1 173 2,238 15 2 287 2,458 6 1 109 2,037
ID 15 3 31 1,491 6 64 1,806 11 0 122 2,086 7 1 85 1,929 2 0 30 1,477 5 0 77 1,886
ID 16 25 344 2,537 17 207 2,316 18 3 256 2,408 23 0 299 2,476 15 0 253 2,403 12 0 197 2,294
ID 17 11 124 2,093 6 64 1,806 5 4 94 1,973 7 1 85 1,929 15 0 253 2,403 14 0 234 2,369
ID 18 9 99 1,996 8 87 1,940 4 1 52 1,716 6 0 63 1,799 5 0 77 1,886 5 1 93 1,968
ID 19 17 207 2,316 20 254 2,405 17 1 216 2,334 10 0 110 2,041 11 2 212 2,326 21 0 375 2,574
ID 20 5 53 1,724 9 99 1,996 7 2 96 1,982 8 0 86 1,934 20 1 371 2,569 13 1 232 2,365
ID 21 4 42 1,623 7 75 1,875 5 0 52 1,716 8 1 97 1,987 8 0 127 2,104 10 0 161 2,207
ID 22 16 192 2,283 19 238 2,377 18 2 243 2,386 16 4 238 2,377 13 2 249 2,396 19 1 350 2,544
ID 24 3 31 1,491 1 10 1,000 4 0 41 1,613 2 0 20 1,301 2 0 30 1,477 1 0 15 1,176
ID 28 5 53 1,724 5 53 1,724 7 0 75 1,875 6 1 74 1,869 3 0 46 1,663 4 2 92 1,964
ID 29 6 64 1,806 9 99 1,996 3 0 31 1,491 6 0 63 1,799 3 2 76 1,881 9 1 160 2,204
ID 30 9 99 1,996 6 64 1,806 7 0 75 1,875 9 0 98 1,991 5 0 77 1,886 3 0 46 1,663
ID 31 9 99 1,996 6 64 1,806 3 0 31 1,491 6 1 74 1,869 5 0 77 1,886 1 0 15 1,176
ID 36 2 20 1,301 1 10 1,000 1 0 10 1,000 2 0 20 1,301 1 0 15 1,176 1 0 15 1,176
RESULTS FROM ENTEROLERT‐E VALIDATION
N°
Reference method ISO 7899‐1Quanti‐tray Quanti‐tray 2000
R1 R2 R1 R2 R1 R2
Enterolert‐E
IDEXX - Enterolert-E Summary report - v1 March 2015
Institut Scientifique d'Hygiène et d'Analyse 43/46

Sample Replicate 1 Replicate 2 M SD Sample Replicate 1 Replicate 2 M SD1 3,023 3,252 3,137 0,162 1 3,218 3,113 3,166 0,074 0,0282 3,059 3,111 3,085 0,037 2 2,975 3,073 3,024 0,069 -0,0603 1,869 1,934 1,902 0,046 3 1,940 1,301 1,620 0,451 -0,2824 1,491 2,238 1,865 0,528 4 1,940 2,137 2,038 0,139 0,1735 2,086 1,929 2,008 0,111 5 1,491 1,806 1,649 0,223 -0,3596 2,408 2,476 2,442 0,048 6 2,537 2,316 2,426 0,156 -0,0167 1,973 1,929 1,951 0,031 7 2,093 1,806 1,950 0,203 -0,0018 1,716 1,799 1,758 0,059 8 1,996 1,940 1,968 0,040 0,2109 2,334 2,041 2,188 0,207 9 2,316 2,405 2,360 0,063 0,17210 1,982 1,934 1,958 0,034 10 1,724 1,996 1,860 0,192 -0,09811 1,716 1,987 1,851 0,191 11 1,623 1,875 1,749 0,178 -0,10212 2,386 2,377 2,381 0,006 12 2,283 2,377 2,330 0,066 -0,05113 1,613 1,301 1,457 0,220 13 1,491 1,000 1,246 0,347 -0,21114 1,875 1,869 1,872 0,004 14 1,724 1,724 1,724 0,000 -0,14815 1,491 1,799 1,645 0,218 15 1,806 1,996 1,901 0,134 0,25616 1,875 1,991 1,933 0,082 16 1,996 1,806 1,901 0,134 -0,03217 1,491 1,869 1,680 0,267 17 1,996 1,806 1,901 0,134 0,22118 1,000 1,301 1,151 0,213 18 1,301 1,000 1,151 0,213 0,000
q= 18 Mx= 2,015 My= 1,998 M= -0,017n= 2 MEDx= 1,918 MEDy= 1,901 MED= -0,024
N=qn= 36 SDbx= 0,498 SDby= 0,519 BiasMEDwx = 0,097 MEDwy = 0,137
SDwx= 0,187 SDwy= 0,190rob. SDwx= 0,143 rob. SDwy= 0,203
Method choiceGMFR Est. y Dév.
3,165 0,000R= 1,015 3,111 -0,086
rob. R= 1,416 1,881 -0,260Sx= 0,509 1,842 0,196Sy= 0,529 1,991 -0,342
2,442 -0,016r= 0,942 1,932 0,018b= 1,040 Res. SEM= 0,182 1,731 0,237a= -0,097 Res. SD= 0,257 2,178 0,182
1,939 -0,0791,828 -0,079
S(b)= 0,087 p(t;b=1)= 0,648 t(b)= 0,460 2,379 -0,049S(a)= 0,186 p(t;a=0)= 0,604 t(a)= 0,523 1,418 -0,172
1,850 -0,1251,614 0,2871,913 -0,0121,650 0,251
Répétabilité 1,099 0,051r
rob. r0,523 0,5310,401 0,567
Enterococci - Comparison QT2000-QT - Logarithmic data
QT 2000 QT Difference
Méthode de référence Méthode alternative
IDEXX - Enterolert-E Summary report - v1 March 2015
Institut Scientifique d'Hygiène et d'Analyse 44/46

0,5 0,4228768074,5 4,582364739
Points correspond to the means of the two replicates for each sample
0
0,5
1
1,5
2
2,5
3
3,5
4
4,5
5
0 1 2 3 4 5
Alte
rnat
ive
met
hod
(log
NPP
/100
mL)
Reference method (log NPP/100 mL)
Relative accuracy - Enterococci - Bathing waters
IDEXX - Enterolert-E Summary report - v1 March 2015
Institut Scientifique d'Hygiène et d'Analyse 45/46
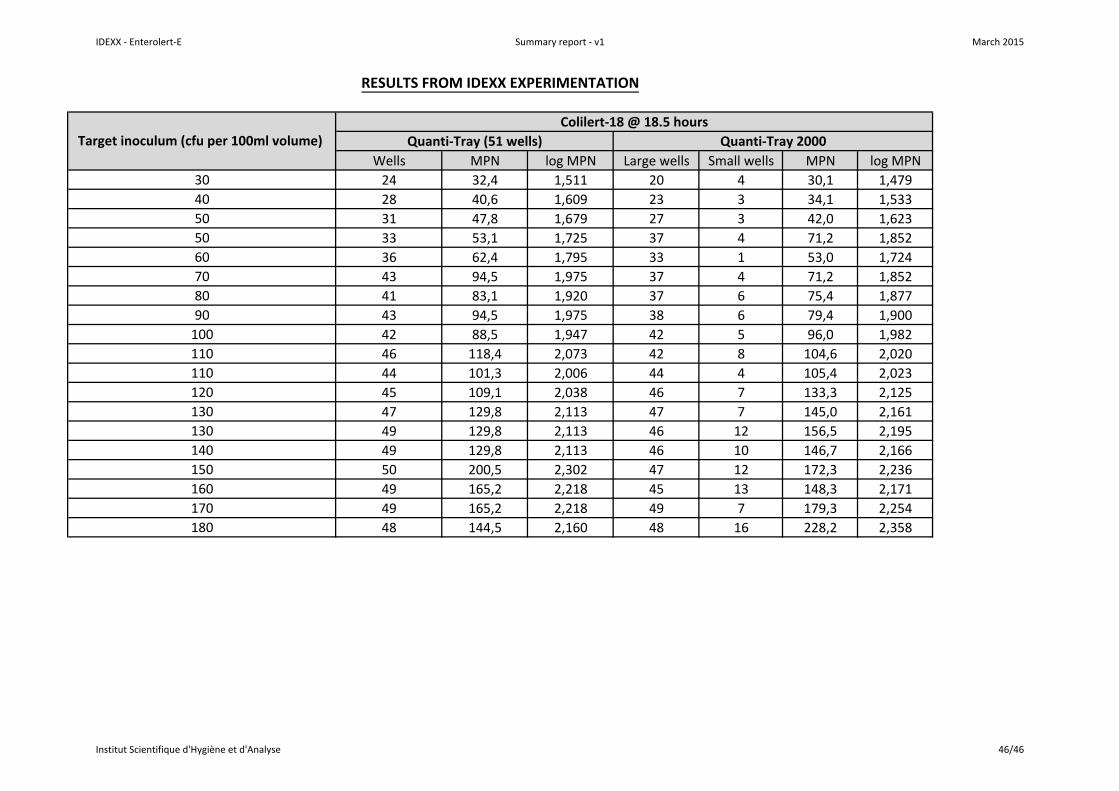
Wells MPN log MPN Large wells Small wells MPN log MPN
30 24 32,4 1,511 20 4 30,1 1,479
40 28 40,6 1,609 23 3 34,1 1,533
50 31 47,8 1,679 27 3 42,0 1,623
50 33 53,1 1,725 37 4 71,2 1,852
60 36 62,4 1,795 33 1 53,0 1,724
70 43 94,5 1,975 37 4 71,2 1,852
80 41 83,1 1,920 37 6 75,4 1,877
90 43 94,5 1,975 38 6 79,4 1,900
100 42 88,5 1,947 42 5 96,0 1,982
110 46 118,4 2,073 42 8 104,6 2,020
110 44 101,3 2,006 44 4 105,4 2,023
120 45 109,1 2,038 46 7 133,3 2,125
130 47 129,8 2,113 47 7 145,0 2,161
130 49 129,8 2,113 46 12 156,5 2,195
140 49 129,8 2,113 46 10 146,7 2,166
150 50 200,5 2,302 47 12 172,3 2,236
160 49 165,2 2,218 45 13 148,3 2,171
170 49 165,2 2,218 49 7 179,3 2,254
180 48 144,5 2,160 48 16 228,2 2,358
Target inoculum (cfu per 100ml volume)
Colilert‐18 @ 18.5 hours
Quanti‐Tray (51 wells) Quanti‐Tray 2000
RESULTS FROM IDEXX EXPERIMENTATION
IDEXX - Enterolert-E Summary report - v1 March 2015
Institut Scientifique d'Hygiène et d'Analyse 46/46


