1ANNUAL REPORT 2014
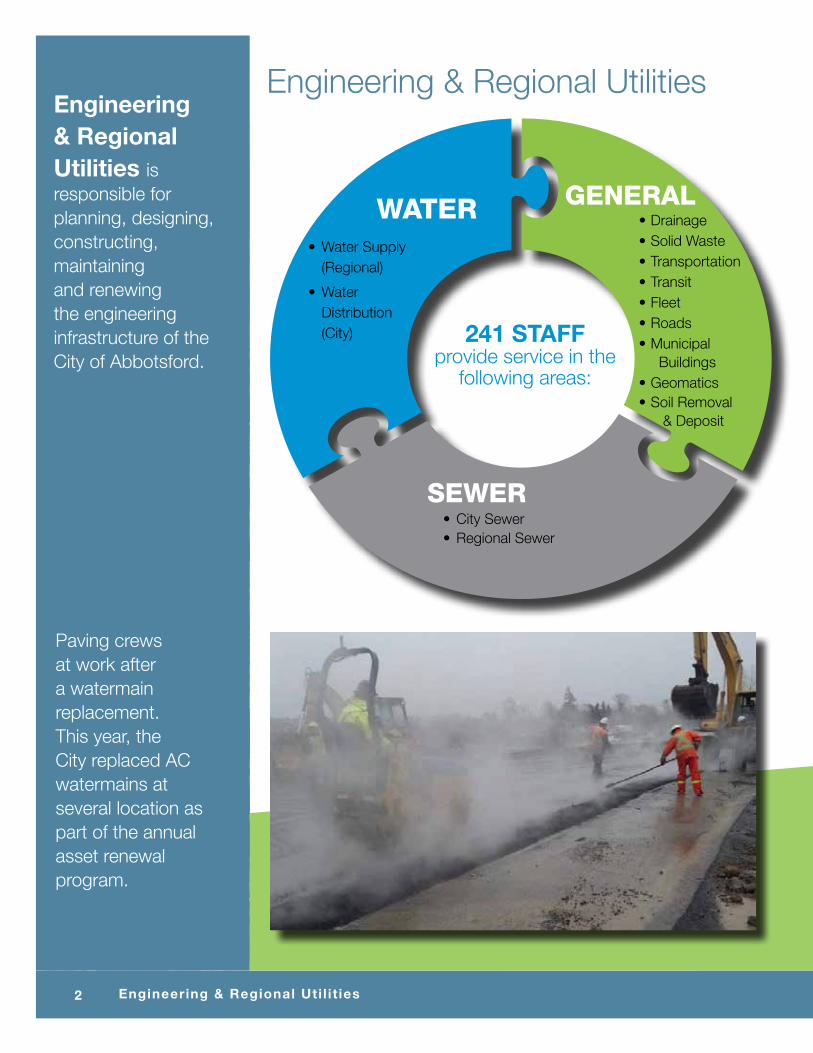
2014Engineering & Regional Utilities
ANNUAL REPORT
www.abbotsford.ca
2 Engineering & Regional Uti l i t ies
241 STAFF provide service in the
following areas:
Engineering & Regional Utilities is responsible for planning, designing, constructing, maintaining and renewing the engineering infrastructure of the City of Abbotsford.
• Drainage• Solid Waste• Transportation• Transit• Fleet• Roads• Municipal
Buildings• Geomatics• Soil Removal
& Deposit
WATER
SEWER
GENERAL
• City Sewer• Regional Sewer
• Water Supply (Regional)
• Water Distribution (City)
Engineering & Regional Utilities
Paving crews at work after a watermain replacement. This year, the City replaced AC watermains at several location as part of the annual asset renewal program.
3ANNUAL REPORT 2014
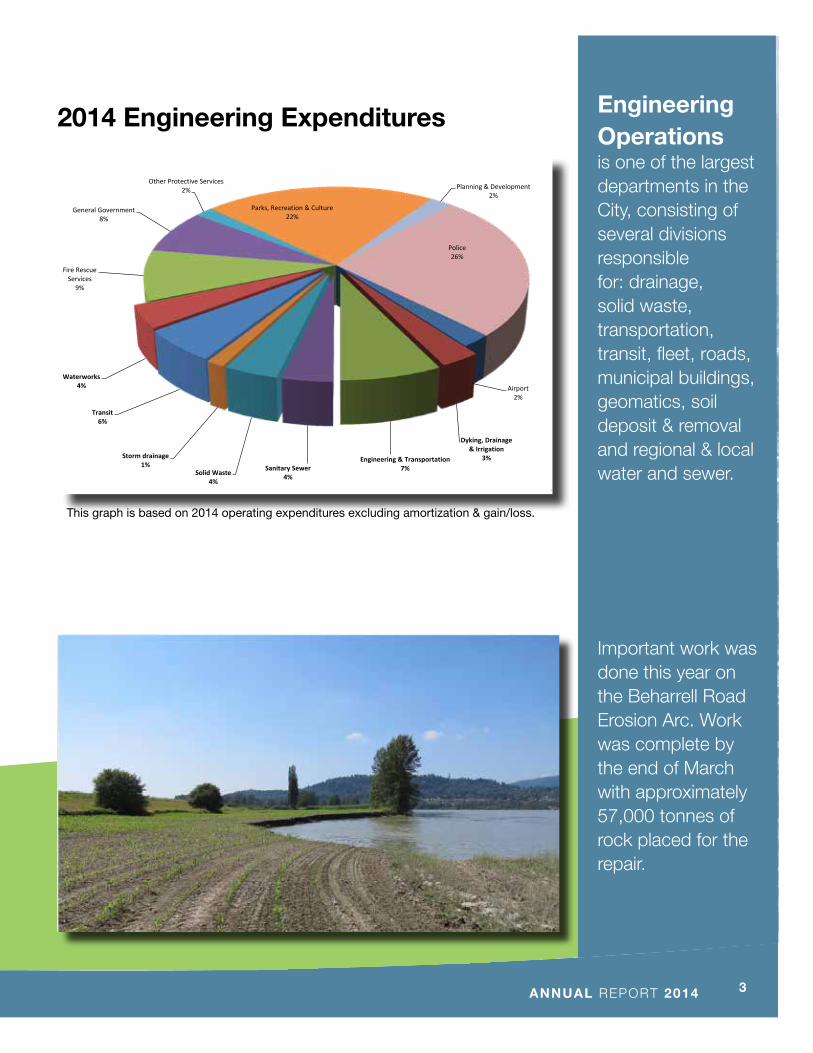
Engineering Operations is one of the largest departments in the City, consisting of several divisions responsible for: drainage, solid waste, transportation, transit, fleet, roads, municipal buildings, geomatics, soil deposit & removal and regional & local water and sewer.
• Drainage• Solid Waste• Transportation• Transit• Fleet• Roads• Municipal
Buildings• Geomatics• Soil Removal
& Deposit
2014 Engineering Expenditures
1
Airport 2%
Dyking, Drainage & Irrigation
3% Engineering & Transportation 7% Sanitary Sewer
4% Solid Waste 4%
Storm drainage 1%
Transit 6%
Waterworks 4%
Fire Rescue Services
9%
General Government 8%
Other Protective Services 2%
Parks, Recreation & Culture 22%
Planning & Development 2%
Police 26%
Municipal Services Expenditures
This graph is based on 2014 operating expenditures excluding amortization & gain/loss.
Important work was done this year on the Beharrell Road Erosion Arc. Work was complete by the end of March with approximately 57,000 tonnes of rock placed for the repair.

4 Engineering & Regional Uti l i t ies
Ñ
Key Issues & Trends• City-Wide Master Plan to set capital upgrade
priorities• Complete remaining ISMPs• Fraser River Bank Erosion Issue• Condition assessment and asset replacement
The Drainage Division is responsible for collecting and conveying storm water runoff from roads, private and other public properties through pipes, ditches and creeks by gravity.
They also operate and maintain storm water pump stations and dykes and provide irrigation services to Matsqui and Sumas Prairies.
550kilometres of gravity mains
20,000associatedstructures
11,000catch basins
380storm
detention systems
535kilometers of
ditches
176kilometres of
creeks
33kilometres of
dykes
15storm pump
stations
98irrigation control
structures & wiers
Drainage
Ñ
Looking Ahead to 2015...• Work with senior governments for funding for
correcting the Fraser River Bank Erosion issue
• Continue Clayburn Creek improvements
• Initiate Upland Culvert Replacement Program

5ANNUAL REPORT 2014
ÑSolid Waste
Key Issues & Trends• Tonnages on all three waste streams
(garbage, recycling and compost) are up
• Diversion rate increased from 43% in 2012 to 67% in 2013. The 2014 rate is 66%
• The City applied to MMBC to participate in its program but have not been accepted due to a funding shortfall
• Collection costs on the west side have increased
The Solid Waste Division is responsible for garbage, compostables and recycling from single family residents and management of waste diversion programs
West side curbside collection
Abbotsford Mission Recycling
Depot
Expansion of composting
program to ICI
East side curbside collection
Gladwin Road composting
facility
Looking Ahead to 2015.... • Implementation of ICI food sector compostables
program
• Resolution of PPP recycling issues with MMBC
• Termination of contract with the Matsqui Transfer Station
• Review of collection services options
40%
50%
60%
70%
80%
90%
100%
0
2,000
4,000
6,000
8,000
10,000
12,000
14,000
2012 2013 2014
Tonnages and Diversion Rates
Garbage Recycling Compostables Diversion
6 Engineering & Regional Uti l i t ies
Ñ
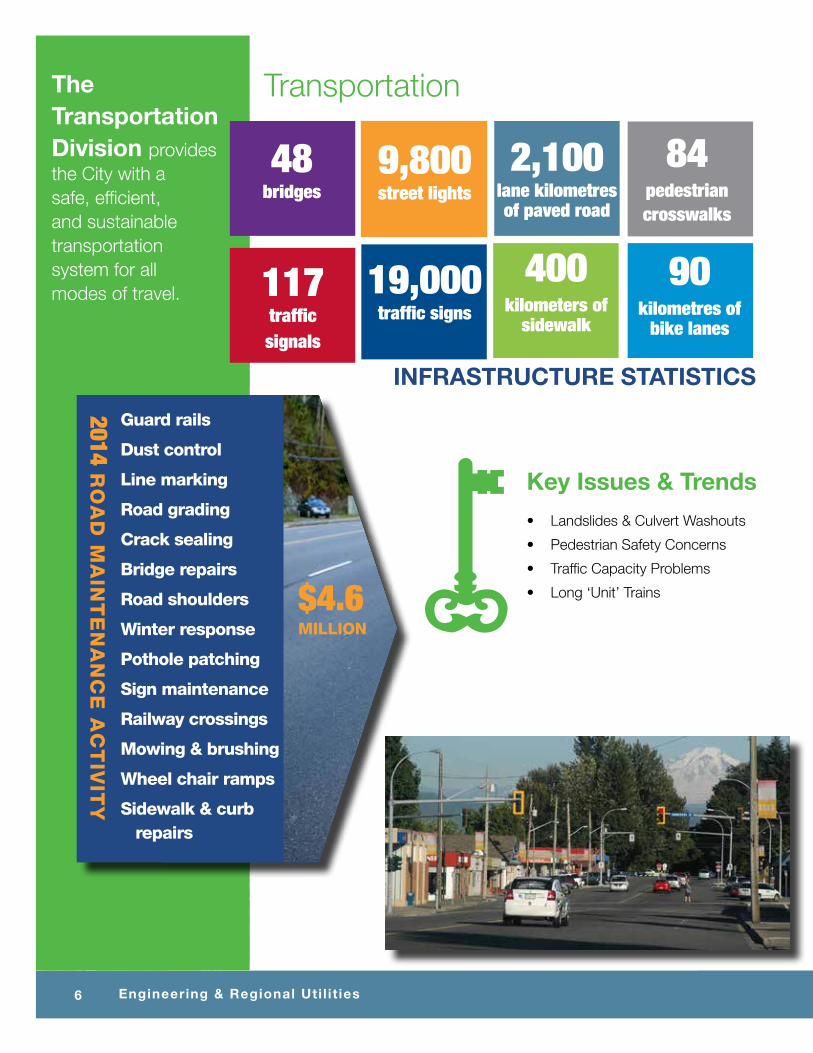
The Transportation Division provides the City with a safe, efficient, and sustainable transportation system for all modes of travel.
Transportation
Key Issues & Trends
• Landslides & Culvert Washouts
• Pedestrian Safety Concerns
• Traffic Capacity Problems
• Long ‘Unit’ Trains
Guard rails
Dust control
Line marking
Road grading
Crack sealing
Bridge repairs
Road shoulders
Winter response
Pothole patching
Sign maintenance
Railway crossings
Mowing & brushing
Wheel chair ramps
Sidewalk & curb repairs
$4.6MILLION
2014 R
OA
D M
AIN
TE
NA
NC
E A
CT
IVIT
Y
9,800street lights
2,100lane kilometres of paved road
84pedestrian crosswalks
19,000traffic signs
400kilometers of
sidewalk
90kilometres of
bike lanes
48bridges
117trafficsignals
Ñ
INFRASTRUCTURE STATISTICS
7ANNUAL REPORT 2014
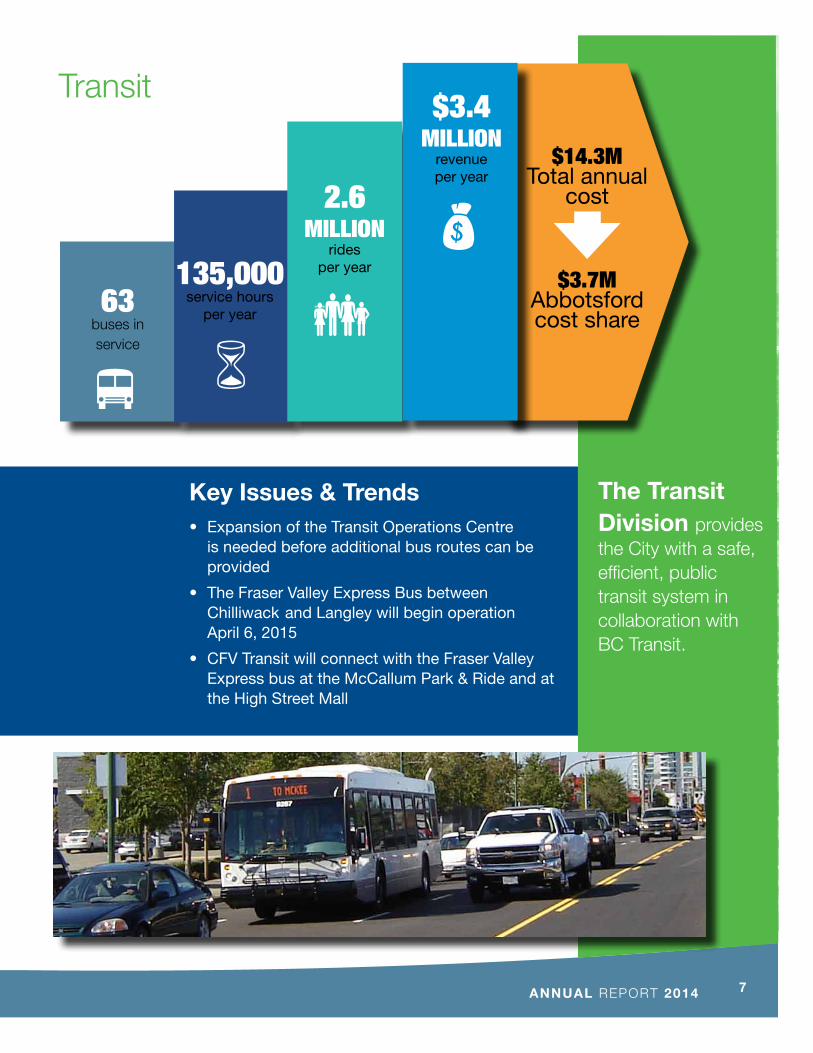
Transportation Transit
Key Issues & Trends• Expansion of the Transit Operations Centre is needed before additional bus routes can be provided
• The Fraser Valley Express Bus between Chilliwack and Langley will begin operation April 6, 2015
• CFV Transit will connect with the Fraser Valley Express bus at the McCallum Park & Ride and at the High Street Mall
63buses in service
135,000service hours
per year
2.6MILLION
ridesper year
$14.3M Total annual
cost
$3.7M Abbotsford cost share
$3.4MILLION
revenue per year
�
�6v
Ñ
The Transit Division provides the City with a safe, efficient, public transit system in collaboration with BC Transit.
8 Engineering & Regional Uti l i t ies
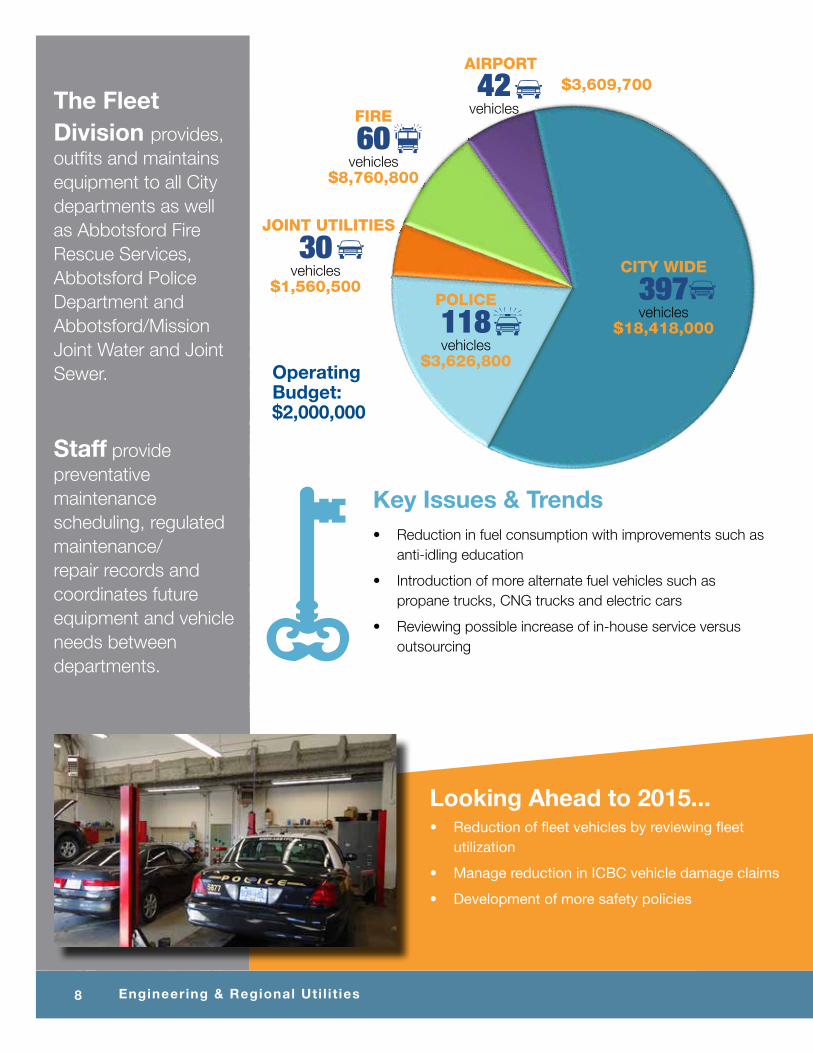
The Fleet Division provides, outfits and maintains equipment to all City departments as well as Abbotsford Fire Rescue Services, Abbotsford Police Department and Abbotsford/Mission Joint Water and Joint Sewer.
f
118vehicles
$3,626,800
POLICE 397vehicles
$18,418,000
CITY WIDE
Staff provide preventative maintenance scheduling, regulated maintenance/repair records and coordinates future equipment and vehicle needs betweendepartments.
Looking Ahead to 2015...• Reduction of fleet vehicles by reviewing fleet
utilization
• Manage reduction in ICBC vehicle damage claims
• Development of more safety policies
Ñ
� pÑ
Key Issues & Trends• Reduction in fuel consumption with improvements such as
anti-idling education
• Introduction of more alternate fuel vehicles such as propane trucks, CNG trucks and electric cars
• Reviewing possible increase of in-house service versus outsourcing
42vehicles
$3,609,700AIRPORT
60vehicles
$8,760,800
FIRE
30vehicles
$1,560,500
JOINT UTILITIES
�
Operating Budget: $2,000,000
�
9ANNUAL REPORT 2014
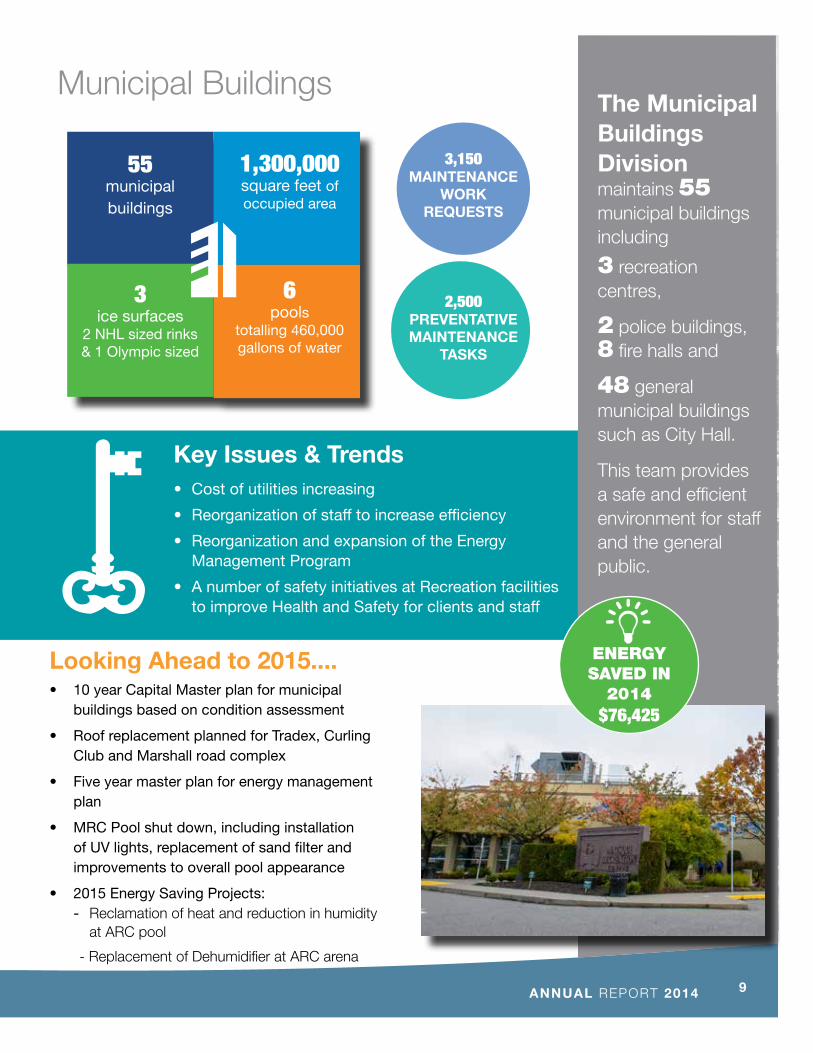
Municipal BuildingsThe Municipal BuildingsDivision maintains 55 municipal buildings including
3 recreation centres,
2 police buildings, 8 fire halls and
48 general municipal buildings such as City Hall.
This team provides a safe and efficient environment for staff and the general public.Ñ
Key Issues & Trends• Cost of utilities increasing
• Reorganization of staff to increase efficiency
• Reorganization and expansion of the Energy Management Program
• A number of safety initiatives at Recreation facilities to improve Health and Safety for clients and staff
Looking Ahead to 2015.... • 10 year Capital Master plan for municipal
buildings based on condition assessment
• Roof replacement planned for Tradex, Curling Club and Marshall road complex
• Five year master plan for energy management plan
• MRC Pool shut down, including installation of UV lights, replacement of sand filter and improvements to overall pool appearance
• 2015 Energy Saving Projects: - Reclamation of heat and reduction in humidity at ARC pool
- Replacement of Dehumidifier at ARC arena
55 municipal buildings
1,300,000 square feet of occupied area
3 ice surfaces
2 NHL sized rinks & 1 Olympic sized
6 pools
totalling 460,000 gallons of water
ENERGY SAVED IN
2014$76,425
2,500PREVENTATIVE MAINTENANCE
TASKS
3,150MAINTENANCE
WORK REQUESTS
10 Engineering & Regional Uti l i t iesÑ
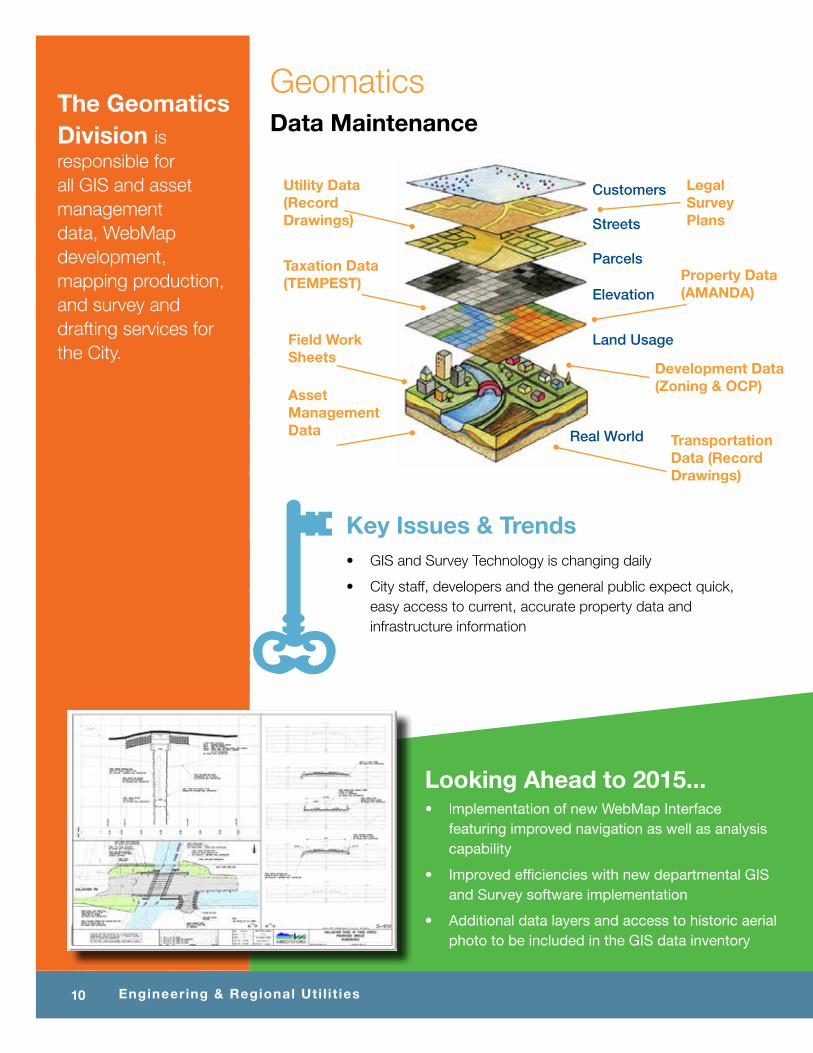
GeomaticsThe Geomatics Division is responsible for all GIS and asset management data, WebMap development, mapping production, and survey and drafting services for the City.
Looking Ahead to 2015...• Implementation of new WebMap Interface
featuring improved navigation as well as analysis capability
• Improved efficiencies with new departmental GIS and Survey software implementation
• Additional data layers and access to historic aerial photo to be included in the GIS data inventory
ÑKey Issues & Trends• GIS and Survey Technology is changing daily
• City staff, developers and the general public expect quick, easy access to current, accurate property data and infrastructure information
Customers
Streets
Parcels
Elevation
Land Usage
Real World
Asset ManagementData
Field Work Sheets
Taxation Data(TEMPEST)
Utility Data (Record Drawings)
Data Maintenance
Legal Survey Plans
Property Data(AMANDA)
Development Data(Zoning & OCP)
Transportation Data (Record Drawings)
11ANNUAL REPORT 2014
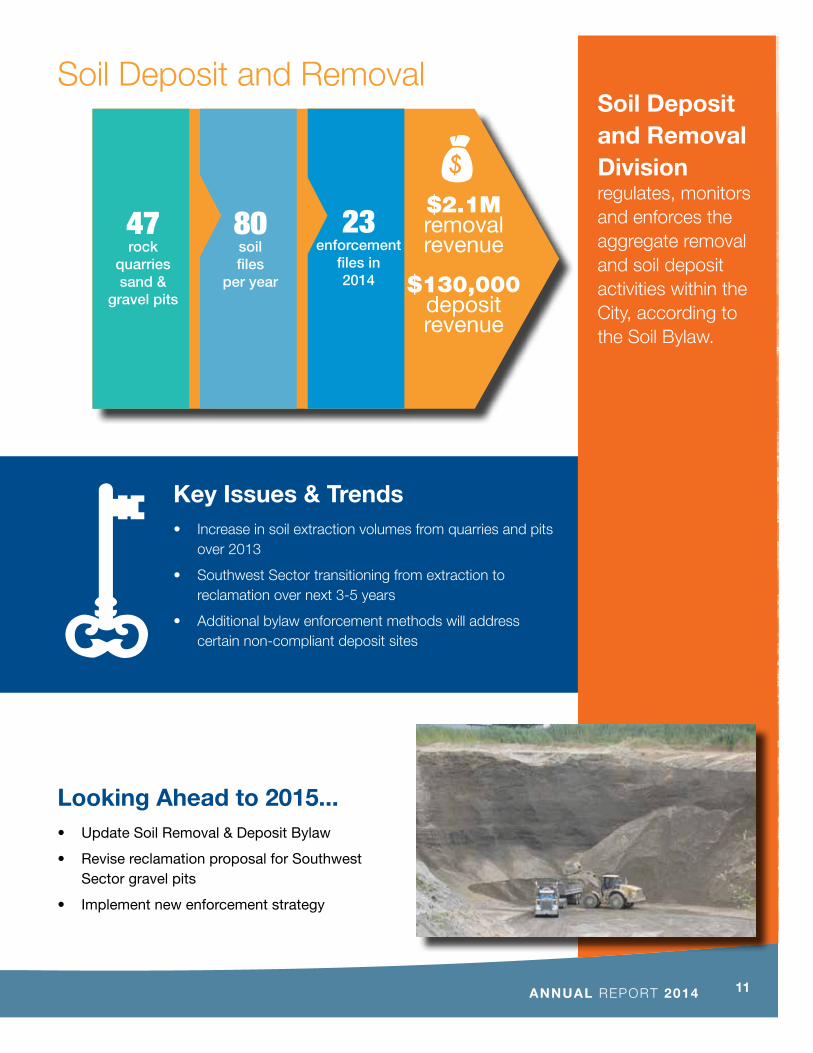
ÑSoil Deposit and Removal
Soil Deposit and Removal Division regulates, monitors and enforces the aggregate removal and soil deposit activities within the City, according to the Soil Bylaw.
Key Issues & Trends• Increase in soil extraction volumes from quarries and pits
over 2013
• Southwest Sector transitioning from extraction to reclamation over next 3-5 years
• Additional bylaw enforcement methods will address certain non-compliant deposit sites
Looking Ahead to 2015...• Update Soil Removal & Deposit Bylaw
• Revise reclamation proposal for Southwest Sector gravel pits
• Implement new enforcement strategy
47rock
quarriessand &
gravel pits
$2.1M removalrevenue
$130,000 deposit revenue
80soilfiles
per year
23enforcement
files in 2014
�
12 Engineering & Regional Uti l i t ies
Ñ
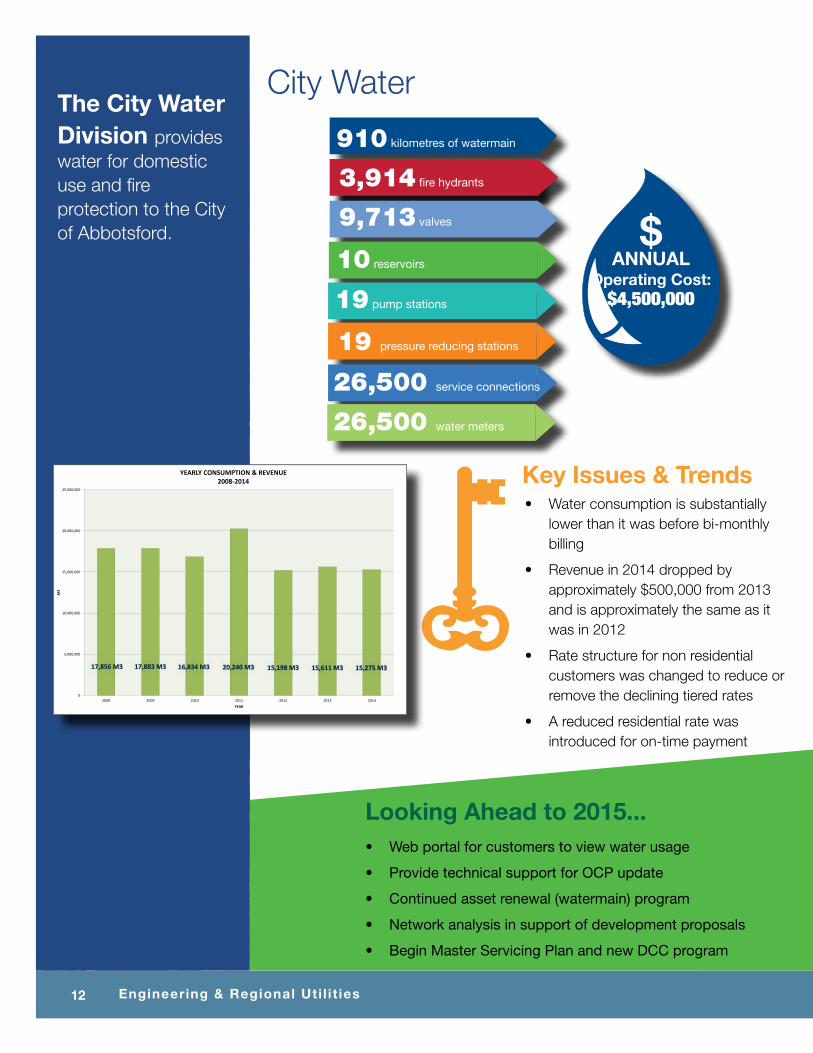
The City Water Division provides water for domestic use and fire protection to the City of Abbotsford.
Key Issues & Trends
Looking Ahead to 2015...• Web portal for customers to view water usage
• Provide technical support for OCP update
• Continued asset renewal (watermain) program
• Network analysis in support of development proposals
• Begin Master Servicing Plan and new DCC program
City Water
910 kilometres of watermain
3,914 fire hydrants
9,713 valves
10 reservoirs
19 pump stations
19 pressure reducing stations
26,500 water meters
0
5,000,000
10,000,000
15,000,000
20,000,000
25,000,000
2008 2009 2010 2011 2012 2013 2014
M3
YEAR
YEARLY CONSUMPTION & REVENUE 2008-2014
M3
$ANNUAL
Operating Cost: $4,500,000
• Water consumption is substantially lower than it was before bi-monthly billing
• Revenue in 2014 dropped by approximately $500,000 from 2013 and is approximately the same as it was in 2012
• Rate structure for non residential customers was changed to reduce or remove the declining tiered rates
• A reduced residential rate was introduced for on-time payment
Ñ
26,500 service connections
13ANNUAL REPORT 2014
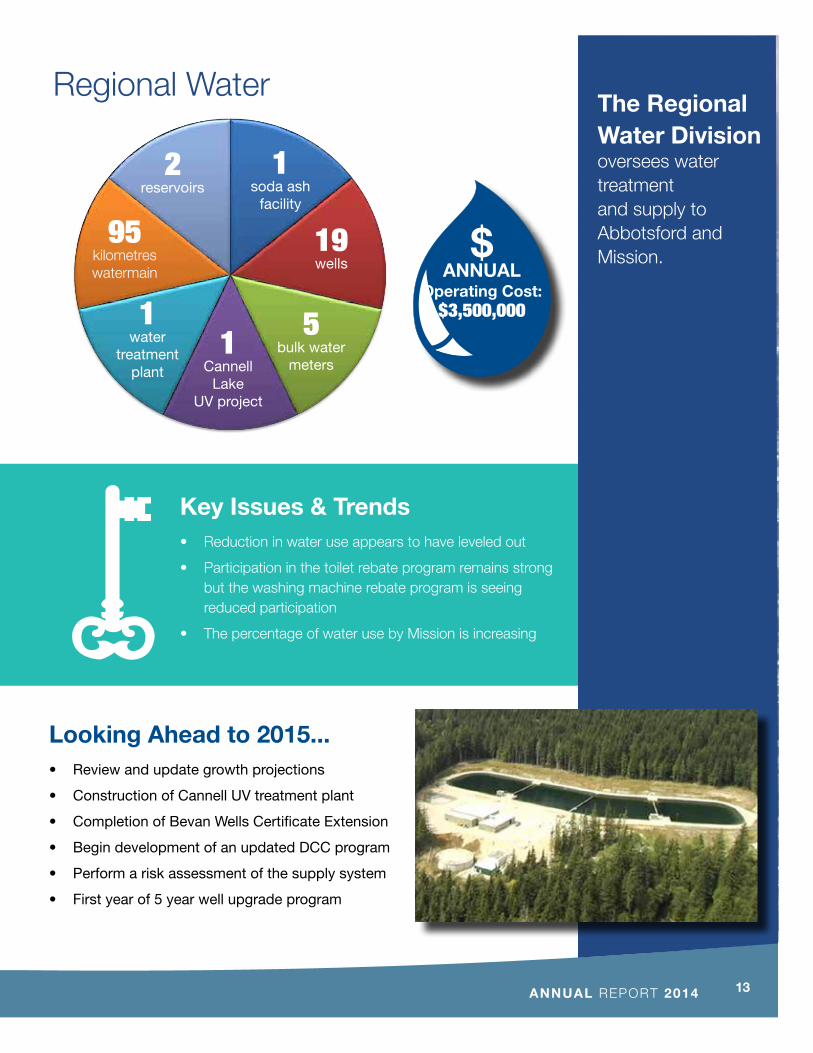
Regional WaterThe Regional Water Division oversees water treatment and supply to Abbotsford and Mission.
Looking Ahead to 2015...• Review and update growth projections
• Construction of Cannell UV treatment plant
• Completion of Bevan Wells Certificate Extension
• Begin development of an updated DCC program
• Perform a risk assessment of the supply system
• First year of 5 year well upgrade program
Ñ2
reservoirs1
soda ash facility
1water
treatmentplant
95kilometreswatermain
19wells
5bulk water
meters1
Cannell Lake
UV project
$ANNUAL
Operating Cost: $3,500,000
Key Issues & Trends• Reduction in water use appears to have leveled out
• Participation in the toilet rebate program remains strong but the washing machine rebate program is seeing reduced participation
• The percentage of water use by Mission is increasing
14 Engineering & Regional Uti l i t ies
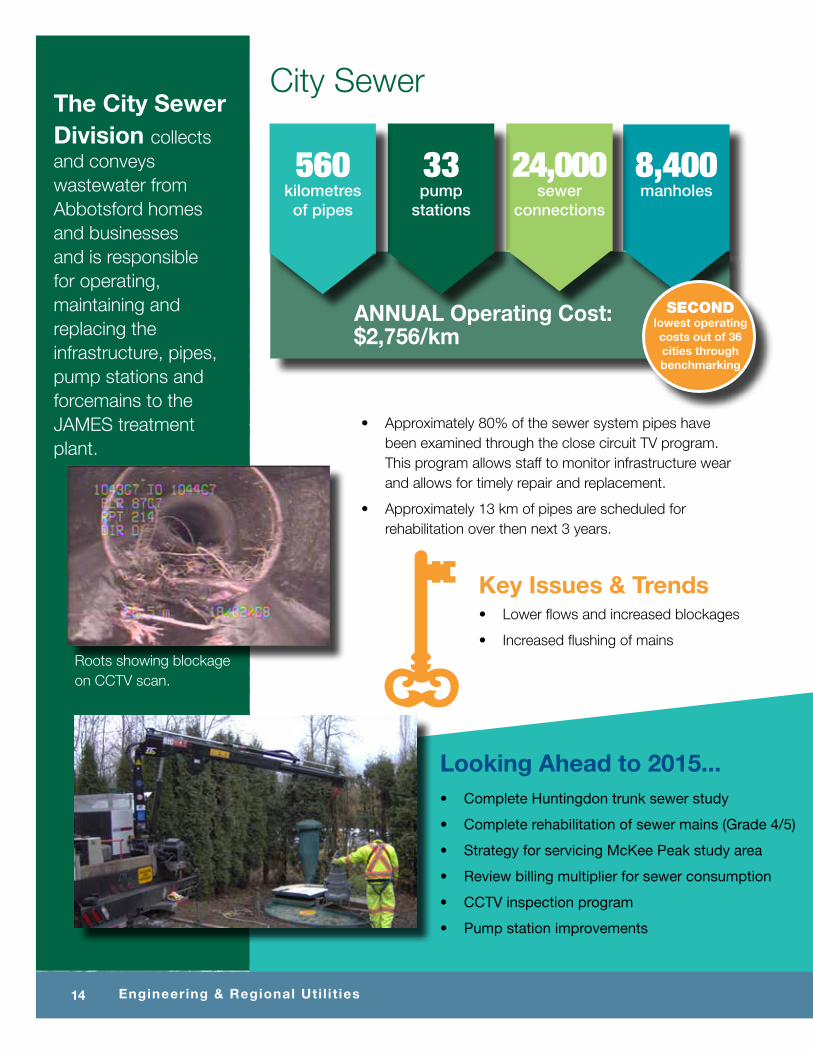
City SewerThe City Sewer Division collects and conveys wastewater from Abbotsford homes and businesses and is responsible for operating, maintaining and replacing the infrastructure, pipes, pump stations and forcemains to the JAMES treatment plant.
Key Issues & Trends• Lower flows and increased blockages
• Increased flushing of mains
• Approximately 80% of the sewer system pipes have been examined through the close circuit TV program. This program allows staff to monitor infrastructure wear and allows for timely repair and replacement.
• Approximately 13 km of pipes are scheduled for rehabilitation over then next 3 years.
8,400manholes
24,000sewer
connections
33pump
stations
560kilometres of pipes
ANNUAL Operating Cost: $2,756/km
SECOND lowest operating costs out of 36 cities through benchmarking
Looking Ahead to 2015...• Complete Huntingdon trunk sewer study
• Complete rehabilitation of sewer mains (Grade 4/5)
• Strategy for servicing McKee Peak study area
• Review billing multiplier for sewer consumption
• CCTV inspection program
• Pump station improvements
Roots showing blockage on CCTV scan. ÑÑ

15ANNUAL REPORT 2014
Regional SewerThe Regional Sewer Division provides secondary wastewater treatment services to the urban areas of Abbotsford, Mission and Sumas in Washington, US to meet the Provincial and Federal regulations.
Key Issues & Trends• Lower flows and increased blockages
• Increased flushing of mains
Looking Ahead to 2015...• UV Disinfection Project (Eligible for SPF)
• Asset Repairs/ Replacements:- Complete inspection and repairs of Digester #2- Cleaning and Repair of Digester #3- Repairs to Concrete Tanks and Channels- TF#1 Media Replacement (one cell)
Ñ
Key Issues & Trends• Beneficial use of Biosolids
• Reduced flows to the JAMES Plant
• Increased trend to move away from chlorination for disinfection and towards technologies such as UV
48,000 m3/dAVERAGEannual
flow
5-10 mg/L average15 mg/L max day
EFFLUENTBOD
EFFLUENTTSS
10-15 mg/L average22 mg/L max day
$1.4MILLION
of revenue
30 extra strength industries =
ANNUAL PRODUCTION
7,000 wet tonnesof biosolids
City of Abbotsford32315 South Fraser WayAbbotsford BC V2T 1W7
604-853-5514
www.abbotsford.ca


