
Universiteit Hasselt | Campus Hasselt | Martelarenlaan 42 | BE-3500 Hasselt
Universiteit Hasselt | Campus Diepenbeek | Agoralaan Gebouw D | BE-3590 Diepenbeek
2014•2015SCHOOL FOR TRANSPORTATION SCIENCESMaster of Transportation Sciences
Master's thesisMicro-Simulation of Car Drivers' Movements at Parking Lots
Supervisor :Prof. dr. Gerhard WETS
Thi Thuy An Vo Thesis presented in fulfillment of the requirements for the degree of Master ofTransportation Sciences

2014•2015SCHOOL FOR TRANSPORTATIONSCIENCESMaster of Transportation Sciences
Master's thesisMicro-Simulation of Car Drivers' Movements at ParkingLots
Supervisor :Prof. dr. Gerhard WETS
Thi Thuy An Vo Thesis presented in fulfillment of the requirements for the degree of Master ofTransportation Sciences


Micro-Simulation of Car Drivers' Movements at Parking Lots Thi Thuy An Voa, Van der Waerden Peterb, Wets Geertc
a Master of Transportation Sciences, School of Transportation
The Transportation Research Institute (IMOB), Hasselt University
Agoralaan gebouw D| BE3590 Diepenbeek
Tel. +32-11-268111
Email: [email protected]
b Doctor, Practice Assistant at School for Transportation Sciences
The Transportation Research Institute (IMOB), Hasselt University
Agoralaan gebouw D| BE3590 Diepenbeek
Tel. +32-11-269111
Email: [email protected]
c Director of The Transportation Research Institute (IMOB), School of Transportation
Hasselt University
Agoralaan gebouw D| BE3590 Diepenbeek
Tel. +32-11-269158
Email: [email protected]
Submission date: June 2nd 2015
Number of Words: 8888
Number of figures: 5
Number of tables: 2

Thi Thuy An, Vo
ABSTRACT
Driver behavior is the major cause of many problems at the parking facilities, i.e., congestion,
unsafety, and negative environmental effects. Micro-simulation can help to understand drivers’
movements and its effects to parking management. This study aims to develop a multi-agent-based
simulation tool to demonstrate its capability on studying drivers’ movements at a parking lot. The
application was constructed using Netlogo and insights from literatures. Results from a case study
using a specific parking lot in the city of Eindhoven, the Netherlands will be presented to validate
the result of the simulation tool.
The developed-simulation tool allows to adjust the features of the parking facilities, i.e.,
number of preoccupied parking spaces, maximum parking duration, rate of car entering the parking
lot, and the speed limit inside the parking lot. Drivers’ characteristics that influence the choice of
parking space, i.e., gender, car size, and ticket payment can also be adjusted. Vehicle travel time
and parking occupancy indicators were integrated to measure the efficiency of the parking lot.
The results of this study contribute a profound development in using NetLogo to simulate
car drivers’ parking behavior. Simulation results from the case study suggest that the limits of speed
and parking duration are the countermeasures to parking efficiency.
Highlights
Developing a flexible multi-agent-based modeling tool for simulating drivers’ movements
at the parking lot.
Parking lot features and car drivers’ characteristics are adjustable towards users’
expectation.
Efficient parking indicators i.e., the vehicle travel time and parking occupancy can be
measured.
Increasing the speed limit decreases the vehicle travel time but increases the parking
occupancy.
Increasing the maximum parking duration increases both the vehicle travel time and the
parking occupancy.
Key words: The developed-simulation tool, car driver’s movements, parking lot, NetLogo

Thi Thuy An Vo 1
1. INTRODUCTION
A parking facility is an important element in a transportation system, especially when the number
of car owners is increasing. Because the increasing number of car owners leads to the incremental
demand of parking facilities. Congestion, environmental problems e.g., emission, noise, etc. are
also surging as consequences of drivers’ driving for parking (Arnott & Rowse, 1999). According
to Federal Highway Administration, parking-related accidents accounted for 49% of all midblock
crashes along major streets, 68% and 72% along collector streets, and local streets respectively
(Humphreys, Box, Sullivan & Wheeler, 1978). Additionally, when the demand of parking could
not be satisfied, the parking shortages can create poor accessibility reputations for cities which
might decrease the attractiveness to shoppers, tourists, and commuters.
In order to satisfy the parking demand, constructing new parking facilities is one of the
possible choices of many transportation experts, and policy makers. Nevertheless, it is not always
sufficient, especially in the cases of scared money, human, time, and land resources. Another
solution that may be applied to meet the demand of parking, is optimization of parking facility
usage. This approach seems to be more sufficient, and efficient since it consumes less money,
human, and time resources, as well as land area saving. When optimizing the use of a parking
facility, a suitable and an efficient layout for a parking area should be considered as one of the
initial criteria because of many reasons. Firstly, the appropriate layout not only maximizes the
number of parking spaces but also enables the efficient flow of vehicles in the parking lot (Young,
1986). Secondly, the sufficient layout might affect the parking lot decisions, means of
transportation use, or even the destinations such as the shopping, or leisure centers. Thirdly, the
good parking layout can meet the demand of increasing parking. Fourthly, the sufficient layout
may increase the attraction for cities which may lead to have more business coming to cities and
workplaces. Fifthly, it also helps to reduce the congestion, emission, noises, and time lost. Finally,
the insufficient layout causes traffic accidents for motorists or damages of vehicles (Stover &
Koepke, 2002). Hence, the sufficient parking layout is responsible for satisfaction of the parking
demand.
Getting a sufficient and an appropriate design or layout for a parking lot is not an easy task.
Designers are required to apprehend the drivers’ behaviors or movements at the parking lot since
drivers’ behaviors play a key role in travel demand management strategies (Van der Waerden,
Timmermans & Rodrigue da Silva 2014). Micro-simulation is widely considered as a method that
studies the drivers’ behaviors. For example, Bonsall and Palmer used PARKIT parking choice
simulator to model car parking behaviors of drivers (Bonsall & Palmer, 2004). Another application
of micro-simulation is PARKAGENT. It is an agent-based model that was used to simulate the
drivers’ parking behaviors in Tel Aviv city (Benenson, Martens, & Birfir, 2008).
Among various micro-simulation programs, the multi-agent-based modeling simulation
NetLogo has shown its advantages for behavior simulation. This program allows researchers to
investigate the connection between micro-level behaviors of individuals and macro-level patterns
coming from their interactions. Although NetLogo is quite popular in other fields, it has not been
popularly utilized in transportation field yet (Sklar, 2007). Because of its advantages (e.g., it is an
open-source software, and quite simple but powerful, and users can create their own models) it has
become a promising method for transportation researchers. As to the transportation area, there are
some researches which applied NetLogo to develop micro-simulation models. Wilensky (1998)
applied NetLogo to simulate the traffic at an intersection. Another application of NetLogo is to

Thi Thuy An Vo 2
develop a model to control the traffic lights in a real-time traffic simulation (Wilensky & Stroup,
1999). Hjorth (2010) implemented NetLogo to test the congestion charging as a policy.
However, most of the studies focus on simulating the behaviors of the whole parking
process, or the choice of parking facility but not the movement at the parking lot. Based on the
current parking problems, and the advantages of Netlogo, there is still need for further studies on
application of NetLogo in drivers’ movement simulation at the parking lot. Therefore, this study
aims to develop a micro-simulation program for car drivers’ movements at the parking lot using
NetLogo platform. The developed-tool will be validated with a case study using Van der Waerden
Borgers & Timmermans’ data (2003).
2. OBJECTIVES AND RESEARCH QUESTIONS
The study is designed to develop a multi-agent-based simulation tool for car drivers’ movements
at the parking lot by using NetLogo platform. The case study from the city of Eindhoven was
replicated to illustrate the simulation capability of the developed-simulation tool. Some potential
applications were proposed based on the findings of this study.
In order to reach these objectives, two questions were answered during this study. Firstly,
whether the developed-simulation tool can replicate car drivers’ movement at the parking lot or
not? Secondly, whether the developed-simulation tool can measure parking effectiveness or not?
3. LITERATURE REVIEW
3.1 Factors influencing car drivers’ movement
Various aspects of parking behaviors have been considered in literatures. These behaviors are
different from the beginning to the end of the parking process. The driver usually goes through four
steps i.e., choice of parking, searching for a parking facility, parking movement, and duration of
parking. (1) The first step of this process is a choice of parking. Particularly, the driver chooses
between off-street or on-street facilities for parking, as well as chooses between free or paid parking
places. If the driver decides to park at the off-street parking facility, he/she needs to choose a
parking lot or a garage. (2) After deciding the parking facility, the driver continues to search for a
parking location matched the chosen facility. (3) The next step of this parking process is the
movement at the chosen parking lot/garage. This step includes two sub activities, namely route
choice for parking strip, and space. Specifically, the driver makes a route decision which leads to
a chosen parking strip. When the driver is at the parking strip, he/she chooses a space in which
his/her car will be parked. (4) Finally, the driver decides parking duration. The decision of each
step of this process will be affected by many factors. The two first steps of this process are meso-
scales while the others are micro-scales. The driver’s behavior varies on each step.
Correspondingly, the influenced factors of these steps are also different. However, this research
only focuses on the driver’ movements at the parking lot or the micro-scale. Hence, only
information related to parking movements is considered. In other words, the route choice for
parking strip, and choice for parking space are deliberated.
Route choice for parking strip
Route choice for the parking strip indicates the decision of route leading the driver to the desired
parking strip. This process is not simple and it has the same procedure as the parking search model

Thi Thuy An Vo 3
of Thompson & Richardson (1998). However, instead of evaluating the parking facility, the driver
will evaluate the parking strip to choose for parking. The process of route choice is created based
on the modification of the parking search. This process includes a number of steps, and is initiated
when the first search begins. First, the driver starts to search desired parking strip. Then, the driver
evaluates the parking strip to have the information for the next step. In order to evaluate the parking
strip, the driver assess attractiveness of the parking strip by comparing between satisfying levels
associated to the current parking lot with his/ her expectations associated to other known parking
strips. After evaluating, the driver makes a decision to accept this parking strip or not.
If the driver feels satisfied to the parking strip, she/he accepts this parking strip. When this
parking strip is accepted and parking spaces are still available, the driver parks her/his car.
However, the driver may not accept to park at available spaces when he/she does not feel
satisfied (the factors influence the decision of parking space will be discussed later). In this
situation, the driver moves to find another free space or moves to another parking strip. In
case of no available parking spaces at this parking strip, the driver can decide to wait for a
free space. Besides, the driver can make an adaptive choice by leaving this parking strip. If
the driver decides to wait for a free space at this current parking strip, she/he starts to re-
evaluate this parking strip again to make a decision of accepting this parking strip or not.
The same activities will be replicated for the next following steps. If the driver does not accept this parking strip, she/he determines a new route and drives to
the next parking strip. Then, the evaluating process of the new parking strip will be started
as the same procedure to the previous parking strip.
This process is complex because each activity of the whole process is influenced by many
factors. Firstly, the searching activity may be affected by the distance between the parking strip
and the final destination. In other words, the driver prefers to park as close as possible to the final
destinations, or to minimize the total travel costs. Secondly, the attractiveness affects the evaluation
of parking strip activity. Its attractiveness is affected by three factors i.e., driver’s perception, the
parking strip characteristics, and parking strip’s disutility (Thompson & Richardson, 1998). [1]
The driver’s perception includes initial perception made from the previous strips. In addition, the
driver’s perception is made during this current strip based on the departure of vehicles at this
parking place. [2] The parking strip’s characteristics contain the capacity, fee rate, and parking
duration limit. [3] The final factor is parking strip’s disutility which includes three cost dimensions,
namely access, native, and waiting costs.
Access cost occurs when the driver travels to a parking strip. The access cost includes the
in-vehicle travel time from the driver’s vehicle current location at the car park. Besides,
this cost also considers the searching time for the parking space at the parking strip. The
searching parking time is the travel time of a vehicle to find a space at the parking strip.
Native (usage) is associated with a parking facility, including the monetary cost of the direct
fee and expected fine as well as the egress time (i.e., walking travel time from the car park
to the final destination). Particularly, the egress or walking time is the time taken to travel
from a parking strip to the final destination. And the fee paid for parking is estimated by
multiplying the fee rate by the intended parking duration, if payment is required. If the fee
is legally payable, but it is not mandatory (e.g., on-street parking meters), the decision of
whether or not to pay the fee involves consideration of the expected fine. The expected fine
is estimated by considering the type of infringement (non-payment, exceeding the specified
duration time limit) and the level of enforcement.

Thi Thuy An Vo 4
Waiting cost only occurs when the driver waits in queue at a parking facility before entering
this car park. And this cost is dependent on the vehicle’s current location with respect to
the parking strip being considered.
Thirdly, many researches have shown that the route choice process is affected by many
factors. The information provided by Parking Guidance Information signs and the queuing time at
parking space will influence on this process (Bonsall & Palmer, 2004). Additionally, the travel
time of the route and the walking time from the parking strip to the desired destination have effects
on this decision (Bonsall & Palmer, 2004; Young &Thompson, 1987; Young, 1986). Similar to the
route choice for parking facilities, the route choice for parking strip may be addressed in
conjunction with the route choice for parking space. Particularly, the number available parking
strips and the number of drivers searching for parking strips will influence the parking search of
the driver (Benenson et al., 2008). Hence, the parking strip search will be influenced by the number
of available parking spaces of the strip and the number of the drivers searching for this parking
strip.
Choice for parking space
The driver makes a decision of parking space when he/she is at a parking strip. Similar to route
choice of the parking strip, there are many factors which impact on the choice for the parking space.
The first factor is the distance between the location of the parking space and the final destination.
Again, the driver tends to choose the parking space which is closest to the final destination (Young,
1986). Furthermore, the distance between the parking space and the ticket machine also influences
the choice of parking space (Van der Waerden, Borgers, & Timmermans, 2003). Together with
distance, drivers’ characteristic is the second influenced factor, i.e., the age, the gender, ticket
payment, car size, and number of people in the car. To be more specific, the older driver tends to
avoid the parking spaces that are occupied on the right hand side. Meanwhile, the younger driver
tends to avoid the parking spaces that are occupied on the left hand side. Regards to the gender,
male prefers to park closer to the entrance of the parking lot. However, there is no evidence which
shows female choose further parking space from the entrance. In case the driver needs to pay the
ticket, the space near the ticket machine is preferred. The bigger car requires the driver to choose
a wider space. By contrast, the smaller car leads the driver to choose a space which is occupied on
both sides. As to the number of the people in the car, the more people in the car, the longer distance
from the ticket machine the driver would like to park. Another factor is the time of the day. In the
morning, the driver prefers to choose the parking space which is not occupied on both sides. In the
meanwhile, the driver will choose the parking space which is occupied both sides in the afternoon.
Besides, in the morning, the driver has a tendency to park near the ticket machine, the parking lot
entrance, and the exit. In the afternoon, the driver may park further away from this reference point.
3.2 Parking indicators
In order to measure the effectiveness of the parking usage, parking occupancy, average parking
occupancy can be utilized (Mathew, 2014). The parking occupancy indicator is a proportion of
spaces occupied in a defined time interval. Based on the parking occupancy and number of
observed time intervals, the average parking occupancy can be calculated.
Parking occupancy = (Parking accumulation in a given period/parking capacity) x 100

Thi Thuy An Vo 5
where parking accumulation is defined as the number of cars parked in a defined time interval.
This indicator is depicted in terms of accumulation curve which is obtained by plotting the number
of spaces occupied regarding the given time.
Shorter time interval is more accurate because there are less chances of missing short-term
parker. However, the shorter time interval consumes more resources e.g., labor intensive, and
costly (Mathew, 2014). In simulation, the number of time interval influences both accuracy and
duration of a micro-simulation run. The shorter time interval micro-simulation uses, the greater
precision of the model results are. However, shorter time interval requires more computation
(Dowling, Holland & Huang, 2002).
Besides, the in-vehicle travel time and the searching parking times will attract drivers
choose the parking space and the parking lot (Thompson & Richardson, 1998). In case of
movements at the parking lot, these two types of time can be integrated into the vehicle travel time.
The vehicle travel time can be used to measure the effectiveness of the parking lot. This is started
to calculate when the car enters the parking lot, and is stopped when the car parks.
3.3 Agent-based modeling and simulation
An agent-based modeling and simulation (ABMS) is a bottom-up modeling approach that describes
or defines potential interactions between the individuals of the system, i.e., agents. It can capture
emergent phenomena and simulate a diverse range of complex systems. ABMS’ results are the
micro-level behaviors which are resulted from the interactions between the agents. Hence, ABMS
is appropriate to study the behavior of complex systems such as the transport system (Bonabeau,
2002).
One of the application of ABMS in transportation is activity-based models for the travel
demand. Currently, ABMS has been attracted attention increasingly because it is more focusing on
behaviors, compared to the trip-based four step models. Besides, ABMS has potential to achieve
the reliability, and reactivity which is essential to address emerging transport concerns (Guo,
Huang & Sadek, 2013). To be more specific, since the 1980s, traffic engineering experts have
developed and applied ABMS as a current micro-simulation for the demand side of transport. In a
micro-simulation, the agents (i.e., the driver, vehicle) decide the speeds,
accelerations/decelerations, lanes in which the vehicle run based on its own states (i.e., position,
current speed) and its perceptions of the environment (i.e., headway to other cars). PARAMICS
(Quadstone, 2004), VISSIM (Planung Transport Verkehr-AG, 2004), AIMSUM (Barcelo &
Ferrer,1998), TRANSIMS (Guo, Huang & Sadek, 2013) are currently the well-known agent-based
micro-simulation models.
Application of ABMS in transportation is currently increasing but there is not many
researches focusing on parking. One of fundamental researches is PARKAGENT model
(Benenson, Martens & Birfir, 2008). This agent-based model simulates the drivers’ behaviors in a
spatially explicit environment. The whole parking process i.e., from searching for parking place to
exiting the parking place was simulated. The simulation environment is built with the high
resolution of the urban GIS data i.e., traffic infrastructures (buildings, on-street/off-street parking
facilities). This model illustrated a real case study from Tel Aviv city. The output of this simulation
helps to show its advantages. One of its advantages is capturing the effects of non-heterogeneity of
the driver population. Particularly, this model can simulate the complex different scenarios of the
parking system in detail. The results of these different scenarios are the performance about the key

Thi Thuy An Vo 6
values e.g., searching time, walking distance, parking costs over different groups of drivers.
Another advantage of PARKAGENT is that the number of drivers simulated is not limited. Besides,
researchers can apply PARKAGENT to study the effects of additional parking supply at residential
areas in which the parking places are inadequate. Hence, this model is more advanced than the
traditional approach because it can simulate the parking place which is saturated. However, this
model has some limitations. Particularly, PARKAGENT is only considered as the first step of
simulation for the management of the saturated parking’s situation. The potential policy
intervention for the parking management is still not clarified. Another limitation is that
PARKAGENT does not cooperate the other transport modes in its simulation.
Another application of ABMS is a simulation of truck parking in Toronto (Nourinejad,
Wenneman, Habib & Roorda, 2014). The purpose of this model is evaluating impacts of dedicating
on-street parking in Central Business districts. By cooperating the parking choice model, this model
simulates decision of parking facilities/location of the driver. Compared to the traditional approach,
this model replicates the important parking activities that are usually neglected in literatures, and
not quantified in practical decisions e.g., walking distance, congestion impacts, parking search
time. Though this model is promising, there still exists some restraints. The validation of this model
is still limited. In other words, the outcomes and the observed values are not similar. Hence, this
model is needed to improve the accuracy. Furthermore, all trucks were assumed to make the same
parking decision but they are different in reality. Particularly, various types of trucks e.g., couriers,
food delivery have different constrains on parking behaviors.
Guo Huang & Sadek (2013) developed a novel agent-based model to simulate the parking
behavior at a university’s parking campus. This novel model is integrated between the disaggregate
activity-based-travel demand model (TRANSIMS) and MOVE2010 emission model. The
TRANSIMS model provides the traffic routing and micro-simulation functions which focus on
vehicle-related travel and associated parking search process. Meanwhile, MOVE2010 emission
model focuses on the environmental aspect. Additionally, in order to simulate the optimistic and
pessimistic behaviors of parking, the sequential game theoretic neo-additive capacity model was
utilized. This theory helps to simulate the desired lots of the driver accurately. This mode is
accurate and sensitive enough to evaluate sustainable transport strategies and policies for parking
management. Because of MOVE2010 integration, this novel model can quantify the environmental
cost of the parking search process which is rarely simulated in literatures. Hence, this model is
potential to assess the effectiveness of parking management strategies and policies. However, this
model is only designed to replicate the parking behaviors at a given hourly traffic distribution i.e.,
the time of arrival to University’s campus. Furthermore, only cars were simulated in this model but
not buses or other transport modes.
3.4 Multi-agent based modelling and simulation
Although ABMS has more advantages than the activity-based model, it does not incorporate the
adaptability of users’ behavior. In order to solve this constraint, a multi-agent-based system
simulation (MAS) can be used. MAS is suitable to simulate the behaviors of many agents in the
transport system (Nguyen, Bouju & Estraillier, 2012). MAS is defined as a number of agents which
interact with another through communication. Both an ABMS and MAS need agents as a core
concept of modeling. An agent is defined as a software system which can take autonomous
decisions/ activities and interact with its environment to meet the design objectives (Wooldridge,
2002). The agent has two important rotations i.e., self-interested and autonomous which supports
Thi Thuy An Vo 7
the agent to make independent decisions of what to do to satisfy the design objectives. In order to
operate ABMS or MAS, a necessary structure of a model includes two criteria. First, all agents are
equipped with a set of goals. Each time, the agent chooses an action which is believed as the best
one to reach the design objectives. Second, each agent has a united internal set of rules which guide
to make decisions. The agent’s action/behavior is, therefore, directly influenced by the other agents.
In case one agent wants to change another’s behavior, it can only do indirectly by affecting some
actions. These actions alter the best way for the second agent to achieve its own goal.
Currently, MAS application is increasingly utilized. There are several MAS platforms, e.g.,
Madkit, Jade, Repast, GAMA. Expressly, Madkit is a platform written in Java, and built upon the
Agent/Group/Role organizational model. This platform can help to simulate the role in groups, and
can create artificial societies (Gutknecht & Ferber, 2000). Nevertheless, it poorly supports
geographic data. JADE platform simulates the communication between agents but it does not
support geographic data integration (Bellifemine, Poggi & Rimassa, 2011). Repast is also open-
source, and written in Java but this platform can support well developed spatial data libraries.
However, advanced GIS operations have to be programmed which is far from reach of modelers
(North, Collier & Vos, 2006). Compared to other platforms, GAMA is more advanced since it
provides a complete modeling and simulating environment for building spatially i.e., the
geographic information is well integrated in this simulator. However, this simulation has been not
adapted yet, and the parameters cannot be adjusted or changed during the simulation (Amouroux,
Chu, Boucher & Drougoul, 2009).
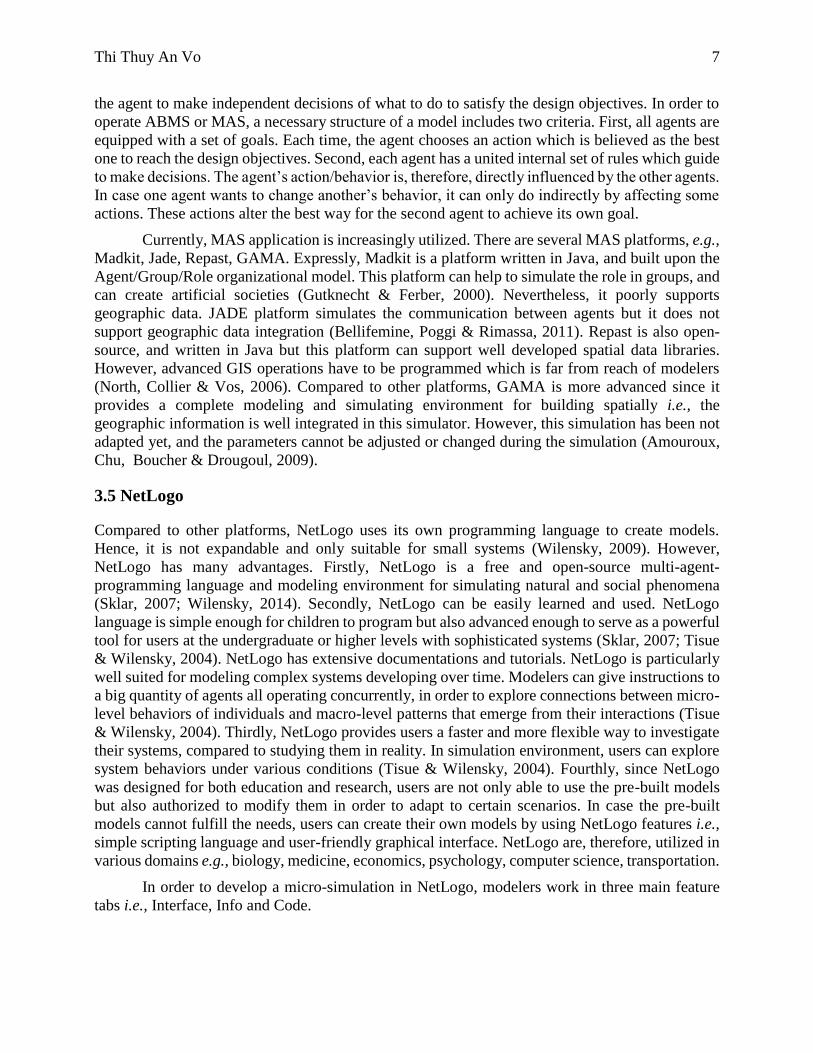
3.5 NetLogo
Compared to other platforms, NetLogo uses its own programming language to create models.
Hence, it is not expandable and only suitable for small systems (Wilensky, 2009). However,
NetLogo has many advantages. Firstly, NetLogo is a free and open-source multi-agent-
programming language and modeling environment for simulating natural and social phenomena
(Sklar, 2007; Wilensky, 2014). Secondly, NetLogo can be easily learned and used. NetLogo
language is simple enough for children to program but also advanced enough to serve as a powerful
tool for users at the undergraduate or higher levels with sophisticated systems (Sklar, 2007; Tisue
& Wilensky, 2004). NetLogo has extensive documentations and tutorials. NetLogo is particularly
well suited for modeling complex systems developing over time. Modelers can give instructions to
a big quantity of agents all operating concurrently, in order to explore connections between micro-
level behaviors of individuals and macro-level patterns that emerge from their interactions (Tisue
& Wilensky, 2004). Thirdly, NetLogo provides users a faster and more flexible way to investigate
their systems, compared to studying them in reality. In simulation environment, users can explore
system behaviors under various conditions (Tisue & Wilensky, 2004). Fourthly, since NetLogo
was designed for both education and research, users are not only able to use the pre-built models
but also authorized to modify them in order to adapt to certain scenarios. In case the pre-built
models cannot fulfill the needs, users can create their own models by using NetLogo features i.e.,
simple scripting language and user-friendly graphical interface. NetLogo are, therefore, utilized in
various domains e.g., biology, medicine, economics, psychology, computer science, transportation.
In order to develop a micro-simulation in NetLogo, modelers work in three main feature
tabs i.e., Interface, Info and Code.

Thi Thuy An Vo 8
The Interface tab is designed to provide users an ability to create and edit graphical elements
including button, slider, switch, chooser, monitor, plot, output, and text. In order to control
the content of these elements, as well as behavior of agents, a program needs to be written
in the Procedures tab. In NetLogo, agents are represented as “turtles” and placed in a two
dimensional canvas called “world”.
The Information tab is a plain text editor utilized for documentation purpose. This tab is
useful for either the programmer or other people to review and understand the system.
Code is the procedure tab. This is a development environment which allows users to
program content of graphical interface elements and behavior of turtles in form of
“primitives”. Similar to other programming languages, some of NetLogo primitives operate
on data structures i.e., Turtles, agent-set, list, and string. Other primitives enable standard
programming structures (e.g., looping, branching, logic) and standard mathematical
functions (e.g., comparisons, trigonometry, statistics). There also exist primitives used for
customizing interface components.
4 METHODOLOGY
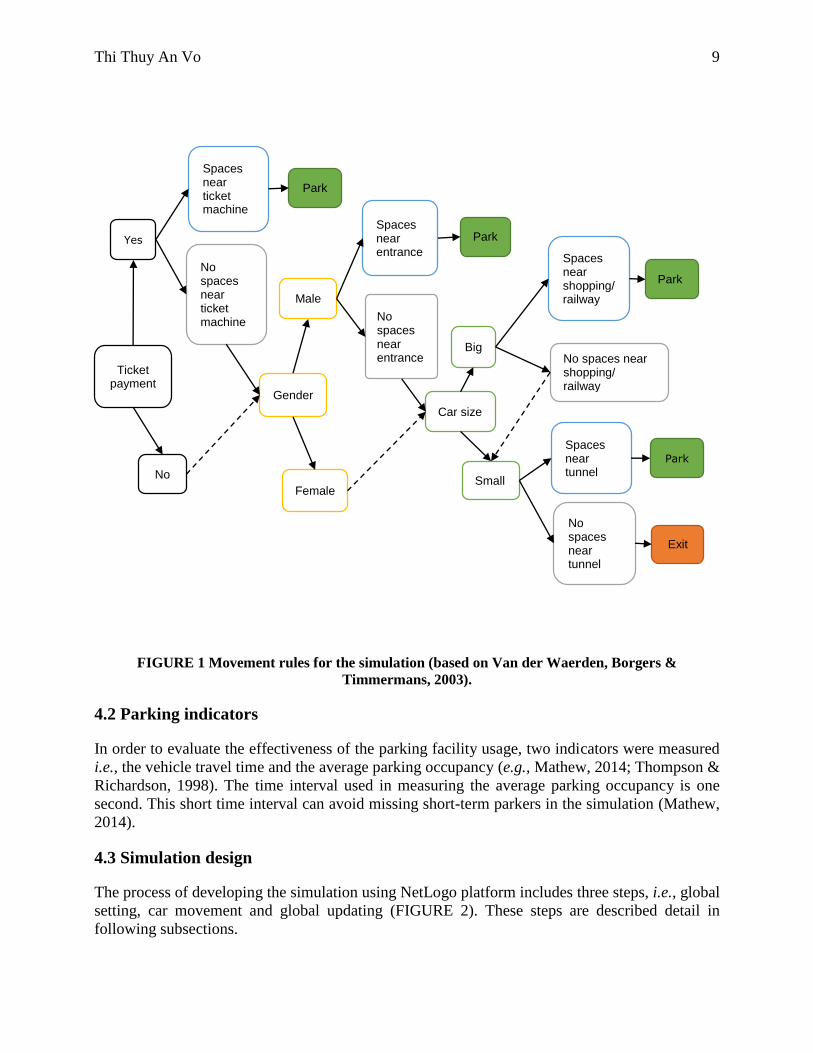
4.1 Parking settings and rules The observed data and the findings of Van der Waerden, Borgers, & Timmermans’ study (2003)
were used to develop the simulation. Particularly, the observed data is used to calculate the rate of
cars entering the parking lot. Besides, this data was used for the simulation’s case study. Together
with observed data, the findings were employed to build the movement rules for the simulation. In
other words, the three influencing factors on choosing the parking spaces were used to set up the
movement rules for cars in the simulation, i.e., ticket payment, gender, and car size. Ticket payment
is the most important variable which has the first priority of the car driver when looking for a
parking space. Gender and car size have less priority respectively as shown in FIGURE 1.
In particular, the first priority rule is that if the driver needs to pay the parking ticket, he/she
will park near the ticket machine. In case there is no parking space near the ticket machine
available, the male rule is applied. When there is no space which satisfies the male rule, the car
size rule is used. Likewise, if the driver does not need to pay the ticket, the car will follow the
gender rule. The second rule is based on the gender, i.e., if the driver is male, he will park near the
entrance point. In case the driver is female or there is no place near the entrance point, the third
rule is used. The third rule indicates that big car size will park near shopping center or the railway
station exit points. In case the car size is small, the driver will park in other spaces i.e., near tunnel
area. The driver will exit if these three rules are not satisfied.
Thi Thuy An Vo 9
FIGURE 1 Movement rules for the simulation (based on Van der Waerden, Borgers &
Timmermans, 2003).
4.2 Parking indicators
In order to evaluate the effectiveness of the parking facility usage, two indicators were measured
i.e., the vehicle travel time and the average parking occupancy (e.g., Mathew, 2014; Thompson &
Richardson, 1998). The time interval used in measuring the average parking occupancy is one
second. This short time interval can avoid missing short-term parkers in the simulation (Mathew,
2014).
4.3 Simulation design
The process of developing the simulation using NetLogo platform includes three steps, i.e., global
setting, car movement and global updating (FIGURE 2). These steps are described detail in
following subsections.
Ticket payment
Yes
No
Spaces near ticket machine
No spaces near ticket machine
Park
Exit
Male
Car size
Big
Small
Gender
Spaces near shopping/ railway
No spaces near shopping/ railway
No spaces near tunnel
Spaces near tunnel
Female
Spaces near entrance
No spaces near entrance
Park
Park
Park

Thi Thuy An Vo 10
FIGURE 2 Three stages of simulation development procedure summary.
Global setting
This step creates the global settings which include four sub-steps i.e., creating parking layout,
setting for simulation, setting for parking features, setting for population.
Creating the parking layout: The random seed was initial set up in order to guarantee that
the users can get the same results for every time running simulation. The parking layout
included borders and characteristics of the parking lot. The border of this parking lot was
built by setting the coordinate limits for the patches. Next, six characteristics of the parking
lot were created i.e., entrance, exit, ticket machine locations, parking gate, different parking
strips and parking spaces. Again, these characteristics were set up based on setting patches.
One entrance and exit, ticket machine, gate and five different parking strips were set up
similar to the parking layout in Eindhoven (Van der Waerden, Borgers, & Timmermans,
2003). The gate was set up to automatically close when no space available. In order to
indicate the movement route for the cars, five different strips were created based on the
movement routes (FIGURE 1). Additionally, all the available parking spaces were set up
the same color and they turned to another color to when the spaces were occupied. These
colors informed the car the parking spaces’ availability.
Setting for simulation: The observed time and initial car parked before running simulation
were set up. The observed time was the time that users want to observe the simulation. It
was measured by the “tick” time in this simulation. Initial car parked was created before
running simulation. A number of cars were randomly set up to park in the parking lot. And
Global setting
•Creating parking layout
•Setting for simulation (observed time, initial car parked)
•Setting for parking features (speed, rate of car enter, parking duration)
•Setting for population (ratio of gender, car size and the need of ticket)
Car
movement
•Creating car with its characteristics
•Car enter (choosing parking strips, moving and looking for parking space, parking)
•Cars exit (checking parking duration, exiting)
Global updating
•Updating time
•Updating available parking lots status
•Updating plots
•Checking time observed, exporting results
Thi Thuy An Vo 11
these initial cars were assigned the parking duration which is obeyed the parking duration
of the parking lot.
Setting for parking features: Three features of the parking were set up i.e., speed, rate of
car enter, parking duration. The speed limit of the parking lot was set up and all cars enter
followed this speed. Thus, some cars can either run slower or faster (maximum 1 km/h) the
speed limit. The car speed is decelerated when entering the parking space to reflect the
actual parking time. This deceleration increases the time to get lot of the other cars. The
“tick” time unit used in the developed-simulation tool is assumed as second in reality. Based
on this assumption, the real speed was converted into the speed of simulation within the
simulation code. The rate of car enter is the number of cars entered the parking lot. This
rate is randomly generated under assumption of Poisson distribution with defined rate
(Haight, 1967). Parking duration is the limit parking time for all cars. All car entered the
parking lot were randomly assigned parking duration under assumption of Normal
distribution with a defined rate (Walck & Group, 2007).
Setting population: The distribution of the gender, car size i.e., big, small, and ticket
payment were assigned before running the simulation. Particularly, the percentages of male,
big car entered the parking lot during the observed time. The percentages of drivers need
tickets entered the parking lot.
Car’s movement
In this step, the characteristics of the car, the entering cars, and exiting cars were created.
Creating car with its characteristics: All cars were assigned eight characteristics i.e., shape,
color, gender, ticket payment, car size, parking duration, parking speed, and vehicle travel
time. All cars were created the same shapes but different colors. The gender, ticket payment,
and car size characteristics of each car were assigned under the population distribution in
global setting step. Two car size i.e., big and small were set up for cars. Based on these
characteristics, the car has its own movement direction and desired parking space (FIGURE
1). Each car was randomly assigned the parking duration and speed limit. The parking
duration is assumed following the Normal distribution. In order to measure the parking
effectiveness, the vehicle travel time was created. This time was counted from the moment
of car entered the parking lot until the car parked.
Car enter: When entering, cars proceed three steps i.e., choosing desired parking strips,
moving and looking for available spaces, and parking. The car starts to choose its desired
parking strips i.e., near the entrance, ticket machine, shopping area, railway, and tunnel.
After choosing the parking strips, the car moves and finds available spaces. The first two
steps are affected by the car’ characteristics. Expressly, its own characteristics i.e., ticket
payment, gender, car size decide its movement direction and its desired parking space
(FIGURE 1). Next, the car parks when the available parking space which satisfies its
characteristics. In case there are no spaces, or the available spaces are not qualified, the car
exits. The travel vehicle time will be stored when the car parks. Meanwhile, the parking
duration will start to deduct when the car parks.
Cars exit: While parking, the parking duration of its cars will be checked. When the parking
duration expires, the car will exit. In order to exit, the car will back to prepare for exiting.
Depending on which location the car parked, different backing directions will be set up for
the car. The parking space status will be set to available while the car back from its parked
space. After backing, the car will follow the exit movement rules to leave the parking lot.
Thi Thuy An Vo 12
Global update
The global update was active during the simulation running. Particularly, the time, available
parking spaces, plots, observed time, and exporting results were updated. The whole process was
set up to update within a tick in this simulation, corresponding to second in the reality. Every tick,
the number of car park and number of available parking spaces are checked. The checking of
available parking spaces were utilized to calculate the parking occupancy. The observed time that
was set up in the global setting step is also checked. The simulation automatically stopped when
observed time is run out. The results of the simulation are exported after the simulation stops.
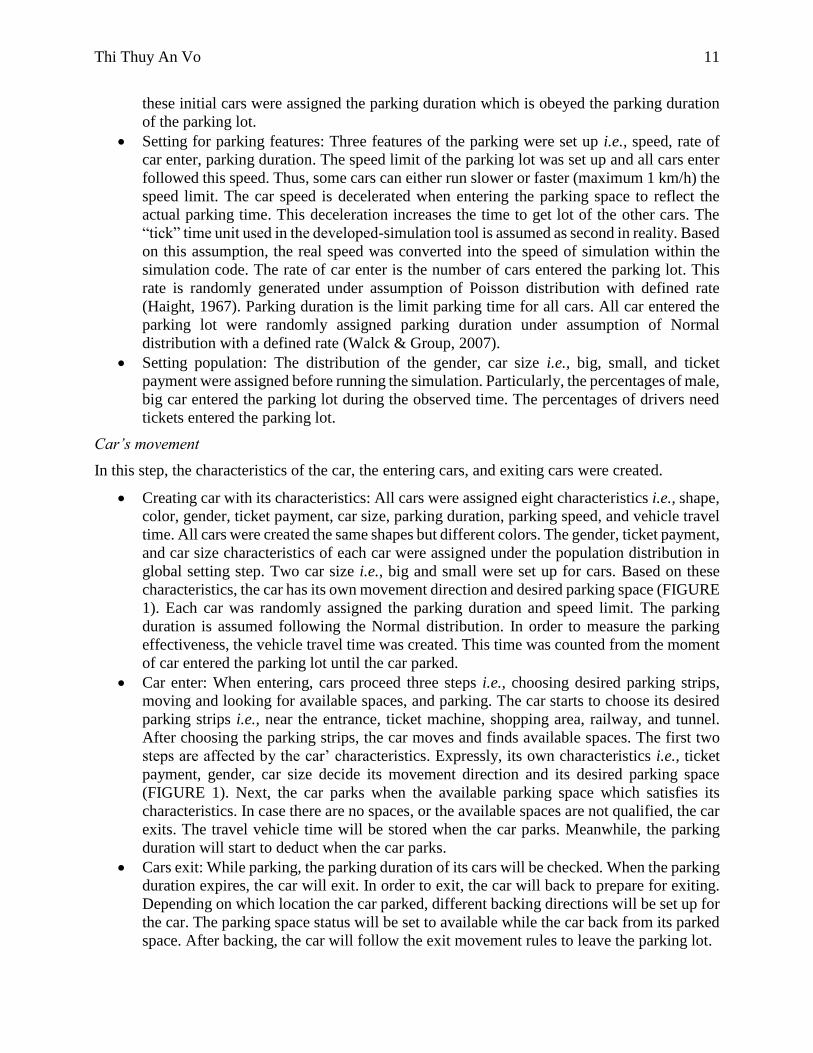
4.4 Case study simulation
In order to demonstrate the capability of the developed-simulation tool, and to evaluate effects of
the parking duration restriction, and the speed limit on the parking efficiency, the case study in the
city of Eindhoven is replicated. FIGURE 3 shows the parking lot layout used for the simulation.
The parking lot has two lanes for drivers, corresponding to the superimpose arrows. Particularly,
the blue arrows indicate the direction of cars entering the parking lot. Meanwhile, the yellow and
white arrows depict the direction for exiting. When the car reaches the parking lot without parking,
it will follow the exit movement routes. Three exit movement directions are applied for cars parked
in different strips. Cars parked at yellow, white and red spaces will exit following the yellow white
and red arrows, respectively.
FIGURE 3 Car movement directions in simulation.
*The exit routes are represented with red, white and yellow arrows, correspond to the three areas. The blue
arrows are the enter routes.
Three settings for simulation are generated using the data from the Eindhoven case study.
All scenarios have the same proportion of gender, car size, and ticket payment. The rate of cars
entering is calculated from Van der Waerden, Borgers, & Timmermans’ study (2003) as 1.02
cars/minutes. The initial number of occupied spaces is set at 30 parking spaces. Scenarios are
different in setting of maximum parking duration and the speed limit in parking lot (TABLE 1).
All scenarios are simulated in a period equivalent to eight hours of real-time observation. This
observed time is sufficient enough for all cars consume all the parking duration of 120 minutes and
240 minutes.

Thi Thuy An Vo 13
TABLE 1 Four scenarios of the simulation (Van der Waerden, Borgers & Timmermans, 2003)
Scenarios Average rate of car enter
(cars/minute)
# Car occupied
% of male
% big car % need to buy ticket
Maximum parking duration
(minutes)
Speed limit
(km/h)
1st 1.02 30 43 70 91 120 15
2nd 1.02 30 43 70 91 120 20
3rd 1.02 30 43 70 91 240 15
4th 1.02 30 43 70 91 240 20
5. RESULTS
5.1 The developed-simulation tool interface
Parking layout
The parking lot was created including 160 parking spaces with one entrance, one ticket machine
(yellow computer icon, FIGURE 4). Four exit points for pedestrians are located near the entrance,
shopping area, tunnel, railway station. Cars can only exit near the entrance point. Each space is
equivalent to one patch in the simulation. The parking space has a square-shape with dimension
5.5 x 5.5 meters which was modified from the recommendation of Urban Plan Institute (1990).
This dimension was designed as an input button in the simulation interface. Hence, the dimension
is adjustable which means that users can adjust it by replacing the desired dimension in the input
button (FIGURE 4). All parking spaces are colored with green when they are available and they
turn to red when they are occupied. In order to support for parking movement rule, the parking lot
was regionalized into five strips which are near entrance (E), ticket machine (M), shopping center
(S), tunnel (T) and railway (R) strips. This regionalization helps cars to identify these strips when
cars move, and chose parking spaces.

Thi Thuy An Vo 14
FIGURE 4 Parking lot simulation interface.
Parking settings
The number of preoccupied spaces were created in form of the slider. This number was in a range
from zero to 160 cars i.e., the parking capacity (FIGURE 4). The slider allows users to choose the
desired setting for the simulation. The locations of preoccupied space are the same for each setup
time due to the random seed.
The gate was set up in form of the switch (on/off) in the developed-simulation. If the button
is switched on, the gate is automatically closed when there are no available spaces and the bulb
which is located near the entrance will turn on to inform the cars (FIGURE 4). The rate of car
entered was designed as a slider which can be adjusted from zero to six cars/minute. Besides, the
observed time can be chosen as desire to stop running the simulation. Particularly, the observed
time limit is 24 hours which is equivalent to the maximum parking duration of the parking layout.
Car settings
Each car will be assigned its characteristics, i.e., ticket payment, gender, car size, speed, and
parking duration when entering the parking lot. These characteristics are displayed in form of
adjustable sliders. The users can move the sliders to choose the percentages of male, big car, and
ticket payment entering the parking lot.
Regarding to the speed, the cars will be assigned the travel speed randomly within the limit
set by the speed slider. The parking duration slider represents the mean of a normally distributed
distribution in minute, with the corresponding standard deviation is designed as an input box. The
parking space will be switched from red to green when the car exits.

Thi Thuy An Vo 15
Three plots are draw during simulation, i.e., inputs monitor plot, vehicle travel time
histogram and parking occupancy curve (FIGURE 4). The input monitor plot shows the number of
three characteristics of cars entering the parking lot, i.e., percentage of male, big car, and ticket
payment. The other plots monitor the two parking indicators of interests. Particularly, frequency of
vehicle travel time indicates the number of cars spend 30, 60, 90, 120 seconds or more time to get
to parking spaces. The parking occupancy depicts the occupancy percentage for each second.
5.2 Case study in the city of Eindhoven
By utilizing the observed data and findings from Van der Waerden, Borgers & Timmermans’ study
(2003) i.e., rate of car enter is 1.02 cars/ minutes, 30 spaces are initial occupied, 43% of drivers are
male, 70% of cars are big size and 91% of cars need ticket, the results of simulation was presented
in TABLE 2.
TABLE 2 Vehicle travel time and average parking occupancy of 4 scenarios
Scenarios 1st 2nd 3rd 4th
Average parking occupancy (%) 63.54 67.37 83.19 87.37
Vehicle travel time (in second)
0 2 10 3 7
30 56 (57.14) 54 (60.04) 73 (45.91) 82 (53.59)
60 38 (38.78) 33 (37.08) 72 (45.28) 63 (41.17)
90 4 (4.08) 2 (2.88) 12 (7.55) 7 (4.57)
120 0 0 2 (1.26) 1 (0.67)
Total car parked/entered 98/100 89/99 159/162 153/160
* Number in the brackets are percentages
The results in TABLE 2 illustrate that the majority of cars did not spend more than 60
seconds in vehicle travel time for parking. The number of cars parked within 30 seconds are larger
than those of 60 seconds, especially for 120-minute parking duration scenarios (1 and 2). However,
the small ratios of car spent more than 90 seconds for parking when the parking duration is 240
minutes.
At the same maximum parking duration, increasing speed will decrease the travel vehicle
time, as well as increase the average parking occupancy. The average parking occupancy increased
by 3.83% i.e., from 63.54% to 67.37% for the scenarios of 120-minute parking duration. Similarly,
the average parking occupancy of 240-minute parking duration scenarios increased by 4.18% i.e.,
from 83.19% to 87.37% (TABLE 2, FIGURE 5).
However, when the maximum parking duration increased from 120 minutes to 240 minutes,
more cars spent 60 seconds to travel and park though these ratio were still smaller than these
numbers of 30 seconds. Besides, there were some cars needed to spend 120 seconds in vehicle for
parking. By contrast, the average parking occupancy increased by 19.65% from 63.54% to 83.19%

Thi Thuy An Vo 16
when the parking limit was 15km/h. This increment was 20% for the speed limit of 20km/h i.e.,
from 67.37 to 87.37%. Interestingly, the parking lot were fully occupied for some observed second
intervals when the parking duration were 240 minutes (FIGURE 5).
(a)
(b)
(c)
(d)
FIGURE 5 Parking occupancy for four scenarios.
(a): 1st scenario, (b): 2nd scenario, (c): 3rd scenario, (d): 4th scenario
6. DISCUSSION
The main goal of this study was to attempt to develop the micro-simulation program for drivers’
behaviors at the parking lot by using NetLogo. The results have further strengthened that the
developed-simulation tool can be applied to the drivers’ behaviors at the parking lot. This study is
consistent with the previous results which indicated the simulation ability of NetLogo in
transportation (Hjorth, 2010; Wilensky, 1998; Wilensky & Stroup, 1999). The users can adjust
desired characteristics of the cars or the parking lot for their simulation. Also, the results confirm
the study of Litman (2006). Limits of parking duration can encourage the short-term users because
it decreases the parking occupancy. This study presents a new approach for to simulate the drivers’
behaviors at the parking lot. The policy makers, transport experts, and parking managers can apply
the developed-simulation tool to investigate the drivers’ behaviors. When applying this developed-
simulation tool, resources i.e., time, money, human can be saved. Besides, the results of case study
scenarios show that both the parking duration and speed limit constraints affect the parking
efficiency. Because the parking duration affects the parking occupancy, parking managers can
adjust the parking duration, and/or parking speed to promote the parking occupancy. The speed
limit adjustment could be considered as a countermeasure to decrease congestion problem in the

Thi Thuy An Vo 17
parking lot by reducing the vehicle travel time. In case the policy makers or transport experts want
to promote drivers use bus, or Park & Ride, decrease of parking duration and speed limit can be
applied. Another potential application of this study is using the developed-simulation tool to find
out the sufficient parking layout before building the new parking lot. This can be implemented by
applying the developed-simulation tool to figure out the factors influence the drivers’ movements
at the parking lot. Furthermore, the environmental effects of parking lot can be attractive attention
of this simulation. In other words, the amount of CO2 evacuate into the environment from the
movements of the car in parking lot, can be measured by applying this simulation (Agency United
States Environmental Protection, 1996).
Due to the time constraint, this study only simulated the interactions between the drivers
and the parking lot. In reality, when considering the parking lot, pedestrians are usually concerned
(Ransford, 2009). Literatures show that other factors i.e., drivers’ experiences, drivers’ expectation,
parking guidance information, the travel time of the route, walking distance to destination, and
time of day also influence on the drivers’ behavior at the parking lot (Bonsall & Palmer, 2004;
Young &Thompson, 1987; Young, 1986). Though this current study has not integrated these
factors yet, so far there are rarely studies simulated the drivers’ experiences and expectation.
Although the parking space size of this simulation cannot reflects the real size, it can be designed
when the real space size is available. Besides, this study only developed the simulation for off-
street parking instead of parking garages or on-street parking. However, this study is the first step
towards using NetLogo in parking. Hence, based on this study, the further studies for on-street
parking, parking garages should be implemented.
7. CONCLUSIONS
The developed-simulation tool is promising platform to simulate the effects of changes in the
characteristics of the parking layout and the drivers’ behaviors. This developed-simulation tool’s
characteristics are modifiable under the users’ expectation. In this study, we simulated the
interaction between the drivers as well as between the drivers and the parking lot when the driver
is searching the parking spaces. Therefore, this can be applied to study the factors influence the
parking behaviors of drivers and the efficiency of parking usage in the parking lot. The results of
the case study indicated that speed limit and maximum parking duration have effects on the parking
efficiency. Increasing speed limit helps not only drivers to save time to travel and find parking
space but also increase the average parking occupancy for the parking lot. Similarly, increasing
parking duration limit encourage the average occupancy for the parking lot but it makes drivers to
spend more vehicle travel time. The simulation capability of this developed-simulation tool in
drivers’ behaviors is very exciting proposition. This can help us to save resources i.e., time, money
and human because of its open-source. Hence, further development of this developed-simulation
tool with drivers’ behaviors at the other parking facility types are needed to utilize the advantages
of this simulation.
REFERENCES
Agency United States Environmental Protection. (1996). Indicators of the Environmental Impacts
of Transportation: Highway, Rail, Aviation, and maritime Transport. EPA 230-R-96-009.

Thi Thuy An Vo 18
Amouroux, E., Chu, T., Boucher, A., & Drougoul, A. (2009). GAMA: An Environnement for
Implementing and Running Spatially Explicit Multi-agent Simulation. PRIMA 2007.
Arnott, R., & Rowse, J. (1999). Modeling Parking. Journal of Urban Economics, 124, 97–124.
doi:10.1006/juec.1998.2084.
Barcelo, J., & Ferrer, J. L. (1998). AIMSUN2: Advanced Interactive Microscopic Simulation for
Urban Networks. Departmento de Estadistica e Investigation Operative, Faculdad de
Informatica, Universidad de Cataluna.
Bellifemine, F., Poggi, A., & Rimassa, G. (2011). Developing Multi-agent Systems with JADE.
Intelligent Agents VII. LNAI 1986, 89-103.
Benenson, I., Martens, K., & Birfir, S. (2008). PARKAGENT: An agent-based model of parking
in the city. Computers, Environment and Urban Systems, 32(6), 431–439.
doi:10.1016/j.compenvurbsys.2008.09.011.
Bonabeau, E. (2002). Agent-based modeling: Methods and techniques for simulating human
systems. The National Academies of Science 99, Suppl. 3(7280–7287).
Bonsall, P., & Palmer, I. (2004). Modelling drivers’ car parking behaviour using data from a travel
choice simulator. Transportation Research Part C: Emerging Technologies, 12(5), 321–347.
doi:10.1016/j.trc.2004.07.013.
Dowling, R., Holland, J., & Huang, A. (2002). Guidelines for Applying Traffic Microsimulation
Modeling Software. California Department of Transportation and Dowling Associates,
Oakland, California, U.
Guo, L., Huang, S., & Sadek, A. W. (2013). A novel agent-based transportation model of a
university campus with application to quantifying the environmental cost of parking search.
Transportation Research Part A: Policy and Practice, 50, 86–104.
doi:10.1016/j.tra.2013.01.045.
Gutknecht, O., & Ferber, J. (2000). The MADKIT Agent Architecture, Lecture Notes In. Computer
Science, vol. 1887(48-55).
Haight, F. A. (1967). Handbook of the Poisson Distribution. New York: John Wiley & Sons.
Hjorth, A. (2010). Interpreting congestion charge (simple, step1). Retrieved from
http://modelingcommons.org/browse/one model/2866 model tabs.
Humphreys, J. R., Box, P. C., Sullivan, T. D., & Wheeler, D. J. (1978). Safety aspects of curb
parking. Rep. No. FHWA-RD-79-76, Federal Highway Administration.
Litman, T. (2006). Parking Management Strategies, Evaluation and Planning. Strategies, 1–28.

Thi Thuy An Vo 19
Mathew V.T. (2014). Chapter 41 Parking Studies. Engineering, Transportation Systems, IIT
Bombay.
Nguyen, Q. T., Bouju, A., & Estraillier, P. (2012). Multi-agent architecture with space-time
components for the simulation of urban transportation systems. Procedia-Social and
Behavioral Sciences, 54 (2012) 365-374.
North, M. J., Collier, N. T., & Vos, J. R. (2006). Experiences creating three implementations of the
repast agent modeling toolkit. ACM Transactions on Modeling and Computer Simulation,
6(1), 1-25.
Nourinejad, M., Wenneman, A., Habib, K. N., & Roorda, M. J. (2014). Truck parking in urban
areas: Application of choice modelling within traffic microsimulation. Transportation
Research Part A: Policy and Practice, 64, 54–64. doi:10.1016/j.tra.2014.03.006.
Planung Transport Verkehr-AG. (2004). Vissim Microscopic Traffic and Transit Simulation User
Manual. Germany: Karlsruhe.V. 3.70.
Quadstone, L. (2004). Quadstone Paramics v5.0 Modeller User Guide. Scotland, UK.
Ransford, S. (2009). Chapter 14. Parking. Traffic engineering hanbook, 6th Edition. Institute of
Transportation Engineers.
Sklar, E. (2007). NetLogo, a multi-agent simulation environment. Artificial Life, 13(3 )(303– 311).
Stover, V. G., & Koepke, F. J. (2002). Transportation and Land Development. Institute of
Transportation Engineers, Washington, D.C.
Thompson, R. G., & Richardson, A. J. . (1998). A Parking Search Model. Transportation Research
Part A: Policy and Practice, 32(3), 159–170. doi:10.1016/S0965-8564(97)00005-0.
Tisue, S., & Wilensky, U. (2004). NetLogo: Design and implementation of a multi-agent modeling
environment. In Proceedings of Agent, Vol. 2004, 7–9.
Urban Land Institue. (1990). The Dimensions of Parking, 4th Edition. Washington, DC, USA.
Van der Waerden, P., Borgers, A., & Timmermans, H. (2003). Travelers Micro-Behavior at
Parking Lots: A model of parking choice behavior. Paper submitted for possible presentation
to the 82th Annual Meeting of the Transportation Research Board, Committee A1C07
Transporation Planning Application.
Van der Waerden, P., Timmermans, H., & Rodrigues da Silva, A. N., (2014). The influence of
personal and trip characteristics on habitual parking behavior. Case Studies on Transport
Policy. doi:10.1016/j.cstp.2014.04.00.

Thi Thuy An Vo 20
Walck, C., & Group, P. P. (2007). Handbook on Statistical Distribution for experimentalists.
Retrieved from http://www.stat.rice.edu/~dobelman/textfiles/DistributionsHandbook.pdf
Wilensky, U. (1998). NetLogo Traffic Intersection model. Center for Connected Learning and
Computer-Based Modeling. Northwestern University, Evanston, IL.
Wilensky, U. (2009). NetLogo 4.1 User Manual, Center for Connected Learning and Computer-
Based Modeling. Northwestern University.
Wilensky, U. (2014). NetLogo: Center for connected learning and computer-based modeling.
Wilensky, U., & Stroup, W. (1999). Learning through participatory simulations: Networkbased
design for systems learning in classrooms. In the 1999 conference on computer support for
collaborative learning (p. p.80).
Wooldridge, M. (2002). An Introduction to MultiAgent system. John Wiley & Sons Ltd, Baffins
Lane, Chichester, West Sussex PO19 1UD, England.
Young, W. (1986). Parking design. Traffic Engineering and Control, 12(27), 606–613.
Young, W. & Thompson R. (1987). PARKSIM1 Data presentation and evaluation. Traffic
Engineering and Control, 5(28), 294–297.

Auteursrechtelijke overeenkomst
Ik/wij verlenen het wereldwijde auteursrecht voor de ingediende eindverhandeling:
Micro-Simulation of Car Drivers' Movements at Parking Lots
Richting: Master of Transportation Sciences-Mobility Management
Jaar: 2015
in alle mogelijke mediaformaten, - bestaande en in de toekomst te ontwikkelen - , aan de
Universiteit Hasselt.
Niet tegenstaand deze toekenning van het auteursrecht aan de Universiteit Hasselt
behoud ik als auteur het recht om de eindverhandeling, - in zijn geheel of gedeeltelijk -,
vrij te reproduceren, (her)publiceren of distribueren zonder de toelating te moeten
verkrijgen van de Universiteit Hasselt.
Ik bevestig dat de eindverhandeling mijn origineel werk is, en dat ik het recht heb om de
rechten te verlenen die in deze overeenkomst worden beschreven. Ik verklaar tevens dat
de eindverhandeling, naar mijn weten, het auteursrecht van anderen niet overtreedt.
Ik verklaar tevens dat ik voor het materiaal in de eindverhandeling dat beschermd wordt
door het auteursrecht, de nodige toelatingen heb verkregen zodat ik deze ook aan de
Universiteit Hasselt kan overdragen en dat dit duidelijk in de tekst en inhoud van de
eindverhandeling werd genotificeerd.
Universiteit Hasselt zal mij als auteur(s) van de eindverhandeling identificeren en zal geen
wijzigingen aanbrengen aan de eindverhandeling, uitgezonderd deze toegelaten door deze
overeenkomst.
Voor akkoord,
Vo, Thi Thuy An
Datum: 2/06/2015


