
Bank Name BE - KBC Group NV
LEI Code 6B2PBRV1FCJDMR45RZ53
BE
NUK_WL_NR_XX
version
1809014
No restructuring
2014 EU-wide Stress Test
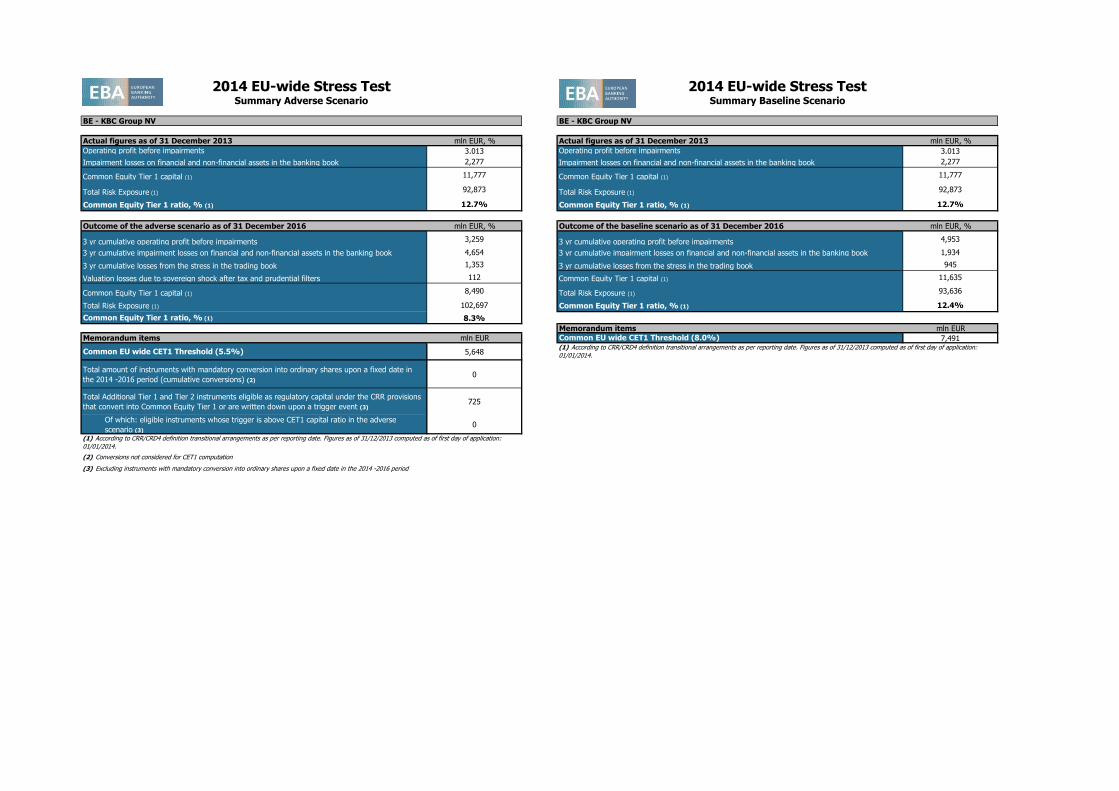
Actual figures as of 31 December 2013 mln EUR, % Actual figures as of 31 December 2013 mln EUR, %
Operating profit before impairments 3,013 Operating profit before impairments 3,013
Impairment losses on financial and non-financial assets in the banking book 2,277 Impairment losses on financial and non-financial assets in the banking book 2,277
Common Equity Tier 1 capital (1) 11,777 Common Equity Tier 1 capital (1) 11,777
Total Risk Exposure (1) 92,873 Total Risk Exposure (1) 92,873
Common Equity Tier 1 ratio, % (1) 12.7% Common Equity Tier 1 ratio, % (1) 12.7%
Outcome of the adverse scenario as of 31 December 2016 mln EUR, % Outcome of the baseline scenario as of 31 December 2016 mln EUR, %
3 yr cumulative operating profit before impairments 3,259 3 yr cumulative operating profit before impairments 4,953
3 yr cumulative impairment losses on financial and non-financial assets in the banking book 4,654 3 yr cumulative impairment losses on financial and non-financial assets in the banking book 1,934
3 yr cumulative losses from the stress in the trading book 1,353 3 yr cumulative losses from the stress in the trading book 945
Valuation losses due to sovereign shock after tax and prudential filters 112 Common Equity Tier 1 capital (1) 11,635
Common Equity Tier 1 capital (1) 8,490 Total Risk Exposure (1) 93,636
Total Risk Exposure (1) 102,697 Common Equity Tier 1 ratio, % (1) 12.4%
Common Equity Tier 1 ratio, % (1) 8.3%
Memorandum items mln EUR
Memorandum items mln EUR Common EU wide CET1 Threshold (8.0%) 7,491
Common EU wide CET1 Threshold (5.5%) 5,648
Total amount of instruments with mandatory conversion into ordinary shares upon a fixed date in
the 2014 -2016 period (cumulative conversions) (2)0
Total Additional Tier 1 and Tier 2 instruments eligible as regulatory capital under the CRR provisions
that convert into Common Equity Tier 1 or are written down upon a trigger event (3)725
Of which: eligible instruments whose trigger is above CET1 capital ratio in the adverse
scenario (3)0
(2) Conversions not considered for CET1 computation
(3) Excluding instruments with mandatory conversion into ordinary shares upon a fixed date in the 2014 -2016 period
(1) According to CRR/CRD4 definition transitional arrangements as per reporting date. Figures as of 31/12/2013 computed as of first day of application:
01/01/2014.
2014 EU-wide Stress Test 2014 EU-wide Stress TestSummary Baseline Scenario
BE - KBC Group NV
(1) According to CRR/CRD4 definition transitional arrangements as per reporting date. Figures as of 31/12/2013 computed as of first day of application:
01/01/2014.
Summary Adverse Scenario
BE - KBC Group NV

2014 EU-wide Stress TestCredit Risk
(mln EUR, %)
Non-defaulted Defaulted Non-defaulted Defaulted Non-defaulted Defaulted Non-defaulted Defaulted Non-defaulted Defaulted Non-defaulted Defaulted Non-defaulted Defaulted Non-defaulted Defaulted Non-defaulted Defaulted Impairment
rate
Stock of
Provisions
Coverage Ratio -
Default Stock
Impairment
rate
Stock of
Provisions
Coverage
Ratio - Default
Stock
Impairment
rate
Stock of
Provisions
Coverage
Ratio - Default
Stock
Impairment rateStock of
Provisions
Coverage
Ratio - Default
Stock
Impairment
rate
Stock of
Provisions
Coverage
Ratio - Default
Stock
Impairment
rate
Stock of
Provisions
Coverage
Ratio - Default
Stock
Central banks and central governments 4,678 2 46,112 0 1,762 0 3,940 0 2,357 0 15 0 0 0 2 0 0 0 0.00% 14 0.33% 0.00% 26 0.16% 0.00% 37 0.11% 0.00% 18 2.58% 0.01% 36 2.92% 0.01% 53 3.03%
Institutions 1,747 0 11,843 20 386 0 401 0 2,245 79 223 0 0 0 7 6 2 0 0.90% 102 90.16% 0.80% 179 92.77% 0.71% 247 93.66% 1.06% 118 88.83% 1.12% 225 90.94% 1.17% 336 91.74%
Corporates 4,258 2,366 48,566 3,860 3,095 269 3,507 0 20,360 403 2,628 192 48 1,121 69 1,616 24 129 0.50% 3,505 40.14% 0.48% 3,780 38.28% 0.44% 4,028 36.89% 0.67% 3,921 42.90% 0.84% 4,416 39.78% 0.86% 4,884 37.63%
Corporates - Of Which: Specialised Lending 611 1,318 5,731 1,170 379 30 651 0 2,732 83 379 22 19 626 8 329 0 11 - 0 - - 0 - - 0 - - 0 - - 0 - - 0 -
Corporates - Of Which: SME 1,438 805 15,824 1,483 638 69 1,169 0 5,798 144 561 38 14 386 18 667 4 47 - 0 - - 0 - - 0 - - 0 - - 0 - - 0 -
Retail 0 16 65,529 7,119 3,611 148 0 0 12,899 1,957 2,070 79 0 0 159 2,382 26 87 0.49% 3,369 32.67% 0.33% 3,618 31.44% 0.30% 3,830 30.44% 0.83% 4,151 38.40% 0.87% 4,775 36.05% 0.96% 5,421 34.21%
Retail - Secured on real estate property 74.4% 0 0 54,722 6,438 1,841 59 0 0 10,275 1,789 786 47 0 0 135 1,992 2 20 0.50% 2,805 30.31% 0.30% 2,987 29.09% 0.26% 3,133 28.07% 0.83% 3,471 35.95% 0.83% 3,959 33.78% 0.89% 4,454 32.03%
Retail - Secured on real estate property - Of
Which: SME77.2% 0 0 7,545 122 23 0 0 0 760 0 9 0 0 0 7 9 0 0 0.14% 27 7.49% 0.14% 37 7.57% 0.15% 49 7.65% 0.39% 56 14.89% 0.54% 96 14.37% 0.69% 145 14.14%
Retail - Secured on real estate property - Of
Which: non-SME74.0% 0 0 47,177 6,316 1,817 59 0 0 9,515 1,789 777 47 0 0 128 1,982 2 20 0.55% 2,778 31.05% 0.32% 2,949 30.06% 0.27% 3,085 29.21% 0.90% 3,414 36.77% 0.87% 3,863 34.94% 0.93% 4,309 33.47%
Retail - Qualifying Revolving 0 0 0 0 0 0 0 0 0 0 0 0 0 0 1 0 0 0 - 1 - - 1 - - 1 - - 1 - - 1 - - 1 -
Retail - Other Retail 0 16 10,807 681 1,770 89 0 0 2,624 169 1,284 32 0 0 23 390 23 68 0.47% 563 53.33% 0.46% 630 50.82% 0.47% 696 48.97% 0.84% 679 58.93% 1.08% 814 53.50% 1.26% 966 49.80%
Retail - Other Retail - Of Which: SME 0 0 6,414 536 1,110 42 0 0 1,558 58 799 26 0 0 15 300 16 26 0.50% 395 51.26% 0.51% 442 48.85% 0.52% 487 47.06% 0.98% 482 56.91% 1.21% 571 51.43% 1.37% 668 47.71%
Retail - Other Retail - Of Which: non-SME 0 16 4,393 145 660 47 0 0 1,066 111 486 6 0 0 8 90 8 42 0.42% 169 59.03% 0.40% 189 56.22% 0.40% 209 54.16% 0.64% 197 64.63% 0.90% 243 59.19% 1.10% 298 55.31%
Equity 0 0 0 0 171 2 0 0 0 0 202 1 0 0 0 0 0 1 0.00% 1 10.52% 0.00% 1 6.24% 0.00% 1 4.68% 0.00% 1 10.52% 0.00% 1 6.24% 0.00% 1 4.68%
Securitisation 1,460 0 0 0 0 0 3,277 0 0 0 0 0 0 0 0 0 0 0
Other non-credit obligation assets 524 0 9,647 0 1,330 0 698 0 6,876 0 608 0 0 0 0 0 0 0
TOTAL 12,667 2,384 181,697 10,999 10,354 419 11,823 0 44,737 2,439 5,747 273 48 1,121 237 4,004 52 217 0.42% 6,991 36.38% 0.34% 7,603 35.03% 0.31% 8,143 33.97% 0.63% 8,208 40.70% 0.71% 9,453 38.14% 0.75% 10,696 36.28%
Securitisation and re-securitisations positions deducted from capital * 0 0 0 0 0 0 0 0 0 0 0 0
(mln EUR, %)Non-defaulted Defaulted Non-defaulted Defaulted Non-defaulted Defaulted Non-defaulted Defaulted Non-defaulted Defaulted Non-defaulted Defaulted Non-defaulted Defaulted Non-defaulted Defaulted Non-defaulted Defaulted
Impairment
rate
Stock of
Provisions
Coverage Ratio -
Default Stock
Impairment
rate
Stock of
Provisions
Coverage
Ratio - Default
Stock
Impairment
rate
Stock of
Provisions
Coverage
Ratio - Default
Stock
Impairment rateStock of
Provisions
Coverage
Ratio - Default
Stock
Impairment
rate
Stock of
Provisions
Coverage
Ratio - Default
Stock
Impairment
rate
Stock of
Provisions
Coverage
Ratio - Default
Stock
Central banks and central governments 216 0 22,012 0 50 0 20 0 1,236 0 3 0 0 0 1 0 0 0 0.00% 2 81.81% 0.00% 4 0.07% 0.00% 5 0.04% 0.01% 3 24.46% 0.01% 8 24.44% 0.01% 12 24.44%
Institutions 4 0 727 0 102 0 0 0 96 0 35 0 0 0 0 0 0 0 0.00% 0 95.93% 0.00% 0 95.70% 0.00% 0 95.47% 0.12% 1 27.30% 0.16% 2 24.94% 0.15% 2 24.31%
Corporates 0 27 29,165 1,902 1,050 63 0 0 11,452 39 818 35 0 6 47 791 6 0 0.29% 1,105 33.78% 0.31% 1,220 32.03% 0.31% 1,331 30.72% 0.43% 1,213 34.90% 0.59% 1,440 33.00% 0.66% 1,660 31.20%
Corporates - Of Which: Specialised Lending 0 0 2,583 287 0 0 0 0 1,131 0 0 0 0 0 4 41 0 0 - 0 - - 0 - - 0 - - 0 - - 0 - - 0 -
Corporates - Of Which: SME 0 27 12,179 1,226 0 0 0 0 4,679 30 0 0 0 6 12 531 0 0 - 0 - - 0 - - 0 - - 0 - - 0 - - 0 -
Retail 0 0 46,071 856 227 0 0 0 5,330 69 171 0 0 0 21 364 0 0 0.12% 442 32.67% 0.12% 505 28.45% 0.12% 566 25.92% 0.27% 627 40.94% 0.37% 800 33.40% 0.48% 1,017 29.25%
Retail - Secured on real estate property 61.5% 0 0 37,425 312 0 0 0 0 3,670 67 0 0 0 0 13 59 0 0 0.07% 99 13.89% 0.06% 123 12.07% 0.06% 146 11.10% 0.21% 220 26.80% 0.30% 333 22.45% 0.40% 479 20.58%
Retail - Secured on real estate property - Of
Which: SME61.5% 0 0 7,545 122 0 0 0 0 760 0 0 0 0 0 7 9 0 0 0.14% 26 7.43% 0.14% 37 7.50% 0.15% 48 7.58% 0.38% 56 14.84% 0.54% 95 14.32% 0.68% 144 14.10%
Retail - Secured on real estate property - Of
Which: non-SME61.5% 0 0 29,881 191 0 0 0 0 2,909 67 0 0 0 0 6 50 0 0 0.05% 73 18.68% 0.05% 86 15.69% 0.04% 98 14.03% 0.16% 164 36.02% 0.24% 238 28.84% 0.33% 335 25.57%
Retail - Qualifying Revolving 0 0 0 0 0 0 0 0 0 0 0 0 0 0 0 0 0 0 - 0 - - 0 - - 0 - - 0 - - 0 - - 0 -
Retail - Other Retail 0 0 8,646 544 227 0 0 0 1,660 2 171 0 0 0 9 304 0 0 0.33% 343 50.31% 0.34% 382 47.74% 0.35% 420 45.80% 0.53% 406 56.29% 0.69% 467 50.41% 0.83% 538 46.26%
Retail - Other Retail - Of Which: SME 0 0 5,719 483 0 0 0 0 1,239 2 0 0 0 0 6 265 0 0 0.38% 293 49.26% 0.40% 325 46.85% 0.41% 355 44.99% 0.62% 346 55.11% 0.76% 389 49.21% 0.88% 437 44.93%
Retail - Other Retail - Of Which: non-SME 0 0 2,926 61 227 0 0 0 421 0 171 0 0 0 3 39 0 0 0.24% 50 57.83% 0.24% 57 53.67% 0.24% 65 50.92% 0.38% 60 64.53% 0.56% 78 57.62% 0.73% 101 53.29%
Equity 0 0 0 0 99 0 0 0 0 0 116 0 0 0 0 0 0 0 0.00% 0 - 0.00% 0 - 0.00% 0 - 0.00% 0 - 0.00% 0 - 0.00% 0 -
Securitisation 0 0 0 0 0 0 0 0 0 0 0 0 0 0 0 0 0 0
Other non-credit obligation assets 0 0 8,502 0 939 0 0 0 5,130 0 309 0 0 0 0 0 0 0
TOTAL 220 27 106,477 2,758 2,468 63 21 0 23,244 108 1,452 35 0 6 69 1,155 7 0 0.15% 1,549 33.45% 0.15% 1,729 30.86% 0.15% 1,903 29.07% 0.27% 1,844 36.77% 0.37% 2,249 33.12% 0.44% 2,692 30.40%
Securitisation and re-securitisations positions deducted from capital * 0 0 0 0 0 0 0 0 0 0 0 0
(mln EUR, %)Non-defaulted Defaulted Non-defaulted Defaulted Non-defaulted Defaulted Non-defaulted Defaulted Non-defaulted Defaulted Non-defaulted Defaulted Non-defaulted Defaulted Non-defaulted Defaulted Non-defaulted Defaulted
Impairment
rate
Stock of
Provisions
Coverage Ratio -
Default Stock
Impairment
rate
Stock of
Provisions
Coverage
Ratio - Default
Stock
Impairment
rate
Stock of
Provisions
Coverage
Ratio - Default
Stock
Impairment rateStock of
Provisions
Coverage
Ratio - Default
Stock
Impairment
rate
Stock of
Provisions
Coverage
Ratio - Default
Stock
Impairment
rate
Stock of
Provisions
Coverage
Ratio - Default
Stock
Central banks and central governments 5 0 12,641 0 0 0 1 0 373 0 0 0 0 0 0 0 0 0 0.00% 0 - 0.00% 0 0.00% 0.00% 1 0.00% 0.00% 0 0.00% 0.00% 0 0.00% 0.00% 1 0.00%
Institutions 633 0 1,138 0 42 0 101 0 211 0 30 0 0 0 3 0 0 0 0.00% 3 - 0.00% 3 0.00% 0.00% 3 0.00% 0.00% 3 0.00% 0.00% 3 0.00% 0.00% 3 0.00%
Corporates 211 2 7,707 338 171 3 154 0 2,657 360 168 3 0 0 9 187 1 0 0.36% 227 51.26% 0.36% 255 48.41% 0.35% 282 46.38% 0.47% 271 54.07% 0.68% 325 45.14% 0.54% 367 41.46%
Corporates - Of Which: Specialised Lending 22 1 1,111 78 17 0 22 0 493 83 17 0 0 0 1 21 0 0 - 0 - - 0 - - 0 - - 0 - - 0 - - 0 -
Corporates - Of Which: SME 23 0 3,134 184 84 0 16 0 860 110 81 0 0 0 5 116 0 0 - 0 - - 0 - - 0 - - 0 - - 0 - - 0 -
Retail 0 0 10,498 438 79 4 0 0 3,349 166 56 0 0 0 26 188 12 0 0.33% 275 40.85% 0.32% 308 37.78% 0.32% 341 35.72% 0.60% 329 43.52% 0.84% 434 40.86% 0.99% 551 39.77%
Retail - Secured on real estate property 59.2% 0 0 8,478 315 3 0 0 0 2,480 0 1 0 0 0 13 111 0 0 0.22% 156 34.46% 0.22% 175 31.35% 0.22% 193 29.26% 0.25% 170 34.67% 0.40% 221 32.82% 0.47% 276 32.25%
Retail - Secured on real estate property - Of
Which: SME0.0% 0 0 0 0 0 0 0 0 0 0 0 0 0 0 0 0 0 0 - 0 - - 0 - - 0 - - 0 - - 0 - - 0 -
Retail - Secured on real estate property - Of
Which: non-SME59.2% 0 0 8,478 315 3 0 0 0 2,480 0 1 0 0 0 13 111 0 0 0.22% 156 34.46% 0.22% 175 31.35% 0.22% 193 29.26% 0.25% 170 34.67% 0.40% 221 32.82% 0.47% 276 32.25%
Retail - Qualifying Revolving 0 0 0 0 0 0 0 0 0 0 0 0 0 0 0 0 0 0 - 0 - - 0 - - 0 - - 0 - - 0 - - 0 -
Retail - Other Retail 0 0 2,020 123 76 4 0 0 870 166 55 0 0 0 13 77 12 0 0.76% 118 57.00% 0.73% 133 54.35% 0.75% 149 52.49% 1.98% 160 61.34% 2.66% 213 55.50% 3.21% 275 52.40%
Retail - Other Retail - Of Which: SME 0 0 695 53 76 4 0 0 319 55 55 0 0 0 8 35 11 0 1.06% 64 57.12% 1.06% 72 53.61% 1.06% 80 51.36% 3.88% 96 61.64% 5.18% 132 55.12% 6.29% 171 52.16%
Retail - Other Retail - Of Which: non-SME 0 0 1,325 70 0 0 0 0 550 111 0 0 0 0 5 42 0 0 0.58% 54 56.90% 0.54% 61 55.05% 0.58% 69 53.60% 0.88% 64 60.96% 1.30% 81 56.06% 1.68% 103 52.80%
Equity 0 0 0 0 27 0 0 0 0 0 27 0 0 0 0 0 0 0 0.00% 0 0.00% 0.00% 0 0.00% 0.00% 0 0.00% 0.00% 0 0.00% 0.00% 0 0.00% 0.00% 0 0.00%
Securitisation 0 0 0 0 0 0 0 0 0 0 0 0 0 0 0 0 0 0
Other non-credit obligation assets 0 0 1,131 0 125 0 0 0 1,662 0 125 0 0 0 0 0 0 0
TOTAL 850 2 33,114 776 444 7 255 0 8,252 526 407 3 0 0 38 375 12 0 0.25% 505 45.03% 0.24% 567 41.85% 0.24% 628 39.69% 0.40% 604 47.73% 0.56% 763 42.39% 0.57% 922 40.17%
Securitisation and re-securitisations positions deducted from capital * 0 0 0 0 0 0 0 0 0 0 0 0
(mln EUR, %)Non-defaulted Defaulted Non-defaulted Defaulted Non-defaulted Defaulted Non-defaulted Defaulted Non-defaulted Defaulted Non-defaulted Defaulted Non-defaulted Defaulted Non-defaulted Defaulted Non-defaulted Defaulted
Impairment
rate
Stock of
Provisions
Coverage Ratio -
Default Stock
Impairment
rate
Stock of
Provisions
Coverage
Ratio - Default
Stock
Impairment
rate
Stock of
Provisions
Coverage
Ratio - Default
Stock
Impairment rateStock of
Provisions
Coverage
Ratio - Default
Stock
Impairment
rate
Stock of
Provisions
Coverage
Ratio - Default
Stock
Impairment
rate
Stock of
Provisions
Coverage
Ratio - Default
Stock
Central banks and central governments 467 0 0 0 0 0 281 0 0 0 0 0 0 0 0 0 0 0 0.00% 0 - 0.00% 1 0.00% 0.00% 1 0.00% 0.00% 1 0.00% 0.00% 1 0.00% 0.00% 2 0.00%
Institutions 18 0 2 0 0 0 28 0 4 0 0 0 0 0 0 0 0 0 0.00% 0 - 0.00% 0 0.00% 0.00% 0 0.00% 0.00% 0 0.00% 0.00% 0 0.00% 0.00% 0 0.00%
Corporates 1,047 1,897 771 41 0 0 1,021 0 222 0 0 0 31 939 0 1 0 0 2.16% 1,056 48.45% 1.35% 1,069 47.97% 0.32% 1,072 47.87% 2.57% 1,207 55.58% 2.38% 1,231 54.75% 2.19% 1,251 54.08%
Corporates - Of Which: Specialised Lending 521 1,113 158 8 0 0 582 0 94 0 0 0 19 564 0 0 0 0 - 0 - - 0 - - 0 - - 0 - - 0 - - 0 -
Corporates - Of Which: SME 382 660 6 0 0 0 336 0 5 0 0 0 11 319 0 0 0 0 - 0 - - 0 - - 0 - - 0 - - 0 - - 0 -
Retail 0 0 6,663 5,067 0 0 0 0 3,158 1,655 0 0 0 0 101 1,539 0 0 3.04% 2,182 31.35% 1.56% 2,286 31.27% 1.26% 2,358 31.11% 4.57% 2,597 36.68% 4.32% 2,844 36.13% 4.85% 3,067 35.54%
Retail - Secured on real estate property 116.6% 0 0 6,663 5,067 0 0 0 0 3,158 1,655 0 0 0 0 101 1,539 0 0 3.04% 2,182 31.35% 1.56% 2,286 31.27% 1.26% 2,358 31.11% 4.57% 2,597 36.68% 4.32% 2,844 36.13% 4.85% 3,067 35.54%
Retail - Secured on real estate property - Of
Which: SME0.0% 0 0 0 0 0 0 0 0 0 0 0 0 0 0 0 0 0 0 - 0 - - 0 - - 0 - - 0 - - 0 - - 0 -
Retail - Secured on real estate property - Of
Which: non-SME116.6% 0 0 6,663 5,067 0 0 0 0 3,158 1,655 0 0 0 0 101 1,539 0 0 3.04% 2,182 31.35% 1.56% 2,286 31.27% 1.26% 2,358 31.11% 4.57% 2,597 36.68% 4.32% 2,844 36.13% 4.85% 3,067 35.54%
Retail - Qualifying Revolving 0 0 0 0 0 0 0 0 0 0 0 0 0 0 0 0 0 0 - 0 - - 0 - - 0 - - 0 - - 0 - - 0 -
Retail - Other Retail 0 0 0 0 0 0 0 0 0 0 0 0 0 0 0 0 0 0 1.67% 0 46.64% 1.28% 0 42.30% 1.24% 0 39.53% 2.40% 0 51.87% 2.32% 0 45.70% 2.23% 0 42.31%
Retail - Other Retail - Of Which: SME 0 0 0 0 0 0 0 0 0 0 0 0 0 0 0 0 0 0 0.00% 0 0.00% 0.00% 0 0.00% 0.00% 0 0.00% 0.00% 0 0.00% 0.00% 0 0.00% 0.00% 0 0.00%
Retail - Other Retail - Of Which: non-SME 0 0 0 0 0 0 0 0 0 0 0 0 0 0 0 0 0 0 2.23% 0 47.61% 1.75% 0 43.02% 1.73% 0 40.10% 3.19% 0 52.87% 3.19% 0 46.36% 3.19% 0 42.81%
Equity 0 0 0 0 0 0 0 0 0 0 0 0 0 0 0 0 0 0 0.00% 0 - 0.00% 0 - 0.00% 0 - 0.00% 0 - 0.00% 0 - 0.00% 0 -
Securitisation 157 0 0 0 0 0 189 0 0 0 0 0 0 0 0 0 0 0
Other non-credit obligation assets 98 0 14 0 0 0 383 0 84 0 0 0 0 0 0 0 0 0
TOTAL 1,787 1,897 7,449 5,109 0 0 1,903 0 3,469 1,655 0 0 31 939 102 1,540 0 0 2.77% 3,238 35.61% 1.44% 3,356 35.33% 1.05% 3,431 35.08% 4.07% 3,805 41.28% 3.78% 4,076 40.39% 4.11% 4,320 39.57%
Securitisation and re-securitisations positions deducted from capital * 0 0 0 0 0 0 0 0 0 0 0 0
(mln EUR, %)Non-defaulted Defaulted Non-defaulted Defaulted Non-defaulted Defaulted Non-defaulted Defaulted Non-defaulted Defaulted Non-defaulted Defaulted Non-defaulted Defaulted Non-defaulted Defaulted Non-defaulted Defaulted
Impairment
rate
Stock of
Provisions
Coverage Ratio -
Default Stock
Impairment
rate
Stock of
Provisions
Coverage
Ratio - Default
Stock
Impairment
rate
Stock of
Provisions
Coverage
Ratio - Default
Stock
Impairment rateStock of
Provisions
Coverage
Ratio - Default
Stock
Impairment
rate
Stock of
Provisions
Coverage
Ratio - Default
Stock
Impairment
rate
Stock of
Provisions
Coverage
Ratio - Default
Stock
Central banks and central governments 3,876 2 1 0 2 0 3,578 0 1 0 0 0 0 0 0 0 0 0 0.00% 10 0.53% 0.00% 19 0.28% 0.00% 28 0.19% 0.00% 12 0.53% 0.00% 24 0.28% 0.00% 35 0.19%
Institutions 218 0 3 0 86 0 98 0 1 0 82 0 0 0 0 0 2 0 0.00% 2 0.00% 0.00% 2 0.00% 0.00% 2 0.00% 0.00% 2 0.00% 0.00% 2 0.00% 0.00% 2 0.00%
Corporates 2,253 207 78 51 232 11 1,860 0 59 0 118 2 13 105 0 9 3 10 0.47% 151 33.32% 0.47% 163 27.89% 0.58% 175 24.44% 0.57% 158 29.56% 0.73% 175 22.37% 0.60% 187 19.80%
Corporates - Of Which: Specialised Lending 0 0 75 51 0 0 0 0 55 0 0 0 0 0 0 9 0 0 - 0 - - 0 - - 0 - - 0 - - 0 - - 0 -
Corporates - Of Which: SME 983 97 0 0 107 10 755 0 0 0 35 1 0 58 0 0 3 8 - 0 - - 0 - - 0 - - 0 - - 0 - - 0 -
Retail 0 16 1,487 514 84 29 0 0 774 0 61 5 0 0 1 254 3 24 2.62% 331 42.47% 2.33% 363 38.21% 2.67% 394 35.20% 4.37% 415 47.31% 5.25% 481 40.54% 6.32% 541 36.64%
Retail - Secured on real estate property 82.9% 0 0 1,365 503 0 0 0 0 694 0 0 0 0 0 0 247 0 0 2.84% 295 41.64% 2.54% 325 37.29% 2.98% 354 34.26% 4.88% 376 46.58% 5.99% 439 39.76% 7.47% 496 35.91%
Retail - Secured on real estate property - Of
Which: SME0.0% 0 0 0 0 0 0 0 0 0 0 0 0 0 0 0 0 0 0 - 0 - - 0 - - 0 - - 0 - - 0 - - 0 -
Retail - Secured on real estate property - Of
Which: non-SME82.9% 0 0 1,365 503 0 0 0 0 694 0 0 0 0 0 0 247 0 0 2.84% 295 41.64% 2.54% 325 37.29% 2.98% 354 34.26% 4.88% 376 46.58% 5.99% 439 39.76% 7.47% 496 35.91%
Retail - Qualifying Revolving 0 0 0 0 0 0 0 0 0 0 0 0 0 0 0 0 0 0 - 0 - - 0 - - 0 - - 0 - - 0 - - 0 -
Retail - Other Retail 0 16 122 11 84 29 0 0 80 0 61 5 0 0 1 7 3 24 1.16% 36 51.74% 1.07% 38 49.50% 1.07% 40 47.73% 1.04% 39 56.48% 1.31% 42 52.23% 1.67% 45 48.42%
Retail - Other Retail - Of Which: SME 0 0 0 0 0 0 0 0 0 0 0 0 0 0 0 0 0 0 0.00% 0 0.00% 0.00% 0 0.00% 0.00% 0 0.00% 0.00% 0 0.00% 0.00% 0 0.00% 0.00% 0 0.00%
Retail - Other Retail - Of Which: non-SME 0 16 122 11 84 29 0 0 80 0 61 5 0 0 1 7 3 24 1.16% 36 51.75% 1.07% 38 49.51% 1.07% 40 47.73% 1.04% 39 56.49% 1.31% 42 52.24% 1.67% 45 48.43%
Equity 0 0 0 0 0 0 0 0 0 0 0 0 0 0 0 0 0 0 - 0 - - 0 - - 0 - - 0 - - 0 - - 0 -
Securitisation 0 0 0 0 0 0 0 0 0 0 0 0 0 0 0 0 0 0
Other non-credit obligation assets 388 0 0 0 0 0 277 0 0 0 0 0 0 0 0 0 0 0
TOTAL 6,735 226 1,568 566 404 40 5,813 0 834 0 262 7 13 105 1 263 7 33 0.80% 494 38.51% 0.69% 546 33.43% 0.76% 600 30.04% 1.26% 587 40.28% 1.37% 682 32.91% 1.32% 766 29.53%
Securitisation and re-securitisations positions deducted from capital * 0 0 0 0 0 0 0 0 0 0 0 0
(mln EUR, %)Non-defaulted Defaulted Non-defaulted Defaulted Non-defaulted Defaulted Non-defaulted Defaulted Non-defaulted Defaulted Non-defaulted Defaulted Non-defaulted Defaulted Non-defaulted Defaulted Non-defaulted Defaulted
Impairment
rate
Stock of
Provisions
Coverage Ratio -
Default Stock
Impairment
rate
Stock of
Provisions
Coverage
Ratio - Default
Stock
Impairment
rate
Stock of
Provisions
Coverage
Ratio - Default
Stock
Impairment rateStock of
Provisions
Coverage
Ratio - Default
Stock
Impairment
rate
Stock of
Provisions
Coverage
Ratio - Default
Stock
Impairment
rate
Stock of
Provisions
Coverage
Ratio - Default
Stock
Central banks and central governments 0 0 525 0 1,555 0 0 0 41 0 6 0 0 0 0 0 0 0 0.00% 0 - 0.00% 0 0.00% 0.00% 0 0.00% 0.00% 0 0.00% 0.00% 0 0.00% 0.00% 0 0.00%
Institutions 2 0 5 0 100 0 0 0 1 0 50 0 0 0 4 0 0 0 0.00% 4 100.00% 0.00% 4 97.53% 0.00% 4 95.17% 0.00% 4 97.53% 0.00% 4 95.17% 0.00% 4 92.93%
Corporates 0 0 208 0 1,444 111 0 0 69 0 1,343 65 0 0 0 0 3 54 1.57% 83 48.59% 1.57% 108 48.63% 1.56% 131 48.64% 1.85% 90 51.02% 2.11% 126 52.59% 2.10% 158 52.70%
Corporates - Of Which: Specialised Lending 0 0 21 0 358 30 0 0 16 0 358 22 0 0 0 0 0 11 - 0 - - 0 - - 0 - - 0 - - 0 - - 0 -
Corporates - Of Which: SME 0 0 19 0 439 53 0 0 1 0 439 30 0 0 0 0 1 27 - 0 - - 0 - - 0 - - 0 - - 0 - - 0 -
Retail 0 0 248 14 2,877 94 0 0 95 0 1,551 51 0 0 1 6 10 45 0.37% 73 40.03% 0.35% 84 36.73% 0.33% 94 35.13% 0.53% 92 47.97% 0.65% 113 42.33% 0.67% 133 38.48%
Retail - Secured on real estate property 60.1% 0 0 232 11 1,698 53 0 0 83 0 690 40 0 0 0 4 2 12 0.15% 22 19.99% 0.13% 24 17.36% 0.11% 26 15.94% 0.31% 35 30.24% 0.36% 42 24.91% 0.41% 50 21.91%
Retail - Secured on real estate property - Of
Which: SME0.0% 0 0 0 0 0 0 0 0 0 0 0 0 0 0 0 0 0 0 - 0 - - 0 - - 0 - - 0 - - 0 - - 0 -
Retail - Secured on real estate property - Of
Which: non-SME60.1% 0 0 232 11 1,698 53 0 0 83 0 690 40 0 0 0 4 2 12 0.15% 22 19.99% 0.13% 24 17.36% 0.11% 26 15.94% 0.31% 35 30.24% 0.36% 42 24.91% 0.41% 50 21.91%
Retail - Qualifying Revolving 0 0 0 0 0 0 0 0 0 0 0 0 0 0 0 0 0 0 - 0 - - 0 - - 0 - - 0 - - 0 - - 0 -
Retail - Other Retail 0 0 16 3 1,178 42 0 0 12 0 861 10 0 0 0 2 8 33 0.72% 51 73.31% 0.71% 59 70.08% 0.70% 67 67.98% 0.90% 56 79.33% 1.11% 71 76.04% 1.08% 83 73.45%
Retail - Other Retail - Of Which: SME 0 0 0 0 938 23 0 0 0 0 689 10 0 0 0 0 4 15 0.73% 26 62.70% 0.73% 33 61.50% 0.73% 39 60.79% 0.80% 28 66.20% 0.92% 37 66.94% 0.92% 46 66.15%
Retail - Other Retail - Of Which: non-SME 0 0 16 3 240 19 0 0 12 0 172 0 0 0 0 2 3 18 0.70% 25 88.50% 0.64% 27 84.66% 0.58% 28 81.89% 1.24% 29 97.09% 1.82% 34 89.28% 1.69% 38 84.73%
Equity 0 0 0 0 0 1 0 0 0 0 0 0 0 0 0 0 0 1 0.00% 1 - 0.00% 1 - 0.00% 1 - 0.00% 1 - 0.00% 1 - 0.00% 1 -
Securitisation 0 0 0 0 0 0 0 0 0 0 0 0 0 0 0 0 0 0
Other non-credit obligation assets 0 0 0 0 195 0 0 0 0 0 127 0 0 0 0 0 0 0
TOTAL 2 0 987 14 6,171 206 0 0 206 0 3,077 116 0 0 4 7 13 100 0.62% 160 44.66% 0.60% 196 43.08% 0.58% 230 42.37% 0.78% 187 49.72% 0.90% 243 47.52% 0.90% 296 45.41%
Securitisation and re-securitisations positions deducted from capital * 0 0 0 0 0 0 0 0 0 0 0 0
as of 31/12/2016 as of 31/12/2014 as of 31/12/2015 as of 31/12/2016
Slovakia
F-IRB A-IRB STA as of 31/12/2014 as of 31/12/2015LTV % (as of
31/12/2013)
Exposure values (as of 31/12/2013) Risk exposure amounts (as of 31/12/2013) Value adjustments and provisions (as of 31/12/2013) Baseline Scenario Adverse Scenario
F-IRB A-IRB STA F-IRB A-IRB STA
LTV % (as of
31/12/2013)
Exposure values (as of 31/12/2013) Risk exposure amounts (as of 31/12/2013) Value adjustments and provisions (as of 31/12/2013) Baseline Scenario Adverse Scenario
F-IRB A-IRB STA F-IRB A-IRB STA F-IRB as of 31/12/2014 as of 31/12/2015 as of 31/12/2016A-IRB STA as of 31/12/2014 as of 31/12/2015 as of 31/12/2016
LTV % (as of
31/12/2013)
Exposure values (as of 31/12/2013) Risk exposure amounts (as of 31/12/2013) Value adjustments and provisions (as of 31/12/2013) Baseline Scenario Adverse Scenario
F-IRB A-IRB STA F-IRB A-IRB STA F-IRB A-IRB as of 31/12/2015 as of 31/12/2016STA as of 31/12/2014 as of 31/12/2015 as of 31/12/2016 as of 31/12/2014
Risk exposure amounts (as of 31/12/2013)
Baseline Scenario Adverse Scenario
F-IRB A-IRB STA F-IRB A-IRB STA F-IRB A-IRB STA as of 31/12/2014 as of 31/12/2015 as of 31/12/2016 as of 31/12/2014 as of 31/12/2015 as of 31/12/2016
as of 31/12/2016
Belgium
LTV % (as of
31/12/2013)
Exposure values (as of 31/12/2013) Risk exposure amounts (as of 31/12/2013) Value adjustments and provisions (as of 31/12/2013)
Adverse Scenario
F-IRB A-IRB STA F-IRB A-IRB STA F-IRB A-IRB STA as of 31/12/2014 as of 31/12/2015 as of 31/12/2016 as of 31/12/2014 as of 31/12/2015 as of 31/12/2016LTV % (as of
31/12/2013)
Exposure values (as of 31/12/2013)
BE - KBC Group NV
(*) Refers to the part of Securitization exposure that is deducted from capital and is not included in RWA
Value adjustments and provisions (as of 31/12/2013) Baseline Scenario
LTV % (as of
31/12/2013)
Exposure values (as of 31/12/2013) Risk exposure amounts (as of 31/12/2013) Value adjustments and provisions (as of 31/12/2013) Adverse Scenario
F-IRB A-IRB STA F-IRB A-IRB STA F-IRB A-IRB STA
Baseline Scenario
as of 31/12/2014 as of 31/12/2015 as of 31/12/2016 as of 31/12/2014 as of 31/12/2015
(*) Refers to the part of Securitization exposure that is deducted from capital and is not included in RWA
(*) Refers to the part of Securitization exposure that is deducted from capital and is not included in RWA
(*) Refers to the part of Securitization exposure that is deducted from capital and is not included in RWA
(*) Refers to the part of Securitization exposure that is deducted from capital and is not included in RWA
(*) Refers to the part of Securitization exposure that is deducted from capital and is not included in RWA
Czech Republic
Ireland
Hungary

2014 EU-wide Stress TestCredit Risk
LTV % (as of
31/12/2013)
Exposure values (as of 31/12/2013) Risk exposure amounts (as of 31/12/2013) Value adjustments and provisions (as of 31/12/2013) Adverse ScenarioBaseline Scenario
(mln EUR, %)Non-defaulted Defaulted Non-defaulted Defaulted Non-defaulted Defaulted Non-defaulted Defaulted Non-defaulted Defaulted Non-defaulted Defaulted Non-defaulted Defaulted Non-defaulted Defaulted Non-defaulted Defaulted
Impairment
rate
Stock of
Provisions
Coverage Ratio -
Default Stock
Impairment
rate
Stock of
Provisions
Coverage
Ratio - Default
Stock
Impairment
rate
Stock of
Provisions
Coverage
Ratio - Default
Stock
Impairment rateStock of
Provisions
Coverage
Ratio - Default
Stock
Impairment
rate
Stock of
Provisions
Coverage
Ratio - Default
Stock
Impairment
rate
Stock of
Provisions
Coverage
Ratio - Default
Stock
Central banks and central governments 10 0 1,924 0 0 0 1 0 93 0 0 0 0 0 0 0 0 0 0.00% 0 - 0.00% 0 0.00% 0.00% 0 0.00% 0.00% 0 35.04% 0.00% 0 35.04% 0.00% 0 35.04%
Institutions 189 0 1,295 0 35 0 33 0 306 0 18 0 0 0 0 0 0 0 0.00% 0 - 0.00% 0 0.00% 0.00% 0 0.00% 0.07% 0 31.44% 0.08% 1 31.44% 0.08% 1 31.44%
Corporates 0 1 1,800 112 0 0 0 0 883 0 0 0 0 0 2 26 0 0 0.43% 36 22.52% 0.41% 43 22.05% 0.40% 50 21.72% 0.62% 44 25.86% 0.74% 56 25.15% 0.91% 72 24.67%
Corporates - Of Which: Specialised Lending 0 1 151 6 0 0 0 0 75 0 0 0 0 0 0 2 0 0 - 0 - - 0 - - 0 - - 0 - - 0 - - 0 -
Corporates - Of Which: SME 0 0 114 11 0 0 0 0 82 0 0 0 0 0 0 2 0 0 - 0 - - 0 - - 0 - - 0 - - 0 - - 0 -
Retail 0 0 12 0 0 0 0 0 4 0 0 0 0 0 0 0 0 0 0.17% 0 13.50% 0.19% 0 14.96% 0.19% 0 15.82% 0.38% 0 23.61% 0.55% 0 27.35% 0.72% 0 29.50%
Retail - Secured on real estate property 66.2% 0 0 12 0 0 0 0 0 4 0 0 0 0 0 0 0 0 0 0.17% 0 18.64% 0.19% 0 18.76% 0.19% 0 18.82% 0.38% 0 33.67% 0.55% 0 33.91% 0.73% 0 34.02%
Retail - Secured on real estate property - Of
Which: SME0.0% 0 0 0 0 0 0 0 0 0 0 0 0 0 0 0 0 0 0 - 0 - - 0 - - 0 - - 0 - - 0 - - 0 -
Retail - Secured on real estate property - Of
Which: non-SME66.2% 0 0 12 0 0 0 0 0 4 0 0 0 0 0 0 0 0 0 0.17% 0 18.64% 0.19% 0 18.76% 0.19% 0 18.82% 0.38% 0 33.67% 0.55% 0 33.91% 0.73% 0 34.02%
Retail - Qualifying Revolving 0 0 0 0 0 0 0 0 0 0 0 0 0 0 0 0 0 0 - 0 - - 0 - - 0 - - 0 - - 0 - - 0 -
Retail - Other Retail 0 0 0 0 0 0 0 0 0 0 0 0 0 0 0 0 0 0 0.01% 0 6.13% 0.01% 0 6.14% 0.01% 0 6.14% 0.02% 0 7.05% 0.02% 0 7.06% 0.03% 0 7.08%
Retail - Other Retail - Of Which: SME 0 0 0 0 0 0 0 0 0 0 0 0 0 0 0 0 0 0 0.02% 0 6.18% 0.02% 0 6.19% 0.02% 0 6.19% 0.04% 0 7.11% 0.05% 0 7.12% 0.07% 0 7.14%
Retail - Other Retail - Of Which: non-SME 0 0 0 0 0 0 0 0 0 0 0 0 0 0 0 0 0 0 0.00% 0 0.00% 0.00% 0 0.00% 0.00% 0 0.00% 0.00% 0 0.00% 0.00% 0 0.00% 0.00% 0 0.00%
Equity 0 0 0 0 0 0 0 0 0 0 0 0 0 0 0 0 0 0 0.00% 0 - 0.00% 0 - 0.00% 0 - 0.00% 0 - 0.00% 0 - 0.00% 0 -
Securitisation 0 0 0 0 0 0 0 0 0 0 0 0 0 0 0 0 0 0
Other non-credit obligation assets 0 0 0 0 0 0 0 0 0 0 0 0 0 0 0 0 0 0
TOTAL 200 1 5,031 112 35 0 34 0 1,285 0 18 0 0 0 3 26 0 0 0.22% 36 22.50% 0.21% 44 22.01% 0.21% 51 21.67% 0.33% 44 25.88% 0.39% 57 25.21% 0.47% 73 24.74%
Securitisation and re-securitisations positions deducted from capital * 0 0 0 0 0 0 0 0 0 0 0 0
(mln EUR, %)Non-defaulted Defaulted Non-defaulted Defaulted Non-defaulted Defaulted Non-defaulted Defaulted Non-defaulted Defaulted Non-defaulted Defaulted Non-defaulted Defaulted Non-defaulted Defaulted Non-defaulted Defaulted
Impairment
rate
Stock of
Provisions
Coverage Ratio -
Default Stock
Impairment
rate
Stock of
Provisions
Coverage
Ratio - Default
Stock
Impairment
rate
Stock of
Provisions
Coverage
Ratio - Default
Stock
Impairment rateStock of
Provisions
Coverage
Ratio - Default
Stock
Impairment
rate
Stock of
Provisions
Coverage
Ratio - Default
Stock
Impairment
rate
Stock of
Provisions
Coverage
Ratio - Default
Stock
Central banks and central governments 0 0 361 0 0 0 0 0 65 0 0 0 0 0 0 0 0 0 0.00% 0 - 0.00% 0 0.00% 0.00% 0 0.00% 0.00% 0 0.00% 0.00% 0 0.00% 0.00% 0 0.00%
Institutions 112 0 1,067 0 0 0 23 0 336 0 0 0 0 0 0 0 0 0 0.00% 0 - 0.00% 0 0.00% 0.00% 0 0.00% 0.18% 0 48.20% 0.26% 1 48.20% 0.27% 1 48.20%
Corporates 199 79 696 271 0 0 130 0 510 0 0 0 3 23 2 94 0 0 1.07% 130 31.18% 1.04% 137 29.91% 0.97% 144 29.09% 1.31% 186 44.62% 1.54% 197 41.77% 1.61% 207 39.87%
Corporates - Of Which: Specialised Lending 20 50 137 179 0 0 19 0 59 0 0 0 1 12 0 36 0 0 - 0 - - 0 - - 0 - - 0 - - 0 - - 0 -
Corporates - Of Which: SME 49 21 46 4 0 0 63 0 15 0 0 0 3 4 0 4 0 0 - 0 - - 0 - - 0 - - 0 - - 0 - - 0 -
Retail 0 0 193 204 0 0 0 0 60 67 0 0 0 0 7 21 0 0 2.00% 33 9.32% 1.91% 35 8.86% 1.91% 37 8.61% 4.28% 54 16.61% 5.02% 60 15.64% 5.49% 63 15.22%
Retail - Secured on real estate property 116.6% 0 0 193 204 0 0 0 0 60 67 0 0 0 0 7 21 0 0 2.00% 33 9.32% 1.91% 35 8.86% 1.91% 37 8.61% 4.28% 54 16.62% 5.02% 60 15.64% 5.49% 63 15.22%
Retail - Secured on real estate property - Of
Which: SME0.0% 0 0 0 0 0 0 0 0 0 0 0 0 0 0 0 0 0 0 - 0 - - 0 - - 0 - - 0 - - 0 - - 0 -
Retail - Secured on real estate property - Of
Which: non-SME116.6% 0 0 193 204 0 0 0 0 60 67 0 0 0 0 7 21 0 0 2.00% 33 9.32% 1.91% 35 8.86% 1.91% 37 8.61% 4.28% 54 16.62% 5.02% 60 15.64% 5.49% 63 15.22%
Retail - Qualifying Revolving 0 0 0 0 0 0 0 0 0 0 0 0 0 0 0 0 0 0 - 0 - - 0 - - 0 - - 0 - - 0 - - 0 -
Retail - Other Retail 0 0 0 0 0 0 0 0 0 0 0 0 0 0 0 0 0 0 0.00% 0 0.00% 0.00% 0 0.00% 0.00% 0 0.00% 0.00% 0 0.00% 0.00% 0 0.00% 0.00% 0 0.00%
Retail - Other Retail - Of Which: SME 0 0 0 0 0 0 0 0 0 0 0 0 0 0 0 0 0 0 0.00% 0 0.00% 0.00% 0 0.00% 0.00% 0 0.00% 0.00% 0 0.00% 0.00% 0 0.00% 0.00% 0 0.00%
Retail - Other Retail - Of Which: non-SME 0 0 0 0 0 0 0 0 0 0 0 0 0 0 0 0 0 0 - 0 0.00% - 0 0.00% - 0 0.00% - 0 0.00% - 0 0.00% - 0 0.00%
Equity 0 0 0 0 2 0 0 0 0 0 3 0 0 0 0 0 0 0 0.00% 0 - 0.00% 0 - 0.00% 0 - 0.00% 0 - 0.00% 0 - 0.00% 0 -
Securitisation 99 0 0 0 0 0 17 0 0 0 0 0 0 0 0 0 0 0
Other non-credit obligation assets 38 0 0 0 0 0 38 0 0 0 0 0 0 0 0 0 0 0
TOTAL 449 79 2,317 475 2 0 208 0 971 67 3 0 3 23 9 116 0 0 0.83% 163 22.38% 0.73% 172 21.21% 0.65% 181 20.57% 1.28% 240 33.13% 1.29% 257 30.73% 1.17% 272 29.53%
Securitisation and re-securitisations positions deducted from capital * 0 0 0 0 0 0 0 0 0 0 0 0
(mln EUR, %)Non-defaulted Defaulted Non-defaulted Defaulted Non-defaulted Defaulted Non-defaulted Defaulted Non-defaulted Defaulted Non-defaulted Defaulted Non-defaulted Defaulted Non-defaulted Defaulted Non-defaulted Defaulted
Impairment
rate
Stock of
Provisions
Coverage Ratio -
Default Stock
Impairment
rate
Stock of
Provisions
Coverage
Ratio - Default
Stock
Impairment
rate
Stock of
Provisions
Coverage
Ratio - Default
Stock
Impairment rateStock of
Provisions
Coverage
Ratio - Default
Stock
Impairment
rate
Stock of
Provisions
Coverage
Ratio - Default
Stock
Impairment
rate
Stock of
Provisions
Coverage
Ratio - Default
Stock
Central banks and central governments 0 0 829 0 0 0 0 0 55 0 0 0 0 0 0 0 0 0 0.00% 0 - 0.00% 0 0.00% 0.00% 1 0.00% 0.00% 0 0.00% 0.00% 1 0.00% 0.00% 1 0.00%
Institutions 158 0 143 0 0 0 9 0 51 0 0 0 0 0 0 0 0 0 0.00% 0 - 0.00% 0 0.00% 0.00% 0 0.00% 0.00% 0 0.00% 0.00% 0 0.00% 0.00% 0 0.00%
Corporates 129 0 1,362 280 0 0 279 0 407 0 0 0 0 0 1 66 0 0 0.26% 66 19.01% 0.18% 68 16.83% 0.15% 70 15.42% 0.36% 77 20.87% 0.33% 81 17.23% 0.31% 84 14.97%
Corporates - Of Which: Specialised Lending 0 0 177 109 0 0 0 0 10 0 0 0 0 0 0 18 0 0 - 0 - - 0 - - 0 - - 0 - - 0 - - 0 -
Corporates - Of Which: SME 0 0 23 0 0 0 0 0 11 0 0 0 0 0 0 0 0 0 - 0 - - 0 - - 0 - - 0 - - 0 - - 0 -
Retail 0 0 17 0 0 0 0 0 5 0 0 0 0 0 0 0 0 0 0.00% 0 29.59% 0.00% 0 29.43% 0.00% 0 29.26% 0.00% 0 29.43% 0.00% 0 29.26% 0.00% 0 29.09%
Retail - Secured on real estate property 63.3% 0 0 17 0 0 0 0 0 5 0 0 0 0 0 0 0 0 0 0.00% 0 32.49% 0.00% 0 32.29% 0.00% 0 32.09% 0.00% 0 32.29% 0.00% 0 32.09% 0.00% 0 31.89%
Retail - Secured on real estate property - Of
Which: SME0.0% 0 0 0 0 0 0 0 0 0 0 0 0 0 0 0 0 0 0 - 0 - - 0 - - 0 - - 0 - - 0 - - 0 -
Retail - Secured on real estate property - Of
Which: non-SME63.3% 0 0 17 0 0 0 0 0 5 0 0 0 0 0 0 0 0 0 0.00% 0 32.49% 0.00% 0 32.29% 0.00% 0 32.09% 0.00% 0 32.29% 0.00% 0 32.09% 0.00% 0 31.89%
Retail - Qualifying Revolving 0 0 0 0 0 0 0 0 0 0 0 0 0 0 0 0 0 0 - 0 - - 0 - - 0 - - 0 - - 0 - - 0 -
Retail - Other Retail 0 0 0 0 0 0 0 0 0 0 0 0 0 0 0 0 0 0 0.00% 0 0.00% 0.00% 0 0.00% 0.00% 0 0.00% 0.00% 0 0.00% 0.00% 0 0.00% 0.00% 0 0.00%
Retail - Other Retail - Of Which: SME 0 0 0 0 0 0 0 0 0 0 0 0 0 0 0 0 0 0 - 0 0.00% - 0 0.00% - 0 0.00% - 0 0.00% - 0 0.00% - 0 0.00%
Retail - Other Retail - Of Which: non-SME 0 0 0 0 0 0 0 0 0 0 0 0 0 0 0 0 0 0 0.00% 0 0.00% 0.00% 0 0.00% 0.00% 0 0.00% 0.00% 0 0.00% 0.00% 0 0.00% 0.00% 0 0.00%
Equity 0 0 0 0 10 0 0 0 0 0 16 0 0 0 0 0 0 0 0.00% 0 0.00% 0.00% 0 0.00% 0.00% 0 0.00% 0.00% 0 0.00% 0.00% 0 0.00% 0.00% 0 0.00%
Securitisation 429 0 0 0 0 0 2,746 0 0 0 0 0 0 0 0 0 0 0
Other non-credit obligation assets 0 0 0 0 0 0 0 0 0 0 0 0 0 0 0 0 0 0
TOTAL 715 0 2,350 280 11 0 3,034 0 517 0 16 0 0 0 1 66 0 0 0.15% 66 19.01% 0.10% 69 16.83% 0.08% 71 15.42% 0.21% 77 20.86% 0.19% 81 17.23% 0.17% 85 14.97%
Securitisation and re-securitisations positions deducted from capital * 0 0 0 0 0 0 0 0 0 0 0 0
(mln EUR, %)Non-defaulted Defaulted Non-defaulted Defaulted Non-defaulted Defaulted Non-defaulted Defaulted Non-defaulted Defaulted Non-defaulted Defaulted Non-defaulted Defaulted Non-defaulted Defaulted Non-defaulted Defaulted
Impairment
rate
Stock of
Provisions
Coverage Ratio -
Default Stock
Impairment
rate
Stock of
Provisions
Coverage
Ratio - Default
Stock
Impairment
rate
Stock of
Provisions
Coverage
Ratio - Default
Stock
Impairment rateStock of
Provisions
Coverage
Ratio - Default
Stock
Impairment
rate
Stock of
Provisions
Coverage
Ratio - Default
Stock
Impairment
rate
Stock of
Provisions
Coverage
Ratio - Default
Stock
Central banks and central governments 0 0 156 0 0 0 0 0 5 0 0 0 0 0 0 0 0 0 0.00% 0 - 0.00% 0 0.00% 0.00% 0 0.00% 0.00% 0 0.00% 0.00% 0 0.00% 0.00% 0 0.00%
Institutions 53 0 227 0 0 0 14 0 133 2 0 0 0 0 0 0 0 0 0.00% 0 72.25% 0.00% 0 72.11% 0.00% 0 71.96% 0.00% 0 72.11% 0.00% 0 71.96% 0.00% 0 71.82%
Corporates 0 0 336 37 23 0 0 0 206 0 23 0 0 0 0 4 0 1 0.19% 7 14.62% 0.07% 7 13.04% 0.03% 7 12.36% 0.24% 7 15.73% 0.08% 8 13.87% 0.02% 8 13.06%
Corporates - Of Which: Specialised Lending 0 0 86 33 5 0 0 0 78 0 5 0 0 0 0 2 0 0 - 0 - - 0 - - 0 - - 0 - - 0 - - 0 -
Corporates - Of Which: SME 0 0 51 1 0 0 0 0 25 0 0 0 0 0 0 0 0 1 - 0 - - 0 - - 0 - - 0 - - 0 - - 0 -
Retail 0 0 14 1 0 0 0 0 5 0 0 0 0 0 0 0 0 0 0.26% 0 27.57% 0.21% 0 25.38% 0.20% 0 23.91% 0.62% 0 30.26% 0.66% 0 26.66% 0.91% 1 24.26%
Retail - Secured on real estate property 61.4% 0 0 13 1 0 0 0 0 5 0 0 0 0 0 0 0 0 0 0.26% 0 27.42% 0.22% 0 25.23% 0.21% 0 23.77% 0.63% 0 30.16% 0.67% 0 26.57% 0.92% 1 24.18%
Retail - Secured on real estate property - Of
Which: SME0.0% 0 0 0 0 0 0 0 0 0 0 0 0 0 0 0 0 0 0 - 0 - - 0 - - 0 - - 0 - - 0 - - 0 -
Retail - Secured on real estate property - Of
Which: non-SME61.4% 0 0 13 1 0 0 0 0 5 0 0 0 0 0 0 0 0 0 0.26% 0 27.42% 0.22% 0 25.23% 0.21% 0 23.77% 0.63% 0 30.16% 0.67% 0 26.57% 0.92% 1 24.18%
Retail - Qualifying Revolving 0 0 0 0 0 0 0 0 0 0 0 0 0 0 0 0 0 0 - 0 - - 0 - - 0 - - 0 - - 0 - - 0 -
Retail - Other Retail 0 0 0 0 0 0 0 0 0 0 0 0 0 0 0 0 0 0 0.01% 0 40.89% 0.01% 0 40.71% 0.01% 0 40.55% 0.01% 0 40.88% 0.01% 0 40.66% 0.01% 0 40.46%
Retail - Other Retail - Of Which: SME 0 0 0 0 0 0 0 0 0 0 0 0 0 0 0 0 0 0 0.91% 0 2.67% 0.86% 0 4.49% 0.82% 0 5.82% 1.26% 0 3.59% 1.46% 0 6.35% 1.41% 0 8.20%
Retail - Other Retail - Of Which: non-SME 0 0 0 0 0 0 0 0 0 0 0 0 0 0 0 0 0 0 0.00% 0 43.18% 0.00% 0 43.16% 0.00% 0 43.14% 0.00% 0 43.18% 0.00% 0 43.16% 0.00% 0 43.14%
Equity 0 0 0 0 0 0 0 0 0 0 0 0 0 0 0 0 0 0 - 0 - - 0 - - 0 - - 0 - - 0 - - 0 -
Securitisation 0 0 0 0 0 0 0 0 0 0 0 0 0 0 0 0 0 0
Other non-credit obligation assets 0 0 0 0 0 0 0 0 0 0 0 0 0 0 0 0 0 0
TOTAL 54 0 732 38 24 0 14 0 349 2 23 0 0 0 1 4 0 1 0.17% 7 15.56% 0.07% 7 13.90% 0.03% 8 13.18% 0.22% 8 16.71% 0.09% 8 14.79% 0.04% 9 14.00%
Securitisation and re-securitisations positions deducted from capital * 0 0 0 0 0 0 0 0 0 0 0 0
(mln EUR, %)Non-defaulted Defaulted Non-defaulted Defaulted Non-defaulted Defaulted Non-defaulted Defaulted Non-defaulted Defaulted Non-defaulted Defaulted Non-defaulted Defaulted Non-defaulted Defaulted Non-defaulted Defaulted
Impairment
rate
Stock of
Provisions
Coverage Ratio -
Default Stock
Impairment
rate
Stock of
Provisions
Coverage
Ratio - Default
Stock
Impairment
rate
Stock of
Provisions
Coverage
Ratio - Default
Stock
Impairment rateStock of
Provisions
Coverage
Ratio - Default
Stock
Impairment
rate
Stock of
Provisions
Coverage
Ratio - Default
Stock
Impairment
rate
Stock of
Provisions
Coverage
Ratio - Default
Stock
Central banks and central governments 0 0 1,733 0 0 0 0 0 69 0 0 0 0 0 0 0 0 0 0.00% 0 - 0.00% 0 0.00% 0.00% 0 0.00% 0.00% 0 0.00% 0.00% 0 0.00% 0.00% 0 0.00%
Institutions 0 0 142 0 0 0 0 0 10 0 0 0 0 0 0 0 0 0 0.00% 0 0.00% 0.00% 0 0.00% 0.00% 0 0.00% 0.02% 0 18.45% 0.02% 0 18.45% 0.02% 0 18.45%
Corporates 78 0 1,088 25 0 0 28 0 870 0 0 0 0 0 1 23 0 0 0.00% 24 90.78% 0.00% 24 90.43% 0.00% 24 90.09% 0.67% 34 85.72% 0.81% 41 75.49% 0.98% 50 68.98%
Corporates - Of Which: Specialised Lending 2 0 132 3 0 0 2 0 67 0 0 0 0 0 0 1 0 0 - 0 - - 0 - - 0 - - 0 - - 0 - - 0 -
Corporates - Of Which: SME 0 0 18 0 0 0 0 0 13 0 0 0 0 0 0 0 0 0 - 0 - - 0 - - 0 - - 0 - - 0 - - 0 -
Retail 0 0 0 0 0 0 0 0 0 0 0 0 0 0 0 0 0 0 0.09% 0 19.71% 0.09% 0 19.41% 0.09% 0 19.14% 0.12% 0 19.61% 0.15% 0 19.13% 0.18% 0 18.61%
Retail - Secured on real estate property 58.0% 0 0 0 0 0 0 0 0 0 0 0 0 0 0 0 0 0 0 - 0 - - 0 - - 0 - - 0 - - 0 - - 0 -
Retail - Secured on real estate property - Of
Which: SME0.0% 0 0 0 0 0 0 0 0 0 0 0 0 0 0 0 0 0 0 - 0 - - 0 - - 0 - - 0 - - 0 - - 0 -
Retail - Secured on real estate property - Of
Which: non-SME58.0% 0 0 0 0 0 0 0 0 0 0 0 0 0 0 0 0 0 0 - 0 - - 0 - - 0 - - 0 - - 0 - - 0 -
Retail - Qualifying Revolving 0 0 0 0 0 0 0 0 0 0 0 0 0 0 0 0 0 0 - 0 - - 0 - - 0 - - 0 - - 0 - - 0 -
Retail - Other Retail 0 0 0 0 0 0 0 0 0 0 0 0 0 0 0 0 0 0 0.09% 0 19.71% 0.09% 0 19.41% 0.09% 0 19.14% 0.12% 0 19.61% 0.15% 0 19.13% 0.18% 0 18.61%
Retail - Other Retail - Of Which: SME 0 0 0 0 0 0 0 0 0 0 0 0 0 0 0 0 0 0 0.09% 0 19.72% 0.09% 0 19.43% 0.09% 0 19.15% 0.12% 0 19.62% 0.15% 0 19.15% 0.18% 0 18.62%
Retail - Other Retail - Of Which: non-SME 0 0 0 0 0 0 0 0 0 0 0 0 0 0 0 0 0 0 - 0 0.00% - 0 0.00% - 0 0.00% - 0 0.00% - 0 0.00% - 0 0.00%
Equity 0 0 0 0 16 0 0 0 0 0 22 0 0 0 0 0 0 0 0.00% 0 - 0.00% 0 - 0.00% 0 - 0.00% 0 - 0.00% 0 - 0.00% 0 -
Securitisation 0 0 0 0 0 0 0 0 0 0 0 0 0 0 0 0 0 0
Other non-credit obligation assets 0 0 0 0 0 0 0 0 0 0 0 0 0 0 0 0 0 0
TOTAL 78 0 2,963 25 16 0 28 0 949 0 22 0 0 0 1 23 0 0 0.00% 24 90.60% 0.00% 24 89.90% 0.00% 24 89.21% 0.32% 34 85.28% 0.39% 41 75.00% 0.47% 50 68.49%
Securitisation and re-securitisations positions deducted from capital * 0 0 0 0 0 0 0 0 0 0 0 0
LTV % (as of
31/12/2013)
Exposure values (as of 31/12/2013) Risk exposure amounts (as of 31/12/2013) Value adjustments and provisions (as of 31/12/2013) Baseline Scenario Adverse Scenario
F-IRB A-IRB STA F-IRB A-IRB STA as of 31/12/2016 as of 31/12/2014 as of 31/12/2015 as of 31/12/2016F-IRB A-IRB STA as of 31/12/2014 as of 31/12/2015
LTV % (as of
31/12/2013)
Exposure values (as of 31/12/2013) Risk exposure amounts (as of 31/12/2013) Value adjustments and provisions (as of 31/12/2013) Baseline Scenario Adverse Scenario
F-IRB A-IRB STA F-IRB A-IRB STA F-IRB as of 31/12/2014 as of 31/12/2015 as of 31/12/2016A-IRB STA as of 31/12/2014 as of 31/12/2015 as of 31/12/2016
LTV % (as of
31/12/2013)
Exposure values (as of 31/12/2013) Risk exposure amounts (as of 31/12/2013) Value adjustments and provisions (as of 31/12/2013) Baseline Scenario Adverse Scenario
F-IRB A-IRB STA F-IRB A-IRB STA F-IRB A-IRB as of 31/12/2015 as of 31/12/2016STA as of 31/12/2014 as of 31/12/2015 as of 31/12/2016 as of 31/12/2014
Adverse Scenario
F-IRB A-IRB STA F-IRB A-IRB STA F-IRB A-IRB STA as of 31/12/2014 as of 31/12/2015 as of 31/12/2016 as of 31/12/2014 as of 31/12/2015 as of 31/12/2016LTV % (as of
31/12/2013)
Exposure values (as of 31/12/2013) Risk exposure amounts (as of 31/12/2013) Value adjustments and provisions (as of 31/12/2013)
Adverse Scenario
F-IRB A-IRB STA F-IRB A-IRB STA F-IRB A-IRB STA as of 31/12/2014 as of 31/12/2015 as of 31/12/2016 as of 31/12/2014 as of 31/12/2015 as of 31/12/2016LTV % (as of
31/12/2013)
Exposure values (as of 31/12/2013) Risk exposure amounts (as of 31/12/2013)
Baseline Scenario
Value adjustments and provisions (as of 31/12/2013) Baseline Scenario
(*) Refers to the part of Securitization exposure that is deducted from capital and is not included in RWA
(*) Refers to the part of Securitization exposure that is deducted from capital and is not included in RWA
(*) Refers to the part of Securitization exposure that is deducted from capital and is not included in RWA
(*) Refers to the part of Securitization exposure that is deducted from capital and is not included in RWA
(*) Refers to the part of Securitization exposure that is deducted from capital and is not included in RWA
France
United Kingdom
United States
Luxembourg
Germany

2014 EU-wide Stress Test P&L
(mln EUR) 31/12/2014 31/12/2015 31/12/2016 31/12/2014 31/12/2015 31/12/2016
Net interest income 3,456 3,293 3,118 2,956 3,052 2,841 2,666
Net trading income -239 -50 45 -443 -172 -37
of which trading losses from stress scenarios -473 -284 -189 -677 -406 -271
Other operating income 522 241 237 249 74 103 109
Operating profit before impairments 3,013 1,718 1,674 1,561 1,100 1,119 1,041
Impairment of financial assets (-) -2,277 -782 -612 -540 -2,000 -1,245 -1,243
Impairment of financial assets other than instruments designated at fair value
through P&L (-)-2,267 -782 -612 -540 -2,000 -1,245 -1,243
Impairment Financial assets designated at fair value through P&L (-) -10 0 0 0 0 0 0
Impairment on non financial assets (-) 0 0 0 0 -83 -50 -33
Operating profit after impairments from stress scenarios 735 936 1,062 1,021 -983 -176 -235
Other Income and expenses -164 1 1 1 -21 -21 -21
Pre-Tax profit 571 937 1,063 1,022 -1,004 -197 -256
Tax -354 -281 -319 -307 301 59 77
Net income 217 656 744 716 -703 -138 -180
Attributable to owners of the parent 90 656 744 716 -703 -138 -180
of which carried over to capital through retained earnings 90 656 744 716 -703 -138 -180
of which distributed as dividends 0 0 0 0 0 0 0
In the figures above, the original (official published) 2013 P&L figures may have been adjusted as part of the ECB Comprehensive Assessment join-up calculation.
31/12/2013
Baseline Scenario Adverse Scenario

2014 EU-wide Stress Test
RWA
(mln EUR)as of 31/12/2013 as of 31/12/2014 as of 31/12/2015 as of 31/12/2016 as of 31/12/2014 as of 31/12/2015 as of 31/12/2016
Risk exposure amount for credit risk 65,750 65,830 66,205 66,473 67,897 72,445 74,461
Risk exposure amount Securitisation and re-securitisations 4,009 4,037 4,332 4,528 4,808 5,560 6,053
Risk exposure amount Other credit risk 61,741 61,793 61,873 61,945 63,090 66,886 68,408
Risk exposure amount for market risk 4,918 4,958 4,958 4,958 5,985 5,985 5,988
Risk exposure amount for operational risk 21,875 21,875 21,875 21,875 21,875 21,919 21,919
Transitional floors for Risk exposure amount 0 0 0 0 0 0 0
AQR adjustments (for SSM countries only) 330 330 330 330 330 330 330
Total Risk exposure amount 92,873 92,993 93,368 93,636 96,087 100,680 102,697
Baseline Scenario Adverse Scenario

(mln EUR) as of 31/12/2013 31/12/2014 31/12/2015 31/12/2016 31/12/2014 31/12/2015 31/12/2016
Banking Book 1,460
Trading Book (excl. correlation trading positions under CRM) 59
Correlation Trading Portfolio (CRM) 0
Total 1,518
Banking Book 3,277 3,295 3,586 3,780 3,952 4,636 5,084
Trading Book (excl. correlation trading positions under CRM) 732 742 746 749 856 923 969
Total 4,009 4,037 4,332 4,528 4,808 5,560 6,053
Hold to Maturity porfolio 1,197 1,197 1,197 1,197 1,198 1,199 1,199
Available for Sale porfolio 45 45 45 45 45 45 45
Held for trading portfolio
Total 1,242 1,242 1,242 1,242 1,243 1,244 1,244
2014 EU-wide Stress Test
Impairments
Baseline scenario Adverse scenario
Exposure values
Risk exposure values
Securitisation

2014 EU-wide Stress Test - Sovereign Exposure
(mln EUR)
[ 0 - 3M [ 0 0 0 0 0 0 0 0 0 0 0 0 0 0
[ 3M - 1Y [ 0 0 0 0 0 0 0 0 0 0 0 0 0 0
[ 1Y - 2Y [ 0 0 0 0 0 0 0 0 0 0 0 0 0 0
[ 2Y - 3Y [ 0 0 0 0 0 0 0 0 0 0 0 0 0 0
[3Y - 5Y [ 23 0 23 0 0 0 0 0 0 0 0 0 0 0
[5Y - 10Y [ 472 0 472 101 0 0 0 0 0 0 0 0 0 0
[10Y - more 31 0 31 31 0 0 0 0 0 0 0 0 0 0
Tot 527 0 527 132 0 0 0 0 0 0 0 0 0 0
[ 0 - 3M [ 1,895 17 1,878 1,648 27 84 0 0 0 0 0 0 0 0
[ 3M - 1Y [ 1,253 13 1,240 409 24 643 0 0 0 0 0 0 0 0
[ 1Y - 2Y [ 1,855 19 1,836 1,018 103 13 0 0 0 0 0 0 0 0
[ 2Y - 3Y [ 1,056 25 1,031 460 12 33 0 0 0 0 0 0 0 0
[3Y - 5Y [ 4,786 18 4,769 274 0 25 2 0 -1 0 0 0 0 0
[5Y - 10Y [ 7,181 118 7,063 345 20 19 0 0 0 0 0 0 0 0
[10Y - more 3,468 2,526 942 62 0 1 0 0 0 0 0 0 0 0
Tot 21,495 2,736 18,759 4,215 186 817 2 0 -1 0 0 0 0 0
[ 0 - 3M [ 2 0 2 2 0 0 0 0 0 0 0 0 0 0
[ 3M - 1Y [ 4 0 4 4 0 0 0 0 0 0 0 0 0 0
[ 1Y - 2Y [ 3 0 3 3 0 0 0 0 0 0 0 0 0 0
[ 2Y - 3Y [ 15 0 15 15 0 0 0 0 0 0 0 0 0 0
[3Y - 5Y [ 29 0 29 29 0 0 0 0 0 0 0 0 0 0
[5Y - 10Y [ 25 0 25 25 0 0 0 0 0 0 0 0 0 0
[10Y - more 17 17 0 0 0 0 0 0 0 0 0 0 0 0
Tot 96 17 79 79 0 0 0 0 0 0 0 0 0 0
[ 0 - 3M [ 0 0 0 0 0 0 0 0 0 0 0 0 0 0
[ 3M - 1Y [ 0 0 0 0 0 0 0 0 0 0 0 0 0 0
[ 1Y - 2Y [ 0 0 0 0 0 0 0 0 0 0 0 0 0 0
[ 2Y - 3Y [ 0 0 0 0 0 0 0 0 0 0 0 0 0 0
[3Y - 5Y [ 0 0 0 0 0 0 0 0 0 0 0 0 0 0
[5Y - 10Y [ 0 0 0 0 0 0 0 0 0 0 0 0 0 0
[10Y - more 0 0 0 0 0 0 0 0 0 0 0 0 0 0
Tot 0 0 0 0 0 0 0 0 0 0 0 0 0 0
[ 0 - 3M [ 407 0 407 0 0 378 0 0 0 0 0 0 0 0
[ 3M - 1Y [ 706 0 706 187 15 254 0 0 0 0 0 0 0 0
[ 1Y - 2Y [ 806 0 806 27 0 151 0 0 0 0 0 0 0 0
[ 2Y - 3Y [ 443 0 443 0 0 78 0 0 0 0 0 0 0 0
[3Y - 5Y [ 1,383 0 1,383 163 0 29 0 0 0 0 0 0 0 0
[5Y - 10Y [ 3,424 0 3,424 532 0 5 0 0 0 0 0 0 0 0
[10Y - more 1,426 253 1,173 220 0 59 0 0 0 0 0 0 0 0
Tot 8,596 253 8,343 1,129 15 956 0 0 0 0 0 0 0 0
[ 0 - 3M [ 0 0 0 0 0 0 0 0 0 0 0 0 0 0
[ 3M - 1Y [ 0 0 0 0 0 0 0 0 0 0 0 0 0 0
[ 1Y - 2Y [ 0 0 0 0 0 0 0 0 0 0 0 0 0 0
[ 2Y - 3Y [ 0 0 0 0 0 0 0 0 0 0 0 0 0 0
[3Y - 5Y [ 0 0 0 0 0 0 0 0 0 0 0 0 0 0
[5Y - 10Y [ 0 0 0 0 0 0 0 0 0 0 0 0 0 0
[10Y - more 0 0 0 0 0 0 0 0 0 0 0 0 0 0
Tot 0 0 0 0 0 0 0 0 0 0 0 0 0 0
[ 0 - 3M [ 0 0 0 0 0 0 0 0 0 0 0 0 0 0
[ 3M - 1Y [ 0 0 0 0 0 0 0 0 0 0 0 0 0 0
[ 1Y - 2Y [ 4 0 4 4 0 0 0 0 0 0 0 0 0 0
[ 2Y - 3Y [ 0 0 0 0 0 0 0 0 0 0 0 0 0 0
[3Y - 5Y [ 0 0 0 0 0 0 0 0 0 0 0 0 0 0
[5Y - 10Y [ 23 0 23 0 0 0 0 0 0 0 0 0 0 0
[10Y - more 0 0 0 0 0 0 0 0 0 0 0 0 0 0
Tot 28 0 28 4 0 0 0 0 0 0 0 0 0 0
[ 0 - 3M [ 0 0 0 0 0 0 0 0 0 0 0 0 0 0
[ 3M - 1Y [ 181 0 181 181 0 0 0 0 0 0 0 0 0 0
[ 1Y - 2Y [ 152 0 152 151 0 1 0 0 0 0 0 0 0 0
[ 2Y - 3Y [ 7 0 7 0 0 0 0 0 0 0 0 0 0 0
[3Y - 5Y [ 172 0 172 25 0 122 0 0 0 0 0 0 0 0
[5Y - 10Y [ 867 0 867 164 0 -4 0 0 0 0 0 0 0 0
[10Y - more 641 24 617 40 0 0 0 0 0 0 0 0 0 0
Tot 2,020 24 1,997 560 0 120 0 0 0 0 0 0 0 0
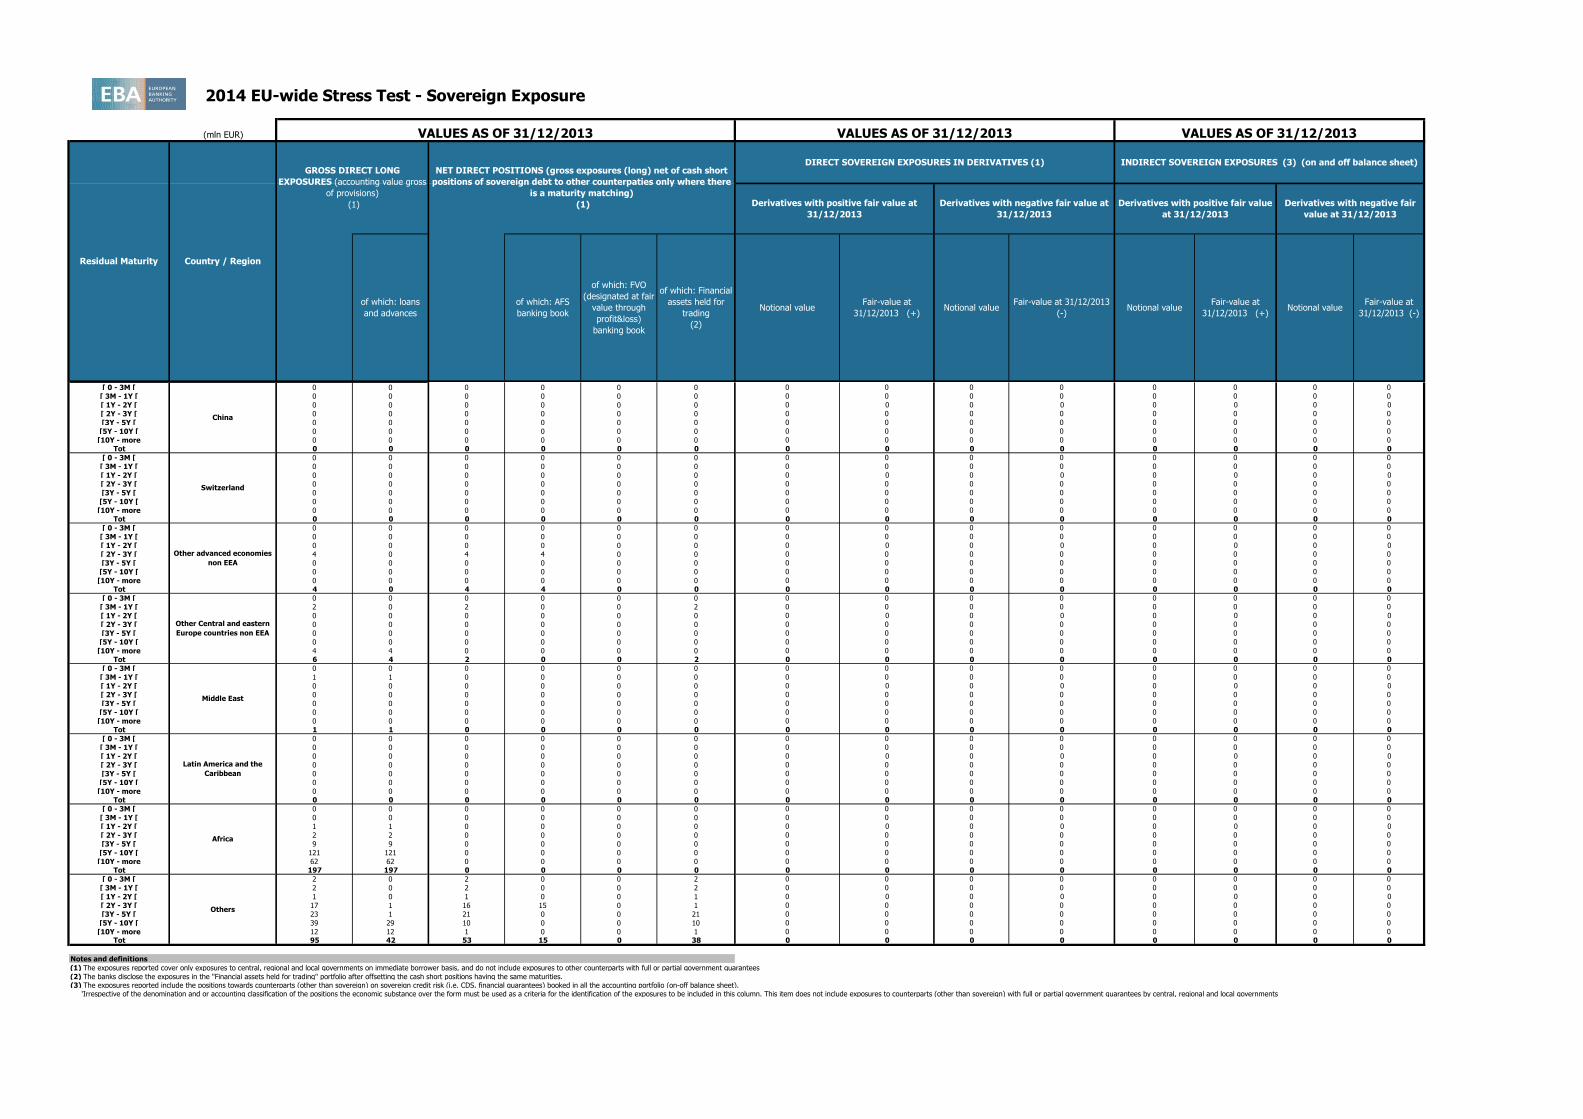
Residual Maturity Country / Region
GROSS DIRECT LONG
EXPOSURES (accounting value gross
of provisions)
(1)
NET DIRECT POSITIONS (gross exposures (long) net of cash short
positions of sovereign debt to other counterpaties only where there
is a maturity matching)
(1)
DIRECT SOVEREIGN EXPOSURES IN DERIVATIVES (1)
of which: loans
and advances
of which: AFS
banking book
of which: FVO
(designated at fair
value through
profit&loss)
banking book
of which: Financial
assets held for
trading
(2)
Derivatives with positive fair value at
31/12/2013
Derivatives with negative fair value at
31/12/2013
Derivatives with positive fair value
at 31/12/2013
Derivatives with negative fair
value at 31/12/2013
VALUES AS OF 31/12/2013 VALUES AS OF 31/12/2013 VALUES AS OF 31/12/2013
INDIRECT SOVEREIGN EXPOSURES (3) (on and off balance sheet)
Fair-value at
31/12/2013 (+)Notional value
Fair-value at
31/12/2013 (-)Notional value
Fair-value at
31/12/2013 (+)Notional value
Fair-value at 31/12/2013
(-)
Austria
Belgium
Bulgaria
Cyprus
Notional value
Czech Republic
Denmark
Estonia
Finland
France

2014 EU-wide Stress Test - Sovereign Exposure
(mln EUR)
Residual Maturity Country / Region
GROSS DIRECT LONG
EXPOSURES (accounting value gross
of provisions)
(1)
NET DIRECT POSITIONS (gross exposures (long) net of cash short
positions of sovereign debt to other counterpaties only where there
is a maturity matching)
(1)
DIRECT SOVEREIGN EXPOSURES IN DERIVATIVES (1)
of which: loans
and advances
of which: AFS
banking book
of which: FVO
(designated at fair
value through
profit&loss)
banking book
of which: Financial
assets held for
trading
(2)
Derivatives with positive fair value at
31/12/2013
Derivatives with negative fair value at
31/12/2013
Derivatives with positive fair value
at 31/12/2013
Derivatives with negative fair
value at 31/12/2013
VALUES AS OF 31/12/2013 VALUES AS OF 31/12/2013 VALUES AS OF 31/12/2013
INDIRECT SOVEREIGN EXPOSURES (3) (on and off balance sheet)
Fair-value at
31/12/2013 (+)Notional value
Fair-value at
31/12/2013 (-)Notional value
Fair-value at
31/12/2013 (+)Notional value
Fair-value at 31/12/2013
(-)
Austria
Notional value
[ 0 - 3M [ 2 0 2 0 0 2 0 0 0 0 0 0 0 0
[ 3M - 1Y [ 6 0 6 0 0 6 0 0 0 0 0 0 0 0
[ 1Y - 2Y [ 12 0 12 0 0 11 0 0 0 0 0 0 0 0
[ 2Y - 3Y [ 1 0 1 0 0 1 224 247 0 0 0 0 0 0
[3Y - 5Y [ 10 0 10 0 0 10 0 0 0 0 0 0 0 0
[5Y - 10Y [ 77 0 77 71 0 -10 155 193 -20 -25 0 0 0 0
[10Y - more 21 0 21 20 0 1 16 12 -51 -42 0 0 0 0
Tot 128 0 128 91 0 20 396 453 -71 -67 0 0 0 0
[ 0 - 3M [ 0 0 0 0 0 0 0 0 0 0 0 0 0 0
[ 3M - 1Y [ 0 0 0 0 0 0 0 0 0 0 0 0 0 0
[ 1Y - 2Y [ 0 0 0 0 0 0 0 0 0 0 0 0 0 0
[ 2Y - 3Y [ 0 0 0 0 0 0 0 0 0 0 0 0 0 0
[3Y - 5Y [ 0 0 0 0 0 0 0 0 0 0 0 0 0 0
[5Y - 10Y [ 0 0 0 0 0 0 0 0 0 0 0 0 0 0
[10Y - more 0 0 0 0 0 0 0 0 0 0 0 0 0 0
Tot 0 0 0 0 0 0 0 0 0 0 0 0 0 0
[ 0 - 3M [ 0 0 0 0 0 0 0 0 0 0 0 0 0 0
[ 3M - 1Y [ 0 0 0 0 0 0 0 0 0 0 0 0 0 0
[ 1Y - 2Y [ 0 0 0 0 0 0 0 0 0 0 0 0 0 0
[ 2Y - 3Y [ 0 0 0 0 0 0 0 0 0 0 0 0 0 0
[3Y - 5Y [ 0 0 0 0 0 0 0 0 0 0 0 0 0 0
[5Y - 10Y [ 0 0 0 0 0 0 0 0 0 0 0 0 0 0
[10Y - more 0 0 0 0 0 0 0 0 0 0 0 0 0 0
Tot 0 0 0 0 0 0 0 0 0 0 0 0 0 0
[ 0 - 3M [ 1,633 0 1,633 1,412 0 118 0 0 0 0 0 0 0 0
[ 3M - 1Y [ 241 0 241 0 0 184 0 0 0 0 0 0 0 0
[ 1Y - 2Y [ 313 0 313 45 0 1 0 0 0 0 0 0 0 0
[ 2Y - 3Y [ 267 0 267 0 0 19 0 0 0 0 0 0 0 0
[3Y - 5Y [ 319 0 319 52 0 3 0 0 0 0 0 0 0 0
[5Y - 10Y [ 546 0 546 39 0 -17 0 0 0 0 0 0 0 0
[10Y - more 474 389 86 0 0 0 0 0 0 0 0 0 0 0
Tot 3,794 389 3,406 1,547 0 308 0 0 0 0 0 0 0 0
[ 0 - 3M [ 0 0 0 0 0 0 0 0 0 0 0 0 0 0
[ 3M - 1Y [ 0 0 0 0 0 0 0 0 0 0 0 0 0 0
[ 1Y - 2Y [ 0 0 0 0 0 0 0 0 0 0 0 0 0 0
[ 2Y - 3Y [ 0 0 0 0 0 0 0 0 0 0 0 0 0 0
[3Y - 5Y [ 0 0 0 0 0 0 0 0 0 0 0 0 0 0
[5Y - 10Y [ 0 0 0 0 0 0 0 0 0 0 0 0 0 0
[10Y - more 0 0 0 0 0 0 0 0 0 0 0 0 0 0
Tot 0 0 0 0 0 0 0 0 0 0 0 0 0 0
[ 0 - 3M [ 0 0 0 0 0 0 0 0 0 0 0 0 0 0
[ 3M - 1Y [ 0 0 0 0 0 0 0 0 0 0 0 0 0 0
[ 1Y - 2Y [ 0 0 0 0 0 0 0 0 0 0 0 0 0 0
[ 2Y - 3Y [ 41 0 41 0 0 0 0 0 0 0 0 0 0 0
[3Y - 5Y [ 81 0 81 56 0 0 0 0 0 0 0 0 0 0
[5Y - 10Y [ 158 0 158 52 0 0 0 0 0 0 0 0 0 0
[10Y - more 90 41 50 0 0 0 0 0 0 0 0 0 0 0
Tot 371 41 330 109 0 1 0 0 0 0 0 0 0 0
[ 0 - 3M [ 0 0 0 0 0 0 0 0 0 0 0 0 0 0
[ 3M - 1Y [ 0 0 0 0 0 0 0 0 0 0 0 0 0 0
[ 1Y - 2Y [ 1 0 1 0 0 1 0 0 0 0 0 0 0 0
[ 2Y - 3Y [ 0 0 0 0 0 0 0 0 0 0 0 0 0 0
[3Y - 5Y [ 1 0 1 0 0 0 0 0 0 0 0 0 0 0
[5Y - 10Y [ 386 0 386 339 0 0 0 0 0 0 0 0 0 0
[10Y - more 176 0 176 176 0 0 2 3 0 0 0 0 0 0
Tot 564 0 564 514 0 1 2 3 0 0 0 0 0 0
[ 0 - 3M [ 0 0 0 0 0 0 0 0 0 0 0 0 0 0
[ 3M - 1Y [ 0 0 0 0 0 0 0 0 0 0 0 0 0 0
[ 1Y - 2Y [ 0 0 0 0 0 0 0 0 0 0 0 0 0 0
[ 2Y - 3Y [ 0 0 0 0 0 0 0 0 0 0 0 0 0 0
[3Y - 5Y [ 0 0 0 0 0 0 0 0 0 0 0 0 0 0
[5Y - 10Y [ 0 0 0 0 0 0 0 0 0 0 0 0 0 0
[10Y - more 0 0 0 0 0 0 0 0 0 0 0 0 0 0
Tot 0 0 0 0 0 0 0 0 0 0 0 0 0 0
[ 0 - 3M [ 0 0 0 0 0 0 0 0 0 0 0 0 0 0
[ 3M - 1Y [ 0 0 0 0 0 0 0 0 0 0 0 0 0 0
[ 1Y - 2Y [ 0 0 0 0 0 0 0 0 0 0 0 0 0 0
[ 2Y - 3Y [ 0 0 0 0 0 0 0 0 0 0 0 0 0 0
[3Y - 5Y [ 0 0 0 0 0 0 0 0 0 0 0 0 0 0
[5Y - 10Y [ 0 0 0 0 0 0 0 0 0 0 0 0 0 0
[10Y - more 0 0 0 0 0 0 0 0 0 0 0 0 0 0
Tot 0 0 0 0 0 0 0 0 0 0 0 0 0 0
Latvia
Germany
Greece
Hungary
Iceland
Ireland
Italy
Croatia
Liechtenstein

2014 EU-wide Stress Test - Sovereign Exposure
(mln EUR)
Residual Maturity Country / Region
GROSS DIRECT LONG
EXPOSURES (accounting value gross
of provisions)
(1)
NET DIRECT POSITIONS (gross exposures (long) net of cash short
positions of sovereign debt to other counterpaties only where there
is a maturity matching)
(1)
DIRECT SOVEREIGN EXPOSURES IN DERIVATIVES (1)
of which: loans
and advances
of which: AFS
banking book
of which: FVO
(designated at fair
value through
profit&loss)
banking book
of which: Financial
assets held for
trading
(2)
Derivatives with positive fair value at
31/12/2013
Derivatives with negative fair value at
31/12/2013
Derivatives with positive fair value
at 31/12/2013
Derivatives with negative fair
value at 31/12/2013
VALUES AS OF 31/12/2013 VALUES AS OF 31/12/2013 VALUES AS OF 31/12/2013
INDIRECT SOVEREIGN EXPOSURES (3) (on and off balance sheet)
Fair-value at
31/12/2013 (+)Notional value
Fair-value at
31/12/2013 (-)Notional value
Fair-value at
31/12/2013 (+)Notional value
Fair-value at 31/12/2013
(-)
Austria
Notional value
[ 0 - 3M [ 0 0 0 0 0 0 0 0 0 0 0 0 0 0
[ 3M - 1Y [ 0 0 0 0 0 0 0 0 0 0 0 0 0 0
[ 1Y - 2Y [ 0 0 0 0 0 0 0 0 0 0 0 0 0 0
[ 2Y - 3Y [ 0 0 0 0 0 0 0 0 0 0 0 0 0 0
[3Y - 5Y [ 0 0 0 0 0 0 0 0 0 0 0 0 0 0
[5Y - 10Y [ 0 0 0 0 0 0 0 0 0 0 0 0 0 0
[10Y - more 0 0 0 0 0 0 0 0 0 0 0 0 0 0
Tot 0 0 0 0 0 0 0 0 0 0 0 0 0 0
[ 0 - 3M [ 1 0 1 0 0 1 0 0 0 0 0 0 0 0
[ 3M - 1Y [ 1 0 1 0 0 1 0 0 0 0 0 0 0 0
[ 1Y - 2Y [ 1 0 1 0 0 1 0 0 0 0 0 0 0 0
[ 2Y - 3Y [ 21 0 21 21 0 0 0 0 0 0 0 0 0 0
[3Y - 5Y [ 6 0 6 0 0 0 0 0 0 0 0 0 0 0
[5Y - 10Y [ 318 0 318 0 0 1 0 0 0 0 0 0 0 0
[10Y - more 0 0 0 0 0 0 0 0 0 0 0 0 0 0
Tot 347 0 347 21 0 5 0 0 0 0 0 0 0 0
[ 0 - 3M [ 0 0 0 0 0 0 0 0 0 0 0 0 0 0
[ 3M - 1Y [ 0 0 0 0 0 0 0 0 0 0 0 0 0 0
[ 1Y - 2Y [ 0 0 0 0 0 0 0 0 0 0 0 0 0 0
[ 2Y - 3Y [ 0 0 0 0 0 0 0 0 0 0 0 0 0 0
[3Y - 5Y [ 0 0 0 0 0 0 0 0 0 0 0 0 0 0
[5Y - 10Y [ 0 0 0 0 0 0 0 0 0 0 0 0 0 0
[10Y - more 0 0 0 0 0 0 0 0 0 0 0 0 0 0
Tot 0 0 0 0 0 0 0 0 0 0 0 0 0 0
[ 0 - 3M [ 11 0 11 0 0 8 0 0 0 0 0 0 0 0
[ 3M - 1Y [ 0 0 0 0 0 0 0 0 0 0 0 0 0 0
[ 1Y - 2Y [ 1 0 1 0 0 1 0 0 0 0 0 0 0 0
[ 2Y - 3Y [ 92 0 92 92 0 0 0 0 0 0 0 0 0 0
[3Y - 5Y [ 17 0 17 16 0 1 0 0 0 0 0 0 0 0
[5Y - 10Y [ 67 0 67 56 0 6 0 0 0 0 0 0 0 0
[10Y - more 9 0 9 9 0 0 0 0 0 0 0 0 0 0
Tot 197 0 197 173 0 15 0 0 0 0 0 0 0 0
[ 0 - 3M [ 0 0 0 0 0 0 0 0 0 0 0 0 0 0
[ 3M - 1Y [ 0 0 0 0 0 0 0 0 0 0 0 0 0 0
[ 1Y - 2Y [ 0 0 0 0 0 0 0 0 0 0 0 0 0 0
[ 2Y - 3Y [ 0 0 0 0 0 0 0 0 0 0 0 0 0 0
[3Y - 5Y [ 0 0 0 0 0 0 0 0 0 0 0 0 0 0
[5Y - 10Y [ 35 0 35 0 0 0 0 0 0 0 0 0 0 0
[10Y - more 0 0 0 0 0 0 0 0 0 0 0 0 0 0
Tot 35 0 35 0 0 0 0 0 0 0 0 0 0 0
[ 0 - 3M [ 0 0 0 0 0 0 0 0 0 0 0 0 0 0
[ 3M - 1Y [ 0 0 0 0 0 0 0 0 0 0 0 0 0 0
[ 1Y - 2Y [ 0 0 0 0 0 0 0 0 0 0 0 0 0 0
[ 2Y - 3Y [ 0 0 0 0 0 0 0 0 0 0 0 0 0 0
[3Y - 5Y [ 0 0 0 0 0 0 0 0 0 0 0 0 0 0
[5Y - 10Y [ 0 0 0 0 0 0 0 0 0 0 0 0 0 0
[10Y - more 0 0 0 0 0 0 0 0 0 0 0 0 0 0
Tot 0 0 0 0 0 0 0 0 0 0 0 0 0 0
[ 0 - 3M [ 11 0 11 0 0 11 0 0 0 0 0 0 0 0
[ 3M - 1Y [ 44 0 44 0 0 1 0 0 0 0 0 0 0 0
[ 1Y - 2Y [ 73 0 73 53 0 0 0 0 0 0 0 0 0 0
[ 2Y - 3Y [ 313 0 313 225 0 1 0 0 0 0 0 0 0 0
[3Y - 5Y [ 459 0 459 330 0 25 0 0 0 0 0 0 0 0
[5Y - 10Y [ 584 0 584 147 0 30 0 0 0 0 0 0 0 0
[10Y - more 624 126 498 55 0 7 0 0 0 0 0 0 0 0
Tot 2,107 126 1,981 810 0 75 0 0 0 0 0 0 0 0
Lithuania
Luxembourg
Malta
Netherlands
Norway
Poland
Portugal
Romania
Slovakia

2014 EU-wide Stress Test - Sovereign Exposure
(mln EUR)
Residual Maturity Country / Region
GROSS DIRECT LONG
EXPOSURES (accounting value gross
of provisions)
(1)
NET DIRECT POSITIONS (gross exposures (long) net of cash short
positions of sovereign debt to other counterpaties only where there
is a maturity matching)
(1)
DIRECT SOVEREIGN EXPOSURES IN DERIVATIVES (1)
of which: loans
and advances
of which: AFS
banking book
of which: FVO
(designated at fair
value through
profit&loss)
banking book
of which: Financial
assets held for
trading
(2)
Derivatives with positive fair value at
31/12/2013
Derivatives with negative fair value at
31/12/2013
Derivatives with positive fair value
at 31/12/2013
Derivatives with negative fair
value at 31/12/2013
VALUES AS OF 31/12/2013 VALUES AS OF 31/12/2013 VALUES AS OF 31/12/2013
INDIRECT SOVEREIGN EXPOSURES (3) (on and off balance sheet)
Fair-value at
31/12/2013 (+)Notional value
Fair-value at
31/12/2013 (-)Notional value
Fair-value at
31/12/2013 (+)Notional value
Fair-value at 31/12/2013
(-)
Austria
Notional value
[ 0 - 3M [ 0 0 0 0 0 0 0 0 0 0 0 0 0 0
[ 3M - 1Y [ 0 0 0 0 0 0 0 0 0 0 0 0 0 0
[ 1Y - 2Y [ 0 0 0 0 0 0 0 0 0 0 0 0 0 0
[ 2Y - 3Y [ 3 0 3 0 0 0 0 0 0 0 0 0 0 0
[3Y - 5Y [ 0 0 0 0 0 0 0 0 0 0 0 0 0 0
[5Y - 10Y [ 9 0 9 0 0 9 0 0 0 0 0 0 0 0
[10Y - more 0 0 0 0 0 0 0 0 0 0 0 0 0 0
Tot 12 0 12 0 0 9 0 0 0 0 0 0 0 0
[ 0 - 3M [ 0 0 0 0 0 0 0 0 0 0 0 0 0 0
[ 3M - 1Y [ 0 0 0 0 0 0 0 0 0 0 0 0 0 0
[ 1Y - 2Y [ 0 0 0 0 0 0 0 0 0 0 0 0 0 0
[ 2Y - 3Y [ 0 0 0 0 0 0 0 0 0 0 0 0 0 0
[3Y - 5Y [ 48 0 48 47 0 0 0 0 0 0 0 0 0 0
[5Y - 10Y [ 1 0 1 0 0 0 0 0 0 0 0 0 0 0
[10Y - more 243 0 243 243 0 0 0 0 0 0 0 0 0 0
Tot 292 0 292 290 0 1 0 0 0 0 0 0 0 0
[ 0 - 3M [ 0 0 0 0 0 0 0 0 0 0 0 0 0 0
[ 3M - 1Y [ 0 0 0 0 0 0 0 0 0 0 0 0 0 0
[ 1Y - 2Y [ 0 0 0 0 0 0 0 0 0 0 0 0 0 0
[ 2Y - 3Y [ 0 0 0 0 0 0 0 0 0 0 0 0 0 0
[3Y - 5Y [ 0 0 0 0 0 0 0 0 0 0 0 0 0 0
[5Y - 10Y [ 0 0 0 0 0 0 0 0 0 0 0 0 0 0
[10Y - more 0 0 0 0 0 0 0 0 0 0 0 0 0 0
Tot 0 0 0 0 0 0 0 0 0 0 0 0 0 0
[ 0 - 3M [ 0 0 0 0 0 0 0 0 0 0 0 0 0 0
[ 3M - 1Y [ 0 0 0 0 0 0 0 0 0 0 0 0 0 0
[ 1Y - 2Y [ 1 1 0 0 0 0 0 0 0 0 0 0 0 0
[ 2Y - 3Y [ 0 0 0 0 0 0 0 0 0 0 0 0 0 0
[3Y - 5Y [ 0 0 0 0 0 0 0 0 0 0 0 0 0 0
[5Y - 10Y [ 0 0 0 0 0 0 0 0 0 0 0 0 0 0
[10Y - more 357 357 0 0 0 0 0 1 -9 -12 0 0 0 0
Tot 358 358 0 0 0 0 0 1 -9 -12 0 0 0 0
[ 0 - 3M [ 0 0 0 0 0 0 0 0 0 0 0 0 0 0
[ 3M - 1Y [ 0 0 0 0 0 0 0 0 0 0 0 0 0 0
[ 1Y - 2Y [ 0 0 0 0 0 0 0 0 0 0 0 0 0 0
[ 2Y - 3Y [ 0 0 0 0 0 0 0 0 0 0 0 0 0 0
[3Y - 5Y [ 0 0 0 0 0 0 0 0 0 0 0 0 0 0
[5Y - 10Y [ 0 0 0 0 0 0 0 0 0 0 0 0 0 0
[10Y - more 0 0 0 0 0 0 0 0 0 0 0 0 0 0
Tot 0 0 0 0 0 0 0 0 0 0 0 0 0 0
[ 0 - 3M [ 0 0 0 0 0 0 0 0 0 0 0 0 0 0
[ 3M - 1Y [ 0 0 0 0 0 0 0 0 0 0 0 0 0 0
[ 1Y - 2Y [ 0 0 0 0 0 0 0 0 0 0 0 0 0 0
[ 2Y - 3Y [ 0 0 0 0 0 0 0 0 0 0 0 0 0 0
[3Y - 5Y [ 0 0 0 0 0 0 0 0 0 0 0 0 0 0
[5Y - 10Y [ 25 0 25 25 0 0 0 0 0 0 0 0 0 0
[10Y - more 0 0 0 0 0 0 0 0 0 0 0 0 0 0
Tot 25 0 25 25 0 0 0 0 0 0 0 0 0 0
[ 0 - 3M [ 37 0 37 0 0 37 0 0 0 0 0 0 0 0
[ 3M - 1Y [ 0 0 0 0 0 0 0 0 0 0 0 0 0 0
[ 1Y - 2Y [ 0 0 0 0 0 0 0 0 0 0 0 0 0 0
[ 2Y - 3Y [ 0 0 0 0 0 0 0 0 0 0 0 0 0 0
[3Y - 5Y [ 0 0 0 0 0 0 0 0 0 0 0 0 0 0
[5Y - 10Y [ 0 0 0 0 0 0 0 0 0 0 0 0 0 0
[10Y - more 0 0 0 0 0 0 0 0 0 0 0 0 0 0
Tot 37 0 37 0 0 37 0 0 0 0 0 0 0 0
[ 0 - 3M [ 0 0 0 0 0 0 0 0 0 0 0 0 0 0
[ 3M - 1Y [ 0 0 0 0 0 0 0 0 0 0 0 0 0 0
[ 1Y - 2Y [ 0 0 0 0 0 0 0 0 0 0 0 0 0 0
[ 2Y - 3Y [ 0 0 0 0 0 0 0 0 0 0 0 0 0 0
[3Y - 5Y [ 0 0 0 0 0 0 0 0 0 0 0 0 0 0
[5Y - 10Y [ 0 0 0 0 0 0 0 0 0 0 0 0 0 0
[10Y - more 0 0 0 0 0 0 0 0 0 0 0 0 0 0
Tot 0 0 0 0 0 0 0 0 0 0 0 0 0 0
[ 0 - 3M [ 54 54 0 0 0 0 0 0 0 0 0 0 0 0
[ 3M - 1Y [ 307 306 0 0 0 0 0 0 0 0 0 0 0 0
[ 1Y - 2Y [ 158 158 0 0 0 0 0 0 0 0 0 0 0 0
[ 2Y - 3Y [ 30 30 0 0 0 0 0 0 -2 -3 0 0 0 0
[3Y - 5Y [ 171 171 0 0 0 0 0 0 0 0 0 0 0 0
[5Y - 10Y [ 22 22 0 0 0 0 21 18 0 0 0 0 0 0
[10Y - more 0 0 0 0 0 0 0 0 -15 -13 0 0 0 0
Tot 741 741 0 0 0 0 21 18 -17 -17 0 0 0 0
Spain
Slovenia
Sweden
United Kingdom
Australia
Canada
Hong Kong
Japan
U.S.
2014 EU-wide Stress Test - Sovereign Exposure
(mln EUR)
Residual Maturity Country / Region
GROSS DIRECT LONG
EXPOSURES (accounting value gross
of provisions)
(1)
NET DIRECT POSITIONS (gross exposures (long) net of cash short
positions of sovereign debt to other counterpaties only where there
is a maturity matching)
(1)
DIRECT SOVEREIGN EXPOSURES IN DERIVATIVES (1)
of which: loans
and advances
of which: AFS
banking book
of which: FVO
(designated at fair
value through
profit&loss)
banking book
of which: Financial
assets held for
trading
(2)
Derivatives with positive fair value at
31/12/2013
Derivatives with negative fair value at
31/12/2013
Derivatives with positive fair value
at 31/12/2013
Derivatives with negative fair
value at 31/12/2013
VALUES AS OF 31/12/2013 VALUES AS OF 31/12/2013 VALUES AS OF 31/12/2013
INDIRECT SOVEREIGN EXPOSURES (3) (on and off balance sheet)
Fair-value at
31/12/2013 (+)Notional value
Fair-value at
31/12/2013 (-)Notional value
Fair-value at
31/12/2013 (+)Notional value
Fair-value at 31/12/2013
(-)
Austria
Notional value
[ 0 - 3M [ 0 0 0 0 0 0 0 0 0 0 0 0 0 0
[ 3M - 1Y [ 0 0 0 0 0 0 0 0 0 0 0 0 0 0
[ 1Y - 2Y [ 0 0 0 0 0 0 0 0 0 0 0 0 0 0
[ 2Y - 3Y [ 0 0 0 0 0 0 0 0 0 0 0 0 0 0
[3Y - 5Y [ 0 0 0 0 0 0 0 0 0 0 0 0 0 0
[5Y - 10Y [ 0 0 0 0 0 0 0 0 0 0 0 0 0 0
[10Y - more 0 0 0 0 0 0 0 0 0 0 0 0 0 0
Tot 0 0 0 0 0 0 0 0 0 0 0 0 0 0
[ 0 - 3M [ 0 0 0 0 0 0 0 0 0 0 0 0 0 0
[ 3M - 1Y [ 0 0 0 0 0 0 0 0 0 0 0 0 0 0
[ 1Y - 2Y [ 0 0 0 0 0 0 0 0 0 0 0 0 0 0
[ 2Y - 3Y [ 4 0 4 4 0 0 0 0 0 0 0 0 0 0
[3Y - 5Y [ 0 0 0 0 0 0 0 0 0 0 0 0 0 0
[5Y - 10Y [ 0 0 0 0 0 0 0 0 0 0 0 0 0 0
[10Y - more 0 0 0 0 0 0 0 0 0 0 0 0 0 0
Tot 4 0 4 4 0 0 0 0 0 0 0 0 0 0
[ 0 - 3M [ 0 0 0 0 0 0 0 0 0 0 0 0 0 0
[ 3M - 1Y [ 2 0 2 0 0 2 0 0 0 0 0 0 0 0
[ 1Y - 2Y [ 0 0 0 0 0 0 0 0 0 0 0 0 0 0
[ 2Y - 3Y [ 0 0 0 0 0 0 0 0 0 0 0 0 0 0
[3Y - 5Y [ 0 0 0 0 0 0 0 0 0 0 0 0 0 0
[5Y - 10Y [ 0 0 0 0 0 0 0 0 0 0 0 0 0 0
[10Y - more 4 4 0 0 0 0 0 0 0 0 0 0 0 0
Tot 6 4 2 0 0 2 0 0 0 0 0 0 0 0
[ 0 - 3M [ 0 0 0 0 0 0 0 0 0 0 0 0 0 0
[ 3M - 1Y [ 1 1 0 0 0 0 0 0 0 0 0 0 0 0
[ 1Y - 2Y [ 0 0 0 0 0 0 0 0 0 0 0 0 0 0
[ 2Y - 3Y [ 0 0 0 0 0 0 0 0 0 0 0 0 0 0
[3Y - 5Y [ 0 0 0 0 0 0 0 0 0 0 0 0 0 0
[5Y - 10Y [ 0 0 0 0 0 0 0 0 0 0 0 0 0 0
[10Y - more 0 0 0 0 0 0 0 0 0 0 0 0 0 0
Tot 1 1 0 0 0 0 0 0 0 0 0 0 0 0
[ 0 - 3M [ 0 0 0 0 0 0 0 0 0 0 0 0 0 0
[ 3M - 1Y [ 0 0 0 0 0 0 0 0 0 0 0 0 0 0
[ 1Y - 2Y [ 0 0 0 0 0 0 0 0 0 0 0 0 0 0
[ 2Y - 3Y [ 0 0 0 0 0 0 0 0 0 0 0 0 0 0
[3Y - 5Y [ 0 0 0 0 0 0 0 0 0 0 0 0 0 0
[5Y - 10Y [ 0 0 0 0 0 0 0 0 0 0 0 0 0 0
[10Y - more 0 0 0 0 0 0 0 0 0 0 0 0 0 0
Tot 0 0 0 0 0 0 0 0 0 0 0 0 0 0
[ 0 - 3M [ 0 0 0 0 0 0 0 0 0 0 0 0 0 0
[ 3M - 1Y [ 0 0 0 0 0 0 0 0 0 0 0 0 0 0
[ 1Y - 2Y [ 1 1 0 0 0 0 0 0 0 0 0 0 0 0
[ 2Y - 3Y [ 2 2 0 0 0 0 0 0 0 0 0 0 0 0
[3Y - 5Y [ 9 9 0 0 0 0 0 0 0 0 0 0 0 0
[5Y - 10Y [ 121 121 0 0 0 0 0 0 0 0 0 0 0 0
[10Y - more 62 62 0 0 0 0 0 0 0 0 0 0 0 0
Tot 197 197 0 0 0 0 0 0 0 0 0 0 0 0
[ 0 - 3M [ 2 0 2 0 0 2 0 0 0 0 0 0 0 0
[ 3M - 1Y [ 2 0 2 0 0 2 0 0 0 0 0 0 0 0
[ 1Y - 2Y [ 1 0 1 0 0 1 0 0 0 0 0 0 0 0
[ 2Y - 3Y [ 17 1 16 15 0 1 0 0 0 0 0 0 0 0
[3Y - 5Y [ 23 1 21 0 0 21 0 0 0 0 0 0 0 0
[5Y - 10Y [ 39 29 10 0 0 10 0 0 0 0 0 0 0 0
[10Y - more 12 12 1 0 0 1 0 0 0 0 0 0 0 0Tot 95 42 53 15 0 38 0 0 0 0 0 0 0 0
Notes and definitions
(1) The exposures reported cover only exposures to central, regional and local governments on immediate borrower basis, and do not include exposures to other counterparts with full or partial government guarantees
(2) The banks disclose the exposures in the "Financial assets held for trading" portfolio after offsetting the cash short positions having the same maturities. (3) The exposures reported include the positions towards counterparts (other than sovereign) on sovereign credit risk (i.e. CDS, financial guarantees) booked in all the accounting portfolio (on-off balance sheet). 'Irrespective of the denomination and or accounting classification of the positions the economic substance over the form must be used as a criteria for the identification of the exposures to be included in this column. This item does not include exposures to counterparts (other than sovereign) with full or partial government guarantees by central, regional and local governments
Latin America and the
Caribbean
Africa
Others
Middle East
China
Switzerland
Other advanced economies
non EEA
Other Central and eastern
Europe countries non EEA
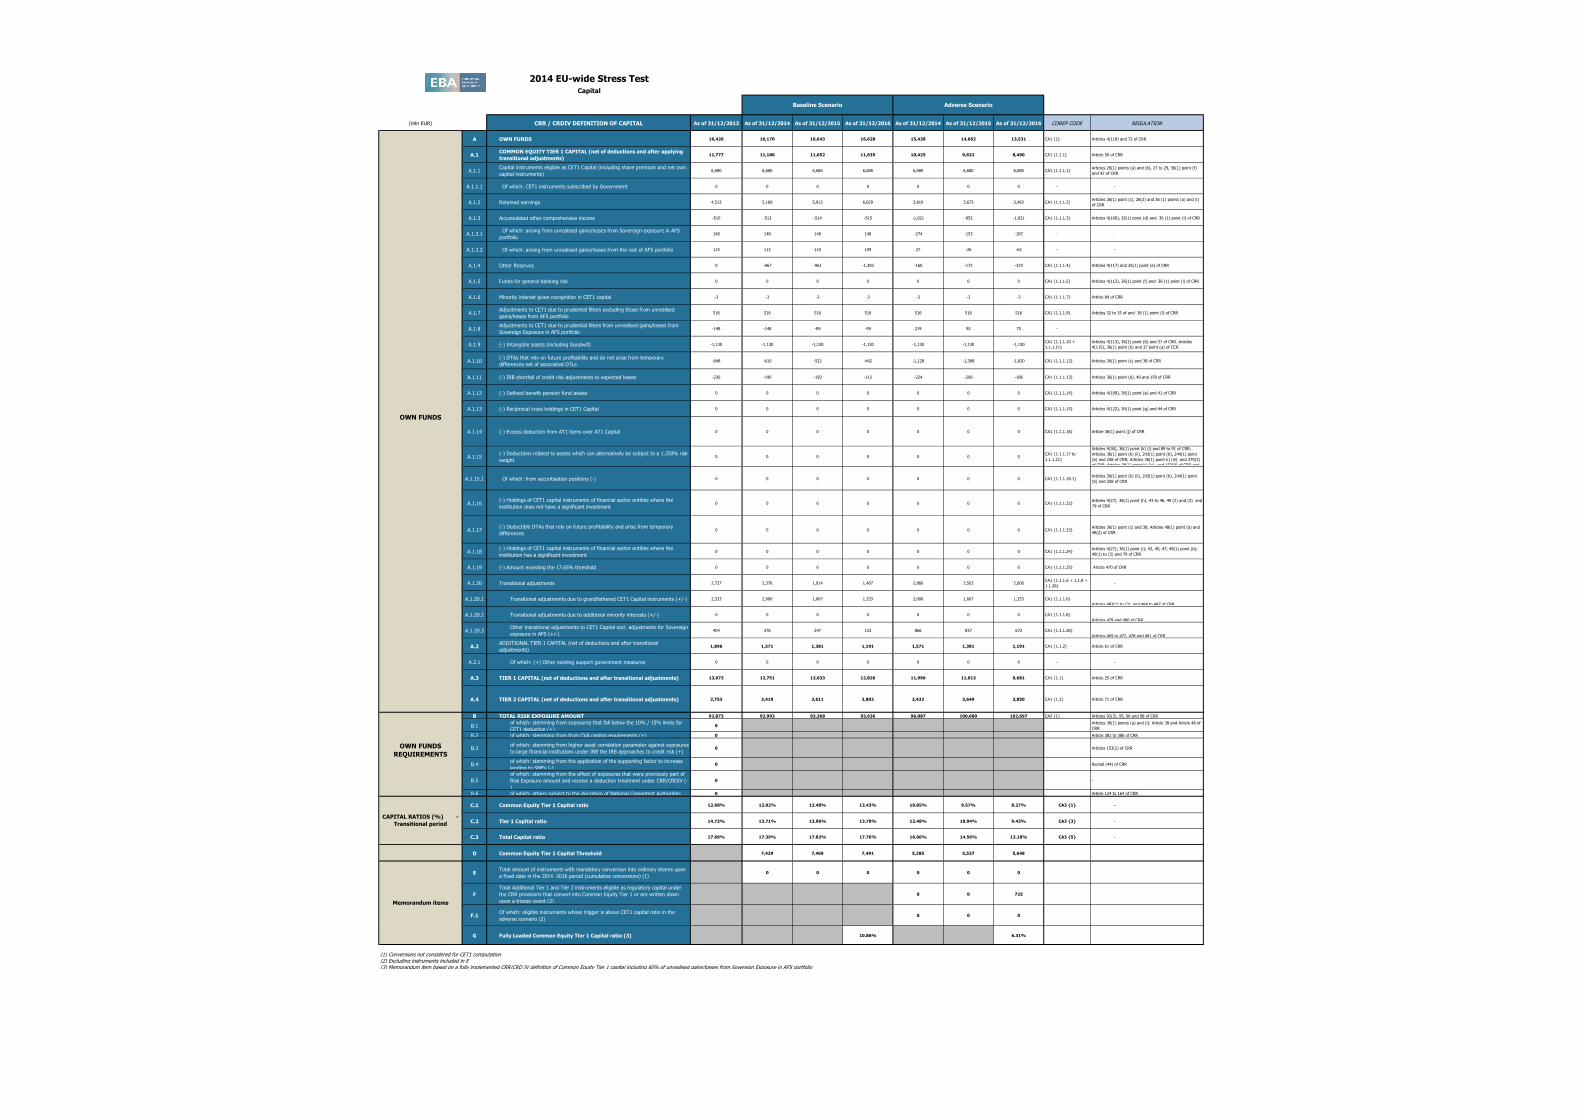
2014 EU-wide Stress TestCapital
(mln EUR) CRR / CRDIV DEFINITION OF CAPITAL As of 31/12/2013 As of 31/12/2014 As of 31/12/2015 As of 31/12/2016 As of 31/12/2014 As of 31/12/2015 As of 31/12/2016 COREP CODE REGULATION
A OWN FUNDS 16,426 16,170 16,643 16,628 15,428 14,662 13,531 CA1 {1} Articles 4(118) and 72 of CRR
A.1COMMON EQUITY TIER 1 CAPITAL (net of deductions and after applying
transitional adjustments)11,777 11,180 11,652 11,635 10,425 9,632 8,490 CA1 {1.1.1} Article 50 of CRR
A.1.1Capital instruments eligible as CET1 Capital (including share premium and net own
capital instruments)6,680 6,680 6,680 6,680 6,680 6,680 6,680 CA1 {1.1.1.1}
Articles 26(1) points (a) and (b), 27 to 29, 36(1) point (f)
and 42 of CRR
A.1.1.1 Of which: CET1 instruments subscribed by Government 0 0 0 0 0 0 0 - -
A.1.2 Retained earnings 4,513 5,169 5,913 6,629 3,810 3,673 3,493 CA1 {1.1.1.2}Articles 26(1) point (c), 26(2) and 36 (1) points (a) and (l)
of CRR
A.1.3 Accumulated other comprehensive income -510 -513 -514 -515 -1,021 -952 -1,021 CA1 {1.1.1.3} Articles 4(100), 26(1) point (d) and 36 (1) point (l) of CRR
A.1.3.1 Of which: arising from unrealised gains/losses from Sovereign exposure in AFS
portfolio148 148 148 148 -274 -153 -187 - -
A.1.3.2 Of which: arising from unrealised gains/losses from the rest of AFS portfolio 115 112 110 109 27 -26 -62 - -
A.1.4 Other Reserves 0 -967 -961 -1,393 -160 -172 -319 CA1 {1.1.1.4} Articles 4(117) and 26(1) point (e) of CRR
A.1.5 Funds for general banking risk 0 0 0 0 0 0 0 CA1 {1.1.1.5} Articles 4(112), 26(1) point (f) and 36 (1) point (l) of CRR
A.1.6 Minority interest given recognition in CET1 capital -3 -3 -3 -3 -3 -3 -3 CA1 {1.1.1.7} Article 84 of CRR
A.1.7Adjustments to CET1 due to prudential filters excluding those from unrealised
gains/losses from AFS portfolio516 516 516 516 516 516 516 CA1 {1.1.1.9} Articles 32 to 35 of and 36 (1) point (l) of CRR
A.1.8Adjustments to CET1 due to prudential filters from unrealised gains/losses from
Sovereign Exposure in AFS portfolio-148 -148 -89 -59 219 92 75 -
A.1.9 (-) Intangible assets (including Goodwill) -1,130 -1,130 -1,130 -1,130 -1,130 -1,130 -1,130CA1 {1.1.1.10 +
1.1.1.11}
Articles 4(113), 36(1) point (b) and 37 of CRR. Articles
4(115), 36(1) point (b) and 37 point (a) of CCR
A.1.10(-) DTAs that rely on future profitability and do not arise from temporary
differences net of associated DTLs -648 -610 -522 -442 -1,128 -1,368 -1,620 CA1 {1.1.1.12} Articles 36(1) point (c) and 38 of CRR
A.1.11 (-) IRB shortfall of credit risk adjustments to expected losses -230 -190 -150 -112 -224 -206 -186 CA1 {1.1.1.13} Articles 36(1) point (d), 40 and 159 of CRR
A.1.12 (-) Defined benefit pension fund assets 0 0 0 0 0 0 0 CA1 {1.1.1.14} Articles 4(109), 36(1) point (e) and 41 of CRR
A.1.13 (-) Reciprocal cross holdings in CET1 Capital 0 0 0 0 0 0 0 CA1 {1.1.1.15} Articles 4(122), 36(1) point (g) and 44 of CRR
A.1.14 (-) Excess deduction from AT1 items over AT1 Capital 0 0 0 0 0 0 0 CA1 {1.1.1.16} Article 36(1) point (j) of CRR
A.1.15(-) Deductions related to assets which can alternatively be subject to a 1.250% risk
weight0 0 0 0 0 0 0
CA1 {1.1.1.17 to
1.1.1.21}
Articles 4(36), 36(1) point (k) (i) and 89 to 91 of CRR;
Articles 36(1) point (k) (ii), 243(1) point (b), 244(1) point
(b) and 258 of CRR; Articles 36(1) point k) (iii) and 379(3)
of CRR; Articles 36(1) point k) (iv) and 153(8) of CRR and
A.1.15.1 Of which: from securitisation positions (-) 0 0 0 0 0 0 0 CA1 {1.1.1.18.1}Articles 36(1) point (k) (ii), 243(1) point (b), 244(1) point
(b) and 258 of CRR
A.1.16(-) Holdings of CET1 capital instruments of financial sector entities where the
institiution does not have a significant investment0 0 0 0 0 0 0 CA1 {1.1.1.22}
Articles 4(27), 36(1) point (h); 43 to 46, 49 (2) and (3) and
79 of CRR
A.1.17(-) Deductible DTAs that rely on future profitability and arise from temporary
differences0 0 0 0 0 0 0 CA1 {1.1.1.23}
Articles 36(1) point (c) and 38; Articles 48(1) point (a) and
48(2) of CRR
A.1.18(-) Holdings of CET1 capital instruments of financial sector entities where the
institiution has a significant investment0 0 0 0 0 0 0 CA1 {1.1.1.24}
Articles 4(27); 36(1) point (i); 43, 45; 47; 48(1) point (b);
49(1) to (3) and 79 of CRR
A.1.19 (-) Amount exceding the 17.65% threshold 0 0 0 0 0 0 0 CA1 {1.1.1.25} Article 470 of CRR
A.1.20 Transitional adjustments 2,737 2,376 1,914 1,467 2,866 2,503 2,006CA1 {1.1.1.6 + 1.1.8 +
1.1.26}-
A.1.20.1 Transitional adjustments due to grandfathered CET1 Capital instruments (+/-) 2,333 2,000 1,667 1,333 2,000 1,667 1,333 CA1 {1.1.1.6}
Articles 483(1) to (3), and 484 to 487 of CRR
A.1.20.2 Transitional adjustments due to additional minority interests (+/-) 0 0 0 0 0 0 0 CA1 {1.1.1.8}
Articles 479 and 480 of CRR
A.1.20.3Other transitional adjustments to CET1 Capital excl. adjustments for Sovereign
exposure in AFS (+/-)404 376 247 133 866 837 672 CA1 {1.1.1.26}
Articles 469 to 472, 478 and 481 of CRR
A.2ADDITIONAL TIER 1 CAPITAL (net of deductions and after transitional
adjustments)1,896 1,571 1,381 1,191 1,571 1,381 1,191 CA1 {1.1.2} Article 61 of CRR
A.2.1 Of which: (+) Other existing support government measures 0 0 0 0 0 0 0 - -
A.3 TIER 1 CAPITAL (net of deductions and after transitional adjustments) 13,673 12,751 13,033 12,826 11,996 11,013 9,681 CA1 {1.1} Article 25 of CRR
A.4 TIER 2 CAPITAL (net of deductions and after transitional adjustments) 2,753 3,419 3,611 3,802 3,432 3,649 3,850 CA1 {1.2} Article 71 of CRR
B TOTAL RISK EXPOSURE AMOUNT 92,873 92,993 93,368 93,636 96,087 100,680 102,697 CA2 {1} Articles 92(3), 95, 96 and 98 of CRR
B.1of which: stemming from exposures that fall below the 10% / 15% limits for
CET1 deduction (+)0 0 0 0 0 0 0
Articles 36(1) points (a) and (i); Article 38 and Article 48 of
CRR
B.2 of which: stemming from from CVA capital requirements (+) 0 0 0 0 0 0 0 Article 381 to 386 of CRR
B.3of which: stemming from higher asset correlation parameter against exposures
to large financial institutions under IRB the IRB approaches to credit risk (+)0 0 0 0 0 0 0 Articles 153(2) of CRR
B.4of which: stemming from the application of the supporting factor to increase
lending to SMEs (-)0 0 0 0 0 0 0 Recital (44) of CRR
B.5
of which: stemming from the effect of exposures that were previously part of
Risk Exposure amount and receive a deduction treatment under CRR/CRDIV (-
)
0 0 0 0 0 0 0 -
B.6 of which: others subject to the discretion of National Competent Authorities 0 0 0 0 0 0 0 Article 124 to 164 of CRR
C.1 Common Equity Tier 1 Capital ratio 12.68% 12.02% 12.48% 12.43% 10.85% 9.57% 8.27% CA3 {1} -
C.2 Tier 1 Capital ratio 14.72% 13.71% 13.96% 13.70% 12.48% 10.94% 9.43% CA3 {3} -
C.3 Total Capital ratio 17.69% 17.39% 17.83% 17.76% 16.06% 14.56% 13.18% CA3 {5} -
D Common Equity Tier 1 Capital Threshold 7,439 7,469 7,491 5,285 5,537 5,648
ETotal amount of instruments with mandatory conversion into ordinary shares upon
a fixed date in the 2014 -2016 period (cumulative conversions) (1)0 0 0 0 0 0
F
Total Additional Tier 1 and Tier 2 instruments eligible as regulatory capital under
the CRR provisions that convert into Common Equity Tier 1 or are written down
upon a trigger event (2)
0 0 725
F.1Of which: eligible instruments whose trigger is above CET1 capital ratio in the
adverse scenario (2)0 0 0
G Fully Loaded Common Equity Tier 1 Capital ratio (3) 10.86% 6.31%
(1) Conversions not considered for CET1 computation(2) Excluding instruments included in E(3) Memorandum item based on a fully implemented CRR/CRD IV definition of Common Equity Tier 1 capital including 60% of unrealised gains/losses from Sovereign Exposure in AFS portfolio
Memorandum items
Baseline Scenario Adverse Scenario
OWN FUNDS
OWN FUNDS
REQUIREMENTS
CAPITAL RATIOS (%) -
Transitional period

2014 EU-wide Stress Test - Restructuring scenarios
(mln EUR)
2013 0 0
2014 -1 -463 -23 -502
Resecuritisations related to the KBC FP originated CDOs. Commission
Decisions C18/2009 and SA.29833 (MC11/2009) which stipulate that KBC
cannot originate any new CDOs and will phase out the existing CDO portfolio.
2015 -1 -1 -14 -85
2016 0 -1 -9 -56
Total -2 -465 -47 -643
Effects of mandatory restructuring plans publicly announced before 31 December 2013 and formally agreed with the European Commission.
Baseline scenario Adverse scenarioNarrative description of the transactions. (type, date of
completion/commitment, portfolios, subsidiaries, branches) CET1 impact
Risk exposure
amount impactCET1 impact
Risk exposure
amount impact

2014 EU-wide Stress Test
Outcome of the Stress Test based on the Restructuring plan for banks whose plan was formally agreed with the European Commission after 31 December 2013
(mln EUR)
As of
31/12/2013
As of
31/12/2014
As of
31/12/2015
As of
31/12/2016
As of
31/12/2014
As of
31/12/2015
As of
31/12/2016
COMMON EQUITY TIER 1 CAPITAL (net of deductions and after applying transitional adjustments)
TOTAL RISK EXPOSURE AMOUNT
COMMON EQUITY TIER 1 RATIO #DIV/0! #DIV/0! #DIV/0! #DIV/0! #DIV/0! #DIV/0! #DIV/0!
Baseline scenario Adverse scenario

2014 EU-wide Stress Test
Impact on Common
Equity Tier 1
Million EUR
Raising of capital instruments eligible as CET1 capital (+) 0
Repayment of CET1 capital, buybacks (-) -500
Conversion to CET1 of hybrid instruments becoming effective between 1 January and 30 September 2014 (+) 0
Impact on Additional
Tier 1 and Tier 2
Million EUR
Net issuance of Additional Tier 1 and T2 Instruments with a trigger at or above bank's post stress test CET1 ratio in the adverse
scenario during the stress test horizon (+/-)0
Net issuance of Additional Tier 1 and T2 Instrument with a trigger below bank's post stress test CET1 ratio in the adverse
scenario during the stress test horizon (+/-)1,400
Million EUR
Realized fines/litigation costs from 1 January to 30 September 2014 (net of provisions) (-) 0
Other material losses and provisions from 1 January to 30 September 2014 (-) 0
Major Capital Measures from 1 January to 30 September 2014
Losses
Net issuance of Additional Tier 1 and T2 Instruments
Issuance of CET 1 Instruments
Major Capital Measures Impacting Tier 1 and Tier 2 Eligible Capital from 1 January 2014 to 30 September 2014


