Download - 2013 Water Quality Assessment Update
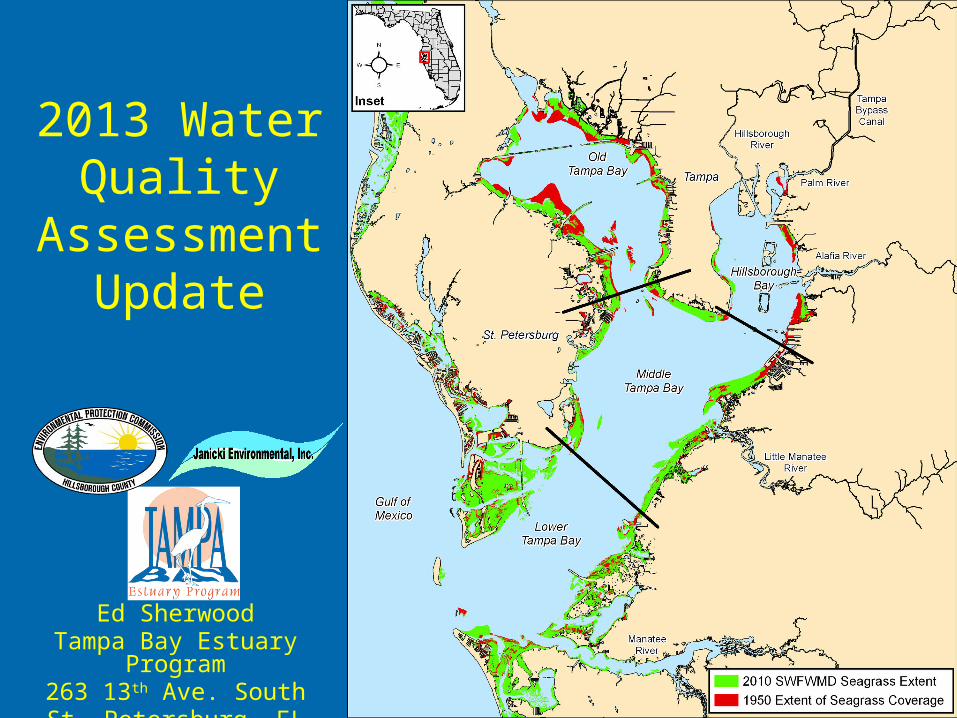
2013 Water Quality
Assessment Update
Ed SherwoodTampa Bay Estuary Program
263 13th Ave. SouthSt. Petersburg, FL 33701

Annual Decision Support Process
• Annual report card for Tampa Bay
• Specific to each of the 4 major bay segments
• Provides for adaptive management of a sentinel estuarine indicator (seagrass)
Reduce Nitrogen
Loads
Reduce Chloro-
phyll
IncreaseWaterClarity
IncreaseSea-grassCover
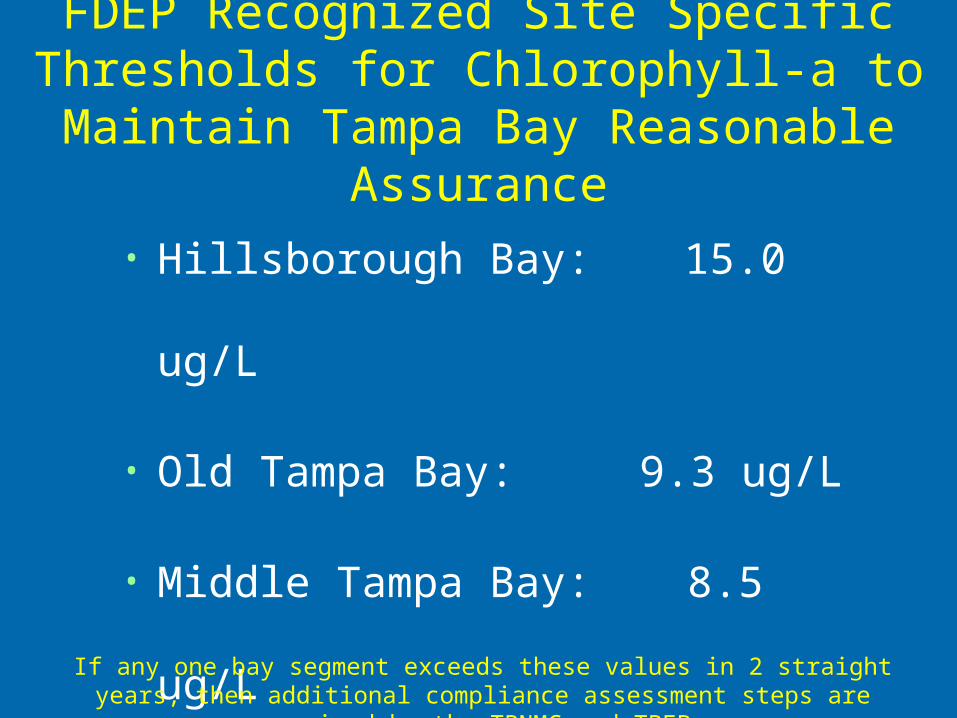
FDEP Recognized Site Specific Thresholds for Chlorophyll-a to Maintain Tampa Bay
Reasonable Assurance
• Hillsborough Bay: 15.0 ug/L
• Old Tampa Bay: 9.3 ug/L
• Middle Tampa Bay: 8.5 ug/L
• Lower Tampa Bay: 5.1 ug/L
If any one bay segment exceeds these values in 2 straight years, then additional compliance assessment steps are required by the TBNMC and TBEP.

Bay Segment MeetingFDEP Threshold?
Bay Segment
Chlorophyll-a(ug/L)
2013Average
FDEP RA Thresholds
Old Tampa Bay 8.7 9.3
Hillsborough Bay 12.9 15.0
Middle Tampa Bay 6.8 8.5
Lower Tampa Bay 3.9 5.1
Year Old Tampa Bay
Hills. Bay
Mid. Tampa Bay
Lower Tampa Bay
1975 No No No Yes
1976 No No No Yes
1977 No No No No
1978 No No No Yes
1979 No No No No
1980 No No No No
1981 No No No No
1982 No No No No
1983 No No No No
1984 Yes Yes No Yes
1985 No No No Yes
1986 No No Yes Yes
1987 No Yes No Yes
1988 Yes Yes Yes Yes
1989 No Yes Yes Yes
1990 No Yes Yes Yes
1991 Yes Yes Yes Yes
1992 Yes Yes Yes Yes
1993 Yes Yes Yes Yes
1994 No No No No
1995 No No No Yes
1996 Yes Yes Yes Yes
1997 Yes Yes Yes Yes
1998 No No No No
1999 Yes Yes Yes Yes
2000 Yes Yes Yes Yes
2001 Yes Yes Yes Yes
2002 Yes Yes Yes Yes
2003 No Yes Yes Yes
2004 No Yes Yes Yes
2005 Yes Yes Yes No
2006 Yes Yes Yes Yes
2007 Yes Yes Yes Yes
2008 Yes Yes Yes Yes
2009 No Yes Yes Yes
2010 Yes Yes Yes Yes
2011 No Yes Yes Yes
2012 Yes Yes Yes Yes
2013 Yes Yes Yes Yes

Chlorophyll-a
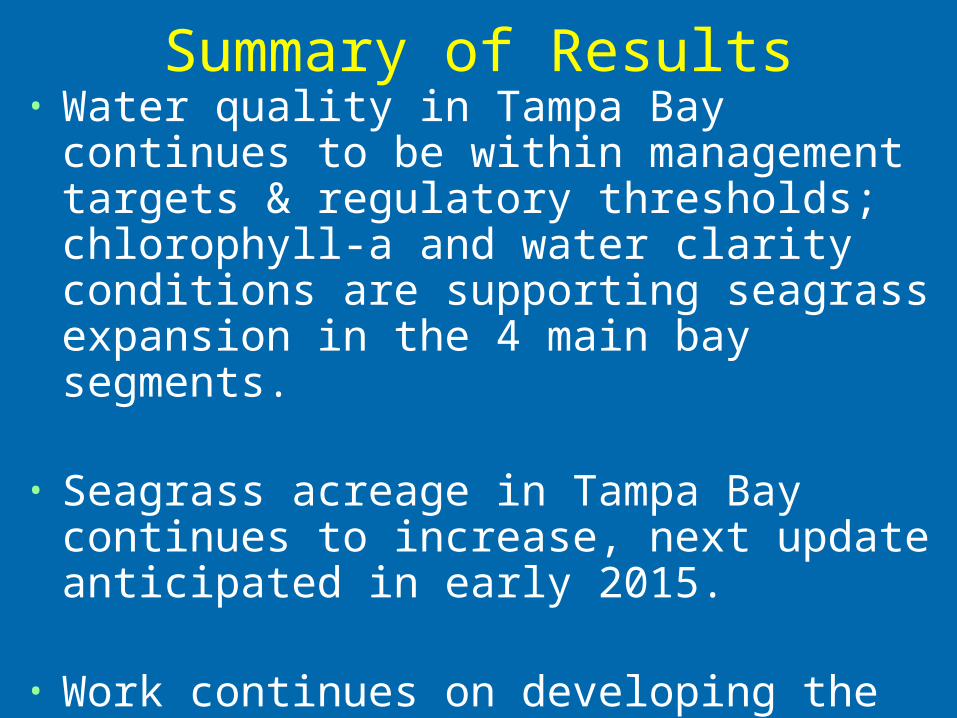
Summary of Results• Water quality in Tampa Bay continues to be
within management targets & regulatory thresholds; chlorophyll-a and water clarity conditions are supporting seagrass expansion in the 4 main bay segments.
• Seagrass acreage in Tampa Bay continues to increase, next update anticipated in early 2015.
• Work continues on developing the integrated model for OTB; 2012 RA Update Accepted by FDEP in April 2013
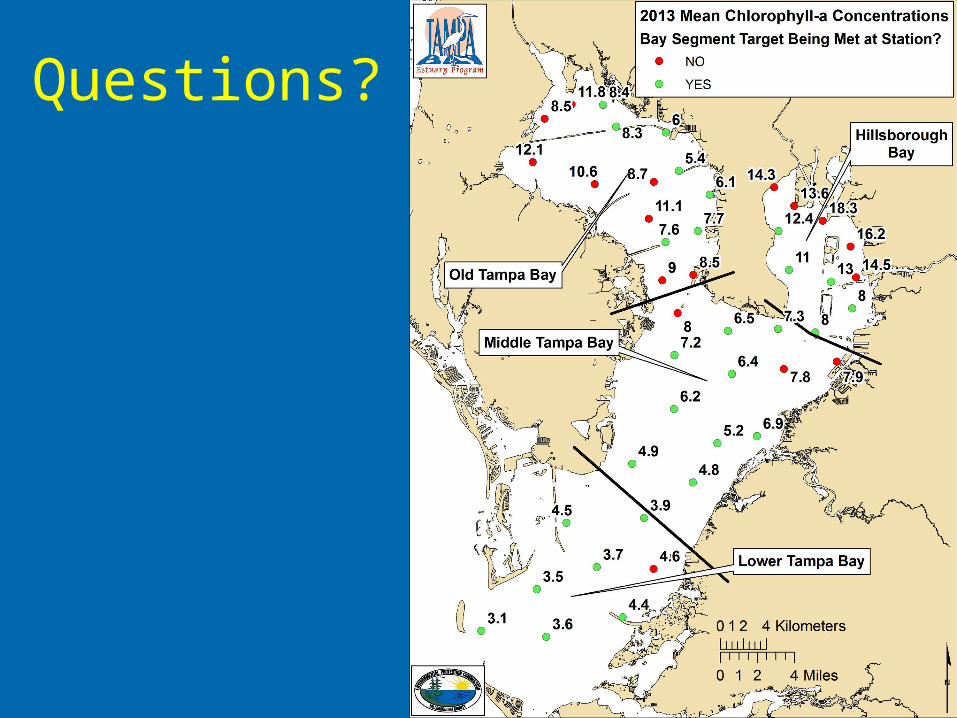
Questions?
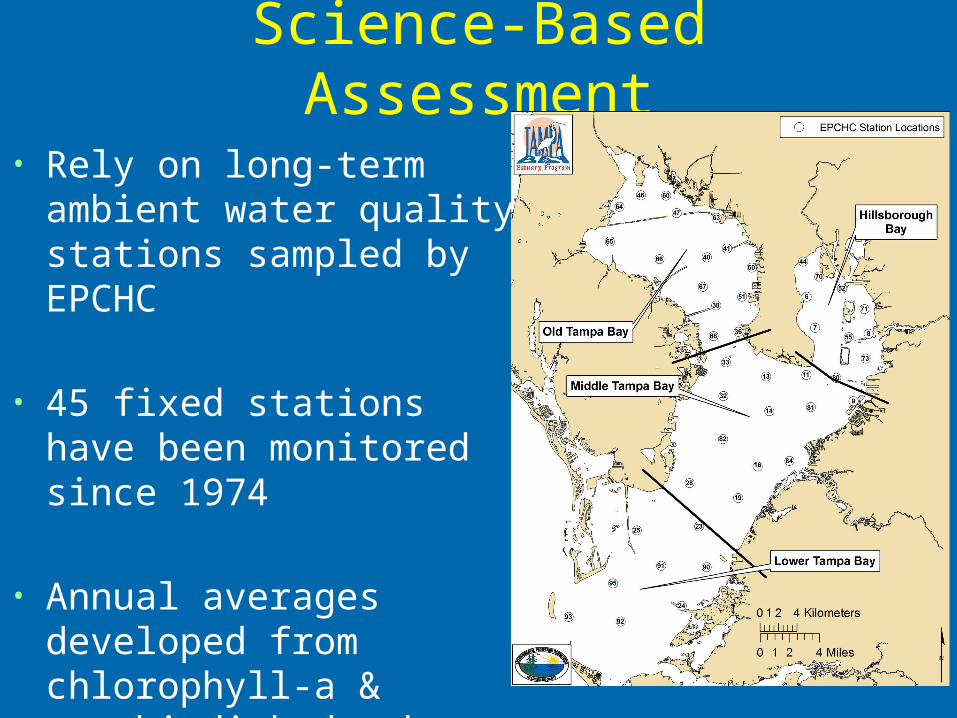
Science-Based Assessment
• Rely on long-term ambient water quality stations sampled by EPCHC
• 45 fixed stations have been monitored since 1974
• Annual averages developed from chlorophyll-a & secchi disk depth measurements

Management Framework• Bay segment annual
average values compared to established bay segment targets for chlorophyll-a and water clarity
• Results of each comparison placed into decision matrix framework
• Overall management response determined for each bay segment
Green
“Stay the course;” partners continue with planned projects to implement the CCMP. Data summary and reporting via the
Baywide Environmental Monitoring Report and annual assessment and progress reports.
Yellow
TAC and Management Board on caution alert; review monitoring data and loading estimates; attempt to identify causes of
target exceedences; TAC report to Management Board on findings and recommended responses needed.
Red
TAC, Management and Policy Boards on alert; review and report by TAC to Management Board on recommended types of
responses. Management and Policy Boards take appropriate actions to get the program back on track.

Light Attenuation

YearOld Tampa
BayHills. Bay
Mid. TampaBay
LowerTampaBay
1976 Red Red Red Yellow
1977 Red Red Red Red
1978 Red Red Red Yellow
1979 Red Red Red Red
1980 Red Red Red Red
1981 Red Red Red Red
1982 Red Red Red Red
1983 Red Yellow Red Red
1984 Red Green Red Yellow
1985 Red Red Red Yellow
1986 Red Yellow Red Green
1987 Red Yellow Red Green
1988 Yellow Green Yellow Green
1989 Red Yellow Red Yellow
1990 Red Green Red Yellow
1991 Green Yellow Yellow Yellow
1992 Yellow Green Yellow Yellow
1993 Yellow Green Yellow Yellow
1994 Yellow Yellow Red Red
1995 Red Yellow Red Yellow
1996 Yellow Green Yellow Green
1997 Yellow Green Red Yellow
1998 Red Red Red Red
1999 Yellow Green Yellow Yellow
2000 Green Green Yellow Yellow
2001 Yellow Green Yellow Yellow
2002 Yellow Green Green Green
2003 Red Yellow Green Yellow
2004 Red Green Green Yellow
2005 Green Green Yellow Yellow
2006 Green Green Green Green
2007 Green Green Green Green
2008 Yellow Green Green Yellow
2009 Yellow Yellow Green Green
2010 Green Green Green Green
2011 Red Green Yellow Green
2012 Green Green Green Green
2013 Green Green Green Green
BaySeg-ment
Chlorophyll-a(ug/L)
LightAttenuation (m-1) Resulting
Manage-ment
Response2013TBEPTarget
2013TBEPTarget
Old TB
8.7* 8.5 0.57 0.83 Green
Hills.Bay
12.9 13.2 0.99 1.58 Green
Mid.TB
6.8 7.4 0.57 0.83 Green
LowerTB
3.9 4.6 0.45 0.63 Green
2013 Results
*Less than a small magnitude exceedence

Additional Background Slides

2012 & 2013 Chlorophyll-a Spatial Distribution

2011 & 2012 Chlorophyll-a Spatial Distribution
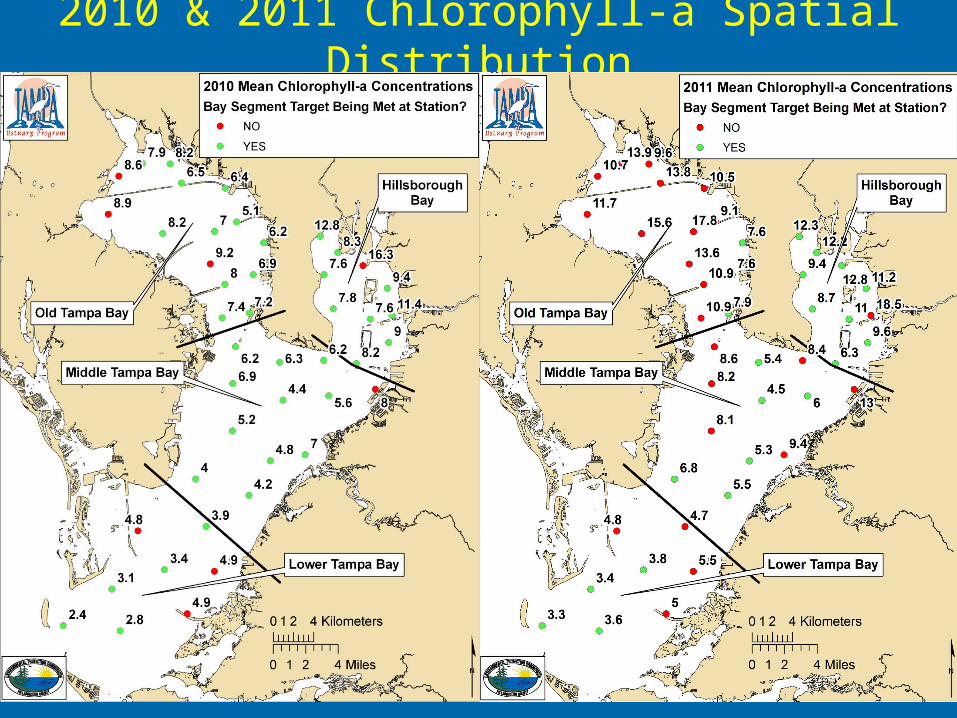
2010 & 2011 Chlorophyll-a Spatial Distribution
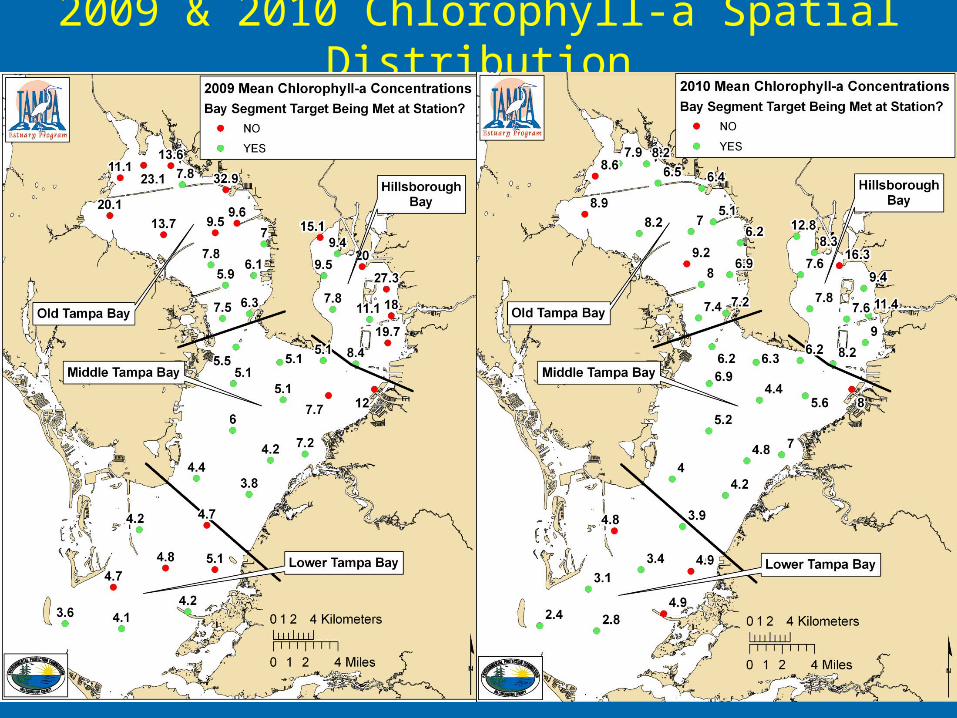
2009 & 2010 Chlorophyll-a Spatial Distribution

2008 & 2009 Chlorophyll-a Spatial Distribution

Questions?
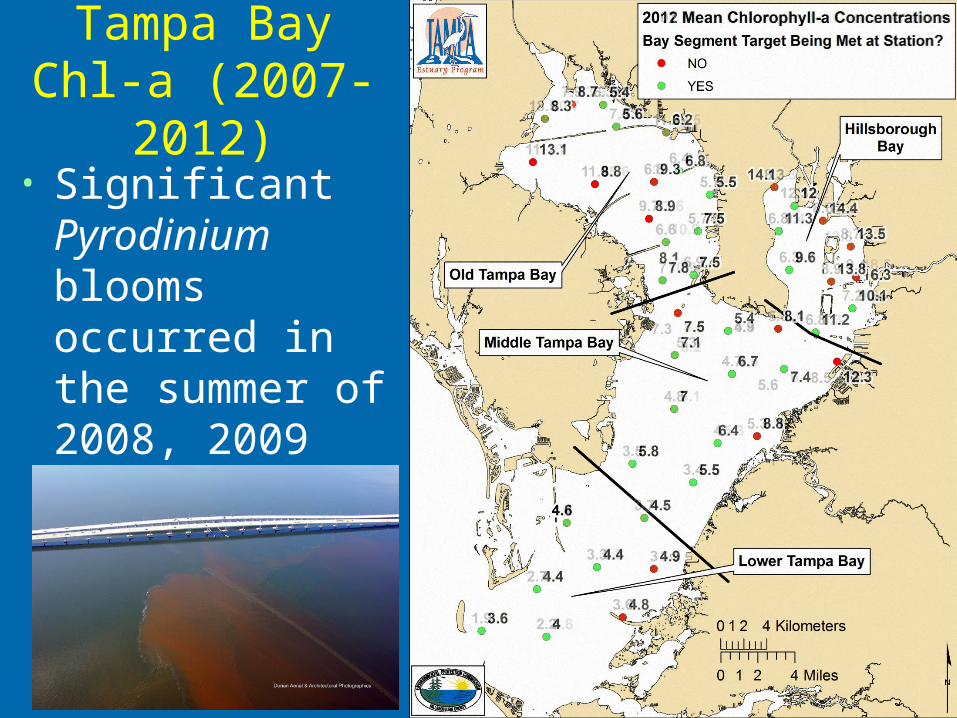
Tampa Bay Chl-a (2007-2012)
• Significant Pyrodinium blooms occurred in the summer of 2008, 2009 and 2010

2010 Seagrass Estimates
• All TB segments showed increased acreage
• Upper bay segments still have room to “grow”
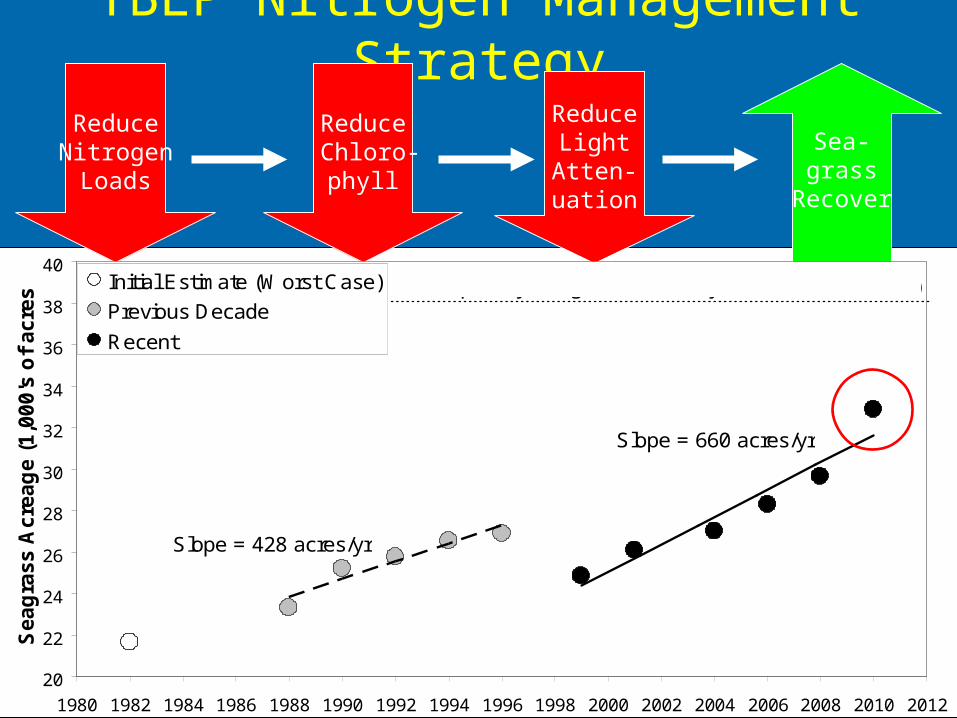
TBEP Nitrogen Management Strategy
Reduce Nitrogen
Loads
Reduce Chloro-
phyll
ReduceLightAtten-uation
Sea-grass
Recover
Slope = 428 acres/yr
Slope = 660 acres/yr
20
22
24
26
28
30
32
34
36
38
40
1980 1982 1984 1986 1988 1990 1992 1994 1996 1998 2000 2002 2004 2006 2008 2010 2012
Se
ag
ras
s A
cre
ag
e (
1,0
00
's o
f a
cre
s) Initial Estimate (Worst Case)
Previous Decade
Recent
Tampa Bay Seagrass Recovery Goal (38, 000 acres)

298 acres/yr
660 acres/yr
20
22
24
26
28
30
32
34
36
38
40
1980 1990 2000 2010 2020 2030 2040 2050
Sea
gra
ss C
ove
r (a
cres
x 1
,000
)
Observed Seagrass Coverage
Tampa Bay Seagrass Coverage Goal (38,000 acres)
Reducing Nitrogen Loads
• Tampa Bay Nitrogen Management Consortium formed in 1996
• Collectively accepted responsibility to reduce TN loads to Tampa Bay
• TN loads are capped at levels appropriate to maintain bay water quality for seagrass expansion
ReduceNitrogenLoads
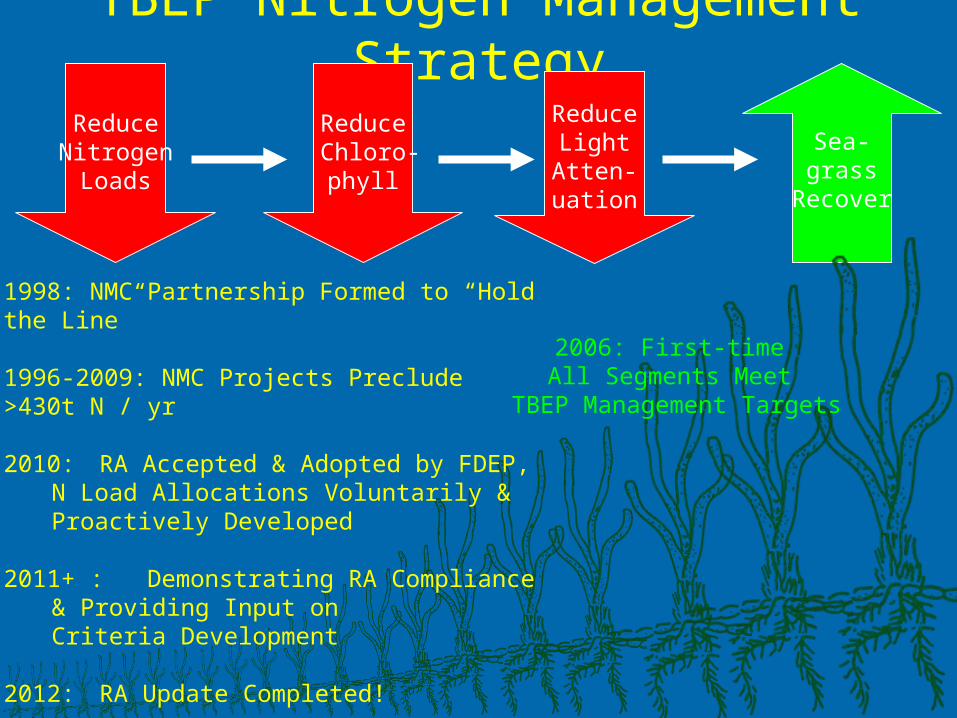
TBEP Nitrogen Management Strategy
Reduce Nitrogen
Loads
Reduce Chloro-
phyll
ReduceLightAtten-uation
2006: First-time All Segments Meet
TBEP Management Targets
Sea-grass
Recover
1998: NMC Partnership Formed to “Hold the Line”
1996-2009: NMC Projects Preclude >430t N / yr
2010: RA Accepted & Adopted by FDEP, N Load Allocations Voluntarily &Proactively Developed
2011+ : Demonstrating RA Compliance& Providing Input on Criteria Development
2012: RA Update Completed!

Management Framework• Bay segment annual
average values compared to established bay segment targets for chlorophyll-a and light attenuation
• Results of each comparison placed into decision matrix framework
• Overall management response determined for each bay segment
Green
“Stay the course;” partners continue with planned projects to implement the CCMP. Data summary and reporting via the
Baywide Environmental Monitoring Report and annual assessment and progress reports.
Yellow
TAC and Management Board on caution alert; review monitoring data and loading estimates; attempt to identify causes of
target exceedences; TAC report to Management Board on findings and recommended responses needed.
Red
TAC, Management and Policy Boards on alert; review and report by TAC to Management Board on recommended types of
responses. Management and Policy Boards take appropriate actions to get the program back on track.


2011 Chlorophyll-a Temporal Distribution

2011 Kd (Light Attenuation) Temporal Distribution

Observed Seagrass Gains & Losses
2001-2004 2004-2006
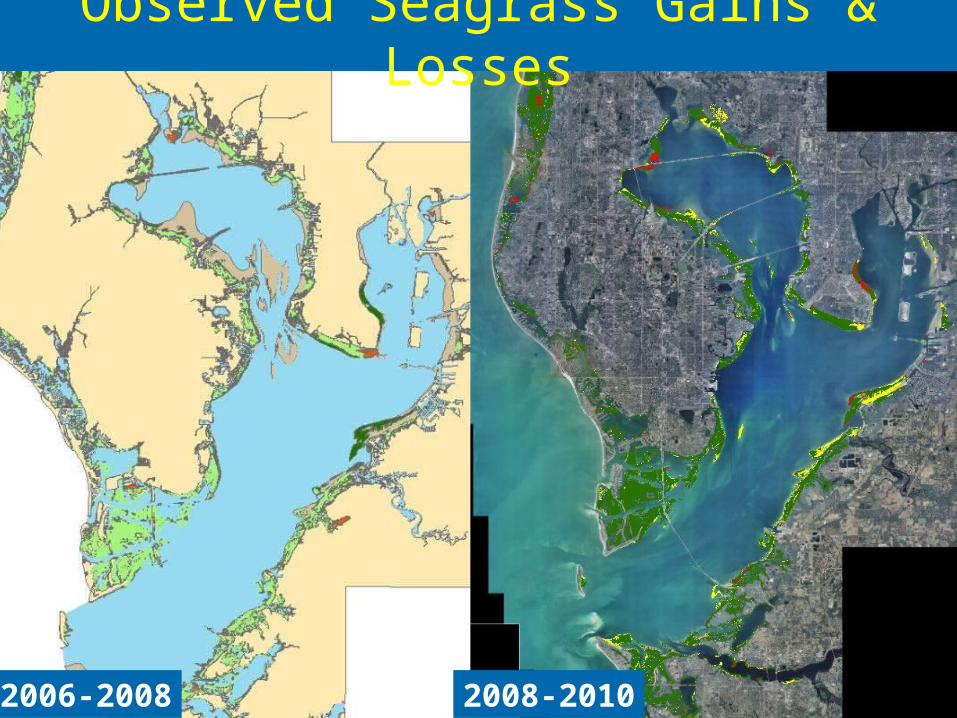
2006-2008
Observed Seagrass Gains & Losses
2008-2010


