
2013
Total Number of Free Mammograms Performed:
1,555
1

2013 Tracking Report
Facility# Mamm committed
# submitted for payment Scheduled Served No shows
Allegan General Hospital 84 84 94 84 10
Borgess Medical Center - All sites, Borgess Breast, Woodbridge, Westside, Lee and Pipp 350 345 350 345 5Bronson - Battle Creek 200 186 203 186 17
Bronson Center for Women, Bronson Woodbridge, Bronson ARS, Bronson Lakeview 405 Bronson ARS 62 75 62 13Woodbridge 43 47 43 4Center for Women 176 193 176 17Lakeview 72 75 72 3
Community Health Center - Branch 15 14 15 14 1
Lakeland Community Hospital - Niles 80 75 82 75 7Lakeland Community Hospital - Watervliet 65 61 69 61 8
Lakeland Healthcare - St. Joseph 155 143 154 143 11Oaklawn Hospital 120 117 119 117 2
South Haven Health System 75 63 76 63 13Sturgis Hospital 100 77 81 77 4Three Rivers Health 40 37 41 37 4TOTAL 1689 1555 1674 1555 119
Committed Invoiced and
Paid Scheduled
Served No Shows
Planned for 14% no show/cancellation. Actual 7.1% 2

Outcome of Mammogram Screening for 2013
Final Diagnosis Status as of 1/20/2014 Totals
Cancer Diagnosed (see breakout) 5Pending 6-month follow-up 55Benign / complete 79Not eligible/over-income 1No follow-up needed 5Total Referred for follow-up 145
3
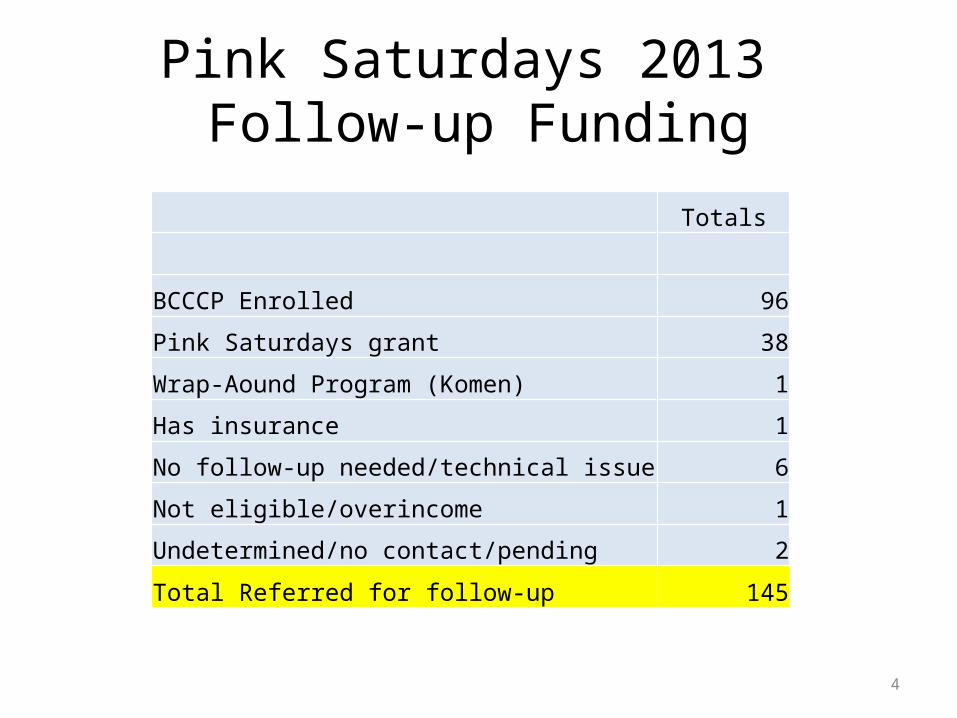
Totals
BCCCP Enrolled 96
Pink Saturdays grant 38
Wrap-Aound Program (Komen) 1
Has insurance 1
No follow-up needed/technical issue 6
Not eligible/overincome 1
Undetermined/no contact/pending 2
Total Referred for follow-up 145
Pink Saturdays 2013 Follow-up Funding
4

Cancer Diagnosis Breakout
Screening Radiology Site of Cancers Diagnosed Borgess Westside 1Bronson Advanced Radiology 2Bronson Battle Creek 1
Lakeland Community Watervliet 1 County of Residence of Diagnosed Patients Berrien 1Calhoun 1Kalamazoo 3
5
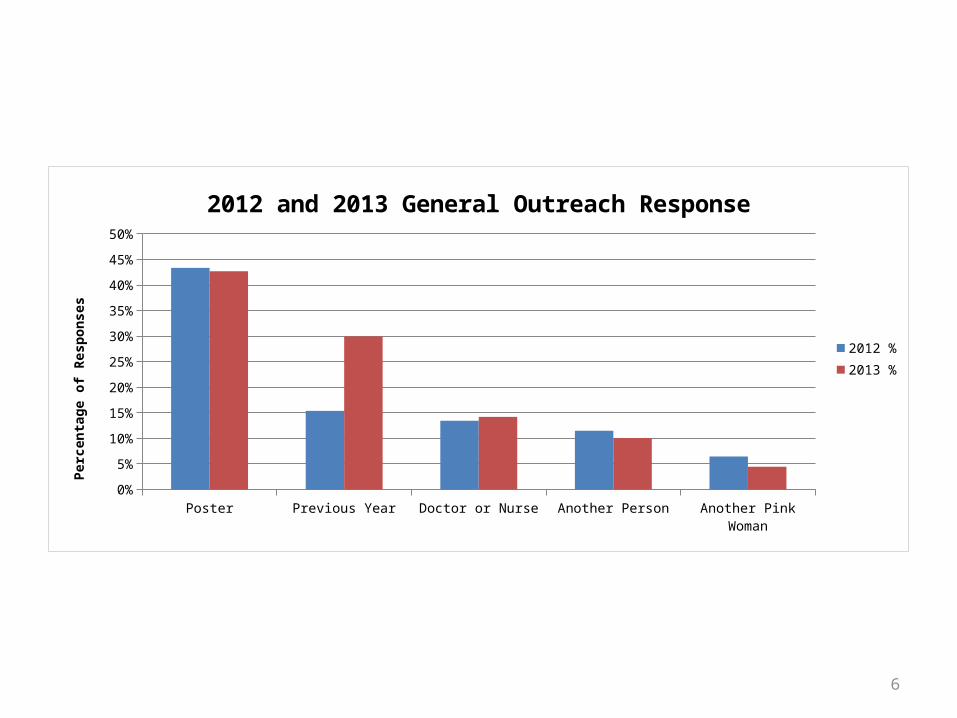
Poster Previous Year Doctor or Nurse Another Person Another Pink Woman0%
5%
10%
15%
20%
25%
30%
35%
40%
45%
50%
2012 and 2013 General Outreach Response
2012 %2013 %
Perc
enta
ge o
f Res
pons
es
6
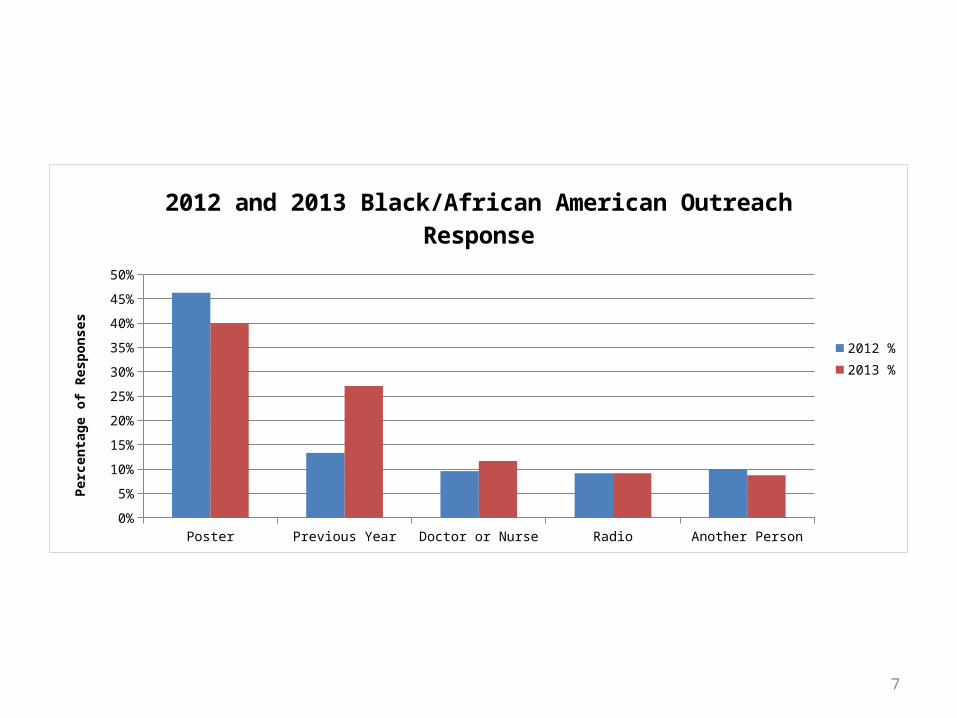
Poster Previous Year Doctor or Nurse Radio Another Person0%
5%
10%
15%
20%
25%
30%
35%
40%
45%
50%
2012 and 2013 Black/African American Outreach Response
2012 %2013 %
Perc
enta
ge o
f Res
pons
es
7

Poster Previous Year Doctor or Nurse Another Person Billboard0%
5%
10%
15%
20%
25%
30%
35%
40%
45%
50%
2012 and 2013 Hispanic/Latino Outreach Response
2012 %2013 %
Perc
enta
ge o
f Res
pons
es
8
Black/African American Hispanic/Latino0
50
100
150
200
250
300
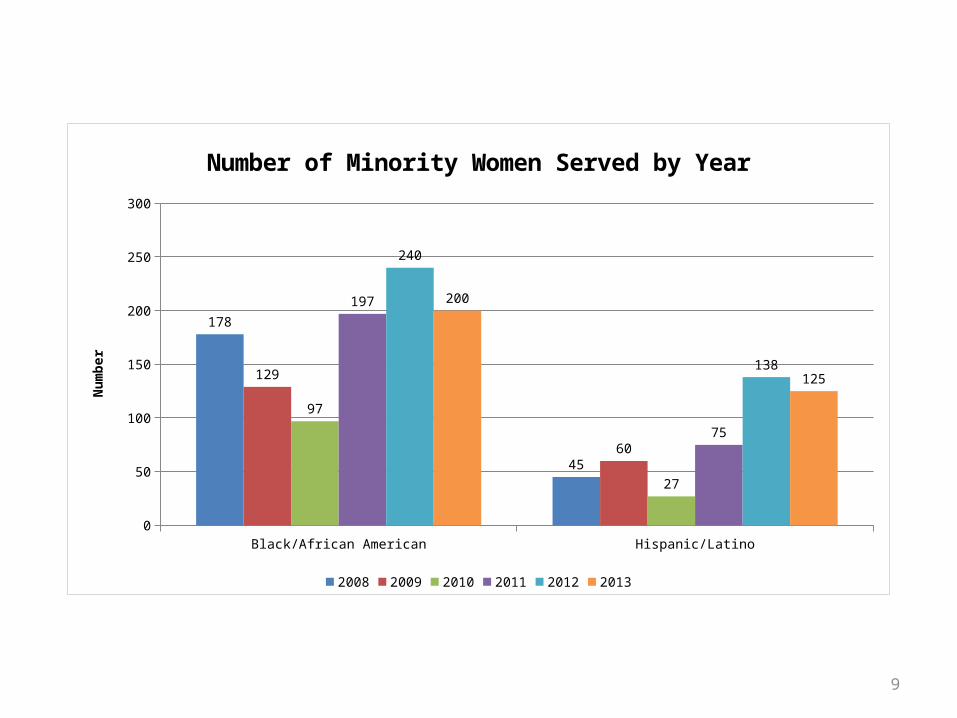
178
45
129
60
97
27
197
75
240
138
200
125
Number of Minority Women Served by Year
2008 2009 2010 2011 2012 2013
Num
ber
9

Black/African American Hispanic/Latino0.0%
2.0%
4.0%
6.0%
8.0%
10.0%
12.0%
14.0%
16.0%
14.1%
8.1%
12.4%
7.7%
Percentage of Minority Women Served
20122013
2012 Total = 1,7002013 Total = 1,555
10

40-44 45-49 50-54 55-59 60-640
50
100
150
200
250
300
350
400
450
500
319
405421
368
287
359
412438
385
304282
339
400
347
290
Number of Women Served by Age Group
2011 2012 2013
Num
ber
11
Pink Saturdays ProgramSince Inception
9,302 free mammograms
>793 referred for follow-up
40 women diagnosed with Breast Cancer
12

THANK YOU
13


