
1
2013 Greater Los Angeles Homeless Count Overall Results for Los Angeles County and Los Angeles Continuum of Care
Published by: The Los Angeles Homeless Services Authority
Updated August 20, 2013

Click to edit Master title style Presentation Overview
1. Scope and Limitations of Count
2. Executive Summary
3. Homeless Count Components
4. Key Findings
5. Methodology
6. Next Steps
2013 Greater Los Angeles Homeless Count
Homeless Count Overview
2

The Greater Los Angeles Homeless Count’s main purpose is to
answer very important questions about homelessness in Los
Angeles:
– The number of homeless persons (HOW MANY?)
– The demographic characteristics of homeless population
Examples: veteran homelessness, chronic homelessness, youth homelessness,
etc. (WHO?)
Barriers/benefits usage (HOW?)
– The location of our homeless (WHERE?)
What the count is not designed to answer is WHY
– Example: Why did the numbers increase or decrease by X% in my area?
2013 Greater Los Angeles Homeless Count Scope and Limitations of the Count
3

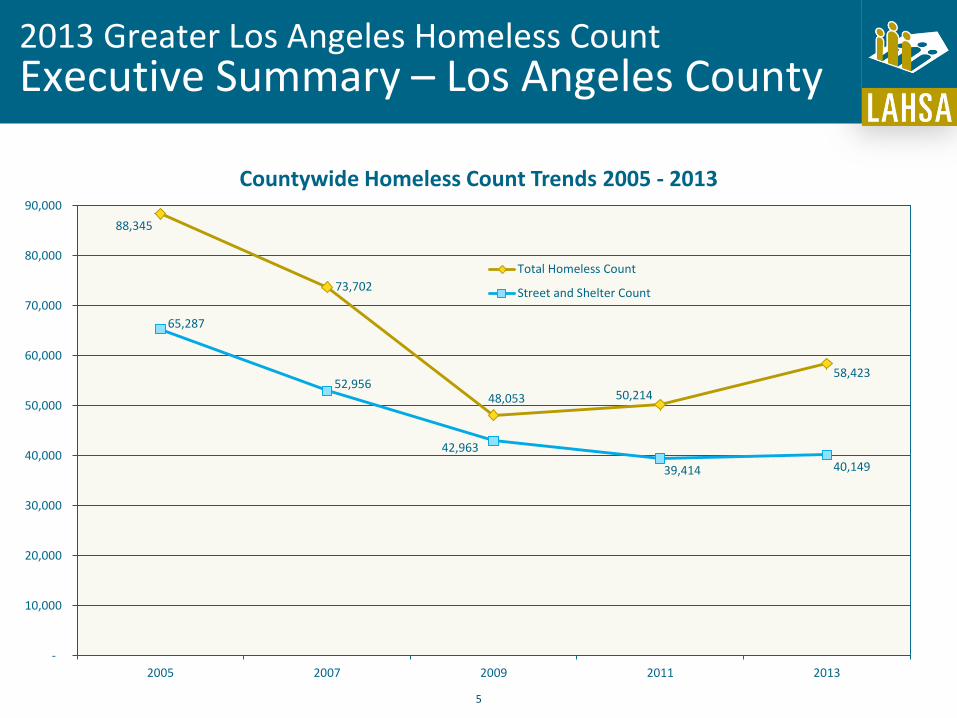
Los Angeles County-wide Homeless count:
– Homelessness in Los Angeles increased to 40,149 men, women and children,
or 1.9% in the street and shelter count before including homeless people
who would not have been seen in the street or shelter count (identified as
“Hidden Homeless”)
– When estimates for homeless people not counted during the street and
shelter count are included in the estimates, the number increases to 58,423
people, a 16% increase (8,209 people) when compared to the 50,214
counted in 2011 for Los Angeles County
Los Angeles County biennial estimates of homeless people has
included an estimate for hidden homeless since 2005.
2013 Greater Los Angeles Homeless Count Executive Summary – Los Angeles County
4
2013 Greater Los Angeles Homeless Count Executive Summary – Los Angeles County
88,345
73,702
48,053 50,214
58,423
65,287
52,956
42,963
39,414 40,149
-
10,000
20,000
30,000
40,000
50,000
60,000
70,000
80,000
90,000
2005 2007 2009 2011 2013
Countywide Homeless Count Trends 2005 - 2013
Total Homeless Count
Street and Shelter Count
5

2013 Greater Los Angeles Homeless Count Executive Summary – Los Angeles County
People who are sheltered represent only about 1 in 4 each night – 15,013 (26%)
were sheltered, while 43,410 had no safe place to stay (74%);
50,213 (86%) people who are homeless in Los Angeles are single adults
7,391 (13%) are family members including children
819 (1%) are unaccompanied youth under 18
Over the course of a year, at least 190,207 men, women and children experience
homelessness in Los Angeles County (annualized rate)
This annualized estimate is up 65,273 from the 2011 estimate of 124,934 people
experiencing homelessness over the year
6

2013 Greater Los Angeles Homeless Count Executive Summary – Los Angeles CoC
7
Los Angeles Continuum of Care 2013 Homeless Count:
– Homelessness in the LA CoC increased to 35,524 men, women and children, or 2.6%
in the street and shelter count over 2011 estimates, before including homeless
people who would not have been seen in the street or shelter count (identified as
“Hidden Homeless”)
– When estimates for homeless people not counted during the street and shelter
count are included in the estimates, the number increases to 53,798 people, an 18%
increase (8,376 people) when compared to the 45,422 counted in 2011 for the Los
Angeles Continuum of Care
Note: The Los Angeles Continuum of Care includes the County of Los Angeles and all cities
in the County except for Long Beach, Glendale and Pasadena. These cities each operate
separate CoCs.

2013 Greater Los Angeles Homeless Count Executive Summary – Los Angeles CoC
59,233
47,862
32,726 34,622 35,524
82,291
68,608
42,694 45,422
53,798
-
10,000
20,000
30,000
40,000
50,000
60,000
70,000
80,000
90,000
2005 2007 2009 2011 2013
Continuum of Care Homeless Trends 2005 - 2013
Street and Shelter Count
Total Homeless Count
8

2013 Greater Los Angeles Homeless Count Executive Summary – Los Angeles CoC
People who are sheltered represent only about 1 in 4 each night – 12,934 (24%)
were sheltered, while 40,864 had no safe place to stay (76%)
46,303 (86%) of those homeless in Los Angeles are single adults
6,678 (12%) are family members including children
817 (2%) are unaccompanied youth under 18
1 in 4 homeless adults are chronically homeless (have disabling conditions and
are experiencing long term street homelessness)
1 in 3 homeless adults have mental and/or physical disabilities
Approximately 1 in 9 is a veteran
For Federal Homeless Assistance, Los Angeles County is comprised of four Homeless Continua of Care (systems to
address homelessness). The Los Angeles Continuum represents about 90% of the total of Los Angeles County. Other
CoCs in the County include the cities of Long Beach, Glendale and Pasadena.
9

2013 Greater Los Angeles Homeless Count Executive Summary – Los Angeles CoC
Veteran homelessness has experienced a significant decrease (-23%), from 8,131
men and women in 2011 to 6,248 in 2013
An even larger decrease (-505) was seen in homeless female veterans, going
from 909 in 2011 to 352 in 2013 (-61%)
Chronically homeless family members have decreased as well, from 2,730 adults
and children in 2011 to 1,227 adults and children in 2013 (-55%)
Adult single men represented the fastest growing segment of people
experiencing homelessness in the LA CoC; adult men represented 59% of the
homeless population in 2011, and now represent 68% of the total homeless
population
10

2013 Greater Los Angeles Homeless Count Executive Summary – Los Angeles CoC
The 2013 homeless count also showed a shift in demographics; there has been a
significant increase in the ratio of White/Caucasian homeless persons over the
2011 count, increasing from 25% to 37% of the total population
African American/Black and Hispanic/Latino populations have both decreased by
approximately 6% each, to 38% and 22% respectively
11
2013 Greater Los Angeles Homeless Count Homeless Count Background
In 2004, HUD mandated that CoCs conduct a homeless count during the last 10
days of January, every two years
The City and County of Los Angeles agreed to comply with the HUD mandate
The first census was held in January 2005; the same methodological components
have been used in Los Angeles County since 2005
LAHSA’s first counts used random sampling to select census tracts to target in
the count
The 2013 count was conducted January 29-31 for the Los Angeles Continuum;
the cities of Glendale, Long Beach and Pasadena also conducted counts during
the last 10 days of January
12

2013 Greater Los Angeles Homeless Count Homeless Count Background
In 2009, LAHSA created the Opt In Program, which allows cities and communities
to count 100% of their community’s jurisdiction and recruit their own volunteers
In 2013, the Count PLUS program was introduced as an enhancement to the Opt
In Program
Homeless Count Census Tracts, 2005 - 2013
Census Tracts
Change vs. Prior Count
# % # %
Census Tracts in Overall LA CoC
1,887 100%
2005 Count 510 27% - -
2007 Count 505 27% -5 -1%
2009 Count 754 40% +249 +49%
2011 Count 922 49% +168 +22%
2013 Count 1,355 72% +433 +47%
CountPLUS communities and cities
count 100% of their census tracts and
conduct demographic surveys as well
The Homeless Count has a margin of
error of less than 5% - making it as
robust as any major survey;
confidence level is 95%
13
2013 Greater Los Angeles Homeless Count Essential Components of the Count
The methodology used in homeless counts has been consistent
with prior years and include:
– Shelter Count
– Street Count
– Youth Count
– Telephone Survey to Identify the Hidden Homeless
– Demographic Survey
14

2013 Greater Los Angeles Homeless Count
Key Findings - Los Angeles County
Homeless Definitions
For purposes of reporting homeless count data to the U.S. Department of
Housing and Urban Development, all Continua of Care use a “literal homeless”
definition: “Men, women and children who are:
– Sleeping in places not meant for human habitation, including on the street, in parks,
along rivers, in backyards, unconverted garages, cars and vans, along freeways or
under overpasses, and the like;
– Sleeping in emergency shelters, safe havens, or transitional housing programs and
were homeless upon entry into the program”
Other federal, state and local programs use expanded definitions for
homelessness, which are not included in these estimates. However, we believe
that these other numbers are important as they, at a minimum, indicate housing
instability and may include, but are not limited to, people who experience literal
homelessness 15
2013 Greater Los Angeles Homeless Count Key Findings - Los Angeles County
The Los Angeles Continuum is the only continuum in Los Angeles County that
conducts a Hidden Homeless survey. For comparative purposes, numbers for the
LACoC are shown with and without the Hidden Homeless estimates
– Before factoring in the Hidden Homeless estimates, Los Angeles County saw a 1.9%
increase in its homeless populations
– After considering estimates for homeless men and women not seen during the
street count (hidden homeless), the increase is 16.3% countywide, or 8,209 more
than 2011
Two Continua, Los Angeles and Long Beach reported increases in homelessness,
and two Continua, Pasadena and Glendale, reported reductions in homelessness
Los Angeles, the largest Continuum, reported an increase of 2.6%, or 902 people
before the hidden homeless estimate, and 18.4% increase or 8,376 more
homeless people over the 2011 count
16
2013 Greater Los Angeles Homeless Count Key Findings - Los Angeles County
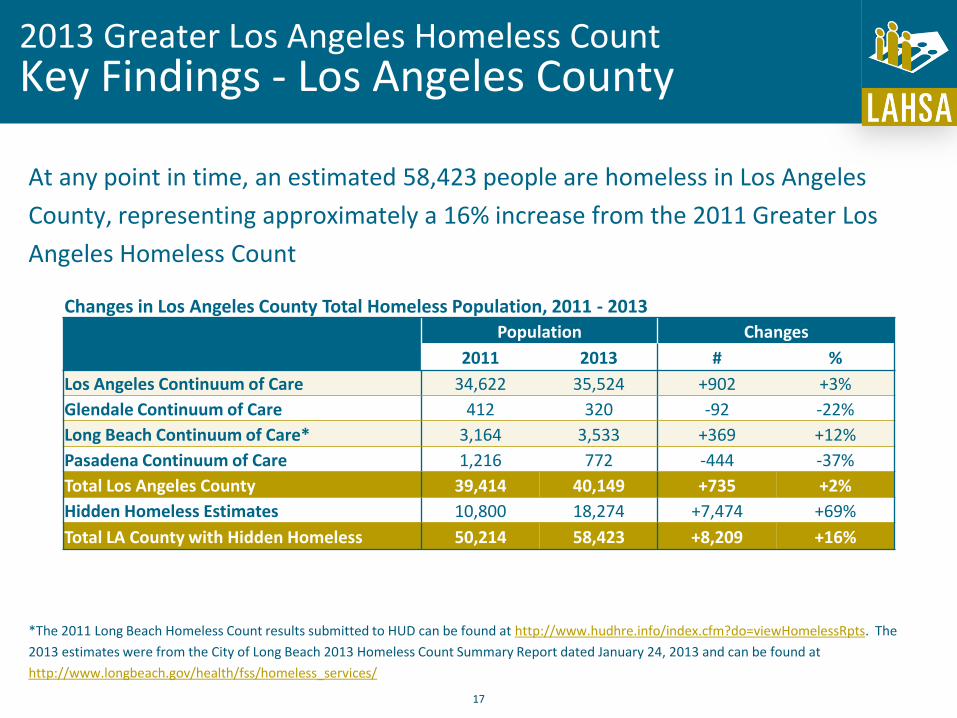
At any point in time, an estimated 58,423 people are homeless in Los Angeles
County, representing approximately a 16% increase from the 2011 Greater Los
Angeles Homeless Count
Changes in Los Angeles County Total Homeless Population, 2011 - 2013
Population Changes
2011 2013 # %
Los Angeles Continuum of Care 34,622 35,524 +902 +3%
Glendale Continuum of Care 412 320 -92 -22%
Long Beach Continuum of Care* 3,164 3,533 +369 +12%
Pasadena Continuum of Care 1,216 772 -444 -37%
Total Los Angeles County 39,414 40,149 +735 +2%
Hidden Homeless Estimates 10,800 18,274 +7,474 +69%
Total LA County with Hidden Homeless 50,214 58,423 +8,209 +16%
17
*The 2011 Long Beach Homeless Count results submitted to HUD can be found at http://www.hudhre.info/index.cfm?do=viewHomelessRpts. The
2013 estimates were from the City of Long Beach 2013 Homeless Count Summary Report dated January 24, 2013 and can be found at
http://www.longbeach.gov/health/fss/homeless_services/

2013 Greater Los Angeles Homeless Count Key Findings - Los Angeles County
Sheltered, Unsheltered and Hidden Homeless Results
Changes in Homeless Population (Excluding Hidden Homeless), 2011 - 2013
Total Sheltered Unsheltered
# % # % # %
2013 40,149 100.0% 15,013 37.4% 25,136 62.6%
2011 39,414 100.0% 18,587 47.2% 20,827 52.8%
Changes +735 +1.9% -3,574 -19.2% +4,309 +20.7%
Changes in Homeless Population (Including Hidden Homeless), 2011 - 2013
Total Sheltered Unsheltered Hidden Homeless
# % # % # % # %
2013 58,423 100.0% 15,013 25.7% 25,136 43.0% 18,274 31.3%
2011 50,214 100.0% 18,587 37.0% 20,827 41.5% 10,800 21.5%
Changes +8,209 +16.3% -3,574 -19.2% +4,309 +20.7% +7,474 +69.2%
18

2013 Greater Los Angeles Homeless Count Key Findings - Los Angeles County
Changes in Homeless Population by Continuum of Care (CoC), 2011 - 2013
Total Sheltered Unsheltered
Hidden Homeless
# % County # % County # % County #
Overall Los Angeles
County
2013 58,423 100.0% 15,013 100.0% 25,136 100.0% 18,274
2011 50,214 18,587 20,827 10,800
Changes +8,209 -3,574 +4,309 +7,474
Los Angeles CoC
2013 53,798 92.1% 12,934 86.2% 22,590 89.9% 18,274
2011 45,422 16,882 17,740 10,800
Changes +8,376 -3,948 +4,850 +7,474
Glendale CoC
2013 320 0.5% 213 1.4% 107 0.4%
2011 412 291 121
Changes -92 -78 -14
Long Beach CoC
2013 3,533 6.0% 1,654 11.0% 1,879 7.5%
2011 3,164 961 2,203
Changes +369 +693 -324
Pasadena CoC
2013 772 1.3% 212 1.4% 560 2.2%
2011 1,216 453 763
Changes -444 -241 -203 19

2013 Greater Los Angeles Homeless Count Key Findings - Los Angeles County
Homeless by Household Type
Single adult literal homelessness represent 86% of the total, and has increased by 26.3%,
by 10,460 men and women from 2011 (the Hidden Homeless estimates are 100% single
adult)
Families experiencing literal homelessness represent approximately 13% of the total, and
have decreased by 26.7%. However, of the almost 7,400 family members experiencing
literal homelessness, two thirds are children under 18
Unaccompanied Youth numbers, while representing only 1.4% of our total, increased
121.9% -- a function of both an increase in numbers, and better coverage in the 2013
youth count
Changes in Los Angeles County Homelessness by Household Type, 2011 - 2013
Total Single Adults Family Members
Unaccompanied Youth (<18)
# # % # % # %
2013 58,423 50,213 85.9% 7,391 12.7% 819 1.4%
2011 50,214 39,750 79.2% 10,095 20.1% 369 0.7%
Changes +8,209 +10,463 +26.3% -2,704 -26.7% +450 +121.9% 20
2013 Greater Los Angeles Homeless Count Key Findings - Los Angeles County
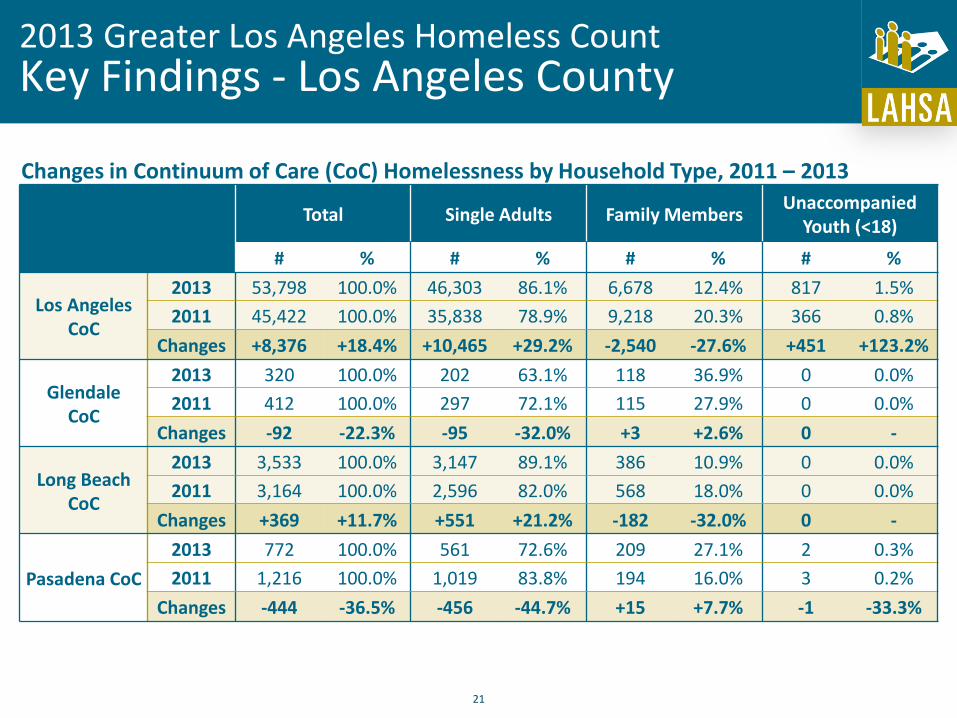
Changes in Continuum of Care (CoC) Homelessness by Household Type, 2011 – 2013
Total Single Adults Family Members
Unaccompanied Youth (<18)
# % # % # % # %
Los Angeles CoC
2013 53,798 100.0% 46,303 86.1% 6,678 12.4% 817 1.5%
2011 45,422 100.0% 35,838 78.9% 9,218 20.3% 366 0.8%
Changes +8,376 +18.4% +10,465 +29.2% -2,540 -27.6% +451 +123.2%
Glendale CoC
2013 320 100.0% 202 63.1% 118 36.9% 0 0.0%
2011 412 100.0% 297 72.1% 115 27.9% 0 0.0%
Changes -92 -22.3% -95 -32.0% +3 +2.6% 0 -
Long Beach CoC
2013 3,533 100.0% 3,147 89.1% 386 10.9% 0 0.0%
2011 3,164 100.0% 2,596 82.0% 568 18.0% 0 0.0%
Changes +369 +11.7% +551 +21.2% -182 -32.0% 0 -
Pasadena CoC
2013 772 100.0% 561 72.6% 209 27.1% 2 0.3%
2011 1,216 100.0% 1,019 83.8% 194 16.0% 3 0.2%
Changes -444 -36.5% -456 -44.7% +15 +7.7% -1 -33.3%
21

2013 Greater Los Angeles Homeless Count Key Findings – Annualized Estimate
At least 190,000 men, women and children experienced homelessness in Los Angeles over
the course of a year, an increase of more than 65,000 from 2011 estimates (based on the
two continua that do annualized estimates - Los Angeles and Pasadena)
(The annualized number estimates the number of persons who experience homelessness
during a twelve month period around the count. The count represents a single point in time)
*Excludes Continua of Long Beach and Glendale
Continuum of Care (CoC) Annualized Estimates of Homelessness
Annualized Estimates
2013 2011
Los Angeles CoC 187,119 120,070
Pasadena CoC 3,088 4,864
Los Angeles County Total* 190,207 124,934
22

2013 Greater Los Angeles Homeless Count Differentiating Precariously Housed and Other Definitions of Homeless by Other Programs
Los Angeles County Department of Public Social Services (DPSS)
DPSS considers a family or individual to be homeless when they:
– lack a fixed and regular nighttime residence; or
– have a primary nighttime residence that is a supervised publicly or privately operated shelter designed to provide temporary living accommodations; or
– are residing in a public or private place not designed for, or ordinarily used as, a regular sleeping accommodation for human beings; or
– have a need for housing in a commercial establishment (e.g., hotel/motel), shelter, publicly-funded transitional housing, or from a person in the business of renting properties who has a history of renting properties; or
– receive a pay rent or quit notice (at risk); or
– use the County DPSS office as their permanent address regardless of housing status
Based on this expanded definition, DPSS reported that as of May 2013, there
were 12,932 CalWORKs families who were classified as homeless
Additionally, DPSS reported 58,395 General Relief recipients in April 2013 who
met their homeless definition
23

2013 Greater Los Angeles Homeless Count Differentiating Precariously Housed and Homeless by Other Federal Programs
In addition to the 53,798 literally homeless persons in the LA Continuum of Care, the 2013
Homeless Count telephone survey identified an estimated 14,146 people who are
precariously housed and an additional 6,204 who are at risk of being homeless
HUD Definitions:
Precariously housed – A person who is staying with a household because he or she has no
other regular or adequate place to stay due to a lack of money or other means of support
and who is sleeping inside the house and will be allowed to stay for 15-90 days
At-risk of literal homelessness – A person who is staying with a household because he or
she has no other regular or adequate place to stay due to a lack of money or other means
of support and who is sleeping inside the house, and will have to leave in 14 days or less
Los Angeles Continuum of Care (CoC) Precariously-Housed & At-Risk Populations
Overall Precariously Housed
Overall At-Risk Population
Los Angeles CoC 14,146 6,204
24

2013 Greater Los Angeles Homeless Count Precariously Housed and Definitions of Homeless by Other Programs
25
Education System
– McKinney-Vento Homeless Assistance provides transportation benefits for
displaced children; they do not need to be ‘literally homeless’ as required
by HUD to receive these benefits
– However, these children are at risk of becoming literally homeless, and
some are literally homeless
– The Los Angeles County Office of Education identified that as of June 2012,
a cumulative total of 57,611* students were eligible for homeless
assistance based on the McKinney-Vento Education definition during the
school year
*Over the course of a school year

2013 Greater Los Angeles Homeless Count Possible Reasons for Increase
While the 2013 Greater Los Angeles Homeless Count doesn’t provide detailed
information on why literal homelessness has increased in the region, we believe
the increase can be attributed to:
– The continuing, persistent recession in California and Los Angeles, and resulting high unemployment
– The loss of critical resources available under ARRA, Homeless Prevention and Rapid Re-Housing funds, that brought over $80 million to Los Angeles County between 2009 and August 2012
– Lack of adequate affordable housing options for low income households, and increasing housing rental rates
– Prison realignment, which released probationers without adequate funding and coordination for services and housing options
– Los Angeles County receives less Federal McKinney Vento funding due to use of CDBG funding formulas
– In-migration of homeless persons to Los Angeles County
26

2013 Greater Los Angeles Homeless Count Possible Reasons for Increase
Economic Recession, Worst Since Great Depression
– California was one of the hardest hit states in the country during the economic recession, suffering high unemployment and high job losses
– Los Angeles County’s unemployment rate was 11.2% in 2012 and 13.2% in 2011, one of the highest in the U.S.
– Los Angeles County’s unemployment rate in 2013 is still significantly above the statewide average of 9 percent and way above the national average of 7.5%
27
2013 Greater Los Angeles Homeless Count Possible Reasons for Increase
End of Homeless Prevention and Rapid Re-Housing Program (HPRP)
– The American Recovery and Reinvestment Act (ARRA) included $1.5 billion for the prevention of homelessness and rapid re-housing of homeless households suffering the effects of the recession
– HPRP began in 2009 and ended in August of 2012
– HPRP helped 9,000 people in the City of Los Angeles and 3,409 people in the County of Los Angeles
– HPRP brought over $80 million of federal resources into Los Angeles County to address homeless prevention and support rapid re-housing activities
– While the HPRP program was active, the homeless count for Los Angeles County decreased from 52,619 in 2009 to 50,214 in 2011; homelessness increased to 58,423 in 2013 when HPRP funding ended in August 2012
28

2013 Greater Los Angeles Homeless Count Possible Reasons for Increase
Lack of Affordable Housing in Los Angeles
– The California Association of Realtors Housing Affordability index indicates that only 46% of residents can afford to buy a home in Los Angeles
– Average monthly rent in the Los Angeles region is $1,421* as of winter 2012-2013, making it one of the top 10 highest places to rent in the U.S.
– Rental housing costs are expected to rise by an additional 10 percent in the City of Los Angeles over the next year
*2013 Out of Reach Report, National Low Income Housing Coalition – Los Angeles/Long Beach Metropolitan Area
29
2013 Greater Los Angeles Homeless Count Possible Reasons for Increase
AB109 California Prison Realignment Act
– AB109 released probationers incarcerated in State Correctional Facilities to
local communities as a way to reduce overcrowding in state prisons
– As of June 2013, more than 15,798 AB109 offenders had been released to
Los Angeles County, and an estimated 4,000 released to the City of Los
Angeles
30
2013 Greater Los Angeles Homeless Count Possible Reasons for Increase
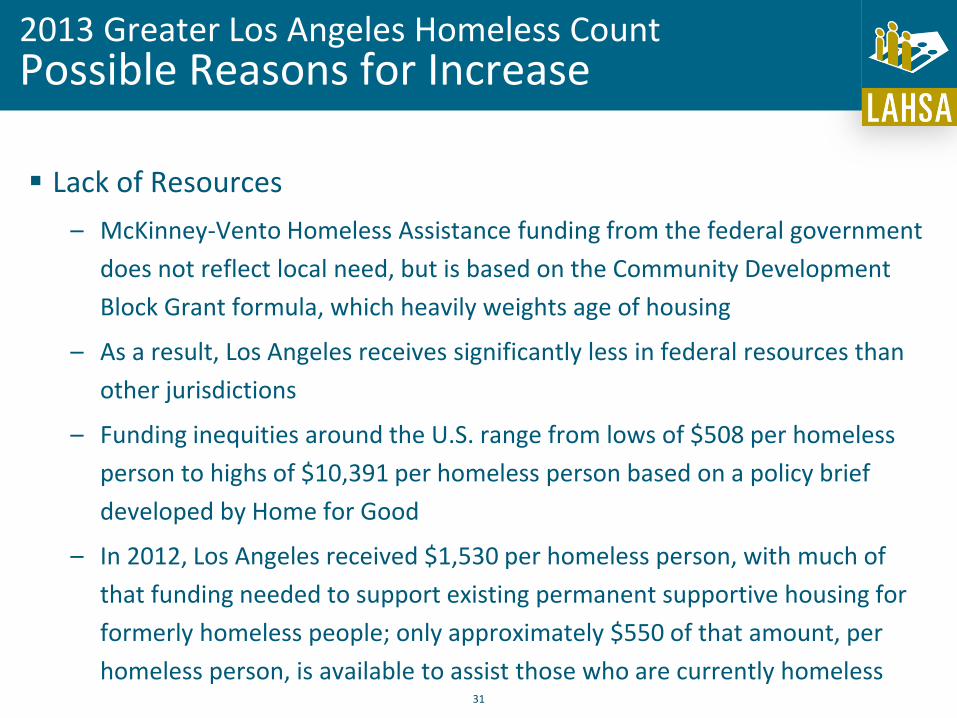
Lack of Resources
– McKinney-Vento Homeless Assistance funding from the federal government
does not reflect local need, but is based on the Community Development
Block Grant formula, which heavily weights age of housing
– As a result, Los Angeles receives significantly less in federal resources than
other jurisdictions
– Funding inequities around the U.S. range from lows of $508 per homeless
person to highs of $10,391 per homeless person based on a policy brief
developed by Home for Good
– In 2012, Los Angeles received $1,530 per homeless person, with much of
that funding needed to support existing permanent supportive housing for
formerly homeless people; only approximately $550 of that amount, per
homeless person, is available to assist those who are currently homeless
31

2013 Greater Los Angeles Homeless Count Possible Reasons for Increase
In-migration of Homeless Persons to Los Angeles Region
– In a recent Homeless Management Information System (HMIS) data
assessment, only 62% of new enrollees seeking homeless services reported
being from Los Angeles County
– 18% reported coming from areas outside Los Angeles County, and another
20% refused to specify where they became homeless
– Factors including weather, beaches, many food distribution programs, and a
focus on providing homeless assistance and housing draw homeless persons
to Southern California
32
2013 Greater Los Angeles Homeless Count Key Findings - Los Angeles CoC
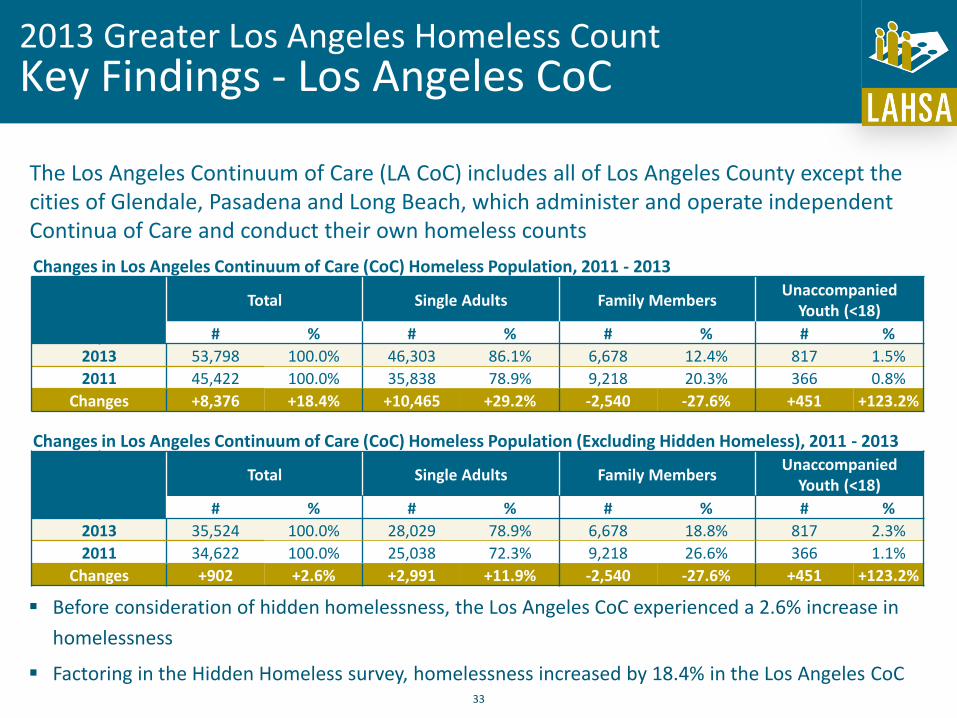
The Los Angeles Continuum of Care (LA CoC) includes all of Los Angeles County except the cities of Glendale, Pasadena and Long Beach, which administer and operate independent Continua of Care and conduct their own homeless counts
Before consideration of hidden homelessness, the Los Angeles CoC experienced a 2.6% increase in
homelessness
Factoring in the Hidden Homeless survey, homelessness increased by 18.4% in the Los Angeles CoC
Changes in Los Angeles Continuum of Care (CoC) Homeless Population, 2011 - 2013
Total Single Adults Family Members
Unaccompanied Youth (<18)
# % # % # % # %
2013 53,798 100.0% 46,303 86.1% 6,678 12.4% 817 1.5%
2011 45,422 100.0% 35,838 78.9% 9,218 20.3% 366 0.8%
Changes +8,376 +18.4% +10,465 +29.2% -2,540 -27.6% +451 +123.2%
Changes in Los Angeles Continuum of Care (CoC) Homeless Population (Excluding Hidden Homeless), 2011 - 2013
Total Single Adults Family Members
Unaccompanied Youth (<18)
# % # % # % # %
2013 35,524 100.0% 28,029 78.9% 6,678 18.8% 817 2.3%
2011 34,622 100.0% 25,038 72.3% 9,218 26.6% 366 1.1%
Changes +902 +2.6% +2,991 +11.9% -2,540 -27.6% +451 +123.2%
33
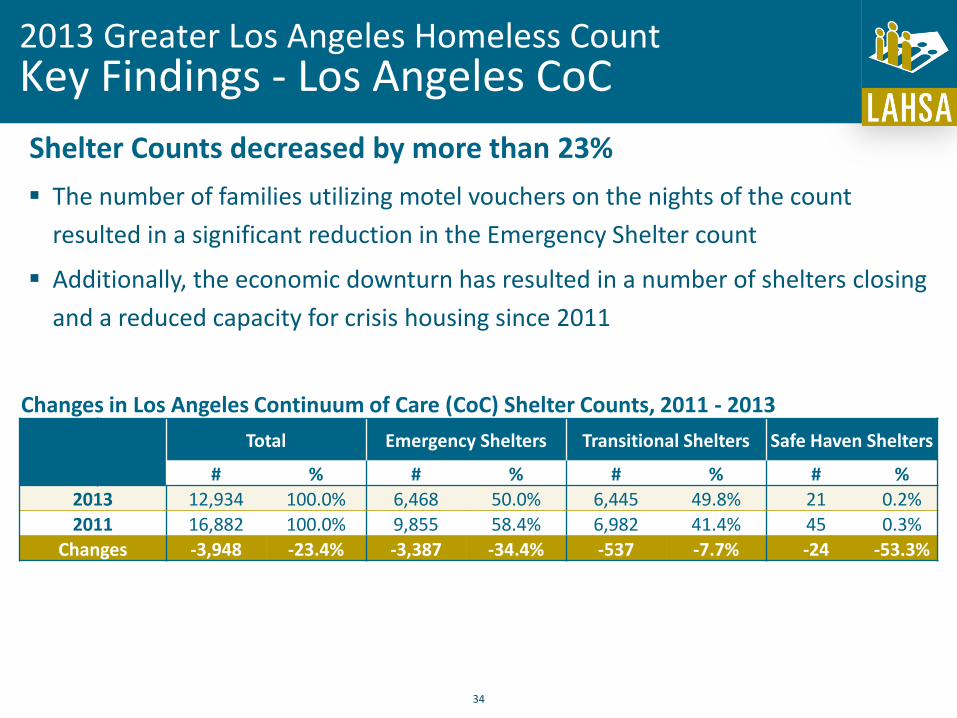
2013 Greater Los Angeles Homeless Count Key Findings - Los Angeles CoC
Shelter Counts decreased by more than 23%
The number of families utilizing motel vouchers on the nights of the count
resulted in a significant reduction in the Emergency Shelter count
Additionally, the economic downturn has resulted in a number of shelters closing
and a reduced capacity for crisis housing since 2011
Changes in Los Angeles Continuum of Care (CoC) Shelter Counts, 2011 - 2013
Total Emergency Shelters Transitional Shelters Safe Haven Shelters
# % # % # % # %
2013 12,934 100.0% 6,468 50.0% 6,445 49.8% 21 0.2%
2011 16,882 100.0% 9,855 58.4% 6,982 41.4% 45 0.3%
Changes -3,948 -23.4% -3,387 -34.4% -537 -7.7% -24 -53.3%
34

2013 Greater Los Angeles Homeless Count Key Findings - Los Angeles CoC
While 76% of the total homeless population is unsheltered on any given night,
shelter varies significantly by household type
82% of the homeless single adult population is unsheltered
31% of homeless families are unsheltered
88% of unaccompanied youth under 18 are unsheltered
Comparison of Homelessness Shelter Status by Household Type, 2013 vs. 2011
2013 2011
Total Sheltered Unsheltered Total Sheltered Unsheltered
LA CoC Overall
53,798 12,934 24.0% 40,864 76.0% 45,422 16,882 37.2% 28,540 62.8%
Single Adults
46,303 8,226 17.8% 38,077 82.2% 35,838 9,541 26.6% 26,297 73.4%
Family Members
6,678 4,607 69.0% 2,071 31.0% 9,218 7,254 78.7% 1,964 21.3%
Unaccompanied Youth*
817 101 12.4% 716 87.6% 366 87 23.8% 279 76.2%
35 *Unaccompanied youth represent youth under 18 years of age

2013 Greater Los Angeles Homeless Count LA CoC Subpopulation Prevalence Rates
36
Changes in Homeless Subpopulation Totals, 2011 - 2013
2011 2013 Changes
# % # % # % Chronically Homeless Individual 10,901 24.0% 13,613 25.3% +2,712 +24.9% Chronically Homeless Family Members 2,730 6.0% 1,227 2.3% -1,503 -55.1% Substance Abusers 15,489 34.1% 16,892 31.4% +1,403 +9.1% Mentally Ill 14,830 32.6% 16,229 30.2% +1,399 +9.4% Veterans 8,131 17.9% 6,248 11.6% -1,883 -23.2% Female Veterans 909 2.0% 352 0.7% -557 -61.3% Persons with HIV/AIDS 1,104 2.4% 511 0.9% -593 -53.7% Survivors of Domestic Violence 4,610 10.1% 4,827 9.0% +217 +4.7% Physical Disability 9,993 22.0% 9,790 18.2% -203 -2.0%

2013 Greater Los Angeles Homeless Count LA CoC Gender Prevalence Rates
Over 70% of the total number of homeless persons were male, and nearly 30%
were female
Compared to 2011, the number of homeless adult males increased by 37%
Changes in Homeless Totals by Sex, 2011 - 2013
2011 2013 Changes
# % # % # %
Adult Male 26,767 59.0% 36,682 68.2% +9,915 +37.0%
Adult Female 12,589 27.7% 12,449 23.1% -140 -1.1%
Male Child <18 3,057 6.7% 2,439 4.6% -618 -20.2%
Female Child <18 3,009 6.6% 2,228 4.1% -781 -26.0%
Los Angeles CoC Total 45,422 100.0% 53,798 100.0% +8,376 +18.4%
37

2013 Greater Los Angeles Homeless Count LA CoC Ethnicity Prevalence Rates
This years shows a significant shift in the demographics of homelessness in Los
Angeles: 38% of the total number of homeless persons identified as
Black/African American, 36.6% identified as White/Caucasian and 21.8% as
Hispanic/Latino. Asians/Pacific Islanders, Native American/Alaskan Natives, and
Multi-Racial/Others represented 3.6% of homeless persons
– There was a 74.5% increase in homelessness among the White/Caucasian population
– Hispanic homeless populations decreased by 6.5% from 2011
– Asian/Pacific Islander homeless populations decreased by 34.6% from 2011
Changes in Homeless Totals by Ethnicity, 2011 - 2013
2011 2013 Changes
# % # % # %
African American/Black 19,868 43.7% 20,451 38.0% +583 +2.9%
Hispanic/Latino 12,573 27.8% 11,750 21.8% -823 -6.5%
White/Caucasian 11,287 24.8% 19,693 36.6% +8,405 +74.5%
Asian/Pacific Islander 1,058 2.3% 692 1.3% -366 -34.6%
Native American/Alaskan Native 636 1.4% 621 1.2% -15 -2.4%
Multi-Racial/Other N/A - 591 1.1% N/A N/A 38
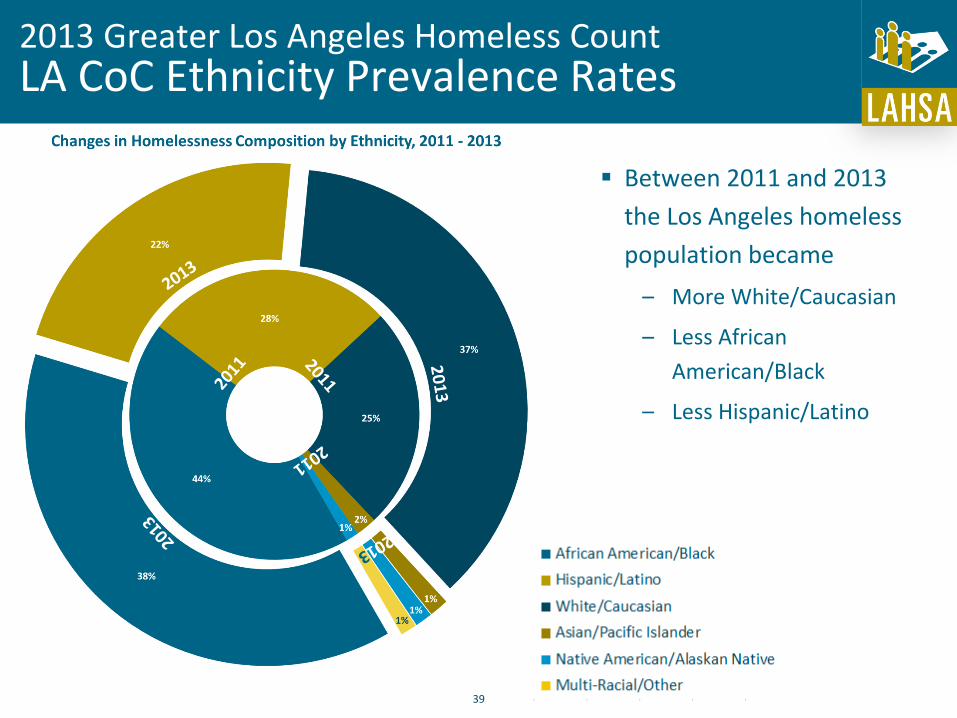
2013 Greater Los Angeles Homeless Count LA CoC Ethnicity Prevalence Rates
Between 2011 and 2013
the Los Angeles homeless
population became
– More White/Caucasian
– Less African
American/Black
– Less Hispanic/Latino
39
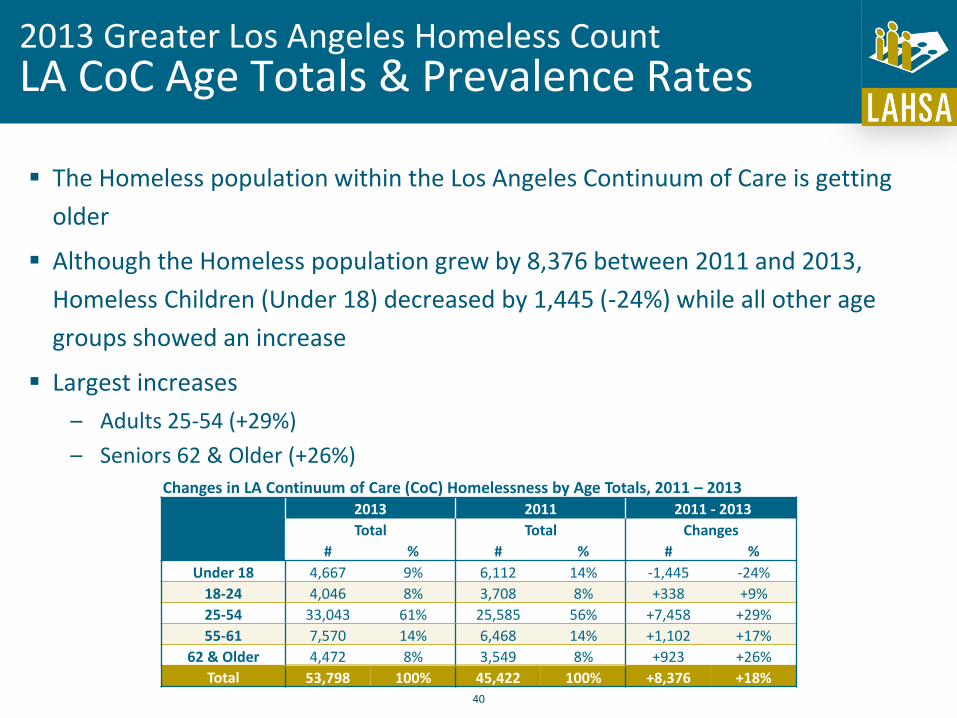
2013 Greater Los Angeles Homeless Count LA CoC Age Totals & Prevalence Rates
The Homeless population within the Los Angeles Continuum of Care is getting
older
Although the Homeless population grew by 8,376 between 2011 and 2013,
Homeless Children (Under 18) decreased by 1,445 (-24%) while all other age
groups showed an increase
Largest increases
– Adults 25-54 (+29%)
– Seniors 62 & Older (+26%)
Changes in LA Continuum of Care (CoC) Homelessness by Age Totals, 2011 – 2013
2013 2011 2011 - 2013
Total Total Changes
# % # % # %
Under 18 4,667 9% 6,112 14% -1,445 -24%
18-24 4,046 8% 3,708 8% +338 +9%
25-54 33,043 61% 25,585 56% +7,458 +29%
55-61 7,570 14% 6,468 14% +1,102 +17%
62 & Older 4,472 8% 3,549 8% +923 +26%
Total 53,798 100% 45,422 100% +8,376 +18% 40

2013 Greater Los Angeles Homeless Count 2013 Homeless Numbers Around the USA
City State 2012 2013 % Change
Sonoma County CA 11,929 3,813 -68
Riverside County CA 4,321 2,978 -31
Kern County CA 1,439 1,158 -20
Pasadena CA 904 772 -15
Spokane WA 1,185 1,030 -13
Hillsboro/Beaverton/ Washington County
WA 1,331
1,153 -13
State of Idaho ID 1,968 1,781 -10
San Bernardino County CA 2,532 2,321 -8
Allegheny County PA 1,376 1,492 -8
Charlotte NC 2,567 2,418 -6
Austin TX 2,244 2,121 -5
Washington DC DC 6,954 6,865 -1
Montgomery County MD 982 1,004 2
State of Montana MT 2,250 2,328 3
New Hampshire State NH 2,422 2,576 6
Sacramento CA 2,358 2,538 8
Tarrant and Parker Counties
TX 2,169 2,390 10
State of Maine ME 1,050 1,175 12
Yonkers/Westchester NY 1,741 2,054 18
Northwest Arkansas AR 2,001 2,429 18
NC Balance of State NC 2,922 3,627 24
41
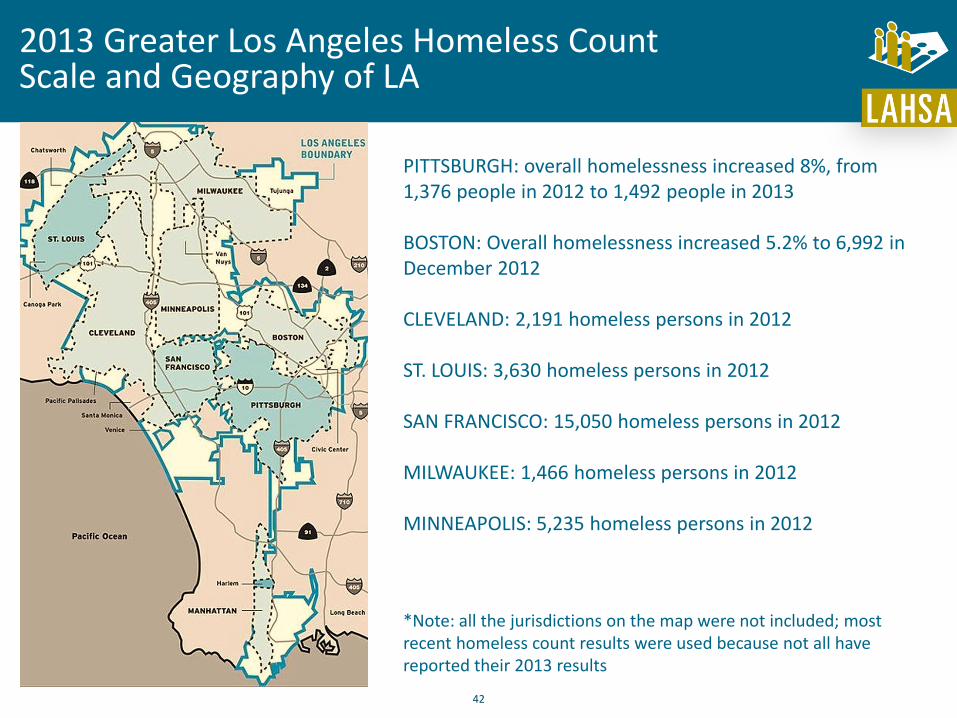
2013 Greater Los Angeles Homeless Count Scale and Geography of LA
PITTSBURGH: overall homelessness increased 8%, from 1,376 people in 2012 to 1,492 people in 2013 BOSTON: Overall homelessness increased 5.2% to 6,992 in December 2012 CLEVELAND: 2,191 homeless persons in 2012 ST. LOUIS: 3,630 homeless persons in 2012 SAN FRANCISCO: 15,050 homeless persons in 2012 MILWAUKEE: 1,466 homeless persons in 2012 MINNEAPOLIS: 5,235 homeless persons in 2012 *Note: all the jurisdictions on the map were not included; most recent homeless count results were used because not all have reported their 2013 results
42
2013 Greater Los Angeles Homeless Count Homeless Youth
Los Angeles is one of the only jurisdictions to conduct a separate youth count in
order to target hard to reach youth
Provider agencies and homeless youth counters identified neighborhoods to
count, based on where homeless youth tend to frequent
– increased participation allowed for better coverage
– 40% increase in number of people counting youth -- 118 youth participated in 2013; 84 participated in 2011
– youth workers had hands-on knowledge of youth hot spots in their area
In 2013, there were 4,863 homeless youth in the LA CoC, compared to 3,959 in
2011
– 4,046 were between the ages of 18 to 24
– 817 were unaccompanied youth under 18
43

2013 Greater Los Angeles Homeless Count Homeless Families
In 2013, family homelessness decreased by 28%
– There were 6,678 homeless family members in 2,223 families, compared to
9,218 family members in 4,970 families in 2011
– In 2013 there were 4,607 family members in shelters compared to 2,071
who were unsheltered
– In addition to four program closures, programs distributing emergency
hotel/motel vouchers experienced a precipitous drop in families using
vouchers on the nights of the 2013 count
– Challenges in estimating homeless families:
Homeless families are hard to find
Rules on how to count them
44

2013 Greater Los Angeles Homeless Count Homeless Veterans
12% of the homeless people in the LA CoC are veterans, a 6%
decrease from the 2011 count
– The number of veterans decreased by almost 23%, from 8,131 to 6,291
36% of homeless veterans are chronically homeless, up from 31% in
2011
Although the prevalence rate of female veterans decreased by 1%,
the number of female veterans decreased by 61%
45

2013 Greater Los Angeles Homeless Count Chronic Homelessness
A little more than 25% of the homeless population were chronically homeless
single adults – a rate consistent with 2011 data
However, the total number of chronically homeless individuals has increased by
2,712 persons, from 10,901 in 2011 to 13,613 in 2013, due to the increase in
overall homelessness in Los Angeles County
Chronicity in families experiencing homelessness has decreased from 30% in
2011, to 18% in 2013, resulting in a reduction in chronically homeless family
members of over 1,500
46

2013 Greater Los Angeles Homeless Count Chronically Homeless Individuals
The percentage of persons
experiencing at least four
episodes of homelessness in
three years has increased
HUD’s objective is to target
long term homelessness
47
20%
61%
17% 20%
49%
13%
0%
10%
20%
30%
40%
50%
60%
70%
Episodic: Homeless 4 ormore times in 3 years
Long-term: Homeless 1or more years this
episode
Both Episodic and Long-term homeless
Long-Term and Episodic Homelessness 2011-2013
2013 2011

2013 Greater Los Angeles Homeless Count Methodology: Street Count
Two-to-four person teams of volunteers were created to conduct street counts
throughout Los Angeles County
Teams counted only within the boundaries of selected census tracts
Teams visually counted:
– Homeless people (individuals, including youth and families)
– Numbers of vehicles with people sleeping inside
– Number of encampments and tents (any makeshift shelter, such as cardboard boxes,
tarps, tents, etc.)
Teams did not count:
– People in abandoned buildings
– People on private property
– Doubled-up or precariously housed people
48

2013 Greater Los Angeles Homeless Count Methodology: Street Count
More than 5,000 volunteers canvassed Los Angeles County streets
by foot or vehicle, covering more than 16,000 miles
1,355 census tracts were covered in 2013 vs. 922 census tracts
covered in 2011 (+ 433 more census tracts)
68 “opt-in” cities and 22 communities conducted counts, covering
100% of the census tracts in their city or community
– 11 communities were Count PLUS Communities and “opted in” to complete
a full enumeration and by-name homeless registry
49

2013 Greater Los Angeles Homeless Count Methodology: Shelter Count
Captures the number of individuals and families in emergency shelters,
transitional housing, safe havens, and hotels/motels that accept homeless
vouchers
Conducted during same time as unsheltered street count to avoid double
counting
Quality checks include comparing capacity to occupancy, HMIS data, zero count
reports, prior count reports, and other measures to ensure response accuracy
100% of all emergency shelters, safe haven and transitional housing programs
counted
24% (12,934) of the homeless population were counted in shelters and
transitional housing programs, and voucher and housing benefit programs
50

2013 Greater Los Angeles Homeless Count Methodology: Demographic Survey
A demographic survey is conducted to estimate the number and characteristics
of the homeless subgroups:
– chronically homeless individuals and families
– family units and members
– individuals
– persons with HIV/AIDS
– persons with substance abuse problems
– persons with severe mental illness
– veterans
– survivors of domestic violence
3,300 homeless interviews were completed of the unsheltered homeless
population
– Random sampling was used to reduce survey bias
– LAHSA utilized HMIS to obtain information for the sheltered homeless population
51

2013 Greater Los Angeles Homeless Count Methodology: Hidden Homeless Survey
52
In 2005, in response to community concerns that the homeless population not
visible on streets or staying in shelters would go uncounted, a telephone survey
was developed to count the “Hidden Homeless”
– Attempt to find homeless families
– People living on private property in places not meant for human habitation
Telephone survey is a random sample that is statistically spread out throughout
the County
– For 2013, there were 24,916 random telephone numbers called resulting in 2,983 households responding to the interview
– Calling took place between January 28, 2013 to April 20, 2013 -- each number called a minimum of eight times over a two week period and at different times of the day (daytime, evenings, and weekends)
– Response rate was 24.5%
– 18,274 persons were identified as Hidden Homeless* * “Hidden Homeless” refers to persons sleeping on private property outside a place of residence, such as a car, van, carport, backyard, unconverted
garage, camper and encampment

2013 Greater Los Angeles Homeless Count Methodology: Hidden Homeless Survey
Other Continua that try to capture information on hidden homeless
in their communities:
– Las Vegas
– Vancouver
– San Mateo County, CA
– Alameda County, CA
– Monterey County, CA
– Cities in Ireland
– Cities in Australia
– Cities in UK
53

2013 Greater Los Angeles Homeless Count Special Statistical Support
The University of North Carolina is a leader in the survey research field and directly
involved in refining and improving population-based procedures. In 2009, the UNC team
brought the hidden homeless estimate to an acceptable level of statistical integrity. In
2011, they pilot-tested a new approach that cut the margin of error in half, thus making it
a robust finding
Robert Agans, Ph.D., Co-Director of the CSRL directs and orchestrates complex survey
research operations, including development of sample designs, questionnaire review and
psychometric analysis, as well as expertise in both quantitative and qualitative data
analysis. Dr. Agans has expertise in questionnaire design and development and has
published work on translating survey instruments into foreign languages as well research
on survey non-response and telephone sampling methods. Dr. Agans has directed dozens
of survey projects over the past ten years, including telephone surveys which screen for
rare attributes
54

2013 Greater Los Angeles Homeless Count Special Statistical Support
Donglin Zeng, Ph.D., Professor of Biostatistics and Co-Director of the CSRL, is a fellow of
the American Statistical Association and the Institute of Mathematical Statistics. Dr. Zeng,
has extensive experience in methodology development and data analysis for missing data
including nonresponse
J. Michael Bowling, Ph.D., a Research Associate Professor in Health Behavior, an Associate
Director for Research at the UNC Injury Prevention Research Center, as well as Assistant
Director at the CSRL, has extensive expertise in demography and survey sampling
methodology. Dr. Bowling has designed and managed over 100 large-scale survey
projects, many of which involved multi-staged complex survey designs. These included
statewide mail surveys and national random digit dialed (RDD) telephone surveys and
statewide personal interview surveys involving perinatal health, dental health, and HIV
risk behaviors
55

2013 Greater Los Angeles Homeless Count Special Statistical Support
William D. Kalsbeek, Ph.D., Professor of Biostatistics, is a fellow of the American Statistical
Association and currently the immediate Past Chair of the ASA’s Survey Research
Methods Section. In addition to having designed samples for over 60 national, state, and
local surveys, he has served as advisor or consultant to many of the major national
surveys in the U.S. His international work has included surveys in Indonesia, Somalia,
Jordan, Egypt, Honduras, the Russian Republic, Shanghai, and India. He has also played
key roles in several National Academy of Sciences studies on the roles and quality of the
nation’s survey data systems
56
2013 Greater Los Angeles Homeless Count Next Steps
Geographical Estimates
– Supervisorial Districts
– Service Planning Areas
– City Council Districts
– Skid Row
– Opt-In cities/communities
– Count PLUS communities
Assisting CoC planning efforts
with updated data
Analyses
– Demographic survey analysis
– Needs analyses
Website Updates
– www.lahsa.org
– www.theycountwillyou.org
August 2013 Release of
Subregional results
57


