Download - 2011 BRANDT Plot Book

Brandt Research and
Development Farm
2011 Results

Hybrid,Population and Crop Rotation
Brandt Community
HybridsCorn StressMitigation
Hybrid,Crop
Rotation20” vs 30” Rows
Hybrid Group Response to Population and Nitrogen
20” vs 30” RowsPopulation, Fertility and
Fungicide
Variety, Fungicide
and N-Boron®
To
tal
Acr
e T
ria
ls4
Hy
bri
d G
en
eti
c G
rou
ps:
Re
sp
on
se
to
3 P
op
ula
tio
ns
Re
sp
on
se
to
4 N
itro
ge
n R
ate
s
Re
sp
on
se
to
3 P
& K
Ra
tes
So
yb
ea
n
Va
rie
ty
Re
sp
on
se
To
:
Po
pu
lati
on
Fe
rtil
ize
r
Fu
ng
icid
e
Se
ed
Tre
atm
en
t
&
Pla
nti
ng
Da
te
Tri
als
So
yb
ea
n
Va
rie
ty
Tri
als
Hy
bri
d
Pe
rfo
rma
nce
Tri
als
Hig
h
Yie
ld
Co
rn
Co
rn 2
0”
Ro
ws
vs 3
0”
Ro
ws
Tri
oN
Bo
ron
B M
oly
He
rbic
ide
sIn
se
ctic
ide
s
Tri
o
N B
oro
n
He
rbic
ide
s
Co
rn
20
” R
ow
s
vs
30
” R
ow
s
Sta
rte
r T
ria
ls
Co
rn/C
orn
Str
ess M
itig
ati
on n
Hy
bri
d
Pe
rfo
rma
nce
Tri
als
20
” w
ide
ro
ws
vs
30
” w
ide
ro
ws
Rib
Hy
bri
d
wit
h N
Se
rve
Tri
als
Key FindsKey Finds
Table of Contents Preface
Brandt is proud to present the 2011 results from our Research and Development Farm in Pleasant Plains. This was the seventh year for the farm and it has been a quick seven years! As usual we chose the hottest day of the year for our annual Agronomy Day on August 3. Hot as it was, there were some great presentations and information shared. This book is the result and culmination of the 2011 trials through harvest. Our goal is that you will fi nd something of value for your operation.
Jean Payne, President of the Illinois Fertilizer and Chemical Associa-tion, joined us in August to discuss KIC2025. This program is a joint effort between industry, agriculture, state government and environ-mental groups to minimize the environmental impact of fall nutrient applications. Fall fertilizer and nitrogen applications are important to all of us! Let’s help each other by following the KIC2025 guidelines.There are many yield enhancement opportunities within these pages. For example, much of the ag news today focuses on weed resistance and the use of alternative modes of action herbicides for good weed control. We have seen evidence of this practice with our customers in 2011. To this end, I draw your attention to the stress mitigation data for both corn and beans on pages 4 and 15. Several years of data show that the addition of Brandt Smart Trio® to these post herbicide combinations will limit plant stress and increase yield. These results are being seen throughout the corn belt. Smart Trio is manufactured in Pleasant Plains, Illinois!
We continue to build the database for the Brandt Total Acre® system. Check out these results. Brandt has the tools available now to assist you in maximizing all of your inputs in a total management system.We now have 6 years of data on fungicide performance in corn and beans. Across many variables of weather, planting dates, hybrids and varieties, corn averaged 19.2 bushels/acre and soybeans 4.2 bushels per acre yield increase over 6 years! Fungicides should be in every production plan.
Please review the data to draw your own conclusions. Ed Corrigan, Technical Agronomist and the primary architect of these trials, has provided a summary for your consideration. We value your feedback, questions and suggestions. For economic analysis and return/acre we have used the crop insurance October values for corn at $6.32/bushel and soybeans at $12.14/bushel.
Planning and executing the Brandt Research Farm is a major under-taking and requires work and dedication from our staff. In addition to the project manager, Ed Corrigan, we would like to thank and recog-nize the following Brandt employees: John Allen, Steve Clement, Glenn Fuchs, Carl Masters, Mark Powell, Julie Reynolds, Rich Sapp, Tommy Kimes, Emily Murray, Pat Schaddel, Barney Stock, Dave Wallner. Finally, several of our customers helped us with equipment, time and expertise. We could not have done it without you. Thanks.
Tim McArdleGeneral Manager
�
�
�
Four years of data show that Brandt Smart Trio can
help reduce plant stress and improve yield when
added to post applied herbicide applications.
(pages 4 and 15)
Total Acre management system maximizes the
value of each crop input and helps you get the
biggest bang for the buck! (page 6)
We now have 6 years of data on fungicide applica-
tions on corn and beans. The results = 19.2 bu/ac
on corn and 4.2 bu/ac on soybeans.
1
Hybrid Response to Crop Rotation and Population . . . . . . . . . . 2
Corn Herbicide Stress Mitigation . . . . . . . . . . . . . . . . . . . . . . . . . . 4
Brandt Total Acre Trials . . . . . . . . . . . . . . . . . . . . . . . . . . . . . . . . . 6
20 Inch Versus 30 Inch Corn . . . . . . . . . . . . . . . . . . . . . . . . . . . . 10
Soybean Maturity and Variety . . . . . . . . . . . . . . . . . . . . . . . . . . . 12
Soybean Population . . . . . . . . . . . . . . . . . . . . . . . . . . . . . . . . . . . . 14
Soybean Herbicide Stress Mitigation . . . . . . . . . . . . . . . . . . . . . 15
Soybean Seed Treatments . . . . . . . . . . . . . . . . . . . . . . . . . . . . . . 16
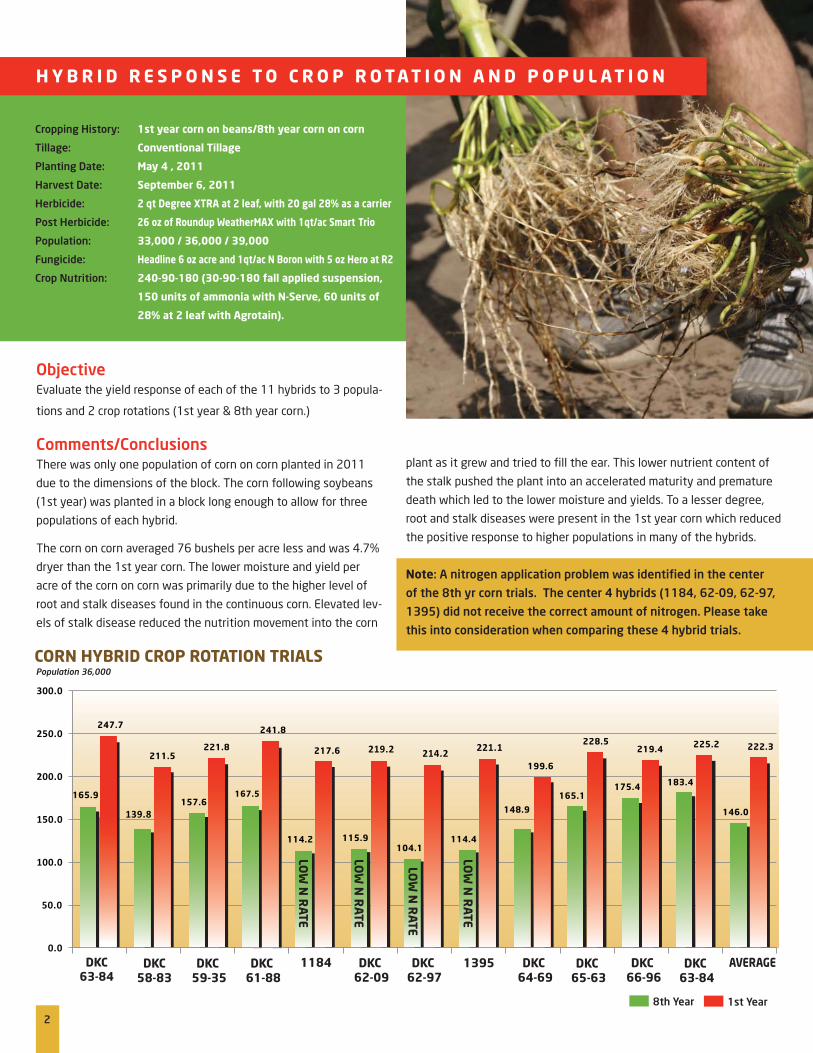
Comments/Conclusions There was only one population of corn on corn planted in 2011
due to the dimensions of the block. The corn following soybeans
(1st year) was planted in a block long enough to allow for three
populations of each hybrid.
The corn on corn averaged 76 bushels per acre less and was 4.7%
dryer than the 1st year corn. The lower moisture and yield per
acre of the corn on corn was primarily due to the higher level of
root and stalk diseases found in the continuous corn. Elevated lev-
els of stalk disease reduced the nutrition movement into the corn
plant as it grew and tried to fi ll the ear. This lower nutrient content of
the stalk pushed the plant into an accelerated maturity and premature
death which led to the lower moisture and yields. To a lesser degree,
root and stalk diseases were present in the 1st year corn which reduced
the positive response to higher populations in many of the hybrids.
Note: A nitrogen application problem was identifi ed in the center
of the 8th yr corn trials. The center 4 hybrids (1184, 62-09, 62-97,
1395) did not receive the correct amount of nitrogen. Please take
this into consideration when comparing these 4 hybrid trials.
Objective Evaluate the yield response of each of the 11 hybrids to 3 popula-
tions and 2 crop rotations (1st year & 8th year corn.)
CORN HYBRID CROP ROTATION TRIALS
Cropping History: 1st year corn on beans/8th year corn on corn
Tillage: Conventional Tillage
Planting Date: May 4 , 2011
Harvest Date: September 6, 2011
Herbicide: 2 qt Degree XTRA at 2 leaf, with 20 gal 28% as a carrier
Post Herbicide: 26 oz of Roundup WeatherMAX with 1qt/ac Smart Trio
Population: 33,000 / 36,000 / 39,000
Fungicide: Headline 6 oz acre and 1qt/ac N Boron with 5 oz Hero at R2
Crop Nutrition: 240-90-180 (30-90-180 fall applied suspension,
150 units of ammonia with N-Serve, 60 units of
28% at 2 leaf with Agrotain).
H Y B R I D R E S P O N S E T O C R O P R O TAT I O N A N D P O P U L AT I O N
165.9
139.8157.6
167.5
114.2 115.9104.1
114.4
148.9
165.1175.4 183.4
146.0
247.7
211.5221.8
241.8
217.6 219.2 214.2 221.1
199.6
228.5219.4 225.2 222.3
0.0
50.0
100.0
150.0
200.0
250.0
300.0
DKC63-84
DKC58-83
DKC 59-35
DKC 61-88
1184 DKC 62-09
DKC 62-97
1395 DKC 64-69
DKC 65-63
DKC 66-96
DKC 63-84
AVERAGE
1st Year8th Year
2
Population 36,000
LOW
N R
ATE
LOW
N R
ATE
LOW
N R
ATE
LOW
N R
ATE

CROP HARVEST YIELD AT YIELD AT YIELD AT AVG. YIELD AT AVG. GROSSROTATION VARIETY TRAITS MATURITY MOISTURE 33,000 36,000 39,000 15% MOISTURE AT $6.32 BU
1st yr Corn DKC 63-84 VT3 113 21.6 248.6 247.7 224.3 240.2 $1,407.258th yr Corn DKC 63-84 VT3 18.6 165.9 165.9 $1,004.881st yr Corn DKC 58-83 VT3P 108 20.3 210.5 211.5 198.2 206.7 $1,229.928th yr Corn DKC 58-83 VT3P 15.4 139.8 139.8 $879.631st yr Corn DKC 59-35 VT3 109 20.8 226.9 221.8 216.7 221.8 $1,311.598th yr Corn DKC 59-35 VT3 16.0 157.6 157.6 $984.71st yr Corn DKC 61-88 VT3P 111 21.8 255.0 241.8 227.1 241.3 $1410.058th yr Corn DKC 61-88 VT3P 16.4 167.5 167.5 $1,042.491st yr Corn P 1184XR HXXLLRR2 111 23.8 233.5 217.6 225.7 225.6 $1,286.808th yr Corn P 1184XR HXXLLRR2 17.7 114.2 114.2 $700.261st yr Corn DKC 62-09 VT3P 112 21.7 230.9 219.2 236.6 228.9 $1,339.038th yr Corn DKC 62-09 VT3P 15.8 115.9 115.9 $725.981st yr Corn DKC 62-97 VT3P 112 20.6 236.2 214.2 245.3 231.9 $1,374.438th yr Corn DKC 62-97 VT3P 14.6 104.1 104.1 $658.211st yr Corn P 1395XR HXXLLRR2 113 25.1 225.0 221.1 226.4 224.2 $1,258.328th yr Corn P 1395XR HXXLLRR2 17.1 114.4 114.4 $706.331st yr Corn DKC 64-69 VT3P 114 21.9 213.5 199.6 202.8 205.3 $1,198.508th yr Corn DKC 64-69 VT3P 17.8 148.9 148.9 $911.811st yr Corn DKC 65-63 VT3P 115 25.2 231.3 228.5 223.9 227.9 $1,277.458th yr Corn DKC 65-63 VT3P 17.8 165.1 165.1 $1,010.791st yr Corn DKC 66-96 VT3P 116 22.9 242.4 219.4 233.6 231.8 $1,336.518th yr Corn DKC 66-96 VT3P 22.8 175.4 175.4 $1,013.051st yr Corn DKC 63-84 VT3 113 23.2 240.6 225.2 244.0 236.6 $1,359.238th yr Corn DKC 63-84 VT3 22.4 183.4 183.4 $1,064.101st yr Corn Total Average 22.4 232.9 222.3 225.4 226.9 $1,315.76
8th yr Corn Total Average 17.7 146.0 146.0 $891.85
HYBRID RESPONSE TO CROP ROTATION AND POPULATION
The hybrid corn trials were planted in good soil conditions this spring which promoted a very even emergence. At the 2 leaf stage just 8 days after planting, the corn was a dark green color with a very healthy root system beginning to form on schedule (photo #1). The cold damp conditions that followed at the 3 leaf stage of growth included a cold snap that yellowed all the corn plants and in many of the fi elds turned the stressed corn plants to a pure white for a few days (photo #2). Corn plants that did not have a well developed root system during this cold and damp weather pattern were susceptible to root and crown diseases. Residue from the previous crop of corn provided a large source of inoculum which reduced corn on corn development and yield.
Plant tissue tests during the corn crop development at Pleas-
ant Plains indicated “suffi cient” levels of phosphorus and
nitrogen (other than the 4 trials noted) with “defi cient” levels
of potassium, manganese, iron, boron, and zinc. This nutrient imbalance information will be incorporated into next year’s fertility plan. We will be creating trials to try to stimulate plant nutrient uptake and improve nutrient balance, resulting in less disease and higher yields.
Through fi eld observation it was noted that the incidence of Diplo-dia ear rot at the Pleasant Plains plots was reduced signifi cantly by the addition of an insecticide to the fungicide application at the R2 stage of development. No longer can silk clipping be the only measure used for insecticide treatments during pollination. Insect feeding on the dying silks opens up the ear to disease spores and insect disease vectoring.
3
1
2

2) CORN ON CORN STESS MITIGATION (2008-2011 DATA)
2008
ROUNDUP ALONE ROUNDUP+ BRANDT SMART TRIO
4
insecticide was Capture LFR applied in furrow at 5 oz per acre. The corn emerged very evenly 10 days after planting with good color. Throughout the spring, no rootworm damage or feeding was found on either of the trials, and the 8th yr corn continued to look as good as or better than the 1st yr corn.
Stress mitigation trials were post applied on May 28 at V5 stage corn in 8 row trials. Visually that day, the corn looked in good health and did not display any nutrient defi ciencies. Plant tissue tests pointed at suffi cient levels of nitrogen, phosphorus and iron, with some defi cient levels of potassium, manganese, zinc, and boron at the time of application. Roundup WeatherMAX was applied at 26 oz per acre as a base herbicide treatment for all post weed control tri-als. The addition of 1 quart per acre Smart Trio to mitigate the plant stress and stimulate growth was compared to WeatherMAX alone.
The blocks designated for the corn stress mitigation trials in 2011 were planted on a Sunday afternoon, April 10, into a very mellow seedbed. A refuge hybrid (DKC 61-72) was chosen for both rota-tion environments and planted at 38,000 plants per acre. The soil
Objective Stress mitigation trials are designed to measure the yield improve-
ment from eliminating or reducing unwanted crop stresses such
as weather, nutrient imbalance, insect damage, or disease. Brandt
Smart Trio is the fi rst micronutrient combination designed to re-
move crop stress and stimulate growth without reducing the
effectiveness of added crop protection products.
Comments/Conclusion
Cropping History: 1st year Corn & 8th year Corn on Corn
Tillage: Conventional Tillage
Planting Date: April 10, 2011
Harvest Date: September 3, 2011
Herbicide: 2 qts Degree Xtra at 2 leaf, with 20 gal 28% as a carrier
Post Herbicide: 26 oz of Roundup WeatherMAX with 1qt/ac Smart Trio
Population: 38,000
Fungicide: Headline 6 oz acre at R2 with 1qt/ac N Boron
Crop Nutrition: 240-90-180 (30-90-180 fall applied suspension,
150 units of ammonia with N-Serve, 60 units of
28% at 2 leaf with Agrotain).
C O R N H E R B I C I D E S T R E S S M I T I G AT I O N
100
120
140
160
180
200
220
240
260
280
300
233.3 237.7
257.3264.4
142
165
239.1
255.1
217.9230.6
2009 2010 2011 4 YEAR AVERAGE
BU
/AC
YIE
LD
12.7 BU/ACADVANTAGE
280
260
240
220
200
180
160
140
120
100
1ST YEAR CORN 8TH YEAR CORN
1ST YEAR CORN 8TH YEAR CORN
BU
/AC
YIE
LD
BU
/AC
YIE
LD
1) BRANDT SMART TRIO
3) FUNGICIDE TRIALS AT V5 STAGE
ROUNDUP + QUADRIS ROUNDUP + HEADLINEROUNDUP ALONE
245
225
205
185
ROUNDUP ALONE ROUNDUP+ BRANDT SMART TRIO
5
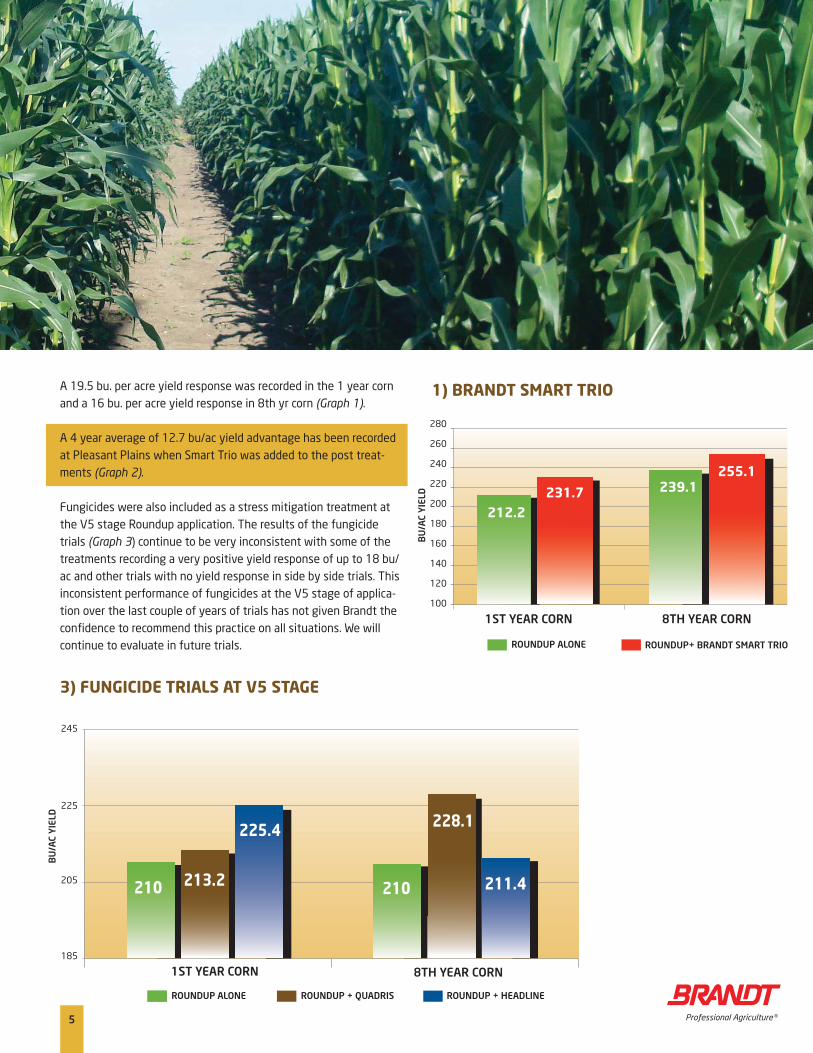
A 19.5 bu. per acre yield response was recorded in the 1 year corn and a 16 bu. per acre yield response in 8th yr corn (Graph 1).
A 4 year average of 12.7 bu/ac yield advantage has been recorded at Pleasant Plains when Smart Trio was added to the post treat-ments (Graph 2).
Fungicides were also included as a stress mitigation treatment at the V5 stage Roundup application. The results of the fungicide trials (Graph 3) continue to be very inconsistent with some of the treatments recording a very positive yield response of up to 18 bu/ac and other trials with no yield response in side by side trials. This inconsistent performance of fungicides at the V5 stage of applica-tion over the last couple of years of trials has not given Brandt the confi dence to recommend this practice on all situations. We will continue to evaluate in future trials.
228.1
211.4210213.2210
225.4
212.2
239.1231.7
255.1
6
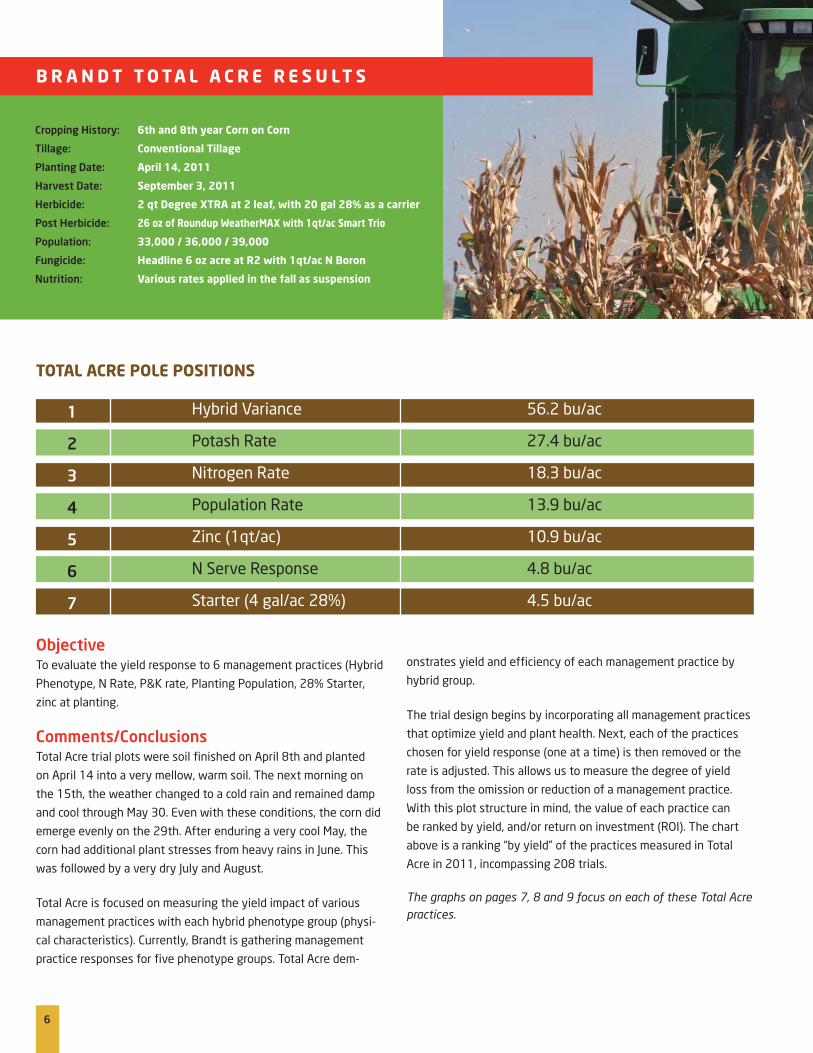
Comments/Conclusions Total Acre trial plots were soil fi nished on April 8th and planted
on April 14 into a very mellow, warm soil. The next morning on
the 15th, the weather changed to a cold rain and remained damp
and cool through May 30. Even with these conditions, the corn did
emerge evenly on the 29th. After enduring a very cool May, the
corn had additional plant stresses from heavy rains in June. This
was followed by a very dry July and August.
Total Acre is focused on measuring the yield impact of various
management practices with each hybrid phenotype group (physi-
cal characteristics). Currently, Brandt is gathering management
practice responses for fi ve phenotype groups. Total Acre dem-
onstrates yield and effi ciency of each management practice by
hybrid group.
The trial design begins by incorporating all management practices
that optimize yield and plant health. Next, each of the practices
chosen for yield response (one at a time) is then removed or the
rate is adjusted. This allows us to measure the degree of yield
loss from the omission or reduction of a management practice.
With this plot structure in mind, the value of each practice can
be ranked by yield, and/or return on investment (ROI). The chart
above is a ranking “by yield” of the practices measured in Total
Acre in 2011, incompassing 208 trials.
The graphs on pages 7, 8 and 9 focus on each of these Total Acre practices.
Objective To evaluate the yield response to 6 management practices (Hybrid
Phenotype, N Rate, P&K rate, Planting Population, 28% Starter,
zinc at planting.
Cropping History: 6th and 8th year Corn on Corn
Tillage: Conventional Tillage
Planting Date: April 14, 2011
Harvest Date: September 3, 2011
Herbicide: 2 qt Degree XTRA at 2 leaf, with 20 gal 28% as a carrier
Post Herbicide: 26 oz of Roundup WeatherMAX with 1qt/ac Smart Trio
Population: 33,000 / 36,000 / 39,000
Fungicide: Headline 6 oz acre at R2 with 1qt/ac N Boron
Nutrition: Various rates applied in the fall as suspension
B R A N D T T O TA L A C R E R E S U LT S
TOTAL ACRE POLE POSITIONS
Hybrid Variance 56.2 bu/ac
Potash Rate 27.4 bu/ac
Nitrogen Rate 18.3 bu/ac
Population Rate 13.9 bu/ac
Zinc (1qt/ac) 10.9 bu/ac
N Serve Response 4.8 bu/ac
Starter (4 gal/ac 28%) 4.5 bu/ac
1
2
3
4
5
6
7

7
2) TOTAL ACRE POTASH RESPONSES
NONE 300 #/AC 0-0-60
50
70
90
110
130
150
170
190
210
230
187.5200.4
144
183.9
144.2
114
197.8
171.2
Red Group Blue Group Purple Group Yellow Group
1) TOTAL ACRE HYBRID VARIANCE
50
70
90
110
130
150
170
190
210
230
197.8
144.2
200.4
183.9
BU
/AC
YIE
LD
BU
/AC
YIE
LD
Red GroupHybrid
Blue GroupHybrid
Purple GroupHybrid
Yellow Group Hybrid
Hybrid Variance GraphA hybrid’s ability to deal with the environment it is
placed in continues to be one of the most important
decisions for top yields each year. The chart to the
left (1) is an indication of how each hybrid phenotype
group varied in yield. Using the fall 2011 crop insur-
ance grain price of $6.32 per bushel, this decision had
a value of up to $335.18 per acre.
Each of the hybrid phenotype groups were designed
with physical characteristics that allow it to perform
best when confronted with a specifi c plant stress. The
following graphs give us an insight as to how we may
change our management practices to get the most out
of each of the groups.
Potash Response GraphYield response to the rate of potash applied was the
2nd most important decision for yield and averaged
$173 per acre. The rate of potash applied was also
reported at harvest by the combine operator as one of
the most visual distinctions noted from trial to trial.
The higher potash rates were associated with reduced
stalk disease and improved standability.
Potassium rate also infl uenced the nitrogen effi ciency
of each of the hybrid groups and was singled out as
one of the most important practices as populations
are increased. When populations increased to 39,000
plants per acre, the yield response to potassium
reached 55 bushels per acre.
Note: Soil test levels of K in the trials are
well over 400 lbs per acre.

8
Nitrogen Response GraphNitrogen yield response averaged a value of
$115 per acre and ranked 3rd in average yield
improvement. The highest average yielding
rate of N was 210 units per acre. As you can
see from the graph, each of the hybrid groups
responded a little differently to the rate of N
applied. Yield response to nitrogen rate was
also infl uenced by the rate of phosphorus and
potash applied. When higher rates of P and K
were applied, response to higher N rates was
minimized. Nitrogen was less of a factor as
population was reduced in the majority of the
trials as well.
Tissue tests throughout the growing season
indicated good levels of N in the plant.
Population Response GraphThe average population response to all trials
was 13.9 bu per acre and this added a value
of $87.84 per acre by increasing the popula-
tion to 39,000 plants per acre. Increasing the
population was one of the most consistent
practices for all hybrid groups for the 2011
Total Acre trials. The higher yield responses to
population increase correlated to the higher
rates of potash. This also improved the overall
plant structure as well as yield. In most cases,
the high populations did not correlate with the
highest rates of nitrogen applied.
B R A N D T T O TA L A C R E R E S U LT S
3) TOTAL ACRE NITROGEN RESPONSES
4) TOTAL ACRE POPULATION RESPONSES
50
70
90
110
130
150
170
190
210
230
50
70
90
110
130
150
170
190
210
230
33,000
180 210 240 270
36,000 39,000
RED GROUP YELLOW GROUP BLUE GROUP PURPLE GROUP
BU
/AC
YIE
LD
BU
/AC
YIE
LD

STARTER RESPONSE
NO STARTER 4 GAL/AC 28% STARTER
WITH ZINC 1 QT/AC
N-Serve Response GraphThe N-Serve response had a gross value of $30 per
acre. This was an average of 16 trials that varied in
drainage from good to poor. Nitrogen management
continues to be very important for top yields as
well as reducing environmental impact in streams
and rivers. N-Serve has consistently proven itself
to be of value for minimizing the loss of ammonia
during wet spring conditions as soils warm up soils
warm up.
Starter Response GraphAs you can see from the photo below, the response
to a small amount of nitrogen and the addition of
zinc paid off BIG this spring. The nitrogen provided
just enough nutrition to improve plant functions
during the cool temperatures. However, the real
value was the zinc. It assisted the plant with dis-
ease prevention and stimulated rooting during the
cool damp spring. The gross profi t to adding zinc
was $68 per acre and had the best return on invest-
ment of 13.9 to 1. Wow!
Nitrogen timing and placement for corn on corn is
more infl uential than corn following soybeans in
most cases. Total Acre trials for 2012 will include
comparing split application of N and placement of
N trials to the current matrix.
9
154.6
159.4
204.8
215.7
200.3
BU
/AC
YIE
LD
BU
/AC
YIE
LD
N-Serve
28% + 1 qt Zinc 28% at 4gal/ac
No N-Serve
No 28% starter
5) TOTAL ACRE N-SERVE® RESPONSES
6) TOTAL ACRE STARTER RESPONSES
2011 Pleasant Plains 6th yr Corn on Corn
Corn on corn 2011 Pleasant Plains Research Farm
230
225
220
215
210
205
200
195
190
185
162
160
158
156
154
152
150

2011 ROW SPACING RESULTS1st Year Corn
10
Comments/Conclusions
This was the second year for the comparison of 20 inch row width
vs 30 inch row width trials. In addition to the population trials that
we demonstrated last year, we expanded the trials to include a
comparison of 6th year corn vs 1st year corn. Nitrogen rate com-
parisons of both crop rotations were also established for 2011. A
total of 4 hybrids and 4 brands were used to evaluate row widths.
Fungicide response (applied at the R2 stage) was also incorpo-
rated into the 1st yr corn trials.
Objective Evaluate corn production using the 20 inch row width to the
current standard of 30 inch row width. The trials are focused on
row width response to population, N rate, crop rotation, fungicide,
and hybrid.
Cropping History: 1st Year Corn and 6th Year Corn
Tillage: Conventional Tillage
Planting Date: May 4 & 5, 2011
Harvest Date: September 6, 2011
Herbicide: 2 qts Degree Xtra at 2 leaf, with 20 gal 28% as a carrier
Post Herbicide: 26 oz of Roundup WeatherMAX with 1qt/ac Smart Trio
Population: 33,000 / 36,000 / 39,000 / 42,000 / 45,000 / 48,000
Fungicide: Headline 6 oz acre at R2 with 1qt/ac N Boron
Crop Nutrition: 240-90-180 (30-90-180 fall applied suspension,
150 units of ammonia with N-Serve, 60 units of
28% at 2 leaf with Agrotain).
2 0 I N C H v s 3 0 I N C H R O W W I D T H T R I A L S
CORN 20” ROWS VS 30” ROWS
216.2
200
205
210
215
220
225
230
235
240
245
250
30" 20"
238
30” 20”
BU
/AC
YIE
LD
6th yr Corn 1st yr Corn Average all Trials Population Response Low Pop 33,000 to 39,000 High Pop 42,000 to 48,000 Nitrogen Response Low N Rate (210 units) High N Rate (270 units) Fungicide Response Fungicide No Fungicide
Yield Increase
30” Row Width
176.9
216.2
196.6
222.7
221.7
207.5
241.9
217.7
207.4
10.3
20” Row Width
188.3
238
213.2
210.4
229.7
241.2
248.6
223.2
205.2
18

NITROGEN RESPONSE
30” ROW WIDTH 20” ROW WIDTH
20” ROWS30” ROWS
11
Singulation and seed placement of the 20 inch row planter this
year was equivalent with the 30 inch row planter. Precision
planter units were installed on the 20 inch row planter and we
feel this improved a lot of the 20 inch trials. This indicates how
important seed placement and singulation is no matter what the
row width. The chart on (page 10) sums up the overall averages of
row width trial responses. Largely, the trials indicated that 20 inch
row widths have an advantage over 30 inch row width especially
at higher yielding environments.
The four hybrids in narrow 20 inch rows averaged 11.4 bushels
per acre additional yield for the 6th year corn following corn rota-
tion at 40,000 plant population. The 1st year corn crop rotation
had an advantage of 16.6 bushels per acre with the narrow row
width. When the population was dropped below 39,000 plants
per acre, the advantage to the narrow row width disappeared and
the advantage to the 30 inch row width grew as the population
was reduced. Conversely, as the population was increased above
40,000 plants per acre, the narrow row corn continued to be an
advantage over 30 inch row width. All the way up to 48,000
population, the standability and harvestability was excellent for 3
of the hybrids chosen for the population trials. One of the hybrids
did begin to have some harvestability issues above 42,000 plants
per acre even though the yields continued to increase as the
population was increased above 42,000.
150.0
170.0
190.0
210.0
230.0
250.0
270.0
241.2
207.5
241.9
248.6
210
DKC 62-67 NK N72F Croplan 6463 Lewis 1215
270Total Units of Nitrogen
BU
/AC
YIE
LD
BU
/AC
YIE
LD
150
170
190
210
230
250
270
226.4
234.7
213.3219.8 217.1
256.3
207.9
241
HYBRID RESPONSE TO ROW WIDTH

67.7
50.0
55.0
60.0
65.0
70.0
75.0
80.0
85.0
90.0
69.9
74.2
67.0
70.0
74.7
84.7
3.2 3.4 3.5 3.6 3.7 3.8 3.9
67.7
Our planting window occurred in the fi rst week of May and the
ground conditions were optimal for maintaining good seed to soil
contact. During the growing season we experienced very low
insect pressure and a lack of disease. Controlling these two issues
assured us the longer maturing soybean varieties would be the
highest yielding.
An average of 73.3 bushels per acre was recorded in the variety
plots for 2011. The soybeans were planted 2 weeks later than
last year which reduced the time for fl owering and pod fi ll (espe-
cially for the shorter maturity varieties). This coupled with slow
12
Comments/Conclusions Last year defi nitely set the high water mark for soybean yields
in our Research Farm. With that record notched in the books, we
started immediately after harvest on a mission to repeat our
successes. Mother Nature provided the optimal fall backdrop for
us to prepare, so as soon as the combine completed its fi nal round
we began chopping stalks, spreading fertilizer and deep tilling the
residue back into the soil.
Objective
To evaluate the yield response to soybean variety and maturity.
Cropping History: Corn/Bean Rotation
Tillage: Conventional Tillage
Planting Date: May 5 - 6, 2011
Harvest Date: September 23 , 2011
Pre-plant Herbicide: 1.7 pt Prefi x plus 22 oz Roundup WeatherMAX
Post Herbicide: 26 oz Roundup WeatherMAX, ½ oz Cadet, 4 oz
Hero, 1 qt Smart Trio, 1 qt B Moly per acre with
1 qt per 100 gal of Prolec
Population: 140,000
Fungicide: 6 oz Quadris at R4 stage
Crop Nutrition: 20-60-120 applied in the fall as suspension
S O Y B E A N M AT U R I T Y & V A R I E T Y
SOYBEAN YIELD BY MATURITY
AVG

HARVEST AVG. YIELD AT AVG. GROSS
BRAND VARIETY TRAITS MATURITY MOISTURE 13% MOISTURE INCOME @ $12.14/Bu
Asgrow AG3231 RR2Y 3.2 13.2 67.7 $821.25
Asgrow AG3431 RR2Y 3.4 13.0 69.9 $849.18
Asgrow AG3631 RR2Y 3.6 13.3 61.8 $749.83
Asgrow AG3731 RR2Y 3.7 13.5 70.4 $853.82 Asgrow AG3832 RR2Y 3.8 13.4 70.1 $850.03
Asgrow AG3932 RR2Y 3.9 18.9 82.0 $975.98
Pioneer 93Y70 RR 3.7 13.9 69.6 $842.38
NK S38K6 RR2Y 3.8 23.5 71.7 $840.24
NK S39U2 RR2Y 3.9 17.5 87.4 $1,045.62
Croplan R2C 3551 RR2Y 3.5 14.6 74.2 $895.48
Croplan R2C 3671 RR2Y 3.6 14.3 72.1 $871.10
Croplan R2C 3851 RR2Y 3.8 18.8 82.3 $980.56
Total Average 15.7 73.3 $ 881.30
vegetative growth during May and June created a bleak outlook
for high soybean yield potential for 2011. When the hot evenings
began the 2nd week in July, the soybean vegetative growth and
growth stages were accelerated which led to a quick recovery of
lost yield potential.
The level of vegetative feeding from Japanese beetles, Stink bugs
and a few Bean Leaf beetles escalated to 15% of leaf damage on
the upper canopy the fi rst week of July. An insecticide was added
to the post herbicide treatment to allow the soybeans to recover
from the feeding and reduce stress during pod fi ll. The insecticide
addition at R2 accounted for a 4.5 bushel per acre yield increase.
Longer maturity soybeans out yielded short maturity beans by
14.6 bushels in the 2011 trials. The moisture variance between
trials tended to follow the variety and not the maturity until we
reached the 3.7 length maturity or later. The 3.8 to 4.0 maturity
beans tended to have a few green leaves and an additional week
of drying was needed to reach the 13% moisture level.
13
SOYBEAN VARIETY TRIALS

VARIETY RESPONSE TO POPULATION
PREVIOUS HARVEST YIELD AT YIELD AT YIELD AT AVG. YIELD AT AVG. GROSSCROP VARIETY TRAITS MATURITY MOISTURE 120,000 140,000 160,000 13% MOISTURE INCOME @ $12.14/Bu
1st yr corn AG3431 RR2Y 3.4 12.3 75.2 70.4 71.3 72.3 $877.35
1st yr corn AG3631 RR2Y 3.6 12.5 69.7 68.8 67.0 68.5 $831.03
1st yr corn AG3731 RR2Y 3.7 12.4 70.0 68.5 66.8 68.4 $830.13
1st yr corn AG4031 RR2Y 4.0 9.9 62.9 65.1 66.8 64.9 $788.21
1st yr corn Total Average 11.8 69.5 68.2 68.0 68.5 $831.68
Comments/Conclusions Four varieties were chosen to set up the trials for response to
population. The 120,000 plant population rate was the overall
highest yielding population. The shorter maturity varieties had
the largest response to low population and the longest maturity
variety responded best to a higher population. The shorter
maturity varieties were a little more of a bushy style bean in
comparison with the 4.0 maturity bean which was more erect.
A maintenance application of 20-60-120 applied in the previous
fall was responsible for a 4.1 bushel per acre yield increase
compared with no P & K. Soybeans require 1.4 lbs of Potasium per
bushel of beans. Over 80% of this potassium must be absorbed
during the pod fi ll to harvest. During dry soil conditions, the
diffusion of potassium to the root is reduced signifi cantly. This
is why it is so important to receive timely rain in August for top
soybean production.
Fungicide yield response average 1.9 bushels per acre and was
applied at R4 stage.
Objective Evaluate the yield response of each soybean variety to three
different populations. Measure variety yield response to soil
applied fertility and fungicide application at R4 stage.
Cropping History: Corn/Bean Rotation
Tillage: Conventional Tillage
Planting Date: May 5, 2011
Harvest Date: September 6, 2011
Herbicide: 1.7 pt Prefi x plus 22 oz Roundup WeatherMAX
Post Herbicide: 26 oz of Roundup WeatherMAX with 1qt/ac
Smart Trio
Population: 120,000 / 140,000 / 160,000
Fungicide: 6 oz Quadris at R4 Stage
Crop Nutrition: 20-60-120 applied in the fall as a suspension
S O Y B E A N P O P U L AT I O N
14
Cropping History: Corn/Bean Rotation
Tillage: Conventional Tillage
Planting Date: May 6, 2011
Harvest Date: September 23, 2011
Pre-plant Herbicide: 1.7 pt Prefi x plus 22 oz Roundup WeatherMAX
Post Herbicide: 28 oz Roundup WeatherMAX, with Prolec and
various tank mix partners at R2
Population: 140,000
Fungicide: 6 oz Quadris at R4 stage
Crop Nutrition: 20-60-120 applied in the fall as suspension
S O Y B E A N H E R B I C I D E S T R E S S M I T I G AT I O N
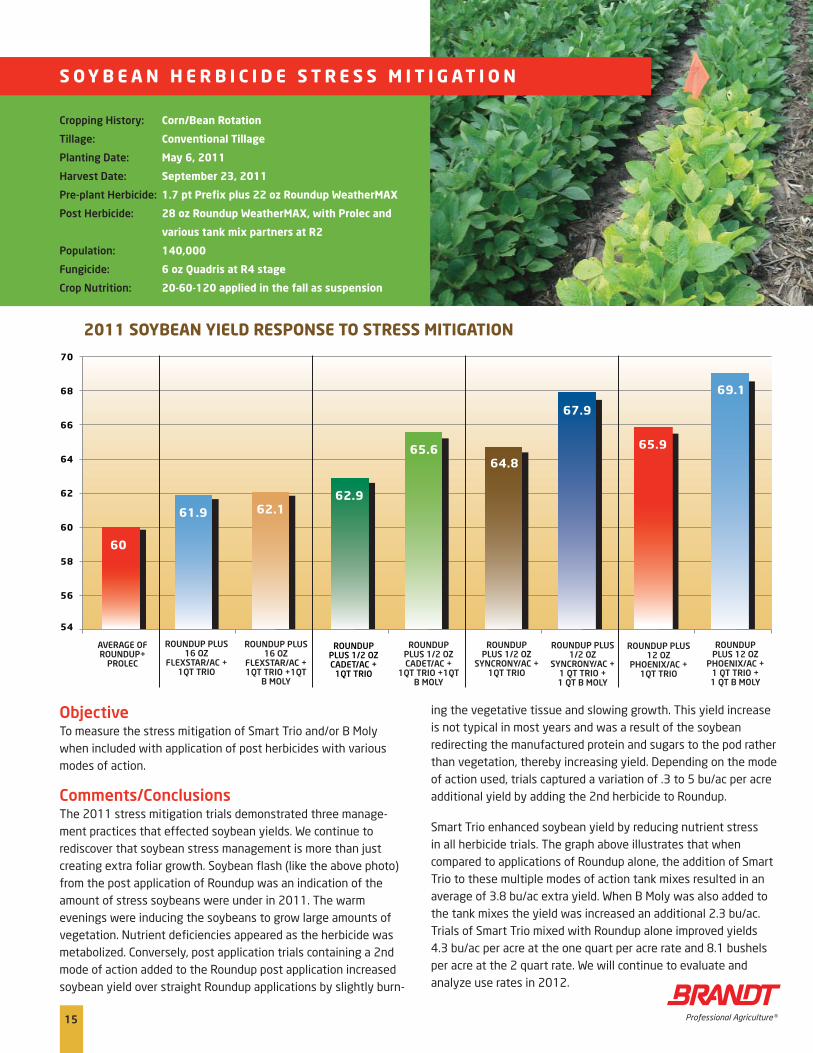
Comments/Conclusions The 2011 stress mitigation trials demonstrated three manage-ment practices that effected soybean yields. We continue to rediscover that soybean stress management is more than just creating extra foliar growth. Soybean fl ash (like the above photo) from the post application of Roundup was an indication of the amount of stress soybeans were under in 2011. The warm evenings were inducing the soybeans to grow large amounts of vegetation. Nutrient defi ciencies appeared as the herbicide was metabolized. Conversely, post application trials containing a 2nd mode of action added to the Roundup post application increased soybean yield over straight Roundup applications by slightly burn-
ing the vegetative tissue and slowing growth. This yield increase is not typical in most years and was a result of the soybean redirecting the manufactured protein and sugars to the pod rather than vegetation, thereby increasing yield. Depending on the mode of action used, trials captured a variation of .3 to 5 bu/ac per acre additional yield by adding the 2nd herbicide to Roundup.
Smart Trio enhanced soybean yield by reducing nutrient stress in all herbicide trials. The graph above illustrates that when compared to applications of Roundup alone, the addition of Smart Trio to these multiple modes of action tank mixes resulted in an average of 3.8 bu/ac extra yield. When B Moly was also added to the tank mixes the yield was increased an additional 2.3 bu/ac. Trials of Smart Trio mixed with Roundup alone improved yields 4.3 bu/ac per acre at the one quart per acre rate and 8.1 bushels per acre at the 2 quart rate. We will continue to evaluate and analyze use rates in 2012.
Objective To measure the stress mitigation of Smart Trio and/or B Moly when included with application of post herbicides with various modes of action.
54
56
58
60
62
64
66
68
70
60
61.9 62.162.9
65.664.8
67.9
65.9
69.1
AVERAGE OFROUNDUP+
PROLEC
ROUNDUP PLUS 16 OZ
FLEXSTAR/AC +1QT TRIO
ROUNDUP PLUS 16 OZ
FLEXSTAR/AC +1QT TRIO +1QT
B MOLY
ROUNDUP PLUS 1/2 OZ CADET/AC +
1QT TRIO
ROUNDUP PLUS 1/2 OZCADET/AC +
1QT TRIO +1QT B MOLY
ROUNDUP PLUS 1/2 OZ
SYNCRONY/AC +1QT TRIO
ROUNDUP PLUS 1/2 OZ
SYNCRONY/AC +1 QT TRIO +1 QT B MOLY
ROUNDUP PLUS 12 OZ
PHOENIX/AC +1QT TRIO
ROUNDUP PLUS 12 OZ
PHOENIX/AC +1 QT TRIO +1 QT B MOLY
2011 SOYBEAN YIELD RESPONSE TO STRESS MITIGATION
15

No Acceleron AG4005 RR 4.0 10.1 % 71.6 $869.11
Acceleron AG4005 RR 4.0 10.0 % 77.7 $943.02
Avg.Gross Income
$12.14 bu
16
Comments/Conclusions For the 2nd year in a row our seed treatment trials showed very
positive results. As a comparison our trials were within what
the industry saw on an average with approximately a 6.0 bushel
per acre yield advantage. When we factor in an average seed
treatment cost of $11.00 per unit our return on investment was
$61.84 per acre.
The data continues to reinforce the idea that seed treatments are
providing a greater advantage than just merely increasing yield.
In the early vegetative stages, seed treatment allows for better
plant establishment and early vigor giving way to larger plants.
Chris Becker, Brandt Seed Specialist, measured a 6.4% increase in
stand which followed along with last year’s 7.1% increase. As he
stated at Agronomy Day, “The seed treated soybeans fi lled pods
closer to the top of the plant.”
Objective To evaluate the yield response to soybean seed treatments (Manganese, Zinc, Mycoriza, Acceleron).
Cropping History: Corn/Bean Rotation
Tillage: Conventional Tillage
Planting Date: May 9, 2011
Harvest Date: October 3, 2011
Pre-plant Herbicide: 1.7 pt Prefi x plus 22 oz Roundup WeatherMAX
Post Herbicide: 28 oz Roundup WeatherMAX, R2 stage
1qt Smart Trio, 1qt N Boron
Population: 140,000
Fungicide: 6 oz Quadris at R4 Stage
Nutrition: 20-60-120 applied in the fall as suspension
S O Y B E A N Y I E L D R E S P O N S E T O S E E D T R E AT M E N T S
Seed Treatment Response
Treatment Variety Trait MaturityHarvestMoisture
Yield at140,000
No Acceleron AG4005 RR 4.0 10.1 % 71.6 $869.11
Acceleron AG4005 RR 4.0 10.0 % 77.7 $943.02

Highlights of Results:
Summary of 2011 Results
Corn averaged 188.1 bu. /acre over the 424 trials. Due to light showers in
mid April, the corn was planted on three planting dates and provided us
some additional information to ponder. The 1st year corn remained fairly
constant in yield over all planting dates, while the corn on corn yields
dropped as planting was delayed. Corn on corn planted on April 10th
yielded 9 bushels per acre higher than the corn following soybeans. By
the time we fi nished planting the trials on May 4th, the corn following
soybean rotation was averaging 64 bu. /acre higher yield than the corn
on corn.
Brandt Total Acre corn on corn yields ranged from a high of 293.4 bu. /
acre to a low of 75.1 bu. /acre depending on the hybrid, population rate,
nitrogen rate, phosphate and potash rate, and adding starter and/or zinc
at planting. The trial design begins by incorporating all management
practices that optimize yield and plant health. Next, each of the practices
chosen for yield response (one at a time) is then removed or the rate is
adjusted. This allows us to measure the degree of yield loss from the
omission or reduction of a management practice.
Local grower fi eld observations from the Brandt trade area plus Research
Farm trials pointed to two main corn production issues: poor drainage
and/or root and stalk diseases. In most cases, practices that assist the
plant with disease prevention were the answer to higher yields. Residue
management, higher rates of potassium and/or zinc applications were the
most consistent disease control practices.
Soybean yields for 2011 averaged 69.5 bushels per acre over 120 trials.
This was 13.2 bushels per acre less than last year’s record. The soybeans
were planted 2 weeks later than last year which reduced the time for
fl owering and pod fi ll (especially for the shorter maturity varieties). This
later planting coupled with slow vegetative growth during May and June
created a bleak outlook for high soybean yields in 2011. When the hot
evenings began the 2nd week in July, the soybean vegetative growth and
growth stages were accelerated which led to quick recovery of much of
the lost yield potential.
Unlike the corn, the soybeans developed very little disease. However,
the level of vegetative feeding from insects did escalate to 15% of leaf
damage on the upper canopy the fi rst week of July. Post insecticide
treatments paid well in additional yield. Extra yield was also measured
by applying post products such as Cadet, Phoenix, Flexstar, or Synchrony
which slowed vegetative growth and rerouted the bean nutrition
production into pod fi ll.
Ed CorriganBrandt Technical Agronomist
17
�
�
�
The gross profi t to adding zinc
was $68 per acre. (p.9)
Applied potash was the 2nd most
important decision for yield and
averaged $173 acre. (p.7)
A 4 year average of 12.7 bushel
per acre yield advantage with
Smart Trio. (p.5)
HIGHLIGHTS

Retail LocationsAshland 217 476 3438Auburn 217 438 6158Cooksville 309 725 3710Cropsey 309 377 3121Fairbury 815 692 2612Franklin 217 675 2302Galesville 217 489 2141Greenview 217 968 5589Gridley 309 747 2233Lexington 309 365 7201Lincoln 217 735 2571New Berlin 217 488 3125Oakford 217 635 5765Pleasant Plains 217 626 1127Raymond 217 229 3442Towanda 309 728 2294Williamsville 217 566 2113
Brandt Consolidated, Inc.2935 South Koke Mill RoadSpringfi eld, Illinois 62711 USAwww.brandt.co217 547 5800


