
1
2010 LEGISLATIVE REPORT ON
REMEDIAL EDUCATION
Submitted February 4, 2011
_________________________________________________________________________________
1560 Broadway, Suite 1600Denver, Colorado 80204(303) 866-2723
LT. GOVERNOR JOSEPH GARCIA, EXECUTIVE DIRECTOR
LT. GOV JOSEPH GARCIA, EXECUTIVE DIRECTOR

2
OVERVIEW AND HIGHLIGHTS
Overview
The information in this report is presented to encourage continued conversation regarding preparation for
college and remedial or developmental education in Colorado. This report documents action taken and data
gathered by the Colorado Department of Higher Education (DHE) for academic year 2010 (Summary 2009
– Spring 2010) as required by statute to report annually on students taking basic skills courses at Colorado‘s
public higher education institutions. The report is submitted to the Education Committees of the Senate and
House of Representatives, the Joint Budget Committee (JBC), the Colorado Department of Education
(CDE), and each Colorado public school district superintendent.
C.R.S. 23-1-113.3 defines areas of responsibility for the Commission with regard to remedial education:
adopt and implement a remedial policy; develop funding policies for remediation appropriate to
institutional roles and missions;
design a reporting system that provides the General Assembly with information on the number,
type, and costs of remediation;
establish comparability of placement or assessment tests; and
Ensure each student identified as needing remediation is provided with written notification
regarding cost and availability of remedial courses.
Beginning in Summer/Fall 2001, public institutions submitted data for this report using the Student Unit
Record Data System (SURDS). Remedial information is reported on first time students enrolled in public
institutions beginning in Fall 2005.
Highlights
Overall, the percent of students requiring remediation in at least one subject decreased slightly from
the previous year.
When examining remediation by subject, most students required remediation in mathematics,
followed by writing and then reading.
For recent high school graduates, slightly more females than males require remediation. When
examining students 20 years or older, slightly more males require remediation than females.
White, non-Hispanic students, both recently graduated from high school and non-traditional
students, had the lowest remedial needs. The remedial needs of students, based upon race/ethnicity,
have remained relatively flat since last year.
Students not requiring remediation have higher one-year retention rates at both two-year and four-
year institutions than students with remedial needs.
Students not requiring remediation have higher graduation rates at both two-year and four-year
institutions than students with remedial needs. The gap between graduation rates of remedial and
non-remedial students is smaller at two-year institutions than four-year institutions.
Approximately 62 percent of all remedial courses offered were successfully completed.
The estimated general cost associated with remedial education is slightly over 19 million dollars.
Remedial needs by high school have remained fairly consistent with a few exceptions.
There appears to be an association between the percent of recently graduated high school students
needing remediation and the educational attainment of their County of residence.

3
I. INTRODUCTION
Report Organization
The first section of this report presents policy changes regarding remedial education, additions to this
year‘s report, and the methodology. The next section summarizes the remedial needs of recently
graduated high school students by postsecondary school and subject matter. That is followed by a
section on the demographics of recently graduated high school students and non-traditional students
broken down by gender and race/ethnicity. One-year retention and four and six year graduation rates for
students enrolled at four-year institutions and two and three year graduation rates for students enrolled at
two-year institutions is presented next. A section on end of term completion and costs of remedial
education follows. Remediation by high school and county is presented next with a subsection on
educational attainment by county. Lastly, a discussion and conclusion section is shown. All tables and
figures are included in the Appendix.
CCHE Remedial Policy and Updates
A. Remedial Policy
In August 2000, the Commission adopted a remedial policy designed to ensure that:
All enrolled first-time undergraduate students are prepared to succeed in college-level courses;
Students assessed as needing remedial instruction obtain accurate information regarding course
availability and options to meet the college entry-level competencies; and
Colorado public high schools are informed about the level of college readiness of their recent high
school graduates.
The policy applies to all state-supported institutions of higher education (that is, four-year and two-year
colleges); governing boards and institutions of the public system of higher education in Colorado are
obligated to conform to the policies set by the Commission within the authorities delegated to it by
C.R.S. 23-1-113.3.
B. FTE Policy
The Commission revised its FTE Policy in March 2001, clearly identifying the public institutions that
may claim state support for remedial education—Colorado community colleges, Adams State College,
and Mesa State College—and the circumstances under which it may be claimed. The Commission
added a separate FTE reporting form to enable monitoring of state costs associated with the delivery of
basic skills courses.
C. Revised Remedial Policy
The Commission revised its Remedial Policy again in 2003, effective for fiscal year 2005 that: 1)
clarifies a minimum passing score for placement in college-level mathematics; 2) determines
concordances for scores between different types of assessment tests; 3) specifies the undergraduate
student population to be assessed, and if necessary remediated; and 4) clarifies when institutions are
required to enforce mandatory remediation. The detailed Remedial Policies can be found at:
http://highered.colorado.gov/Publications/Policies/Archive/i-parte11-03.pdf

4
D. Unique Student Identifier Policy
In August 2010, the Commission revised the Remedial Policy to state that once all Colorado community
colleges, including Mesa State College and Adams State College, begin using the unique student
identifiers as required in section 23-5-127 (4), the institution and the Department shall report the
information specified in subsections (3) and (4) of this section on an individual student basis, using each
student‘s unique student identifier. The DHE and the CDE are currently working together to share the
Colorado High School unique student identifier (the SASID) so that the departments can track students
from high school into college and devise a plan to disseminate this individual information.
2010 Report Additions
In an effort to present a broader scope of remediation in Colorado, a number of additions were added to
the report this year including:
a brief demographic summary on the remedial needs of non-traditional or adult learners in Colorado;
graduation rates of two-year and four-year students needing remedial coursework and those not
requiring any remediation;
educational attainment level and remediation needs of recent high school graduates by county in
Colorado; and
longitudinal percentages of recently graduated high school students needing remediation by individual
high schools.
Methodology and Data
Beginning in fiscal year 2005, institutions submitted course and student registration data files to the
DHE that served as the basis for Colorado-specific evaluation of cut scores and the study of remediated
student success in courses. Effective fiscal year 2005, assessed students not meeting the specific
minimum cut score may be placed in college-level courses provided that a student‘s transcript(s) or
secondary level assessment justifies such placement. Institutions were also required to implement
mandatory advising of students with 30 hours of course work if the student still has unmet basic skills
deficiencies.
A. Selection Methodology: Student cohorts for the following remedial analysis at Colorado Public
Higher Education institutions include first time students enrolled in Fall 2009. The cohort includes
both degree and non-degree seeking, who are 17, 18, or 19, reported with a High School Code, and
excludes exclusive (Extended Studies Program) ESP students. DHE staff identifies recent high
school graduates in the SURDS files using an age-based estimate. Date of birth is used to calculate a
student‘s age as of September 15 of the specified year, and those students with a calculated age of
17, 18, or 19 years of age are included in the frequencies. A comparison cohort of degree and non-
degree seeking students 20 years and older was also selected. Report based on data collected as of
February 3, 2011.
B. Data Limitations: In reviewing the following tables, one must be mindful that the data do not
include recent graduates who enrolled in an out-of-state college, were not assessed, or were reported
by institutions with missing data (e.g., year of high school graduation, age, high school code, and/or
assessment status). Additionally, numerous variables exist that DHE is unable to collect that may
account for some of the variance surrounding those students who need remediation and those

5
adequately prepared for postsecondary education. Despite these limitations, DHE believes that this
summary is a reasonable representation of the current remedial landscape of Colorado.
II. REMEDIATION SUMMARY
National Context
Despite remediation not being a new phenomenon in higher education, the role of remediation has
changed and increased over the years. Nationally, 97% of two-year public institutions and 78% of four-
year public institutions offer at least one remedial course (NCES, 2003). A recent national report shows
a slight increase in the percent of students needing remediation in the past decade. For two-year public
colleges, 44% of students needed remediation in 2007 compared to 39% in 1995. For four-year public
institutions, 30% of students required remediation compared to 27% in 1995.
Currently in Colorado, the percentages of students needing remediation are 52% at two-year public
institutions and 18% at four-year public institutions. Overall, 28.6% of recent high school graduates in
Colorado need remediation upon entering a higher education institution. In Colorado the responsibility
of remediation is at the community college level. Adams State College and Mesa State College have a
statutorily defined two and four-year mission. Other four-year public institutions do not receive COF
funding for remedial courses.
Remedial Undergraduate Data Summary for First Time Recent High School Graduates
This section examines how many students were assigned to remediation at each of the public Colorado
institutions and then discusses in which remedial courses students were enrolled. In FY2010 (Fall ‗09)
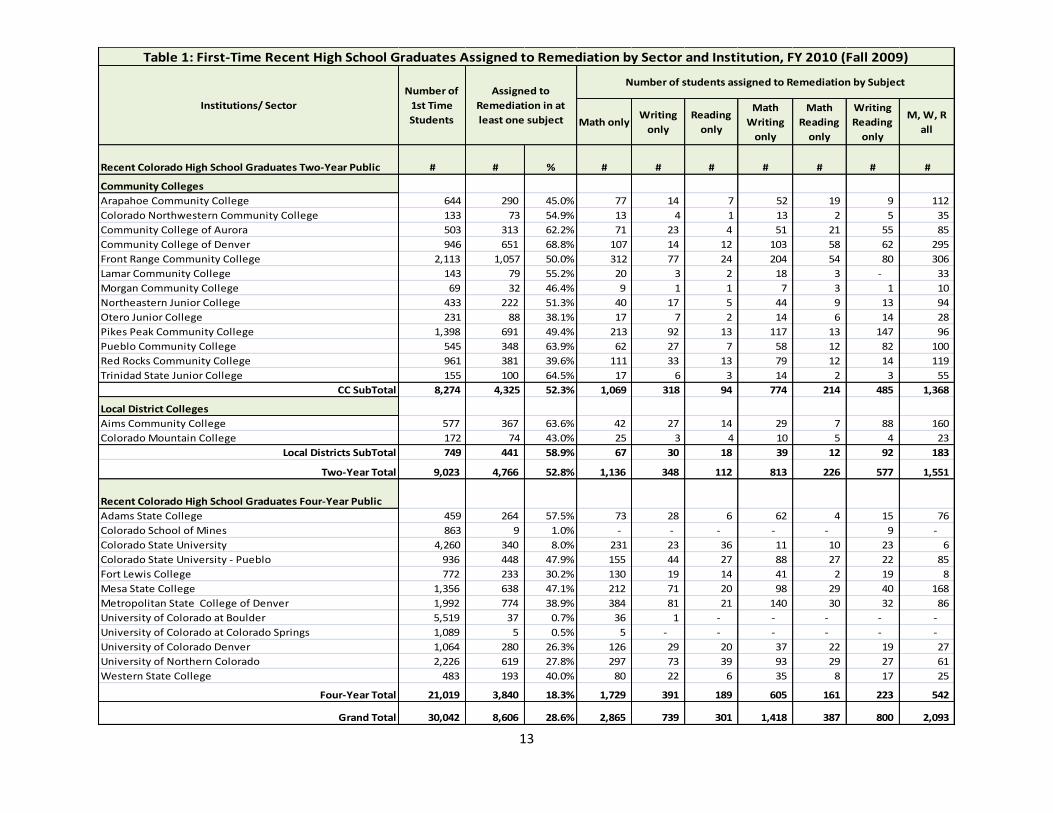
28.6% of all students were assigned to remediation in at least one discipline (Table 1). This number is
slightly lower than last year‘s percentage of 29.3. At the two-year institutions the overall remediation
rate in FY2010 was 52.8%, similar to 52.7% reported in FY2009. The Colorado Community College
System had an overall remediation rate of 52.3%. For two-year institutions, Otero Junior College had the
lowest remedial needs at 38.1% and the highest percent of need (68.8%) was reported at the Community
College of Denver. At the four-year institutions the overall remediation rate was 18.3%, down from last
year‘s 19.9%, with a consistent low at University of Colorado-Boulder and a high of 57.5% at Adams
State College. Historically, Adams State College has typically had the highest remedial rate for the four
year institutions, but the number of students requiring remediation has consistently decreased the past
three years from a high of 66.7% in FY2008.
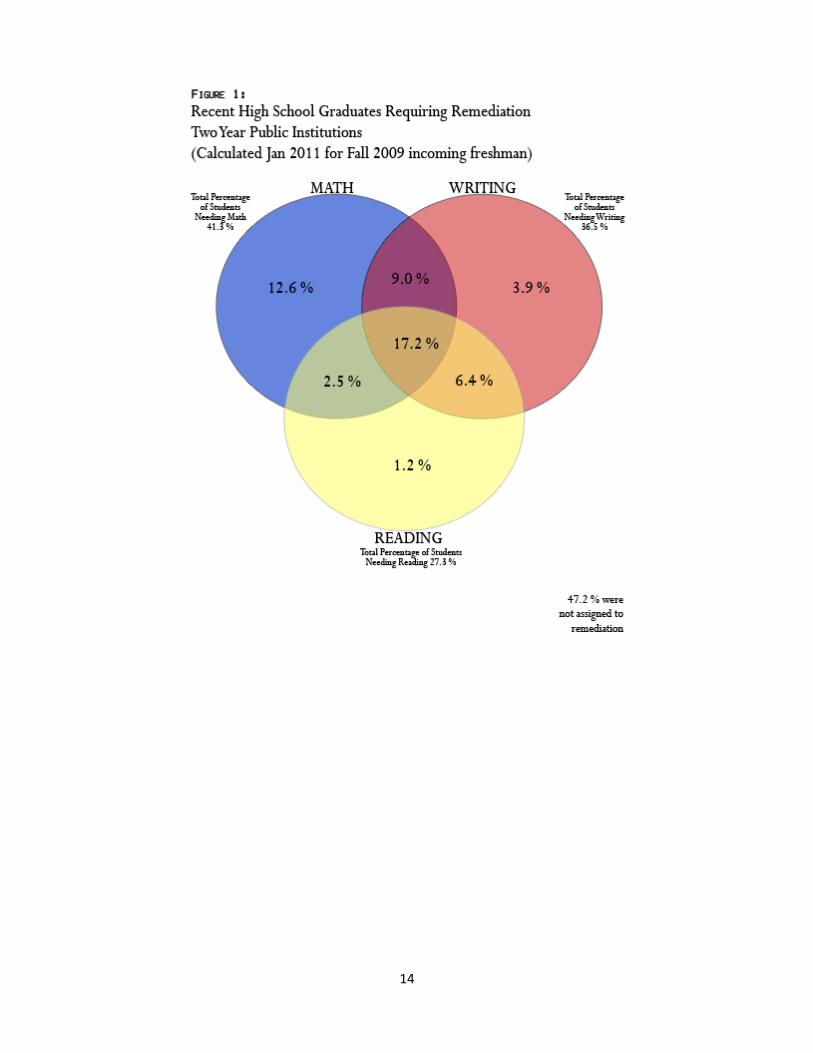
When examining remediation by discipline, most Colorado students required remediation in
mathematics, followed by writing and then reading. At both two-year and four institutions, mathematics
is by far the subject with the highest number of students assigned to remedial study (Figures 1 & 2).
Approximately 41% of total two-year students and 14.5% of total four-year students were assessed math
remediation. Figure 1 illustrates the percentage of recent high school graduates at two-year public
institutions assigned to remediation by discipline. 17.2% of entering students at two-year institutions
were assigned to remediation in all three subjects, mathematics, reading, and writing. Figure 2 illustrates
the percentage of recent high school graduates at four-year public institutions assigned to remediation by
subject area. Approximately 2.6% of entering students at four-year institutions were assigned to
remediation in all three subjects—mathematics, reading, and writing.
Historically, remediation in at least one subject has been fairly stable for the past five years.
Remediation at public two-year colleges has remained just under 55% of the overall population of

6
students enrolled in two year colleges. At an aggregate level, the percentage of students assigned to
remediation at public four-year institutions hovered around 20%. Despite the aggregated consistency
over the years, individual institutions can experience greater fluctuations, as Table 2 shows. For the past
five years, the compiled remedial needs of the state were slightly under 30%. Table 2 is an historical
overview of assessment activity from FY 2005 (Fall ‘04) through FYT 2010 (Fall ‘09). This is the first
time since FY2005 that there has been a noticeable decrease in the overall number of students requiring
remediation. Across sectors, the percentage of two-year students requiring remediation in at least one
subject has seen a downward trend from a high of 55.9% to 52.7% in FY2010. At four-year institutions
the overall rate decreased from a high of 21% in 2008 to 18.3% this year.
III. DEMOGRAPHICS
The following section first summarizes the demographics of recent high school graduates assigned to
remediation by gender and ethnicity then presents and compares the demographics of nontraditional
students aged 20 or older. Remediation by discipline for students 20 years or older is also presented.
Demographics of Recent High School Graduates Assigned to Remedial Coursework
This section disaggregates the demographic characteristics of recent high school graduates assigned to
remediation by gender and by race/ethnicity. Consistent over time, a slightly higher proportion of
females were assigned to remediation in both institutional sectors. At two-year institutions in the Fall of
2009, 54.4% of females were assigned to remediation, compared to 51.2% of males. At four-year
institutions, 20.2% of females were assigned to remediation compared to 16.3% of males (see Table 3).
By race/ethnicity, at two-year institutions the percentage of students assigned to remediation was 60.3%
for Asian/Pacific Islanders, 74.9% for Black, non-Hispanics, 64.8% for Hispanics, 63.8% for Native
Americans, and 45.9% for White, non-Hispanic students. Compared to the previous year, the percentage
of students requiring remediation remained flat for most race/ethnic groups except for an increase in
remedial needs for the Asian/Pacific Islander and Native American populations. Remedial education at
four-year institutions saw declines for Black, non-Hispanics (from 47.3% to 45.3%), Hispanics (from
38% to 34.0%), Native Americans (from 39.8% to 31.1%), Non-Resident Alien (from 21.6% to 7.8%),
and White, non-Hispanics (from 15.8% to 13.9%). Yet a higher percentage of Asian or Pacific Islanders
(from 17.7% to 18.4%) and Unknown Ethnicity (from 19.2% to 21.3%) were assigned remediation. See
Table 4.
Demographics of Non-traditional Students (20 years or older) Assigned to Remedial Coursework
This section of the report looks at the demographics of non-traditional students requiring remediation
compared to recent high school graduate students and then presents remedial needs by discipline for
students 20 years of age or older. In this report, non-traditional students are defined as students 20 years
of age or older. As the numbers of adult learners or non-traditional students continues to increase
nationally and locally, it is valuable to capture the role these students play in the overall remedial needs
of the state. According to the National Center for Education Statistics, 31% of all entering freshmen who
took a remedial class in 1992-93 were 19 years or younger, while 46% were over 22 years of age (NCES,
1996). In FY2010, Colorado students 19 and younger comprised 59.5% of the undergraduate population.
Of those students, 27.2% required remediation. Colorado students 20 years and older comprised a smaller

7
percent (40.5%) of the undergraduate population but a higher percent of those students required
remediation in at least one course (35.0%).
This section compares the demographic characteristics of recent high school graduates and non-
traditional students assigned to remediation by gender and by race/ethnicity. A slightly higher proportion
of females 19 years of age or younger were assigned to remediation (28.1%) compared to males (26.1%).
The opposite was true for students 20 years or older. Approximately 34% percent of females 20 years or
older were assigned to remediation while 36.4% of males required remedial coursework. See Table 5.
By race/ethnicity, the percentage of students 19 years of age or younger assigned to remediation was
slightly higher for the following populations compared to students 20 years or older: Unknown Ethnicity
(29.1%), Non-resident Alien (41.3%), Black, non-Hispanic (56.8%), and Hispanic (44.3%). The percent
of 19 year olds or younger who required remediation was slightly lower for the following ethnicities
compared to students who were 20 years or older: Native American or Alaskan Native (39.6%), Asian or
Pacific Islander (25.2%), and White, non-Hispanic (21.4%). See Table 6.
Table 7 describes and Figure 3 illustrates the percentage of students 20 years or older who were assigned
to remediation by subject area. Approximately, 6.8% of students 19 years or older were assigned to
remediation in all three subjects—mathematics, reading, and writing. By individual subject areas, math
had the highest percent of students needing remediation at 10.7%, while the smallest percent (0.87%) of
19 years or older undergraduates needed remediation in writing.
IV. RETENTION AND GRADUATION RATES
The following section portrays one year retention rates and graduation rates for recently graduated high
school students needing remediation and not needing remediation enrolled at public two-year and four-
year colleges.
Retention Rates of First-Recent High School Graduates Remediated and Non-Remediated (Fall
2008 to Fall 2009)
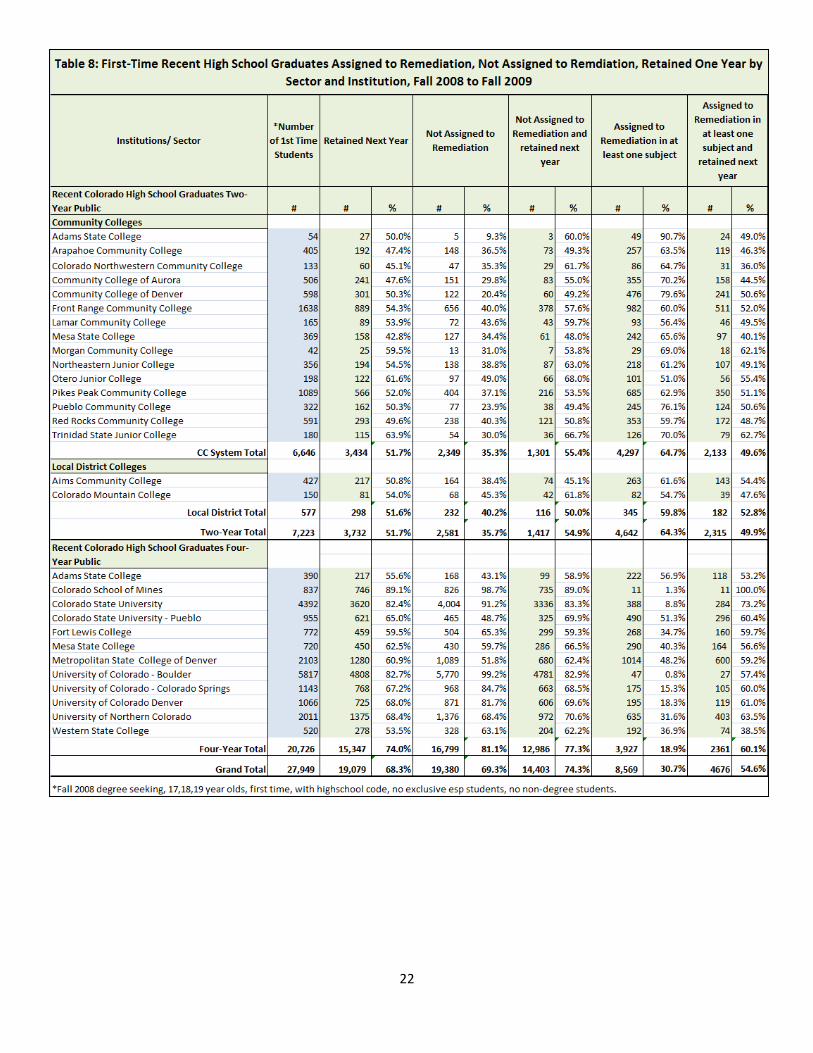
Table 8 shows overall retention rates of students compared to those assigned to remediation and those
not assigned to remediation. The retention rates lag the remedial report by one year since the Fall 2010
enrollment files were not yet reported at the time of this report. It is important to note that this retention
cohort is the ―remedial‖ retention cohort, which is created only to analyze remediation rates as instructed
by state legislation. This cohort is not equal to the retention rate cohorts which are reported to IPEDS.
This cohort includes degree-seeking (excludes non-degree seekers), 17, 18, or 19 years of age, who were
first time in college, were reported with a high school code, and it excludes exclusive ESP students. A
student is counted as retained if he/she appears in the enrollment file the following year or graduated
with a certificate or degree. Note that the two-year role and mission at Adams State and Mesa State is
separated in this cohort.
At the two-year institutions, the retention rate for the entire cohort was 51.7%, compared to 54.9% for
those not assigned remediation and 49.9% for those assigned remediation. At the four-year institutions,
the retention rate for the entire cohort was 74.0%, compared to 77.3% for those not assigned remediation
and 60.1% for those assigned remediation. Overall, of the recent high school graduates enrolled at any
8
public institution in Colorado not needing remediation, 74.3% of these students persisted through the
first year compared to 54.6% of students who required remediation.
Graduation Rates for First Time Recent High School Graduates Remediated and Non-
Remediated (2003 Cohort and 2006 Cohort)
The end result for postsecondary education is the hope that students persist through to graduation. With
that goal in mind, graduation rates were added to this report in an effort to determine if students needing
remediation were less likely to graduate. Using the 2003 Cohort from four-year public institutions,
30.1% of students not needing remediation graduated within four years, compared to 9.7% of students
who needed remediation. The gap between these percentages slightly decreases over time. By six years,
57.7% of students not needing remediation have graduated from four-year public institutions, compared
to 29.5% of students needing remedial coursework. For some four-year public institutions the gap is
smaller between graduation rates of students needing or not needing remediation. For example, at
Colorado State University, 69.2% of students not requiring remediation graduated within six years,
compared to 63.2% of students who needed remediation. At the University of Northern Colorado, 58.9%
of non-remediated students graduated within six years, compared to 52.5% that required remediation.
See Table 9.
As mentioned early in this report, the majority of remedial coursework offerings occur at two-year
public institutions. On a positive note, there appears to be less of a difference regarding graduation rates
at two-year public institutions between students needing remediation and those entering regular
coursework. Using the 2006 Cohort from two-year public institutions, 23.3% of students not needing
remediation graduated within two (plus) years, compared to 19.3% of students who needed remediation.
For the two community colleges with the largest enrollments (Front Range Community College and
Pikes Peak Community College) the percent of students who graduated in two (plus) years was 19.4%
and 20.2%, respectively, compared to 14.2% and 17.7%, respectively, for students needing remediation.
Of note is Pueblo Community College, whose two (plus) year graduation rates for students needing
remediation and not needing remediation are nearly identical at approximately 19%. See Table 10.
Please note the partial mission of two-year colleges is to prepare students to transfer to four-year
colleges. The transfer of community college students to four-year institutions is not captured by the data
in this report.
V. REMEDIAL COURSE COMPLETION AND COSTS
This next section presents credit hour information and course completion status of students requiring
remediation. This section also includes the overall cost of remediation for Colorado.
Remedial Summary by End of Term Completion
Table 11 shows courses attempted and total credit hours. Also shown is the end of term completion
status of students enrolled in remedial courses. At the two-year institutions, students enrolled in 65,409
remedial courses. Of those, students passed 40,208 (61.5%) and failed, withdrew, took as incomplete or
audited the remaining 25,201 (38.5%) courses. At the four-year institutions, students enrolled in 5,851
remedial courses. Of those, students passed 3,590 (61.4%), and failed, withdrew, took as incomplete or

9
audited the remaining 2,261 (38.6%) courses. At all institutions, students enrolled in 71,260 remedial
courses. Of those, students passed 43,798 (61.5%), and failed, withdrew, took as incomplete or audited
27,462 (38.5%). Overall, students failed approximately 25% of all remedial courses offered in public
institutions in Colorado.
Remedial Credit Hour Costs
Beginning with FY 2005, institutions that offer remedial course work submitted files on enrollments and
end of term completion rates. Based on the enrollment information, DHE staff calculates estimated costs
associated with these enrollments. Table 12 shows the estimated general fund cost for fall 2009 and
spring 2010. Two-year and four-year institutions that are authorized to offer remedial instruction
reported that 69,445 remedial courses were taken. The estimated general fund cost associated with these
enrollments is $19.1 million. Added to the cost of remedial instruction would be an additional $6.7
million in tuition paid by students (FY10 Resident Community College Tuition per credit hour
multiplied by Total Credit Hours). Not included in the cost tables is remedial course work taken in cash
funded courses, or remedial course work taken during the summer.
VI. REMEDIATION BY COUNTY, SCHOOL DISTRICT, AND HIGH SCHOOL
Recent High School Graduates Assigned to Remediation by School District and High School
Table 13 shows data on the number of students assigned to remediation by school district and high
school. Data from high schools with less than 25 recent high school graduates enrolled in an institution
of higher education are not displayed, though the number of students who were assigned to remediation
is included in the total number of students assigned to remediation. Table 13 includes percentages of
recent high school graduates assigned to remediation in at least one subject from 2007 to the current
year. For the most part, remediation percentages by high school are fairly consistent over the years with
a few exceptions. Of particular note are a few high schools who have repeatedly graduated students with
very low remedial needs. The following high schools had 15% or fewer of their graduates requiring
remediation for more than one year: The Classical Academy Charter, Fairview High School, Peak to
Peak Charter School, Cherry Creek High School, Cheyenne Mountain High School, and D‘Evelyn
Senior High School. Of these six high schools, two are located in Boulder County, which leads to the
next section examining remediation needs and educational attainment by Colorado County.
Recent High School Remediation Needs and Educational Attainment by County
There is general consensus that a number of factors, including parental level of education, influence the
educational aspirations and academic achievement of students. A national study found that 88% of
students whose parents had earned at least a bachelor‘s degree expected them to finish college,
compared to 44% of students whose parents had a high school degree or less (Lippman et al., 2008).
Currently, DHE does not collect data on parental educational attainment, but in an effort to account for
some of the variance surrounding remediation that cannot be explained by the educational pipeline, a
comparison was made between the total percent of remediation courses needed by recent high school
graduates and the percent of the population that have a bachelor‘s degree or higher by county. Table 14
shows a non-statistical indirect correlation between remediation needs and educational attainment by
county. Counties with eight high schools or more were included in the analysis. Generally, the higher

10
the percent of the county‘s population which has acquired a degree the lower the remedial needs within
that county. For example, 53.5% of the 25 and older population in Douglas County has earned a
bachelor‘s degree, while 18.4% of the recent high school students in Douglas County required
remediation. Whereas in Denver county, 39.3% of the 25 and older population has earned a bachelor‘s
degree, while 54.7% of the recent high school students in Denver County required remediation. These
findings are consistent when returning to and examining the remedial needs of individual high schools.
The overall remedial needs of recently graduated high school students in Boulder County are relatively
low, which is explained at the individual high school level since three of the seven high schools with
15% or fewer of the graduates require remediation were located in Boulder. Whereas in Denver County,
eight of the ten high schools graduated 50% or more of students who need remedial work upon entering
postsecondary education. Please note that the comparison between the educational attainment level by
county and the remedial needs of recently graduated high school students by county is not a statistical
analysis but was rather included to display the possibility of other factors influencing remedial education
that we can‘t capture through existing data.
VII. DISCUSSION AND CONCLUSIONS
Despite the controversy regarding remediation, remedial education remains relevant and important to the
overall goals of the state. Offering remediation aligns with providing access and opportunity to the
citizens of our state, aids in preparing a strong workforce and helps to maintain economic
competiveness. The discussion regarding remedial education and the opportunity for improvement is a
national occurrence. The data from this report pose a few discussion points as we move forward in
remedial education practices and policies.
The Responsibility of Remedial Education
The responsibility of remedial education—whether it lies with community colleges or four-year
institutions—has been a debate for years. Currently in Colorado, community colleges bear a slight
majority of the responsibility in providing remedial education to students. Using graduation rates as a
success measure, the data show that two-year institutions are graduating students who required remedial
education at rates just slightly under graduated students not needing remediation. This suggests that
community colleges are doing well in meeting the remedial needs of students. Yet, in order to even
better serve students with remedial needs and reduce the number of underprepared students, the
responsibility of remedial education must be shared at the secondary and postsecondary level.
Cost
The cost of remedial education increased from $13 million last year to $19 million this year. Nationally,
it is estimated that nearly three billion dollars is spent on getting underprepared students ready for
college level academic work. As higher education funding continues to be cut, these numbers appear
even more ominous. However, the ―cost‖ of not providing the opportunity for underprepared students to
enroll in college, persist to graduation, and venture out into the workforce must be considered. Colorado
must continue to use creative ways to reduce the number of students needing remediation, while not
jeopardizing access and opportunity.

11
Reversing the Trend
The data in this report reinforce the point that remedial education is not a postsecondary crisis but an
educational crisis. With the adoption of Colorado‘s P-20 system, the ability to share data between the
secondary and postsecondary systems became a reality. Using shared data, the Colorado Department of
Education was able to identify students in the 10th
grade who are not prepared for college based upon
performance in the ACT for Colorado and the state wide summative test (Lefly et al., 2011). The state
must use these existing data and target students with remedial needs before these students graduate from
the secondary system. To allow students with identified and known remediation needs to advance from
grade to grade merely pushes the problem on to the postsecondary system. To reverse the current
remediation trend and break the cycle, Colorado‘s P-20 system must work together to identify students
with remedial needs earlier in the pipeline and work to remediate before as quickly as possible. Clearly
we all share the responsibility of preparing postsecondary and workforce ready students and reducing
remediation.
Resources
Lefly, D., Lovell, C., & O‘Brien, J., (2011, In Progress). Shining a Light on College Remediation in Colorado:
The Predictive Utility of the ACT for Colorado and the Colorado Student Assessment Program (CSAP).
Lippman, L., Guzman, L., Dombrowski Keith, J., Kinukawa, A., Schwalb, R., & Tice, P. (2008). Parent
Expectations and Planning for College: Statistical Analysis Report (NCES 2008-079). National Center for Education
Statistics, Institute of Education Sciences, U.S. Department of Education. Washington, DC.
National Center for Education Statistics (NCES).1996. ―Remedial Education at Higher Education Institutions in
Fall 1995.‖ Washington, D.C.: U.S. Department of Education, Office of Educational Research and Improvement, cited by
J.E. Roueche and S.D.Roueche, High Stakes, High Performance. Washington, D.C.: Community College Press, American
Association of Community Colleges.
______. 2003. Postsecondary Education Quick Information System (PEQIS), ―Remedial Education at Degree-Granting
Postsecondary Institutions in Fall 2000.‖
Parker, T., Bustillos, L., & Behringer, L., (2010). Remedial and Developmental Education Policy at a
Crossroads. Getting Past Go, Policy Research on Preparation Access and Remedial Eduation, University of
Massachusetts, Boston, MA.

12
2010 Legislative Report on Remedial Education
APPENDIX
13
Math onlyWriting
only
Reading
only
Math
Writing
only
Math
Reading
only
Writing
Reading
only
M, W, R
all
Recent Colorado High School Graduates Two-Year Public # # % # # # # # # #
Community Colleges
Arapahoe Community College 644 290 45.0% 77 14 7 52 19 9 112
Colorado Northwestern Community College 133 73 54.9% 13 4 1 13 2 5 35
Community College of Aurora 503 313 62.2% 71 23 4 51 21 55 85
Community College of Denver 946 651 68.8% 107 14 12 103 58 62 295
Front Range Community College 2,113 1,057 50.0% 312 77 24 204 54 80 306
Lamar Community College 143 79 55.2% 20 3 2 18 3 - 33
Morgan Community College 69 32 46.4% 9 1 1 7 3 1 10
Northeastern Junior College 433 222 51.3% 40 17 5 44 9 13 94
Otero Junior College 231 88 38.1% 17 7 2 14 6 14 28
Pikes Peak Community College 1,398 691 49.4% 213 92 13 117 13 147 96
Pueblo Community College 545 348 63.9% 62 27 7 58 12 82 100
Red Rocks Community College 961 381 39.6% 111 33 13 79 12 14 119
Trinidad State Junior College 155 100 64.5% 17 6 3 14 2 3 55
CC SubTotal 8,274 4,325 52.3% 1,069 318 94 774 214 485 1,368
Local District Colleges
Aims Community College 577 367 63.6% 42 27 14 29 7 88 160
Colorado Mountain College 172 74 43.0% 25 3 4 10 5 4 23
Local Districts SubTotal 749 441 58.9% 67 30 18 39 12 92 183
Two-Year Total 9,023 4,766 52.8% 1,136 348 112 813 226 577 1,551
Adams State College 459 264 57.5% 73 28 6 62 4 15 76
Colorado School of Mines 863 9 1.0% - - - - - 9 -
Colorado State University 4,260 340 8.0% 231 23 36 11 10 23 6
Colorado State University - Pueblo 936 448 47.9% 155 44 27 88 27 22 85
Fort Lewis College 772 233 30.2% 130 19 14 41 2 19 8
Mesa State College 1,356 638 47.1% 212 71 20 98 29 40 168
Metropolitan State College of Denver 1,992 774 38.9% 384 81 21 140 30 32 86
University of Colorado at Boulder 5,519 37 0.7% 36 1 - - - - -
University of Colorado at Colorado Springs 1,089 5 0.5% 5 - - - - - -
University of Colorado Denver 1,064 280 26.3% 126 29 20 37 22 19 27
University of Northern Colorado 2,226 619 27.8% 297 73 39 93 29 27 61
Western State College 483 193 40.0% 80 22 6 35 8 17 25
Four-Year Total 21,019 3,840 18.3% 1,729 391 189 605 161 223 542
Grand Total 30,042 8,606 28.6% 2,865 739 301 1,418 387 800 2,093
Number of students assigned to Remediation by Subject
Table 1: First-Time Recent High School Graduates Assigned to Remediation by Sector and Institution, FY 2010 (Fall 2009)
Number of
1st Time
Students
Assigned to
Remediation in at
least one subject
Institutions/ Sector
Recent Colorado High School Graduates Four-Year Public
14

15

16
2005 2006 2007 2008 2009 2010
Recent Colorado High School Graduates Two-
Year Public # # # # # # # % # % # % # % # % # %
Community Colleges
Arapahoe Community College 732 624 763 589 586 644 448 61.2% 372 59.6% 417 54.7% 257 43.6% 258 44.0% 290 45.0%
Colorado Northwestern Community College 159 125 103 118 153 133 37 23.3% 31 24.8% 51 49.5% 66 55.9% 86 56.2% 73 54.9%
Community College of Aurora 523 484 511 455 604 503 309 59.1% 273 56.4% 325 63.6% 285 62.6% 357 59.1% 313 62.2%
Community College of Denver 1,203 1,040 781 732 783 946 500 41.6% 410 39.4% 541 69.3% 472 64.5% 483 61.7% 651 68.8%
Front Range Community College 2,023 1,712 2,019 1,766 2,090 2,113 1,147 56.7% 978 57.1% 1,153 57.1% 886 50.2% 995 47.6% 1,057 50.0%
Lamar Community College 258 142 234 94 174 143 133 51.6% 82 57.7% 107 45.7% 64 68.1% 95 54.6% 79 55.2%
Morgan Community College 139 109 68 62 75 69 18 12.9% 49 45.0% 36 52.9% 32 51.6% 30 40.0% 32 46.4%
Northeastern Junior College 379 375 420 363 404 433 222 58.6% 236 62.9% 251 59.8% 207 57.0% 219 54.2% 222 51.3%
Otero Junior College 248 227 326 188 216 231 160 64.5% 143 63.0% 157 48.2% 88 46.8% 103 47.7% 88 38.1%
Pikes Peak Community College 1,218 1,108 312 1,257 1,253 1,398 765 62.8% 672 60.6% 160 51.3% 695 55.3% 692 55.2% 691 49.4%
Pueblo Community College 377 440 427 367 365 545 258 68.4% 331 75.2% 178 41.7% 255 69.5% 249 68.2% 348 63.9%
Red Rocks Community College 763 731 933 741 818 961 410 53.7% 400 54.7% 412 44.2% 324 43.7% 358 43.8% 381 39.6%
Trinidad State Junior College 276 230 253 263 192 155 188 68.1% 155 67.4% 122 48.2% 139 52.9% 126 65.6% 100 53.2%
CC SubTotal 8,298 7,347 7,150 6,995 7,713 8,274 4,595 55.4% 4,132 56.2% 3,910 54.7% 3,770 53.9% 4,051 52.5% 4,325 52.3%
Local District Colleges
Aims Community College 475 121 638 596 549 577 245 51.6% 65 53.7% 347 54.4% 286 48.0% 318 57.9% 367 63.6%
Colorado Mountain College 89 110 276 261 236 172 39 43.8% 36 32.7% 135 48.9% 121 46.4% 109 46.2% 74 43.0%
Local Districts SubTotal 564 231 914 857 785 749 284 50.4% 101 43.7% 482 52.7% 407 47.5% 427 54.4% 441 58.9%
Two-Year Total 8,862 7,578 8,064 7,852 8,498 9,023 4,879 55.1% 4,233 55.9% 4,392 54.5% 4,177 53.2% 4,478 52.7% 4,766 52.8%
Adams State College 367 433 443 421 448 459 195 53.1% 274 63.3% 287 64.8% 281 66.7% 271 60.5% 264 57.5%
Colorado School of Mines 732 779 757 762 837 863 31 4.2% 23 3.0% 16 2.1% 24 3.1% 11 1.3% 9 1.0%
Colorado State University 4,024 3,850 4,055 4,290 4,392 4,260 134 3.3% 435 11.3% 316 7.8% 409 9.5% 388 8.8% 340 8.0%
Colorado State University - Pueblo 729 609 576 577 955 936 360 49.4% 275 45.2% 304 52.8% 303 52.5% 490 51.3% 448 47.9%
Fort Lewis College 918 851 864 872 774 772 423 46.1% 376 44.2% 261 30.2% 361 41.4% 268 34.6% 233 30.2%
Mesa State College 1,063 1,098 1,056 1,120 1,092 1,356 541 50.9% 610 55.6% 554 52.5% 619 55.3% 533 48.8% 638 47.1%
Metropolitan State College of Denver 1,947 1,912 1,795 1,945 2,120 1,992 1,021 52.4% 1,009 52.8% 883 49.2% 901 46.3% 1,023 48.3% 774 38.9%
University of Colorado at Boulder 5,115 4,994 5,614 5,558 5,830 5,519 59 1.2% 73 1.5% 86 1.5% 66 1.2% 47 0.8% 37 0.7%
University of Colorado at Colorado Springs 945 1,021 984 1,021 1,158 1,089 5 0.5% 10 1.0% 4 0.4% 5 0.5% 175 15.1% 5 0.5%
University of Colorado Denver 706 770 906 1,060 1,068 1,064 188 26.6% 190 24.7% 254 28.0% 364 34.3% 195 18.3% 280 26.3%
University of Northern Colorado 2,382 2,439 2,450 2,138 2,012 2,226 353 14.8% 302 12.4% 790 32.2% 674 31.5% 635 31.6% 619 27.8%
Western State College 478 458 493 546 520 483 177 37.0% 185 40.4% 194 39.4% 226 41.4% 192 36.9% 193 40.0%
Four-Year Total 19,406 19,214 19,993 20,310 21,206 21,019 3,487 18.0% 3,762 19.6% 3,949 19.8% 4,233 20.8% 4,228 19.9% 3,840 18.3%
Grand Total 28,268 26,792 28,057 28,162 29,704 30,042 8,366 29.6% 7,995 29.8% 8,341 29.7% 8,410 29.9% 8,706 29.3% 8,606 28.6%
Institutions/ Sector
Recent Colorado High School Graduates Four-
Year Public
Number of 1st Time Students
2005
Table 2: First-Time Recent High School Graduates Assigned to Remediation in at Least One Subject,
by Sector and Institution, FY 2005 to FY2010 (Fall Enrollment)
Assigned to Remediation in at least one subject
201020092006 2007 2008

17
2005 2006 2007 2008 2009 2010
Recent Colorado High School Graduates
Two-Year Public # # # # % # % # % # % # % # %
Female 4,653 3,972 4,084 3,898 4,285 4,456 2,643 56.8% 2,289 57.6% 2,303 56.4% 2,130 54.6% 2,371 55.3% 2,426 54.4%
Male 4,198 3,606 3,980 3,954 4,213 4,562 2,227 53.0% 1,944 53.9% 2,089 52.5% 2,047 51.8% 2,107 50.0% 2,338 51.2%
Unknown 11 - - 5 9 81.8% - - - - 2
Two-Year Total 8,862 7,578 8,064 7,852 8,498 9,023 4,879 55.1% 4,233 55.9% 4,392 54.5% 4,177 53.2% 4,478 52.7% 4,766 52.8%
Female 10,092 9,930 10,350 10,514 10,946 10,733 2,015 20.0% 2,112 21.3% 2,267 21.9% 2,391 22.7% 2,411 22.0% 2,167 20.2%
Male 9,314 9,284 9,643 9,796 10,260 10,280 1,472 15.8% 1,650 17.8% 1,682 17.4% 1,842 18.8% 1,817 17.7% 1,671 16.3%
Unknown - - - 6 - - - - - - 2
Four-Year Total 19,406 19,214 19,993 20,310 21,206 21,019 3,487 18.0% 3,762 19.6% 3,949 19.8% 4,233 20.8% 4,228 19.9% 3,840 18.3%
Grand Total 28,268 26,792 28,057 28,162 29,704 30,042 8,366 29.6% 7,995 29.8% 8,341 29.7% 8,410 29.9% 8,706 29.3% 8,606 28.6%
Recent Colorado High School Graduates
Four-Year Public
2007
by Sector and Gender, FY 2005 to FY2010 (Fall Enrollment)
Table 3: First-Time Recent High School Graduates Assigned to Remediation in at Least One Subject,
Number of 1st Time Students
2010
Assigned to Remediation in at least one subject
20092008Institutions/ Sector
2005 2006

18
2005 2006 2007 2008 2009 2010
Recent Colorado High School Graduates
Two-Year Public # # # # % # % # % # % # % # %
Asian or Pacific Islander 269 253 285 258 264 290 134 49.8% 154 60.9% 182 63.9% 163 63.2% 144 54.5% 175 60.3%
Black, non-Hispanic 463 425 444 452 512 625 326 70.4% 294 69.2% 337 75.9% 359 79.4% 381 74.4% 468 74.9%
Hispanic 1,509 1,288 1,588 1,544 1,620 1,556 950 63.0% 879 68.2% 987 62.2% 1,009 65.3% 1,063 65.6% 1,008 64.8%
Native American 118 107 90 96 86 149 68 57.6% 52 48.6% 56 62.2% 58 60.4% 47 54.7% 95 63.8%
Non-Resident Alien 109 102 12 41 184 129 86 78.9% 83 81.4% 5 41.7% 21 51.2% 113 61.4% 88 68.2%
White, non-Hispanic 6,052 5,056 5,368 5,191 5,333 5,299 3,157 52.2% 2,616 51.7% 2,680 49.9% 2,425 46.7% 2,459 46.1% 2,434 45.9%
Unknown Ethnicity 342 347 277 270 499 975 158 46.2% 155 44.7% 145 52.3% 142 52.6% 271 54.3% 498 51.1%
Two-Year Total 8,862 7,578 8,064 7,852 8,498 9,023 4,879 55.1% 4,233 55.9% 4,392 54.5% 4,177 53.2% 4,478 52.7% 4,766 52.8%
Asian or Pacific Islander 914 888 966 1,001 999 1,013 159 17.4% 170 19.1% 176 18.2% 204 20.4% 177 17.7% 186 18.4%
Black, non-Hispanic 510 518 560 638 717 777 216 42.4% 219 42.3% 261 46.6% 283 44.4% 339 47.3% 352 45.3%
Hispanic 1,821 1,804 1,951 2,012 2,236 2,318 637 35.0% 638 35.4% 722 37.0% 753 37.4% 849 38.0% 788 34.0%
Native American 317 358 443 389 364 399 149 47.0% 154 43.0% 154 34.8% 169 43.4% 145 39.8% 124 31.1%
Non-Resident Alien 98 87 178 162 153 166 23 23.5% 16 18.4% 21 11.8% 45 27.8% 33 21.6% 13 7.8%
White, non-Hispanic 14,932 14,629 14,863 15,294 15,577 14,907 2,155 14.4% 2,339 16.0% 2,358 15.9% 2,555 16.7% 2,462 15.8% 2,071 13.9%
Unknown Ethnicity 814 930 1,032 814 1,160 1,439 148 18.2% 226 24.3% 257 24.9% 224 27.5% 223 19.2% 306 21.3%
Four-Year Total 19,406 19,214 19,993 20,310 21,206 21,019 3,487 18.0% 3,762 19.6% 3,949 19.8% 4,233 20.8% 4,228 19.9% 3,840 18.3%
Grand Total 28,268 26,792 28,057 28,162 29,704 30,042 8,366 29.6% 7,995 29.8% 8,341 29.7% 8,410 29.9% 8,706 29.3% 8,606 28.6%
Recent Colorado High School Graduates
Four-Year Public
2007
by Sector and Race/Ethnicity, FY 2005 to FY2010 (Fall Enrollment)
Table 4: First-Time Recent High School Graduates Assigned to Remediation in at Least One Subject,
Number of 1st Time Students
2010
Assigned to Remediation in at least one subject
20092008Ethnicity
2005 2006

19

20

21
22

23

24

25

26

27
Table 13: Colorado Public High School Graduates Assigned to Remediation in Colorado Public Higher Education FY 2010 (Fall Enrollment)
School District High School Number of 1st Time Students
Assigned to Remediation in at least one subject Number of students assigned to Remediation by Subject
Math Writing Reading
# # 2010
% 2010
2009 2008 2007 # # #
ACADEMY 20 AIR ACADEMY HIGH SCHOOL
190 28 14.7% 145/18.2% 26/15.4% 16/11.3% 23 11 5
ACADEMY 20 ASPEN VALLEY HIGH SCHOOL
* * * * * * * * *
ACADEMY 20 LIBERTY HIGH SCHOOL 166 42 25.3% 57/28.4% 60/33.3% 21/16.2% 31 21 16
ACADEMY 20 PINE CREEK HIGH SCHOOL 187 35 18.7% 62/28.4% 47/23.3% 16/12.4% 27 18 9
ACADEMY 20 RAMPART HIGH SCHOOL 208 31 14.9% 54/27.7% 29/15.7% 15/9.9% 17 21 12
ACADEMY 20 THE CLASSICAL ACADEMY CHARTER
56 4 7.1% * 5/13.9% * 4 2 2
ADAMS COUNTY 14 ADAMS CITY HIGH SCHOOL 65 37 56.9% 31/64.6% 28/71.8% 41/61.2% 30 20 17
ADAMS COUNTY 14 LESTER R ARNOLD HIGH SCHOOL
* * * * * * * * *
ADAMS-ARAPAHOE 28J
AURORA CENTRAL HIGH SCHOOL
69 52 75.4% 60/70.6% 61/70.9% 52/65.8% 43 38 32
ADAMS-ARAPAHOE 28J
GATEWAY HIGH SCHOOL 104 64 61.5% 74/60.7% 55/47.4% 61/48.0% 54 44 32
ADAMS-ARAPAHOE 28J
HINKLEY HIGH SCHOOL 109 57 52.3% * 43/56.6% 42/45.7% 50 34 29
ADAMS-ARAPAHOE 28J
OPTIONS SCHOOL * * * * * * * * *
ADAMS-ARAPAHOE 28J
RANGEVIEW HIGH SCHOOL 170 76 44.7% 100/48.3% 87/47.3% 77/49.0% 57 42 34
ADAMS-ARAPAHOE 28J
WILLIAM SMITH HIGH SCHOOL
* * * * * * * * *
AGATE 300 AGATE JUNIOR-SENIOR HIGH SCHOO
* * * * * * * * *
AGUILAR REORGANIZED 6
AGUILAR JUNIOR-SENIOR HIGH SCH
* * * * * * * * *

28
Table 13: Colorado Public High School Graduates Assigned to Remediation in Colorado Public Higher Education FY 2010 (Fall Enrollment)
School District High School Number of 1st Time Students
Assigned to Remediation in at least one subject Number of students assigned to Remediation by Subject
Math Writing Reading
# # 2010
% 2010
2009 2008 2007 # # #
AKRON R-1 AKRON HIGH SCHOOL * * * * 6/16.7% * * * *
ALAMOSA RE-11J ALAMOSA HIGH SCHOOL 60 29 48.3% 29/49.2% 31/43.1% 33/47.8% 24 21 14
ALAMOSA RE-11J ALAMOSA OPEN SCHOOL * * * * * * * * *
ARCHULETA COUNTY 50 JT
PAGOSA SPRINGS HIGH SCHOOL
38 18 47.4% 16/42.1% 29/49.2% 14/31.8% 16 9 4
ARICKAREE R-2 ARICKAREE UNDIVIDED HIGH SCHOO
* * * * * * * * *
ARRIBA-FLAGLER C-20
FLAGLER SENIOR HIGH SCHOOL
* * * * * * * * *
ASPEN 1 ASPEN HIGH SCHOOL 44 9 20.5% 8/19.5% 10/18.2% 50/12.0% 8 5 1
AULT-HIGHLAND RE-9
HIGHLAND HIGH SCHOOL * * * * * * * * *
BAYFIELD 10 JT-R BAYFIELD HIGH SCHOOL 42 13 31.0% 12/30.8% 18/41.2% 9/30.0% 8 6 3
BENNETT 29J BENNETT HIGH SCHOOL * * * * * * * * *
BETHUNE R-5 BETHUNE JUNIOR-SENIOR HIGH SCH
* * * * * * * * *
BIG SANDY 100J SIMLA HIGH SCHOOL * * * * * * * * *
BOULDER VALLEY RE 2
ARAPAHOE RIDGE HIGH SCHOOL
* * * * * * * * *
BOULDER VALLEY RE 2
BOULDER HIGH SCHOOL 209 34 16.3% 34/18.0% 36/18.0% 39/20.7% 27 22 16
BOULDER VALLEY RE 2
BOULDER PREP CHARTER HIGH SCHO
* * * * * * * * *
BOULDER VALLEY RE 2
BROOMFIELD HIGH SCHOOL
180 45 25.0% 63/27.5% 53/28.5% 63/28.5% 34 27 15
BOULDER VALLEY RE 2
CENTAURUS HIGH SCHOOL 107 27 25.2% 27/26.7% 26/24.5% 38/29.7% 18 15 9
BOULDER VALLEY RE FAIRVIEW HIGH SCHOOL 227 25 11.0% 21/9.3% 23/11.2% 21/8.9% 19 12 5

29
Table 13: Colorado Public High School Graduates Assigned to Remediation in Colorado Public Higher Education FY 2010 (Fall Enrollment)
School District High School Number of 1st Time Students
Assigned to Remediation in at least one subject Number of students assigned to Remediation by Subject
Math Writing Reading
# # 2010
% 2010
2009 2008 2007 # # #
2
BOULDER VALLEY RE 2
MONARCH HIGH SCHOOL 249 33 13.3% 49/19.9% 45/17.5% 46/20.0% 28 16 14
BOULDER VALLEY RE 2
NEDERLAND MIDDLE-SENIOR HIGH S
* * * 9/24.3% 9/24.3% 8/32.0% * * *
BOULDER VALLEY RE 2
NEW VISTA HIGH SCHOOL * * * * * * * * *
BOULDER VALLEY RE 2
PEAK TO PEAK CHARTER SCHOOL
35 4 11.4% 4/11.8% 3/8.6% 1/2.9% 4 2 1
BRANSON REORGANIZED 82
BRANSON ALTERNATIVE SCHOOL
* * * * * * * * *
BRANSON REORGANIZED 82
BRANSON UNDIVIDED HIGH SCHOOL
* * * * * * * * *
BRIGGSDALE RE-10 BRIGGSDALE UNDIVIDED HIGH SCHO
* * * * * * * * *
BRIGHTON 27J BRIGHTON CHARTER SCHOOL
* * * * * * * * *
BRIGHTON 27J BRIGHTON HERITAGE ACADEMY
* * * * * * * * *
BRIGHTON 27J BRIGHTON HIGH SCHOOL 125 59 47.2% 80/50.0% 88/53.3% * 38 42 27
BRUSH RE-2(J) BRUSH HIGH SCHOOL 34 10 29.4% 8/27.6% 20/50% 25/52.1% 8 7 3
BUENA VISTA R-31 BUENA VISTA HIGH SCHOOL
44 15 34.1% * 3/12.0% 6/21.4% 15 6 4
BUENA VISTA R-31 CHAFFEE COUNTY HIGH SCHOOL
* * * * * * * * *
BUFFALO RE-4 MERINO JUNIOR SENIOR HIGH SCHO
* * * * * * * * *
BURLINGTON RE-6J BURLINGTON HIGH * * * * * * * * *

30
Table 13: Colorado Public High School Graduates Assigned to Remediation in Colorado Public Higher Education FY 2010 (Fall Enrollment)
School District High School Number of 1st Time Students
Assigned to Remediation in at least one subject Number of students assigned to Remediation by Subject
Math Writing Reading
# # 2010
% 2010
2009 2008 2007 # # #
SCHOOL
BYERS 32J BYERS JUNIOR-SENIOR HIGH SCHOO
* * * * * * * * *
CALHAN RJ-1 CALHAN HIGH SCHOOL * * * * * * * * *
CAMPO RE-6 CAMPO UNDIVIDED HIGH SCHOOL
* * * * * * * * *
CANON CITY RE-1 CANON CITY HIGH SCHOOL 89 30 33.7% 35/34.0% 54/43.9% 36/31.6% 25 21 11
CANON CITY RE-1 GARDEN PARK HIGH SCHOOL
* * * * * * * * *
CENTENNIAL BOCES WELD OPPORTUNITY HIGH SCHOOL
* * * * * * * * *
CENTENNIAL R-1 CENTENNIAL HIGH SCHOOL
* * * * * * * * *
CENTER 26 JT CENTER HIGH SCHOOL * * * * * * * * *
CHERAW 31 CHERAW HIGH SCHOOL * * * * * * * * *
CHERRY CREEK 5 CHERRY CREEK HIGH SCHOOL
405 52 12.8% 52/12.3% 61/14.4% 67/15.1% 40 27 13
CHERRY CREEK 5 EAGLECREST HIGH SCHOOL 265 92 34.7% 99/37.4% 74/31.6% 126/42.7% 70 51 32
CHERRY CREEK 5 GRANDVIEW HIGH SCHOOL
344 86 25.0% 100/28.1% 66/19.1% 81/26.0% 59 40 35
CHERRY CREEK 5 OVERLAND HIGH SCHOOL 189 89 47.1% 100/47.6% 89/48.6% 100/47.4% 57 62 55
CHERRY CREEK 5 P.R.E.P. (ALTERNATIVE) HIGH SC
* * * * * * * * *
CHERRY CREEK 5 SMOKY HILL HIGH SCHOOL 246 70 28.5% 111/35.8% 75/29.5% 110/31.5% 54 38 30
CHEYENNE COUNTY RE-5
CHEYENNE WELLS HIGH SCHOOL
* * * * * * * * *
CHEYENNE MOUNTAIN 12
CHEYENNE MOUNTAIN HIGH SCHOOL
193 28 14.5% 23/14.2% 31/18.0% 15/11.0% 14 17 16

31
Table 13: Colorado Public High School Graduates Assigned to Remediation in Colorado Public Higher Education FY 2010 (Fall Enrollment)
School District High School Number of 1st Time Students
Assigned to Remediation in at least one subject Number of students assigned to Remediation by Subject
Math Writing Reading
# # 2010
% 2010
2009 2008 2007 # # #
CLEAR CREEK RE-1 CLEAR CREEK HIGH SCHOOL
33 10 30.3% 8/21.1% 10/33.3% 13/36.1% 10 1 1
Colorado School for the Deaf
COLORADO SCHOOL FOR THE DEAF
* * * * * * * * *
COLORADO SPRINGS 11
CIVA CHARTER SCHOOL * * * * * * * * *
COLORADO SPRINGS 11
COMMUNITY PREP CHARTER SCHOOL
* * * * * * * * *
COLORADO SPRINGS 11
CORONADO HIGH SCHOOL 158 36 22.8% 45/29.4% 55/30.1% 23/18.1% 23 20 13
COLORADO SPRINGS 11
DOHERTY HIGH SCHOOL 225 61 27.1% 79/35.3% 69/35.8% 24/17.1% 43 27 21
COLORADO SPRINGS 11
DOHERTY NIGHT SCHOOL * * * * * * * * *
COLORADO SPRINGS 11
MITCHELL HIGH SCHOOL 78 33 42.3% 26/28.0% 47/48.5% 20/29.4% 18 26 16
COLORADO SPRINGS 11
NIKOLA TESLA EDUCATION OPPORTU
* * * * * * * * *
COLORADO SPRINGS 11
PALMER HIGH SCHOOL 204 46 22.5% 48/24.2% 36/21.8% 17/11.2% 29 27 12
COLORADO SPRINGS 11
WASSON HIGH SCHOOL 89 38 42.7% 50/51.5% 65/52.0% 15/23.8% 27 21 17
COTOPAXI RE-3 COTOPAXI JUNIOR-SENIOR HIGH SCHOOL
* * * * * * * * *
CREEDE CONSOLIDATED 1
CREEDE JUNIOR-SENIOR HIGH SCHOOL
* * * * * * * * *
CRIPPLE CREEK-VICTOR RE-1
CRIPPLE CREEK-VICTOR JUNIOR-SENIOR
* * * * * * * * *

32
Table 13: Colorado Public High School Graduates Assigned to Remediation in Colorado Public Higher Education FY 2010 (Fall Enrollment)
School District High School Number of 1st Time Students
Assigned to Remediation in at least one subject Number of students assigned to Remediation by Subject
Math Writing Reading
# # 2010
% 2010
2009 2008 2007 # # #
CROWLEY COUNTY RE-1-J
CROWLEY COUNTY HIGH SCHOOL
* * * * * * * * *
CUSTER COUNTY SCHOOL DISTRICT
CUSTER COUNTY HIGH SCHOOL
* * * * * * * * *
DE BEQUE 49JT DE BEQUE UNDIVIDED HIGH SCHOOL
* * * * * * * * *
DEER TRAIL 26J DEER TRAIL JUNIOR-SENIOR HIGH
* * * * * * * * *
DEL NORTE C-7 DEL NORTE HIGH SCHOOL * * * * 16/51.6% 18/54.5% * * *
DELTA COUNTY 50(J)
CEDAREDGE HIGH SCHOOL 30 11 36.7% * 17/54.8% 14/42.4% 10 7 4
DELTA COUNTY 50(J)
DELTA HIGH SCHOOL 47 19 40.4% 20/51.3% 14/35.0% 18/40.9% 16 11 5
DELTA COUNTY 50(J)
HOTCHKISS HIGH SCHOOL 29 10 34.5% 11/42.3% 4/15.4% * 9 4 4
DELTA COUNTY 50(J)
PAONIA HIGH SCHOOL * * * 10/38.5% * * * * *
DELTA COUNTY 50(J)
VISION SCHOOL * * * * * * * * *
DENVER COUNTY 1 ABRAHAM LINCOLN HIGH SCHOOL
70 55 78.6% 42/68.9% 43/78.2% 26/60.5% 47 38 36
DENVER COUNTY 1 CHALLENGES, CHOICES & IMAGES
* * * * * * * * *
DENVER COUNTY 1 COLORADO HIGH SCHOOL * * * * * * * * *
DENVER COUNTY 1 CONTEMPORARY LEARNING ACADEMY
* * * * * * * * *
DENVER COUNTY 1 DENVER SCHOOL OF THE ARTS
42 8 19.0% 11/25.6% 11/33.3% 16/50.0% 7 3 2

33
Table 13: Colorado Public High School Graduates Assigned to Remediation in Colorado Public Higher Education FY 2010 (Fall Enrollment)
School District High School Number of 1st Time Students
Assigned to Remediation in at least one subject Number of students assigned to Remediation by Subject
Math Writing Reading
# # 2010
% 2010
2009 2008 2007 # # #
DENVER COUNTY 1 EAST HIGH SCHOOL 205 79 38.5% 82/43.4% 52/33.3% 60/43.5% 73 50 39
DENVER COUNTY 1 EMILY GRIFFITH OPPORTUNITY SCHOOL
* * * * * * * * *
DENVER COUNTY 1 FLORENCE CRITTENTON HIGH SCHOOL
* * * * * * * * *
DENVER COUNTY 1 FRED N THOMAS CAREER EDUCATION
* * * * * * * * *
DENVER COUNTY 1 GEORGE WASHINGTON HIGH SCHOOL
140 84 60.0% 68/54.8% 75/56.0% 69/54.3% 72 64 51
DENVER COUNTY 1 JOHN F KENNEDY HIGH SCHOOL
118 74 62.7% 64/62.7% 60/60% 65/57.5% 67 41 21
DENVER COUNTY 1 LIFE SKILLS CENTER OF DENVER
* * * * * * * * *
DENVER COUNTY 1 MONTBELLO HIGH SCHOOL
85 61 71.8% 66/72.5% 53/79.1% 45/70.3% 55 45 38
DENVER COUNTY 1 NORTH HIGH SCHOOL 61 44 72.1% 39/75.0% 41/65.1% 46/71.9% 42 30 23
DENVER COUNTY 1 P.S.1 CHARTER SCHOOL * * * * * * * * *
DENVER COUNTY 1 SOUTH HIGH SCHOOL 96 66 68.8% 63/61.8% 70/63.6% 50/55.6% 60 46 33
DENVER COUNTY 1 THOMAS JEFFERSON HIGH SCHOOL
124 71 57.3% 50/46.7% 42/42.9% 49/46.2% 62 35 37
DENVER COUNTY 1 WEST HIGH SCHOOL 43 39 90.7% 46/86.8% 42/80.8% 51/76.1% 37 30 30
DOLORES COUNTY RE NO.2
DOLORES COUNTY HIGH SCHOOL
* * * * * * * * *
DOLORES RE-4A DOLORES HIGH SCHOOL * * * * * * * * *
DOUGLAS COUNTY RE 1
CHAPARRAL HIGH SCHOOL 275 61 22.2% 58/23.0% 51/20.9% 60/27.9% 47 32 23
DOUGLAS COUNTY RE 1
DANIEL C OAKES HIGH SCHOOL--CA
* * * * * * * * *

34
Table 13: Colorado Public High School Graduates Assigned to Remediation in Colorado Public Higher Education FY 2010 (Fall Enrollment)
School District High School Number of 1st Time Students
Assigned to Remediation in at least one subject Number of students assigned to Remediation by Subject
Math Writing Reading
# # 2010
% 2010
2009 2008 2007 # # #
DOUGLAS COUNTY RE 1
DOUGLAS COUNTY HIGH SCHOOL
240 46 19.2% 72/23.4% 69/23.0% 86/26.1% 33 30 19
DOUGLAS COUNTY RE 1
EAGLE ACADEMY * * * * * * * * *
DOUGLAS COUNTY RE 1
HIGHLANDS RANCH HIGH SCHOOL
232 42 18.1% 42/21.2% 43/20.7% 47/21.7% 33 23 15
DOUGLAS COUNTY RE 1
MOUNTAIN VISTA HIGH SCHOOL
146 37 25.3% 33/14.8% 60/25.2% 58/27.6% 32 15 7
DOUGLAS COUNTY RE 1
PONDEROSA HIGH SCHOOL
260 51 19.6% 44/18.3% 53/23.8% * 41 22 17
DOUGLAS COUNTY RE 1
THUNDERRIDGE HIGH SCHOOL
214 43 20.1% 36/20.5% 49/25.0% 49/28.3% 28 27 18
DURANGO 9-R DURANGO HIGH SCHOOL 141 40 28.4% 37/29.1% 29/21.5% 36/26.9% 30 13 8
DURANGO 9-R THE EXCEL CHARTER SCHOOL
* * * * * * * * *
EADS RE-1 EADS HIGH SCHOOL * * * * * * * * *
EAGLE COUNTY RE 50
BATTLE MOUNTAIN HIGH SCHOOL
67 22 32.8% 13/19.7% 13/21.7% 19/34.5% 19 9 6
EAGLE COUNTY RE 50
EAGLE VALLEY HIGH SCHOOL
61 25 41.0% 23/32.9% 18/40.9% 15/28.8% 16 15 10
EAGLE COUNTY RE 50
RED CANYON HIGH SCHOOL
* * * * * * * * *
EAST GRAND 2 MIDDLE PARK HIGH SCHOOL
50 10 20.0% * 7/14.9% 8/19.0% 7 5 1
EAST OTERO R-1 LA JUNTA HIGH SCHOOL 52 13 25.0% 6/15.8% * 34/39.1% 12 11 8
EATON RE-2 EATON HIGH SCHOOL 52 16 30.8% 13/28.9% 21/40.4% 18/37.5% 12 7 8
EDISON 54 JT EDISON JUNIOR-SENIOR HIGH SCHOOL
* * * * * * * * *

35
Table 13: Colorado Public High School Graduates Assigned to Remediation in Colorado Public Higher Education FY 2010 (Fall Enrollment)
School District High School Number of 1st Time Students
Assigned to Remediation in at least one subject Number of students assigned to Remediation by Subject
Math Writing Reading
# # 2010
% 2010
2009 2008 2007 # # #
ELBERT 200 ELBERT JUNIOR-SENIOR HIGH SCHOOL
* * * * * * * * *
ELIZABETH C-1 ELIZABETH HIGH SCHOOL 105 39 37.1% 33/38.4% 29/27.9% 41/44.6% 33 19 10
ELLICOTT 22 ELLICOTT SENIOR HIGH SCHOOL
* * * * * * * * *
ENGLEWOOD 1 COLORADO'S FINEST ALTERNATIVE
* * * * * * * * *
ENGLEWOOD 1 ENGLEWOOD HIGH SCHOOL
69 29 42.0% 26/41.9% 31/41.3% 40/53.3% 25 19 14
EXPEDITIONARY BOCES
EXPEDITIONARY LEARNING SCHOOL
* * * * * * * * *
FALCON 49 FALCON HIGH SCHOOL 118 35 29.7% 36/39.1% 27/32.5% 12/23.1% 29 19 11
FALCON 49 SAND CREEK HIGH SCHOOL 204 68 33.3% 64/38.8% 51/30.0% 23/28.4% 47 45 26
FLORENCE RE-2 FLORENCE HIGH SCHOOL 44 24 54.5% 16/40.0% 22/62.9% 18/47.4% 18 18 11
FORT MORGAN RE-3 FORT MORGAN HIGH SCHOOL
43 17 39.5% 26/45.6% 23/42.6% 21/36.8% 16 10 9
FORT MORGAN RE-3 LINCOLN HIGH SCHOOL * * * * * * * * *
FOUNTAIN 8 FOUNTAIN-FORT CARSON HIGH SCHOOL
149 56 37.6% 52/44.8% 39/40.6% 21/42.0% 44 30 21
FOUNTAIN 8 LORRAINE ALTERNATIVE HIGH SCHOOL
* * * * * * * * *
FOWLER R-4J FOWLER HIGH SCHOOL * * * * * * * * *
FRENCHMAN RE-3 FLEMING HIGH SCHOOL * * * * * * * * *
GARFIELD 16 GRAND VALLEY HIGH SCHOOL
* * * * * * * * *
GARFIELD RE-2 RIFLE HIGH SCHOOL 42 22 52.4% 27/37.0% 26/40.6% 31/39.7% 21 9 7
GENOA-HUGO C113 GENOA-HUGO SENIOR * * * * * * * * *
GILPIN COUNTY RE- GILPIN COUNTY * * * * * * * * *

36
Table 13: Colorado Public High School Graduates Assigned to Remediation in Colorado Public Higher Education FY 2010 (Fall Enrollment)
School District High School Number of 1st Time Students
Assigned to Remediation in at least one subject Number of students assigned to Remediation by Subject
Math Writing Reading
# # 2010
% 2010
2009 2008 2007 # # #
1
GRANADA RE-1 GRANADA UNDIVIDED HIGH SCHOOL
* * * * * * * * *
GREELEY 6 COLORADO HIGH SCHOOL OF GREELE
* * * * * * * * *
GREELEY 6 FRONTIER CHARTER ACADEMY
* * * * * * * * *
GREELEY 6 GREELEY CENTRAL HIGH SCHOOL
81 37 45.7% 55/42.0% 41/46.1% 60/51.3% 29 24 22
GREELEY 6 GREELEY WEST HIGH SCHOOL
127 52 40.9% 37/32.5% 38/33.9% 52/40.3% 39 37 33
GREELEY 6 NORTHRIDGE HIGH SCHOOL
99 46 46.5% 43/51.2% 54/51.9% 44/44.4% 30 37 28
GREELEY 6 TRADEMARK LEARNING CENTER
* * * * * * * * *
GREELEY 6 UNION COLONY PREPATORY SCHOOL
* * * * * * * * *
GREELEY 6 UNIVERSITY SCHOOLS 57 25 43.9% 17/37.0% 11/27.5% 16/32.7% 16 21 15
GUNNISON WATERSHED RE1J
CRESTED BUTTE COMMUNITY SCHOOL
* * * * * * * * *
GUNNISON WATERSHED RE1J
GUNNISON HIGH SCHOOL 46 12 26.1% 7/21.2% 23/45.1% 10/26.3% 10 8 3
GUNNISON WATERSHED RE1J
GUNNISON VALLEY SCHOOL
* * * * * * * * *
HANOVER 28 HANOVER JUNIOR-SENIOR HIGH SCHOOL
* * * * * * * * *
HARRISON 2 HARRISON HIGH SCHOOL 54 30 55.6% 40/52.6% 30/56.6% 13/37.1% 24 16 10
HARRISON 2 JAMES IRWIN CHARTER * * * 7/20.0% * * * * *

37
Table 13: Colorado Public High School Graduates Assigned to Remediation in Colorado Public Higher Education FY 2010 (Fall Enrollment)
School District High School Number of 1st Time Students
Assigned to Remediation in at least one subject Number of students assigned to Remediation by Subject
Math Writing Reading
# # 2010
% 2010
2009 2008 2007 # # #
HIGH SCHOOL
HARRISON 2 NEW HORIZONS DAY SCHOOL
* * * * * * * * *
HARRISON 2 SIERRA HIGH SCHOOL 81 47 58.0% 41/49.4% 43/53.1% 19/34.5% 38 30 18
HAXTUN RE-2J HAXTUN HIGH SCHOOL * * * * * * * * *
HAYDEN RE-1 HAYDEN HIGH SCHOOL * * * * * * * * *
HI-PLAINS R-23 HI PLAINS UNDIVIDED HIGH SCHOOL
* * * * * * * * *
HOEHNE REORGANIZED 3
HOEHNE HIGH SCHOOL * * * * * * * * *
HOLLY RE-3 HOLLY JUNIOR-SENIOR HIGH SCHOOL
* * * * * * * * *
HOLYOKE RE-1J HOLYOKE JUNIOR-SENIOR HIGH SCHOOL
* * * * * * * * *
HUERFANO RE-1 JOHN MALL HIGH SCHOOL * * * * 8/21.6% 7/28.0% * * *
IDALIA RJ-3 IDALIA JUNIOR-SENIOR HIGH SCHOOL
* * * * * * * * *
IGNACIO 11 JT IGNACIO HIGH SCHOOL * * * * * * * * *
JEFFERSON COUNTY R-1
ALAMEDA HIGH SCHOOL 66 33 50.0% 29/53.7% 37/55.2% 50/50.0% 25 21 13
JEFFERSON COUNTY R-1
ARVADA HIGH SCHOOL 106 60 56.6% 58/45.3% 70/52.2% 67/43.5% 53 39 22
JEFFERSON COUNTY R-1
ARVADA WEST HIGH SCHOOL
217 71 32.7% 50/27.5% 53/27.9% 67/31.9% 62 33 15
JEFFERSON COUNTY R-1
BEAR CREEK HIGH SCHOOL 216 48 22.2% 62/29.0% 66/30.4% 74/30.5% 33 22 20
JEFFERSON COUNTY R-1
CHATFIELD HIGH SCHOOL 295 71 24.1% 47/17.9% 64/22.3% 77/24.8% 50 35 26

38
Table 13: Colorado Public High School Graduates Assigned to Remediation in Colorado Public Higher Education FY 2010 (Fall Enrollment)
School District High School Number of 1st Time Students
Assigned to Remediation in at least one subject Number of students assigned to Remediation by Subject
Math Writing Reading
# # 2010
% 2010
2009 2008 2007 # # #
JEFFERSON COUNTY R-1
COLLEGIATE CHARTER ACADEMY
* * * * * * * * *
JEFFERSON COUNTY R-1
COLUMBINE HIGH SCHOOL 259 71 27.4% 47/24.1% 52/24.4% 76/29.9% 54 32 23
JEFFERSON COUNTY R-1
COMPASS SECONDARY MONTESSORI C
* * * * * * * * *
JEFFERSON COUNTY R-1
CONIFER SENIOR HIGH SCHOOL
116 17 14.7% 31/19.0% 33/23.6% 35/28.9% 13 9 5
JEFFERSON COUNTY R-1
DAKOTA RIDGE SENIOR HIGH SCHOOL
213 44 20.7% 55/24.9% 49/23.7% 77/31.7% 35 24 15
JEFFERSON COUNTY R-1
D'EVELYN SENIOR HIGH SCHOOL
94 0 0.0% 2/2.7% 5/5.6% 2/3.2% 0 0 0
JEFFERSON COUNTY R-1
EVERGREEN HIGH SCHOOL 151 22 14.6% 27/21.3% 36/26.3% 24/19.2% 21 5 3
JEFFERSON COUNTY R-1
GOLDEN HIGH SCHOOL 150 38 25.3% 42/26.6% 39/23.8% 72/41.4% 32 22 10
JEFFERSON COUNTY R-1
GREEN MOUNTAIN HIGH SCHOOL
198 40 20.2% 43/21.5% 53/27.3% 60/27.1% 28 22 15
JEFFERSON COUNTY R-1
JEFFERSON CHARTER ACADEMY SENIOR
29 9 31.0% 11/39.3% * 11/25.6% 6 5 3
JEFFERSON COUNTY R-1
JEFFERSON COUNTY OPEN HIGH SCHOOL
* * * * * * * * *
JEFFERSON COUNTY R-1
JEFFERSON HIGH SCHOOL 37 23 62.2% * * 18/60.0% 21 15 16
JEFFERSON COUNTY R-1
LAKEWOOD HIGH SCHOOL 211 41 19.4% 58/29.6% 57/30.0% 47/23.0% 33 25 16
JEFFERSON COUNTY R-1
LONGVIEW HIGH SCHOOL * * * * * * * * *

39
Table 13: Colorado Public High School Graduates Assigned to Remediation in Colorado Public Higher Education FY 2010 (Fall Enrollment)
School District High School Number of 1st Time Students
Assigned to Remediation in at least one subject Number of students assigned to Remediation by Subject
Math Writing Reading
# # 2010
% 2010
2009 2008 2007 # # #
JEFFERSON COUNTY R-1
MC LAIN HIGH SCHOOL 44 24 54.5% * * 14/50.0% 22 15 7
JEFFERSON COUNTY R-1
POMONA HIGH SCHOOL 207 60 29.0% 61/33.7% 74/33.5% 69/30.5% 41 44 30
JEFFERSON COUNTY R-1
RALSTON VALLEY SENIOR HIGH SCH
241 49 20.3% 43/19.6% 45/22.5% 50/26.0% 36 24 17
JEFFERSON COUNTY R-1
STANDLEY LAKE HIGH SCHOOL
225 71 31.6% 46/25.7% 52/26.8% 59/27.1% 60 37 33
JEFFERSON COUNTY R-1
WHEAT RIDGE HIGH SCHOOL
139 36 25.9% 62/34.1% 59/36.2% 71/37.0% 36 23 15
JOHNSTOWN-MILLIKEN RE-5J
ROOSEVELT HIGH SCHOOL 42 18 42.9% 19/50.0% 16/53.3% 20/52.6% 8 12 7
JULESBURG RE-1 JULESBURG HIGH SCHOOL * * * * * * * * *
KARVAL RE-23 KARVAL JUNIOR-SENIOR HIGH SCHOOL
* * * * * * * * *
KEENESBURG RE-3(J)
WELD CENTRAL SENIOR HIGH SCHOOL
41 20 48.8% 11/32.4% 23/43.4% 24/57.1% 15 13 8
KIM REORGANIZED 88
KIM UNDIVIDED HIGH SCHOOL
* * * * * * * * *
KIOWA C-2 KIOWA HIGH SCHOOL * * * * * * * * *
KIT CARSON R-1 KIT CARSON JUNIOR-SENIOR HIGH
* * * * * * * * *
LA VETA RE-2 LA VETA JUNIOR-SENIOR HIGH SCHOOL
* * * * * * * * *
LAKE COUNTY R-1 LAKE COUNTY HIGH SCHOOL
* * * * * * * * *
LAMAR RE-2 LAMAR HIGH SCHOOL 32 11 34.4% 12/27.3% 23/43.3% 29/45.3% 11 9 5
LAS ANIMAS RE-1 LAS ANIMAS HIGH SCHOOL * * * * * * * * *

40
Table 13: Colorado Public High School Graduates Assigned to Remediation in Colorado Public Higher Education FY 2010 (Fall Enrollment)
School District High School Number of 1st Time Students
Assigned to Remediation in at least one subject Number of students assigned to Remediation by Subject
Math Writing Reading
# # 2010
% 2010
2009 2008 2007 # # #
LEWIS-PALMER 38 LEWIS-PALMER HIGH SCHOOL
246 27 11.0% 35/15.5% 40/16.9% 32/16.1% 16 15 11
LIBERTY J-4 LIBERTY JUNIOR-SENIOR HIGH SCHOOL
* * * * * * * * *
LIMON RE-4J LIMON JUNIOR-SENIOR HIGH SCHOOL
* * * * * 6/24.0% * * *
LITTLETON 6 ARAPAHOE HIGH SCHOOL 252 42 16.7% 53/18.0% 48/18.8% 51/20.6% 35 19 16
LITTLETON 6 HERITAGE HIGH SCHOOL 152 29 19.1% 45/20.5% 47/20.3% 62/28.2% 24 19 13
LITTLETON 6 LITTLETON HIGH SCHOOL 173 50 28.9% 45/29.0% 45/25.0% 51/27.3% 47 23 19
LONE STAR 101 LONE STAR UNDIVIDED HIGH SCHOOL
* * * * * * * * *
MANCOS RE-6 MANCOS HIGH SCHOOL * * * * * * * * *
MANITOU SPRINGS 14
MANITOU SPRINGS HIGH SCHOOL
59 9 15.3% 16/32.0% 11/18.3% 11/22.4% 6 7 2
MANZANOLA 3J MANZANOLA JUNIOR-SENIOR HIGH SCHOOL
* * * * * * * * *
MAPLETON 1 SKYVIEW HIGH SCHOOL * * * 17/50.0% 29/53.7% 35/52.2 * * *
MC CLAVE RE-2 MC CLAVE UNDIVIDED HIGH SCHOOL
* * * * * * * * *
MEEKER RE1 MEEKER HIGH SCHOOL * * * * * * * * *
MESA COUNTY VALLEY 51
CENTRAL HIGH SCHOOL 144 60 41.7% 60/39.7% 71/50.0% 64/45.1% 44 34 26
MESA COUNTY VALLEY 51
DEEP RIVER SCHOOL * * * * * * * * *
MESA COUNTY VALLEY 51
FRUITA MONUMENT HIGH SCHOOL
202 64 31.7% 68/32.4% 62/34.6% 68/35.4% 45 45 27
MESA COUNTY VALLEY 51
GATEWAY SCHOOL * * * * * * * * *

41
Table 13: Colorado Public High School Graduates Assigned to Remediation in Colorado Public Higher Education FY 2010 (Fall Enrollment)
School District High School Number of 1st Time Students
Assigned to Remediation in at least one subject Number of students assigned to Remediation by Subject
Math Writing Reading
# # 2010
% 2010
2009 2008 2007 # # #
MESA COUNTY VALLEY 51
GRAND JUNCTION HIGH SCHOOL
163 52 31.9% 57/39.0% 53/36.8% 53/37.3 42 31 22
MESA COUNTY VALLEY 51
PALISADE HIGH SCHOOL 85 30 35.3% 35/57.4% 29/42.6% 38/64.4% 23 17 11
MESA COUNTY VALLEY 51
R-5 HIGH SCHOOL * * * * * * * * *
MIAMI/YODER 60 JT MIAMI/YODER JUNIOR-SENIOR HIGH
* * * * * * * * *
MOFFAT 2 CRESTONE CHARTER SCHOOL
* * * * * * * * *
MOFFAT 2 MOFFAT SENIOR HIGH SCHOOL
* * * * * * * * *
MOFFAT COUNTY RE:NO 1
MOFFAT COUNTY HIGH SCHOOL
51 19 37.3% 34.5% 13/30.2% 17/34.0% 14 13 3
MONTE VISTA C-8 BYRON SYRING DELTA CENTER
* * * * * * * * *
MONTE VISTA C-8 MONTE VISTA ON-LINE ACADEMY
* * * * * * * * *
MONTE VISTA C-8 MONTE VISTA SENIOR HIGH SCHOOL
* * * 16/51.6% 23/62.2% 15/46.9% * * *
MONTEZUMA-CORTEZ RE-1
MONTEZUMA-CORTEZ HIGH SCHOOL
51 26 51.0% 24/50.0% 27/43.5% 24/41.4% 19 15 9
MONTEZUMA-CORTEZ RE-1
SOUTHWEST OPEN CHARTER SCHOOL
* * * * * * * * *
MONTROSE COUNTY RE-1J
MONTROSE HIGH SCHOOL 121 39 32.2% 27/27.6% 24/23.8% 41/40.2% 32 20 13
MONTROSE COUNTY RE-1J
OLATHE HIGH SCHOOL 26 8 30.8% 17/48.6% * * 8 4 4

42
Table 13: Colorado Public High School Graduates Assigned to Remediation in Colorado Public Higher Education FY 2010 (Fall Enrollment)
School District High School Number of 1st Time Students
Assigned to Remediation in at least one subject Number of students assigned to Remediation by Subject
Math Writing Reading
# # 2010
% 2010
2009 2008 2007 # # #
MONTROSE COUNTY RE-1J
VISTA ADULT HIGH SCHOOL
* * * * * * * * *
MOUNTAIN BOCES YAMPAH MOUNTAIN SCHOOL
* * * * * * * * *
MOUNTAIN VALLEY RE 1
MOUNTAIN VALLEY SENIOR HIGH SCHOOL
* * * * * * * * *
NORTH CONEJOS RE-1J
CENTAURI HIGH SCHOOL * * * 15/46.9% 21/58.3% 19/52.8% * * *
NORTH CONEJOS RE-1J
LA JARA SECOND CHANCE SCHOOL
* * * * * * * * *
NORTH PARK R-1 NORTH PARK JUNIOR-SENIOR HIGH
* * * * * * * * *
NORTHGLENN-THORNTON 12
ACADEMY OF CHARTER SCHOOLS
* * * 13/41.9% 13/50.0% * * * *
NORTHGLENN-THORNTON 12
HORIZON HIGH SCHOOL 225 87 38.7% 108/38.4% 89/37.1% 78/37.1% 66 54 31
NORTHGLENN-THORNTON 12
LEGACY HIGH SCHOOL 251 59 23.5% 86/33.5% 95/35.1% 82/36.6% 48 30 16
NORTHGLENN-THORNTON 12
NORTHGLENN HIGH SCHOOL
192 75 39.1% 87/41.4% 76/41.5% 111/47.2% 60 57 39
NORTHGLENN-THORNTON 12
PINNACLE CHARTER SCHOOL
152 16 10.5% * * * 11 11 8
NORTHGLENN-THORNTON 12
THORNTON HIGH SCHOOL 143 62 43.4% 67/41.4% 74/48.1% 73/41.5% 56 38 32
NORTHGLENN-THORNTON 12
VANTAGE POINT * * * * * * * * *
NORWOOD R-2J NORWOOD HIGH SCHOOL * * * * * * * * *
OTIS R-3 OTIS JUNIOR-SENIOR HIGH * * * * * * * * *

43
Table 13: Colorado Public High School Graduates Assigned to Remediation in Colorado Public Higher Education FY 2010 (Fall Enrollment)
School District High School Number of 1st Time Students
Assigned to Remediation in at least one subject Number of students assigned to Remediation by Subject
Math Writing Reading
# # 2010
% 2010
2009 2008 2007 # # #
SCHOOL
OURAY R-1 OURAY SENIOR HIGH SCHOOL
* * * * * * * * *
PARK (ESTES PARK) R-3
ESTES PARK HIGH SCHOOL 52 8 15.4% 10/20.4% 11/26.8% 9/26.5% 8 2 2
PARK COUNTY RE-2 SOUTH PARK HIGH SCHOOL
* * * * * * * * *
PAWNEE RE-12 PAWNEE JUNIOR-SENIOR HIGH SCHO
* * * * * * * * *
PEYTON 23 JT PEYTON HIGH SCHOOL 34 16 47.1% 12/38.7% 17/53.1% * 13 10 6
PLAINVIEW RE-2 PLAINVIEW JUNIOR-SENIOR HIGH SCHOOL
* * * * * * * * *
PLATEAU RE-5 PEETZ JUNIOR-SENIOR HIGH SCHOOL
* * * * * * * * *
PLATEAU VALLEY 50 GRAND MESA HIGH SCHOOL
* * * * * * * * *
PLATEAU VALLEY 50 PLATEAU VALLEY HIGH SCHOOL
* * * * * * * * *
PLATTE CANYON 1 PLATTE CANYON HIGH SCHOOL
60 15 25.0% 17/34.7% 12/25.5% 10/20.0% 14 4 4
PLATTE VALLEY RE-3 REVERE JUNIOR-SENIOR HIGH SCHOOL
* * * * * * * * *
PLATTE VALLEY RE-7 PLATTE VALLEY HIGH SCHOOL
46 24 52.2% 13/46.4% 11/40.7% 16/47.1% 15 22 15
POUDRE R-1 CENTENNIAL HIGH SCHOOL
* * * * * * * * *
POUDRE R-1 FORT COLLINS HIGH SCHOOL
177 45 25.4% 59/25.8% 51/22.9% 57/23.0% 31 22 19

44
Table 13: Colorado Public High School Graduates Assigned to Remediation in Colorado Public Higher Education FY 2010 (Fall Enrollment)
School District High School Number of 1st Time Students
Assigned to Remediation in at least one subject Number of students assigned to Remediation by Subject
Math Writing Reading
# # 2010
% 2010
2009 2008 2007 # # #
POUDRE R-1 FRONTIER HIGH SCHOOL * * * * * * * * *
POUDRE R-1 POUDRE HIGH SCHOOL 229 56 24.5% 53/25.5% 45/24.1% 70/27.0% 45 27 18
POUDRE R-1 RIDGEVIEW CLASSICAL CHARTER SCHOOL
* * * * * * * * *
POUDRE R-1 ROCKY MOUNTAIN HIGH SCHOOL
296 74 25.0% 56/19.4% 54/20.8% 76/24.8% 54 40 21
PRAIRIE RE-11 PRAIRIE JUNIOR-SENIOR HIGH SCHOOL
* * * * * * * * *
PRIMERO REORGANIZED 2
PRIMERO JUNIOR-SENIOR HIGH SCHOOL
* * * * * * * * *
PRITCHETT RE-3 PRITCHETT HIGH SCHOOL * * * * * * * * *
PUEBLO CITY 60 CENTENNIAL HIGH SCHOOL
109 46 42.2% 45/42.9% 52/45.2% 55/35.9% 35 26 26
PUEBLO CITY 60 CENTRAL HIGH SCHOOL 91 59 64.8% 47/61.0% 49/62.8% 40/47.6% 46 31 26
PUEBLO CITY 60 EAST HIGH SCHOOL 100 58 58.0% * 46/56.1% 36/47.4% 41 30 21
PUEBLO CITY 60 KEATING CONTINUING EDUCATION
* * * * * * * * *
PUEBLO CITY 60 SOUTH HIGH SCHOOL 154 69 44.8% 69/46.9% 63/42.6% 69/39.4% 57 37 30
PUEBLO CITY 60 YOUTH & FAMILY ACADEMY CHARTER
* * * * * * * * *
PUEBLO COUNTY RURAL 70
PUEBLO COUNTY HIGH SCHOOL
108 52 48.1% 55/53.4% 32/36.8% 31/39.7% 48 25 14
PUEBLO COUNTY RURAL 70
PUEBLO TECHNICAL ACADEMY
* * * * * * * * *
PUEBLO COUNTY RURAL 70
PUEBLO WEST HIGH SCHOOL
161 63 39.1% 57/38.3% 56/44.4% 39/33.6% 47 36 23
PUEBLO COUNTY RURAL 70
RYE HIGH SCHOOL * * * 8/30.8% * 7/22.6% * * *

45
Table 13: Colorado Public High School Graduates Assigned to Remediation in Colorado Public Higher Education FY 2010 (Fall Enrollment)
School District High School Number of 1st Time Students
Assigned to Remediation in at least one subject Number of students assigned to Remediation by Subject
Math Writing Reading
# # 2010
% 2010
2009 2008 2007 # # #
RANGELY RE-4 RANGELY HIGH SCHOOL * * * * * 13/31.7% * * *
RIDGWAY R-2 RIDGWAY HIGH SCHOOL * * * * * * * * *
ROARING FORK RE-1 BASALT HIGH SCHOOL 55 18 32.7% 9/19.6% 9/24.3% * 13 9 11
ROARING FORK RE-1 BRIDGES * * * * * * * * *
ROARING FORK RE-1 GLENWOOD SPRINGS HIGH SCHOOL
67 20 29.9% 19/29.7% 13/16.9% 31/32.0% 19 8 6
ROARING FORK RE-1 ROARING FORK HIGH SCHOOL
42 7 16.7% 14/45.2% * 13/34.2% 5 2 3
ROCKY FORD R-2 ROCKY FORD HIGH SCHOOL
* * * 11/35.5% * 15/42.9% * * *
SALIDA R-32 SALIDA HIGH SCHOOL 31 7 22.6% 7/21.9% 16/45.7% 7/17.9% 5 4 2
SANFORD 6J SANFORD JUNIOR/SENIOR HIGH SCHOOL
* * * * * 9/60.0% * * *
SANGRE DE CRISTO RE-22J
SANGRE DE CRISTO UNDIVIDED HIGH
* * * * * * * * *
SARGENT RE-33J SARGENT JUNIOR-SENIOR HIGH SCHOOL
* * * * * * * * *
SHERIDAN 2 SHERIDAN HIGH SCHOOL * * * * 15/60.0% 25/83.3% * * *
SIERRA GRANDE R-30
SIERRA GRANDE SENIOR HIGH SCHOOL
* * * * * * * * *
SILVERTON 1 SILVERTON HIGH SCHOOL * * * * * * * * *
SOUTH CONEJOS RE-10
ANTONITO HIGH SCHOOL * * * * * * * * *
SOUTH ROUTT RE 3 SOROCO HIGH SCHOOL * * * * * * * * *
SPRINGFIELD RE-4 SPRINGFIELD HIGH SCHOOL
* * * * * * * * *
ST VRAIN VALLEY RE 1J
ADULT EDUCATION/LINCOLN
* * * * * * * * *

46
Table 13: Colorado Public High School Graduates Assigned to Remediation in Colorado Public Higher Education FY 2010 (Fall Enrollment)
School District High School Number of 1st Time Students
Assigned to Remediation in at least one subject Number of students assigned to Remediation by Subject
Math Writing Reading
# # 2010
% 2010
2009 2008 2007 # # #
CENTER
ST VRAIN VALLEY RE 1J
ERIE MIDDLE/SENIOR HIGH SCHOOL
82 35 42.7% 25/39.1% 12/27.9% 16/45.7% 31 18 17
ST VRAIN VALLEY RE 1J
FREDERICK SENIOR HIGH SCHOOL
62 26 41.9% 27/47.4% 23/50.0% 39/56.5% 20 14 13
ST VRAIN VALLEY RE 1J
LONGMONT HIGH SCHOOL 160 49 30.6% 59/32.4% 43/33.6% 54/38.3% 47 22 16
ST VRAIN VALLEY RE 1J
LYONS MIDDLE/SENIOR HIGH SCHOO
* * * 11/32.4% 5/18.5% 7/28.0% * * *
ST VRAIN VALLEY RE 1J
NIWOT HIGH SCHOOL 164 29 17.7% 30/20.3% 27/18.5% 31/21.7% 27 10 9
ST VRAIN VALLEY RE 1J
OLDE COLUMBINE HIGH SCHOOL
* * * * * * * * *
ST VRAIN VALLEY RE 1J
SILVER CREEK SCHOOL 101 28 27.7% 31/25.8% 37/34.6% 27/22.9% 21 12 7
ST VRAIN VALLEY RE 1J
SKYLINE HIGH SCHOOL 113 46 40.7% 46/44.2% 37/36.3% 55/46.2% 35 28 19
STEAMBOAT SPRINGS RE-2
STEAMBOAT SPRINGS HIGH SCHOOL
61 16 26.2% 22/26.2% 23/29.1% 15/20.5% 13 9 3
STRASBURG 31J STRASBURG HIGH SCHOOL 30 13 43.3% * * 25.9% 10 7 5
STRATTON R-4 STRATTON SENIOR HIGH SCHOOL
* * * * * * * * *
SUMMIT RE-1 SUMMIT HIGH SCHOOL 83 17 20.5% 12/14.1% 25/28.7% 17/22.7% 15 6 3
SWINK 33 SWINK JUNIOR-SENIOR HIGH SCHOOL
* * * * * 8/26.7% * * *
TELLURIDE R-1 TELLURIDE HIGH SCHOOL * * * * * * * * *
THOMPSON R-2J BERTHOUD HIGH SCHOOL 85 18 21.2% 22/26.2% 21/16.0% 24/24.2% 15 7 4
THOMPSON R-2J HAROLD FERGUSON HIGH * * * * * * * * *

47
Table 13: Colorado Public High School Graduates Assigned to Remediation in Colorado Public Higher Education FY 2010 (Fall Enrollment)
School District High School Number of 1st Time Students
Assigned to Remediation in at least one subject Number of students assigned to Remediation by Subject
Math Writing Reading
# # 2010
% 2010
2009 2008 2007 # # #
SCHOOL
THOMPSON R-2J LOVELAND HIGH SCHOOL 160 48 30.0% 38/27.1% 39/26.9% 36/23.7% 32 34 21
THOMPSON R-2J MOUNTAIN VIEW HIGH SCHOOL
109 44 40.4% 33/33.7% 38/32.2% 47/36.2% 35 25 19
THOMPSON R-2J THOMPSON VALLEY HIGH SCHOOL
153 48 31.4% 34/25.6% 50/27.0% 60/36.1% 37 25 21
TRINIDAD 1 TRINIDAD HIGH SCHOOL * * * 27/64.3% 25/46.3% 33/56.9% * * *
VALLEY RE-1 CALICHE JUNIOR-SENIOR HIGH SCHOOL
* * * * * * * * *
VALLEY RE-1 SMITH HIGH SCHOOL * * * * * * * * *
VALLEY RE-1 STERLING HIGH SCHOOL 62 12 19.4% 21/38.2% 22/37.9% 31/35.6% 12 9 4
VILAS RE-5 V.I.L.A.S. ONLINE SCHOOL * * * * * * * * *
VILAS RE-5 VILAS UNDIVIDED HIGH SCHOOL
* * * * * * * * *
WALSH RE-1 WALSH HIGH SCHOOL * * * * * * * * *
WELD COUNTY RE-1 VALLEY HIGH SCHOOL 40 24 60.0% 23/52.3% 27/48.2% 22/47.8% 15 22 18
WELD COUNTY S/D RE-8
FORT LUPTON HIGH SCHOOL
32 19 59.4% 28/50.9% 20/35.1% 29/58.0% 14 9 9
WELDON VALLEY RE-20(J)
WELDON VALLEY HIGH SCHOOL
* * * * * * * * *
WEST END RE-2 NUCLA HIGH SCHOOL * * * * * * * * *
WEST GRAND 1-JT. WEST GRAND HIGH SCHOOL
* * * * * * * * *
WESTMINSTER 50 IVER C. RANUM HIGH SCHOOL
81 37 45.7% 31/37.8% 36/48.6% 34/39.5% 31 19 15
WESTMINSTER 50 WESTMINSTER HIGH SCHOOL
70 36 51.4% 43/59.7% 30/49.2% 39/50.0% 29 29 23
WIDEFIELD 3 DISCOVERY HIGH SCHOOL * * * * * * * * *

48
Table 13: Colorado Public High School Graduates Assigned to Remediation in Colorado Public Higher Education FY 2010 (Fall Enrollment)
School District High School Number of 1st Time Students
Assigned to Remediation in at least one subject Number of students assigned to Remediation by Subject
Math Writing Reading
# # 2010
% 2010
2009 2008 2007 # # #
WIDEFIELD 3 MESA RIDGE HIGH SCHOOL 103 43 41.7% 49/40.8% 47/46.1% 23/37.7% 32 30 20
WIDEFIELD 3 WIDEFIELD HIGH SCHOOL 116 44 37.9% 32/31.7% 38/39.2% 35/39.8% 28 23 18
WIGGINS RE-50(J) WIGGINS JUNIOR-SENIOR HIGH SCHOOL
* * * * * 56.0% * * *
WILEY RE-13 JT WILEY JUNIOR-SENIOR HIGH SCHOOL
* * * * * * * * *
WINDSOR RE-4 WINDSOR HIGH SCHOOL 111 37 33.3% 41/38.0% 34/36.2% 38/39.6% 23 23 16
WOODLAND PARK RE-2
WOODLAND PARK HIGH SCHOOL
102 24 23.5% 38/32.8% 32/31.1% 17/23.0% 19 13 3
WOODLIN R-104 WOODLIN UNDIVIDED HIGH SCHOOL
* * * * * * * * *
WRAY RD-2 WRAY HIGH SCHOOL * * * * * * * * *
YUMA 1 YUMA HIGH SCHOOL * * * * * 7/28.0% * * *
OTHER (Out of State/Private/Unknown) 8914 1994 22.4% 19.7% 17.5% 12.9% 1332 972 695
TOTAL 30042 8606 28.6% 29.3% 29.6% 29.8% 6543 4844 3429

49


