Bailouts, Bankruptcies and Bailouts, Bankruptcies and D&O UnderwritingD&O Underwriting
MODERATOR:
Marc London, MBA, Senior Vice President, Marsh USA
PANELISTS:
David Bradford, MBA, Executive Vice President & Editor-In-Chief, Advisen, Ltd.
Vincent J. Dowling, Jr., Managing Partner, Dowling & Partners Securities, LLC
Stephen R. Guglielmo, Lead Underwriter, HCC Global Financial Products
Michael Karmilowicz, Vice President, Hartford Financial Products
David Lynders, MBA, Vice President, Axis Capital
Christine S. Montelbano, MBA, Regional Vice President, Travelers Bond & Financial Products
Jeremy Perler, CFA, CPA, Co-Head of CFRA Accounting Research, RiskMetrics Group
Salvatore Pollaro, MBA, Executive Vice President, Zurich North America, Specialties`
2009 D&O2009 D&O SymposiumSymposium
Bankruptcies and Securities Bankruptcies and Securities Class Action SuitsClass Action Suits
Dave Bradford
Executive Vice President
Advisen Ltd.
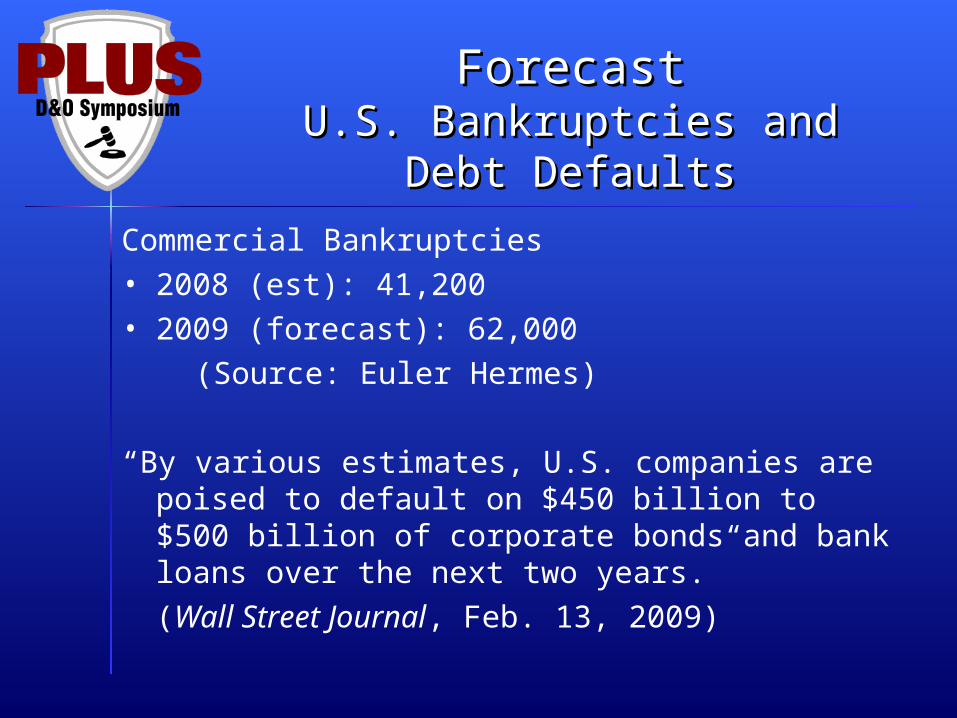
ForecastForecastU.S. Bankruptcies and Debt U.S. Bankruptcies and Debt
DefaultsDefaults
Commercial Bankruptcies• 2008 (est): 41,200• 2009 (forecast): 62,000
(Source: Euler Hermes)
“By various estimates, U.S. companies are poised to default on $450 billion to $500 billion of corporate bonds and bank loans over the next two years.”
(Wall Street Journal, Feb. 13, 2009)

Commercial Bankruptcy Commercial Bankruptcy FilingsFilings
0
10000
20000
30000
40000
50000
60000
Source: U.S. Bankruptcy Courts

Bankruptcies & SCASBankruptcies & SCAS
0
10000
20000
30000
40000
50000
60000
0
100
200
300
400
500
600
SCAS Comm Bankruptcies
All Commercial Bankruptcy FilingsAll Securities Class Action Suits Filed
Sources: Advisen MSCAd, U.S. Bankruptcy Courts

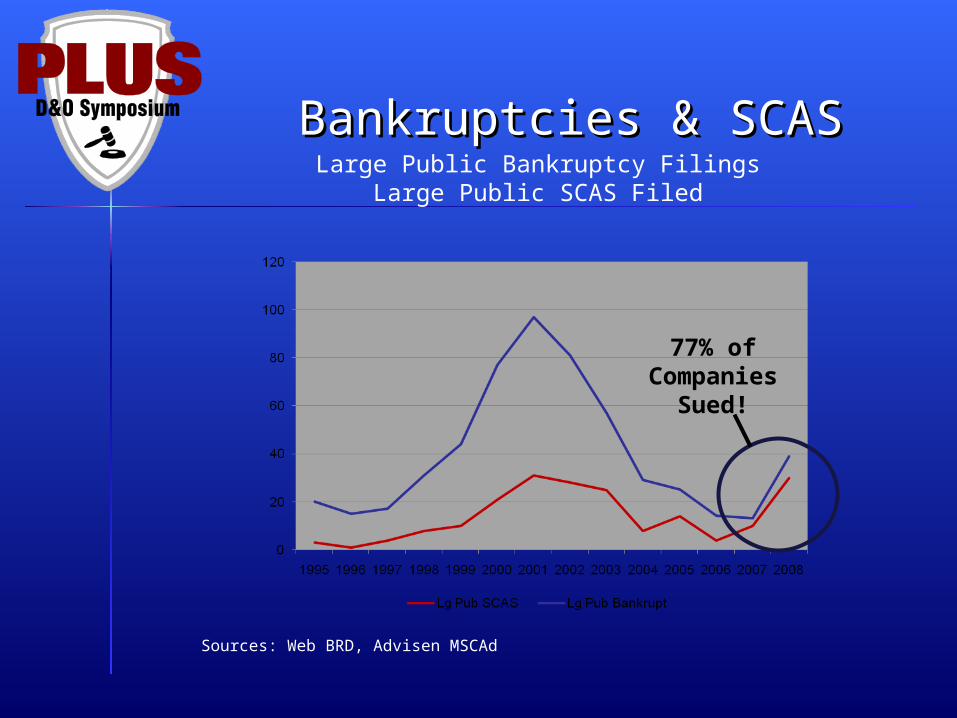
Bankruptcies & SCASBankruptcies & SCASLarge Public Bankruptcy Filings
All Securities Class Action Suits Filed
0
20
40
60
80
100
120
0
100
200
300
400
500
60019
95
1996
1997
1998
1999
2000
2001
2002
2003
2004
2005
2006
2007
2008
SCAS Lg Pub Bankrupt
Sources: Web BRD, Advisen MSCAd

Bankruptcies & SCASBankruptcies & SCASLarge Public Bankruptcy Filings
Large Public SCAS Filed
Sources: Web BRD, Advisen MSCAd
Bankruptcies & SCASBankruptcies & SCASLarge Public Bankruptcy Filings
Large Public SCAS Filed
Sources: Web BRD, Advisen MSCAd
77% ofCompanies
Sued!

Who Has Failed?Who Has Failed?Large Public Company Bankruptcies
Sources: Web BRD, Advisen AMF
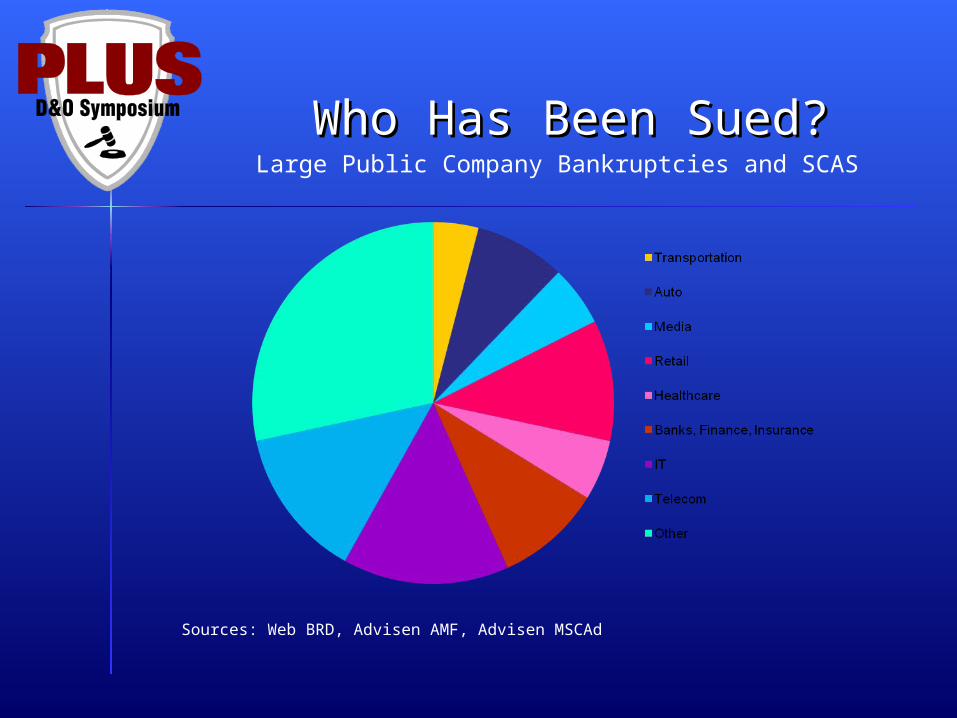
Who Has Been Sued?Who Has Been Sued?Large Public Company Bankruptcies and SCAS
Sources: Web BRD, Advisen AMF, Advisen MSCAd
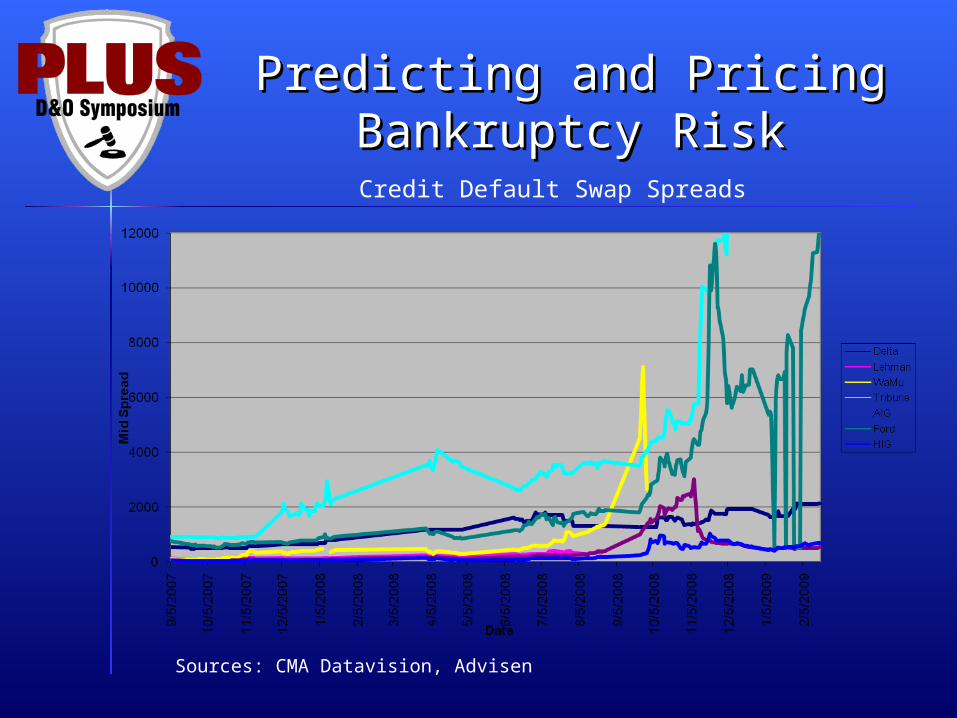
Predicting and Pricing Predicting and Pricing Bankruptcy RiskBankruptcy Risk
Credit Default Swap Spreads
Sources: CMA Datavision, Advisen
Other Source of Other Source of Bankruptcy D&O ExposureBankruptcy D&O Exposure
• Critical supplier
• Major customer
• Bank
• Counterparty
• Joint venture partner
• Minority interest investment

Economy Under Stress!Economy Under Stress!
• Auto sales, industrial production, consumer spending, and confidence measures at, or near, record lows
• S&P 500 down 38% in 2008
• 3.6 million U.S. jobs lost
• U.S. economy to contract 0.5% - 1.3%

New York City ~ February 25 & 26, 2009
The New WorldThe New World
Vincent J. Dowling, Jr.
Dowling & Partners Securities

Capital Lost In 2008Capital Lost In 2008
• The Net Result = We Estimate Of $55-75BB Of Capital Lost in ‘08 Investment Losses
• 50-75% Of Excess Capital Lost During 2008
$125 $100
$75
$43
$27 $27
$25$6
$25$5
$6
$70
$0
$25
$50
$75
$100
$125
Excess Capital @ YE07
H1-08 Change In Surplus
Excess Capital @ 6/30
Q3 A/T Op. Earnings, Ex. Cats
Q3 A/T Cats Q3 Investment/Other
losses
Excess Capital @ 9/30
Q4E Change (Range)
Est. Excess Capital @ YE07
US P&C INDUSTRY: 2008 CHANGE IN EXCESS CAPITALBased On Midpoint Of D&P's $100BB-150BB XS Capital Assumption At YE07
Increase
Decline

Industry Surplus GrowthIndustry Surplus Growth
$0
$100
$200
$300
$400
$500
$600
1980
1981
1982
1983
1984
1985
1986
1987
1988
1989
1990
1991
1992
1993
1994
1995
1996
1997
1998
1999
2000
2001
2002
2003
2004
2005
2006
2007
A
2008
E
2009
E
2010
E
P&C Industry Statutory Surplus ($, MM)
Stat Surplus
NPW
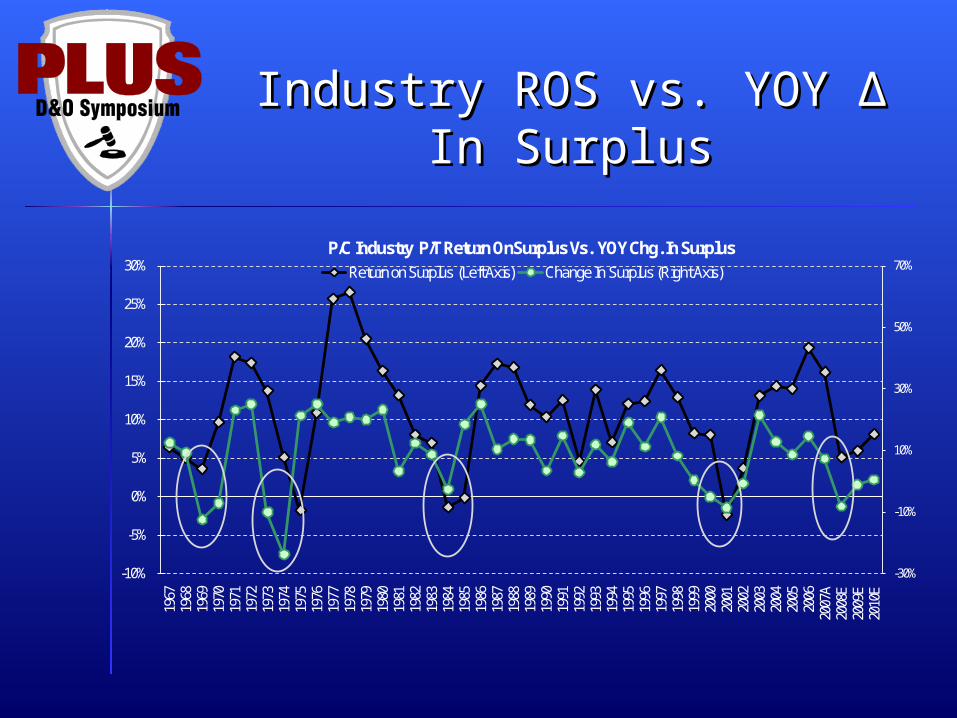
Industry ROS vs. YOY ∆ In Industry ROS vs. YOY ∆ In SurplusSurplus
-30%
-10%
10%
30%
50%
70%
-10%
-5%
0%
5%
10%
15%
20%
25%
30%
1967
1968
1969
1970
1971
1972
1973
1974
1975
1976
1977
1978
1979
1980
1981
1982
1983
1984
1985
1986
1987
1988
1989
1990
1991
1992
1993
1994
1995
1996
1997
1998
1999
2000
2001
2002
2003
2004
2005
2006
2007
A20
08E
2009
E20
10E
P/C Industry P/T Return OnSurplus Vs. YOY Chg. In SurplusReturn on Surplus (Left Axis) Change In Surplus (Right Axis)
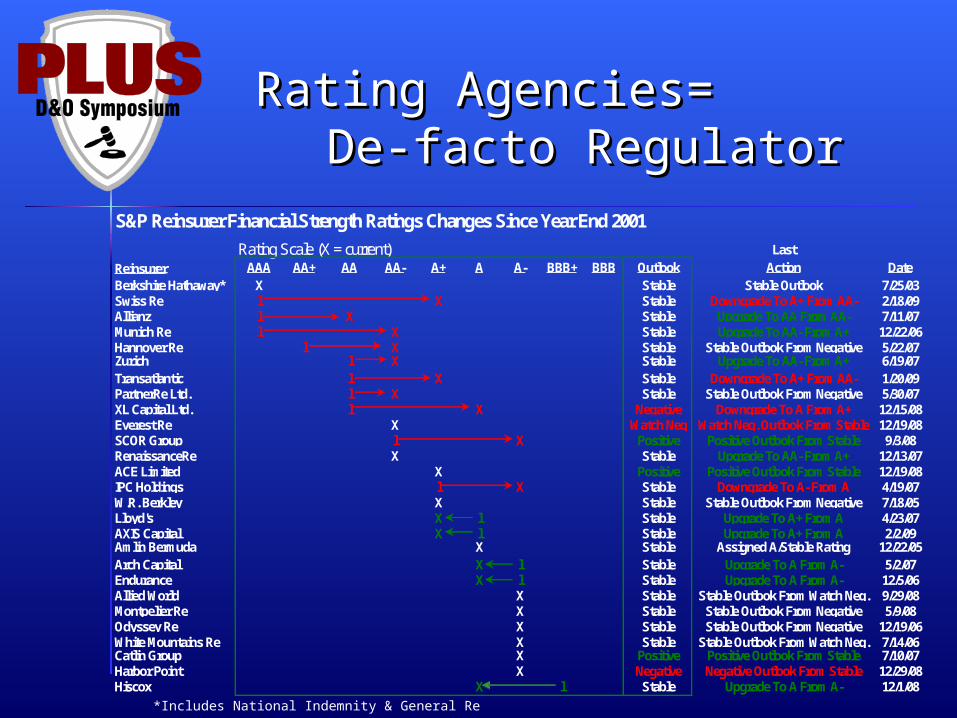
S&P Reinsurer Financial Strength Ratings Changes Since Year End 2001
Rating Scale (X = current) Last
Reinsurer AAA AA+ AA AA- A+ A A- BBB+ BBB Outlook Action DateBerkshire Hathaway* X Stable Stable Outlook 7/25/03Swiss Re l X Stable Downgrade To A+ From AA- 2/18/09Allianz l X Stable Upgrade To AA From AA- 7/11/07Munich Re l X Stable Upgrade To AA- From A+ 12/22/06Hannover Re l X Stable Stable Outlook From Negative 5/22/07Zurich l X Stable Upgrade To AA- From A+ 6/19/07Transatlantic l X Stable Downgrade To A+ From AA- 1/20/09PartnerRe Ltd. l X Stable Stable Outlook From Negative 5/30/07XL Capital Ltd. l X Negative Downgrade To A From A+ 12/15/08Everest Re X Watch Neg Watch Neg. Outlook From Stable 12/19/08SCOR Group l X Positive Positive Outlook From Stable 9/3/08RenaissanceRe X Stable Upgrade To AA- From A+ 12/13/07ACE Limited X Positive Positive Outlook From Stable 12/19/08IPC Holdings l X Stable Downgrade To A- From A 4/19/07W.R. Berkley X Stable Stable Outlook From Negative 7/18/05Lloyd's X l Stable Upgrade To A+ From A 4/23/07AXIS Capital X l Stable Upgrade To A+ From A 2/2/09Amlin Bermuda X Stable Assigned A/Stable Rating 12/22/05Arch Capital X l Stable Upgrade To A From A- 5/2/07Endurance X l Stable Upgrade To A From A- 12/5/06Allied World X Stable Stable Outlook From Watch Neg. 9/29/08Montpelier Re X Stable Stable Outlook From Negative 5/9/08Odyssey Re X Stable Stable Outlook From Negative 12/19/06White Mountains Re X Stable Stable Outlook From Watch Neg. 7/14/06Catlin Group X Positive Positive Outlook From Stable 7/10/07Harbor Point X Negative Negative Outlook From Stable 12/29/08Hiscox X l Stable Upgrade To A From A- 12/1/08
Rating Agencies= De-Rating Agencies= De-facto Regulatorfacto Regulator
*Includes National Indemnity & General Re
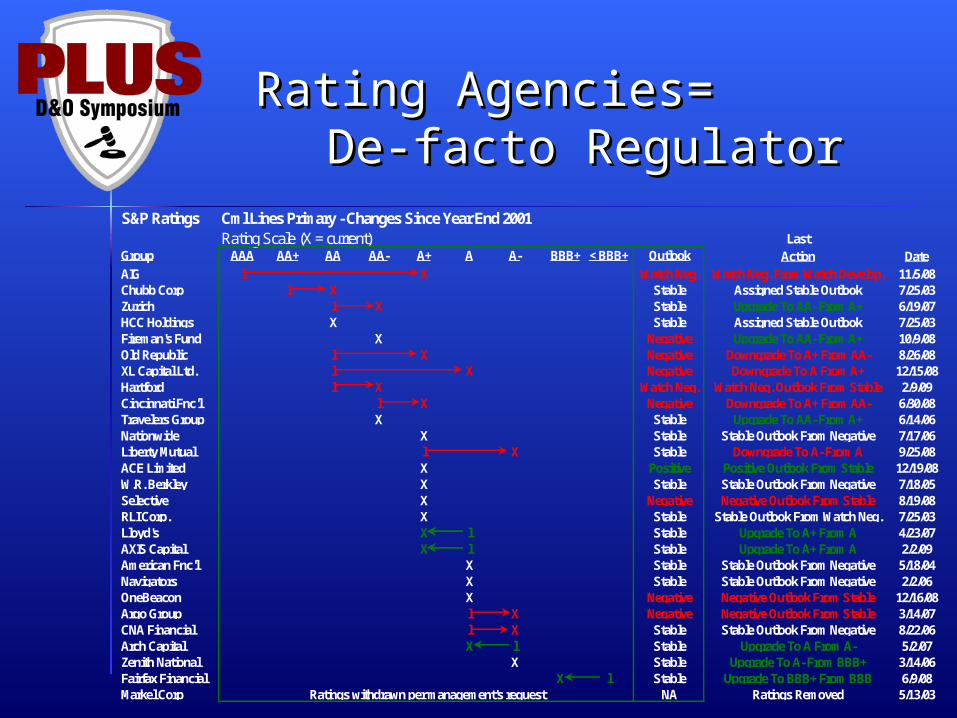
Rating Agencies= De-Rating Agencies= De-facto Regulatorfacto Regulator
S&P Ratings Cml Lines Primary - Changes Since Year End 2001Rating Scale (X = current) Last
Group AAA AA+ AA AA- A+ A A- BBB+ < BBB+ Outlook Action DateAIG l X Watch Neg. Watch Neg. From Watch Develop. 11/5/08Chubb Corp l X Stable Assigned Stable Outlook 7/25/03Zurich l X Stable Upgrade To AA- From A+ 6/19/07HCC Holdings X Stable Assigned Stable Outlook 7/25/03Fireman's Fund X Negative Upgrade To AA- From A+ 10/9/08Old Republic l X Negative Downgrade To A+ From AA- 8/26/08XL Capital Ltd. l X Negative Downgrade To A From A+ 12/15/08Hartford l X Watch Neg. Watch Neg. Outlook From Stable 2/9/09Cincinnati Fnc'l l X Negative Downgrade To A+ From AA- 6/30/08Travelers Group X Stable Upgrade To AA- From A+ 6/14/06Nationwide X Stable Stable Outlook From Negative 7/17/06Liberty Mutual l X Stable Downgrade To A- From A 9/25/08ACE Limited X Positive Positive Outlook From Stable 12/19/08W.R. Berkley X Stable Stable Outlook From Negative 7/18/05Selective X Negative Negative Outlook From Stable 8/19/08RLI Corp. X Stable Stable Outlook From Watch Neg. 7/25/03Lloyd's X l Stable Upgrade To A+ From A 4/23/07AXIS Capital X l Stable Upgrade To A+ From A 2/2/09American Fnc'l X Stable Stable Outlook From Negative 5/18/04Navigators X Stable Stable Outlook From Negative 2/2/06OneBeacon X Negative Negative Outlook From Stable 12/16/08Argo Group l X Negative Negative Outlook From Stable 3/14/07CNA Financial l X Stable Stable Outlook From Negative 8/22/06Arch Capital X l Stable Upgrade To A From A- 5/2/07Zenith National X Stable Upgrade To A- From BBB+ 3/14/06Fairfax Financial X l Stable Upgrade To BBB+ From BBB 6/9/08Markel Corp Ratings withdrawn per management's request NA Ratings Removed 5/13/03
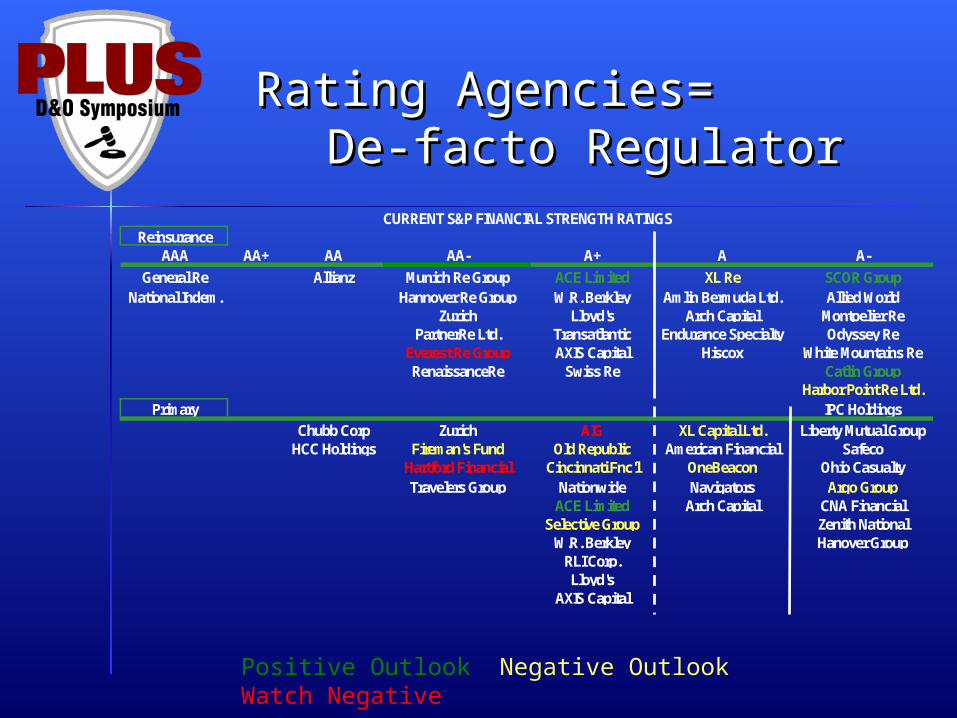
ReinsuranceAAA AA+ AA AA- A+ A A-
General Re Allianz Munich Re Group ACE Limited XL Re SCOR GroupNational Indem. Hannover Re Group W.R. Berkley Amlin Bermuda Ltd. Allied World
Zurich Lloyd's Arch Capital Montpelier RePartnerRe Ltd. Transatlantic Endurance Specialty Odyssey Re
Everest Re Group AXIS Capital Hiscox White Mountains ReRenaissanceRe Swiss Re Catlin Group
Harbor Point Re Ltd.Primary IPC Holdings
Chubb Corp Zurich AIG XL Capital Ltd. Liberty Mutual GroupHCC Holdings Fireman's Fund Old Republic American Financial Safeco
Hartford Financial Cincinnati Fnc'l OneBeacon Ohio CasualtyTravelers Group Nationwide Navigators Argo Group
ACE Limited Arch Capital CNA FinancialSelective Group Zenith National
W.R. Berkley Hanover GroupRLI Corp.Lloyd's
AXIS Capital
CURRENT S&P FINANCIAL STRENGTH RATINGS
Rating Agencies= De-Rating Agencies= De-facto Regulatorfacto Regulator
Positive Outlook Negative Outlook Watch Negative
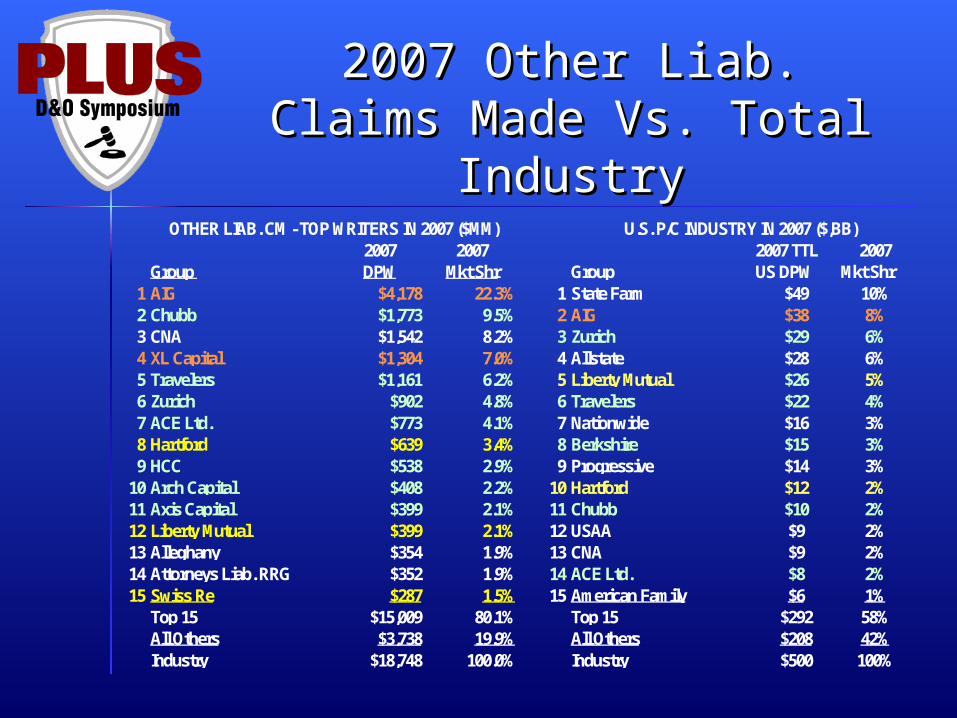
2007 Other Liab. Claims 2007 Other Liab. Claims Made Vs. Total IndustryMade Vs. Total Industry
2007 2007Group DPW Mkt Shr
1 AIG $4,178 22.3%2 Chubb $1,773 9.5%3 CNA $1,542 8.2%4 XL Capital $1,304 7.0%5 Travelers $1,161 6.2%6 Zurich $902 4.8%7 ACE Ltd. $773 4.1%8 Hartford $639 3.4%9 HCC $538 2.9%
10 Arch Capital $408 2.2%11 Axis Capital $399 2.1%12 Liberty Mutual $399 2.1%13 Alleghany $354 1.9%14 Attorneys Liab. RRG $352 1.9%15 Swiss Re $287 1.5%
Top 15 $15,009 80.1%All Others $3,738 19.9%Industry $18,748 100.0%
OTHER LIAB. CM - TOP WRITERS IN 2007 ($MM)2007 TTL 2007
Group US DPW Mkt Shr1 State Farm $49 10%2 AIG $38 8%3 Zurich $29 6%4 Allstate $28 6%5 Liberty Mutual $26 5%6 Travelers $22 4%7 Nationwide $16 3%8 Berkshire $15 3%9 Progressive $14 3%
10 Hartford $12 2%11 Chubb $10 2%12 USAA $9 2%13 CNA $9 2%14 ACE Ltd. $8 2%15 American Family $6 1%
Top 15 $292 58%All Others $208 42%Industry $500 100%
U.S. P/C INDUSTRY IN 2007 ($,BB)

Other Liab. Claims Made Other Liab. Claims Made Soft vs. Hard BlockSoft vs. Hard Block
66.1%
68.2% 71.0% 73.7%
68.9%
65.6%65.3%
63.3%64.4% 66.9%
86.6%
107.5%108.4%
104.8%
94.8%
63.5%
53.2%55.8%
63.5%
45%
55%
65%
75%
85%
95%
105%
115%
1998 1999 2000 2001 2002 2003 2004 2005 2006 2007
INDUSTRY "OTHER LIABILITY CLAIMS MADE" AY LOSS RATIO PICKSInitial Vs. Current NET Loss Picks
Initial L. Ratio Pick Current L. Ratio Pick
"SOFT MARKET" BLOCK
"HARD MARKET" BLOCK

New York City ~ February 25 & 26, 2009
Underwriting D&O: Underwriting D&O: Key Accounting Issues for 2009Key Accounting Issues for 2009
Jeremy Perler, CFA, CPAJeremy Perler, CFA, CPA
RiskMetrics GroupRiskMetrics Group
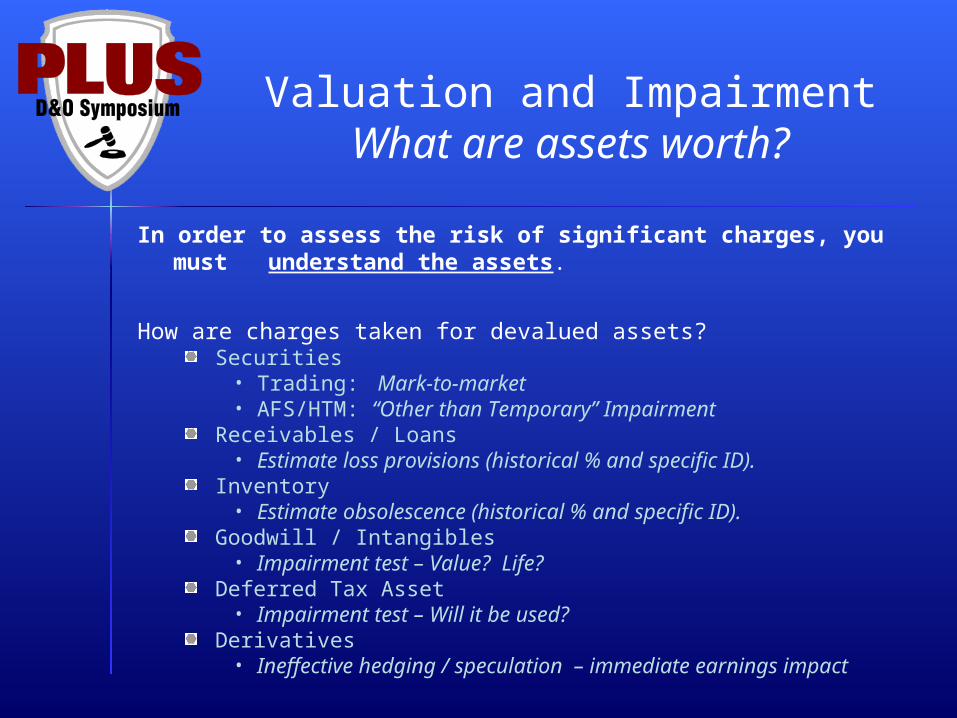
Valuation and ImpairmentWhat are assets worth?
In order to assess the risk of significant charges, you must understand the assets.
How are charges taken for devalued assets?Securities
• Trading: Mark-to-market• AFS/HTM: “Other than Temporary” Impairment
Receivables / Loans• Estimate loss provisions (historical % and specific ID).
Inventory• Estimate obsolescence (historical % and specific ID).
Goodwill / Intangibles• Impairment test – Value? Life?
Deferred Tax Asset• Impairment test – Will it be used?
Derivatives• Ineffective hedging / speculation – immediate earnings impact

Aggregate Balance Sheet of US Commercial Banks (Q2'08)
HTM Securities, 0.47%
AFS Securities,13.84%
Consolidated Loans, 48.37%
Other Assets, 20.98%
Goodwill & Intangibles, 3.87%
Trading Securities,12.48%
Valuation and ImpairmentWhat are assets worth?
Snapshot of an Average Bank’s Balance Sheet
Intense focus on M2M securities (12.5%) distracts from the bigger problem: Loans (48%) are in bad shape.

Valuation and ImpairmentWhat are assets worth?
Understand the business! What is happening in the loan portfolio?
Credit quality is deteriorating:
Reserves are increasing, but not enough to cover nonperforming loans:
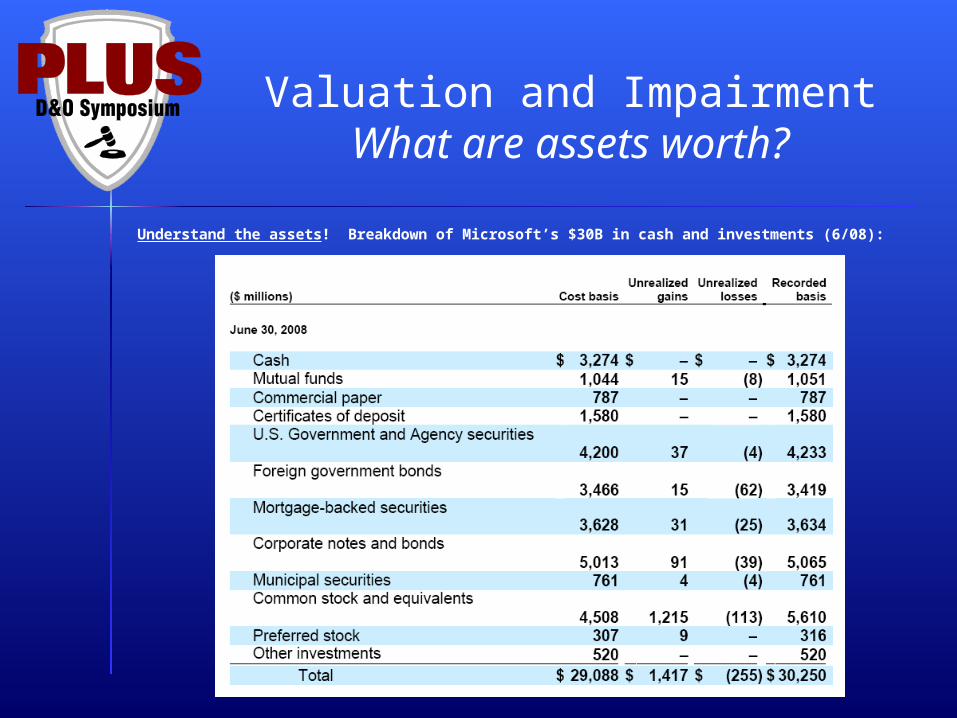
Valuation and ImpairmentWhat are assets worth?
Understand the assets! Breakdown of Microsoft’s $30B in cash and investments (6/08):
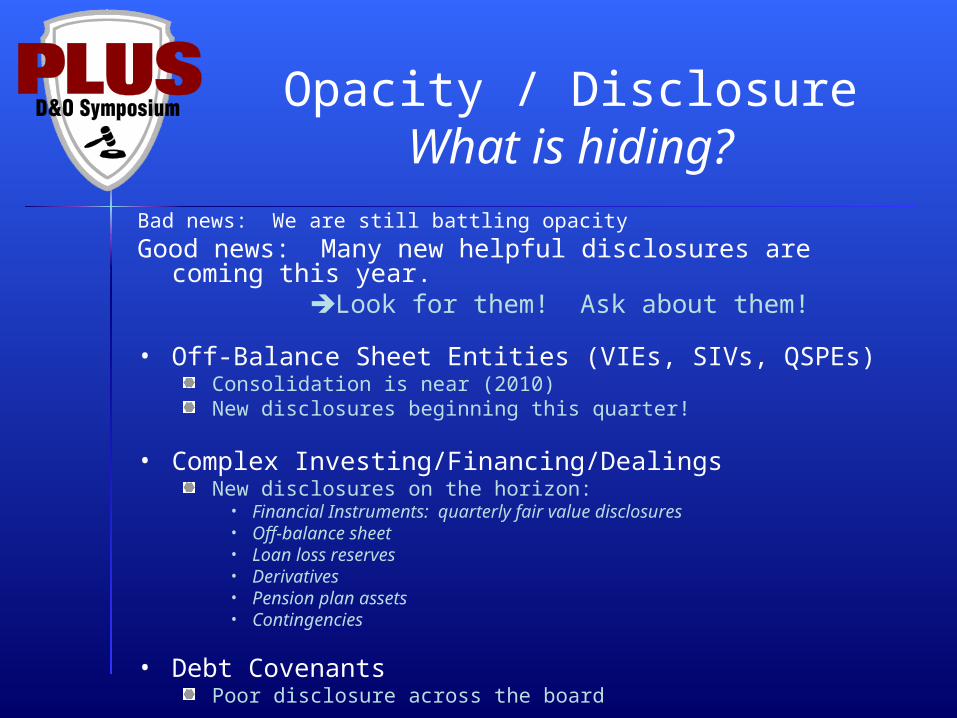
Opacity / DisclosureWhat is hiding?
Bad news: We are still battling opacity
Good news: Many new helpful disclosures are coming this year. Look for them! Ask about them!
• Off-Balance Sheet Entities (VIEs, SIVs, QSPEs)Consolidation is near (2010)New disclosures beginning this quarter!
• Complex Investing/Financing/DealingsNew disclosures on the horizon:
• Financial Instruments: quarterly fair value disclosures• Off-balance sheet• Loan loss reserves• Derivatives• Pension plan assets• Contingencies
• Debt CovenantsPoor disclosure across the board
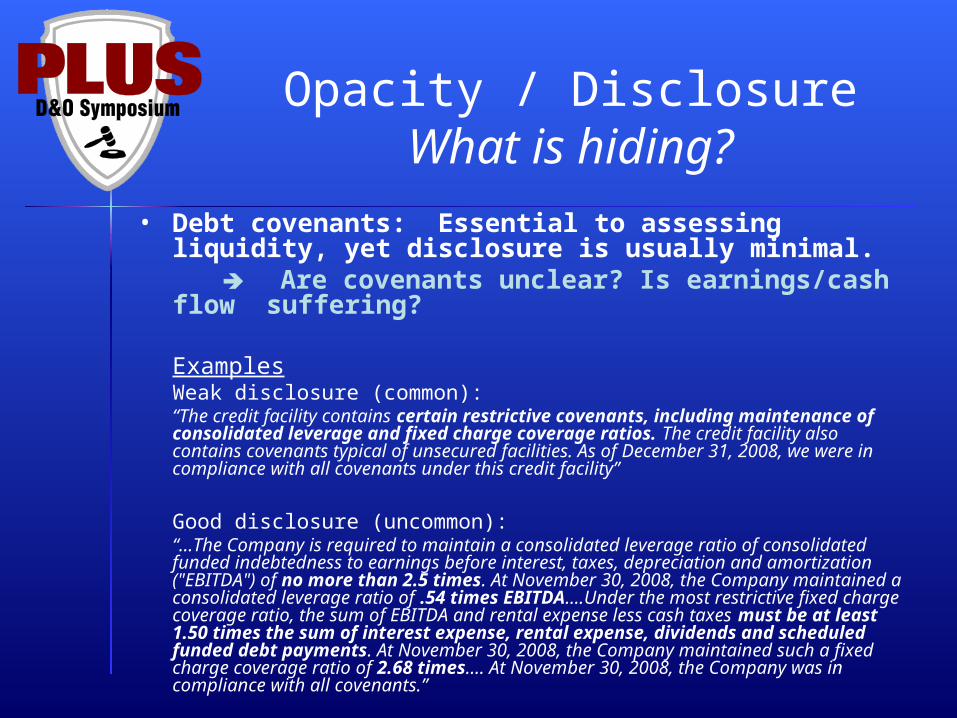
Opacity / DisclosureWhat is hiding?
• Debt covenants: Essential to assessing liquidity, yet disclosure is usually minimal. Are covenants unclear? Is earnings/cash flow suffering?
ExamplesWeak disclosure (common):“The credit facility contains certain restrictive covenants, including maintenance of consolidated leverage and fixed charge coverage ratios. The credit facility also contains covenants typical of unsecured facilities. As of December 31, 2008, we were in compliance with all covenants under this credit facility”
Good disclosure (uncommon):“…The Company is required to maintain a consolidated leverage ratio of consolidated funded indebtedness to earnings before interest, taxes, depreciation and amortization ("EBITDA") of no more than 2.5 times. At November 30, 2008, the Company maintained a consolidated leverage ratio of .54 times EBITDA….Under the most restrictive fixed charge coverage ratio, the sum of EBITDA and rental expense less cash taxes must be at least 1.50 times the sum of interest expense, rental expense, dividends and scheduled funded debt payments. At November 30, 2008, the Company maintained such a fixed charge coverage ratio of 2.68 times…. At November 30, 2008, the Company was in compliance with all covenants.”
2009 ResultsWhat will you see?
• Undue pressure from pension plansI/S: Earnings/margin pressure from higher pension expense
• 72% of companies had lower pension expense in H1’08 B/S: Lower book value as funded status drops
• Debt covenants? Rating? Dividend? SCF: Cash payments to make up the difference
What is the impact of pensions on earnings, book value and cash flow?
• Increased Metrics Management New “key performance metrics”Changing definitions of metricsAdjusting accounting policies
Is management using new metrics/policies? Why?


