
1

2008 Half Year Results
30 July 2008
2

3
This material may be deemed to include forward-looking statements within the meaning of Section 27A of the
US Securities Act of 1933 and Section 21E of the US Securities Exchange Act of 1934. These forward-looking
statements are only predictions and you should not rely unduly on them. Actual results might differ materially
from those projected in any such forward-looking statements, which involve known and unknown risks,
uncertainties and other factors that may cause our or our industry’s actual results, levels of activity,
performance or achievements to be materially different from any future results, levels of activity, performance
or achievements expressed or implied by the forward-looking statements. In evaluating forward-looking
statements, which are generally identifiable by use of the words “may”, “will”, “should”, “expect”, “anticipate”,
“estimate”, “believe”, “intend” or “project” or the negative of these words or other variations on these words
or comparable terminology, you should consider various factors including the risks outlined in our Form 20-F
filed with the SEC. Although we believe the expectations reflected in forward-looking statements are
reasonable we cannot guarantee future results, levels of activity, performance or achievements. This
presentation should be viewed in conjunction with our periodic interim and annual reports and registration
statements filed with the Securities and Exchange Commission, copies of which are available from Cadbury
plc, Cadbury House, Sanderson Road, Uxbridge UB8 1DH, UK.

4

Roger CarrChairman

6

Todd StitzerChief Executive Officer
Results Overview

First Half 2008: Strong Delivery Against Our Scorecard
• Organic revenue growth +7% : ahead of goal range
• Fourth consecutive year of global share gain
• Underlying operating margins +190bps
• Price realisation covers input costs increases
• Dividends +6%
• Successful bond refinancing
• Reviewing structure of Australian Beverages
• Confident of strong growth in ROIC and earnings in 2008
PerformanceScorecard
• Organic revenue growth of 4%-6% pa
• Mid-teen trading margins by end 2011
• Total confectionery share gain
• Efficient balance sheet
• Strongdividendgrowth
• Growth in ROIC
8

9
Confectionery Market Growth Momentum Continues in 2008 …
Source: IRI/Nielsen

Robust Developed Market Growth Through Economic Cycles …
UK Chocolate Market Growth 1970 - 2007
10Chocolate value
Real GDP growth rate (%)Chocolate volume
Right-axisLeft-axis (data indexed to 100)
Source: BCCCA, Office of National Statistics

11
And Own-Label Penetration Remains Low …
Own-Label Penetration (% of total sales)
Grocery Market Confectionery
UK 38% 7%
US 15% 2%
Australia 11% 4%
France 20% 8%
Mexico 2% 1%
India 1% 1%
Source: Euromonitor/Mintel/IRI

12
Emerging Market Growth Resilient Through Economic Cycles
Confectionery Market Growth – BRIC* Markets
* Brazil, Russia, India, ChinaSource: Euromonitor, Goldman Sachs
Aggregate confectionery growth rateReal GDP growth rate
(%)

• First half growth ahead of market and our four year trend
13
6.2% 6.5%
4.2%
7.1%
2004 2005 2006 2007
Cadbury Confectionery Revenue Growth
1H 2008
7.3%
Note: growth rates rebased to prior period exchange rates
Our Growth Momentum Continues in 2008 …
Cadbury4-year
average6.2% pa
Market4-year
average5.1% pa
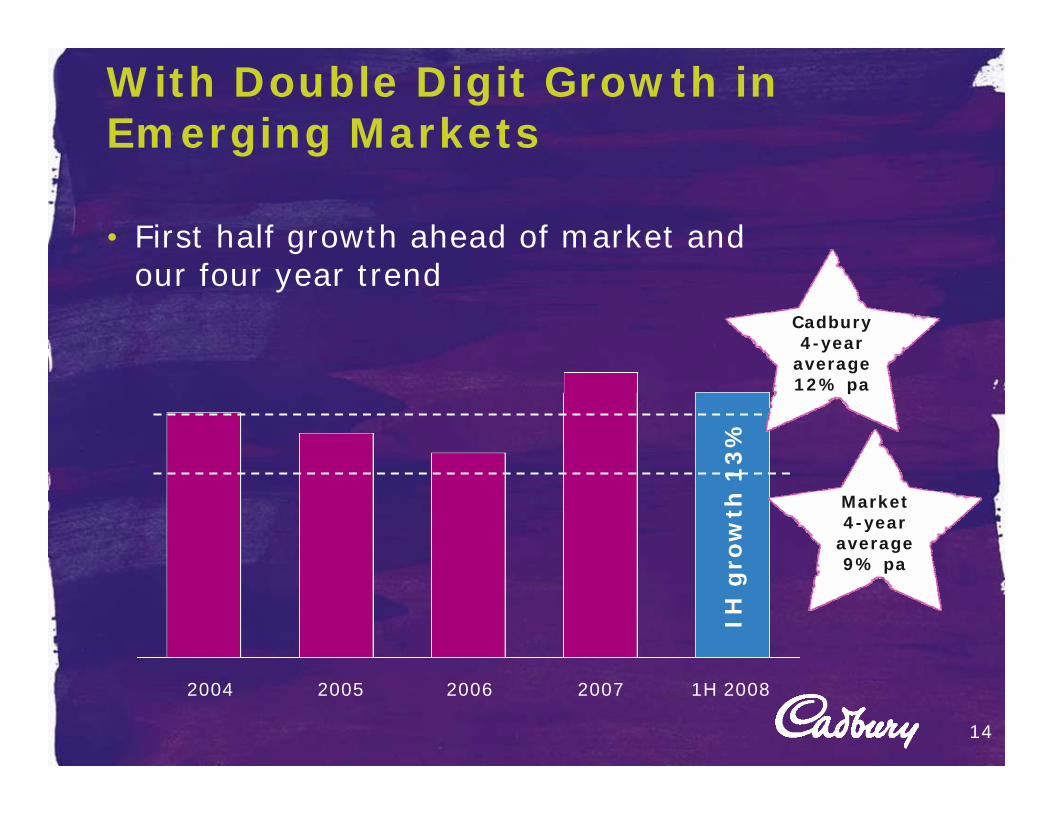
IH g
row
th 1
3%
With Double Digit Growth in Emerging Markets
14
Cadbury 4-year
average12% pa
Market4-year
average9% pa
• First half growth ahead of market andour four year trend
2004 2005 2006 2007 1H 2008

15
And Strong Growth From All Our Categories
Chocolate
+6%
Candy
+7%
Gum
+10%

16
A Strengthened Total Confectionery Platform
$ share 2003 2006 2007
Cadbury 9.2% 10.1% 10.4%
Mars 9.5% 9.0% 9.0%
Nestle 7.5% 7.6% 7.6%
Wrigley 4.4% 5.7% 5.8%
Hershey 5.7% 5.4% 5.1%
Kraft 4.8% 4.4% 4.5%
Ferrero 4.1% 4.2% 4.1%
+120bpssharegain
Global Confectionery Share
Source: Euromonitor 2007
17
With Strong #1 Position Outside the US and in Emerging Markets
$ share Outside US
#1 positions in top 50*
Emerging markets
Cadbury 11.6% 13 10.6%
Mars/Wrigley 9.5% 10 9.3%
Nestle 8.1% 5 8.0%
Kraft 5.3% 3 5.1%
Ferrero 4.7% 1 2.3%
* Top 50 markets account for 93% of global confectionery
Source: Euromonitor 2007
Confectionery Market Shares 2007

Be the World’s BIGGEST and BEST Confectionery Company
1. Growth: fewer, faster, bigger, better
2. Efficiency: relentless focus on cost & efficiency
1.1 Category focus for scale & simplicity
1.2 Drive advantaged, consumer preferred brands & products
1.3 Accelerate ‘white space’ market entry via Smart Variety
1.4 Create advantaged customer partnerships via total confectionery solutions
1.5 Expand platforms through acquisition
3. Capabilities: ensure world class quality
To Deliver Superior Shareowner Returns
PerformanceScorecard
GoverningObjective
Vision
1.1 Category focus for scale & simplicity
1.2 Drive advantaged, consumer preferred brands & products
1.3 Accelerate ‘white space’ market entry via Smart Variety
1.4 Create advantaged customer partnerships via total confectionery solutions
1.5 Expand platforms through acquisition
• Organic revenue growth of 4%-6% pa
• Mid-teen trading margins by end 2011
• Total confectionery share gain
• Efficient balance sheet
• Strongdividendgrowth
• Growth in ROIC
Priorities
Growth:Fewer, Faster, Bigger, Better
18

19
Driving our Focus Brands …
13Focus
Brands+9%

12Focus
Markets+9%
20
… Our Focus Markets …

21
… And Focus Global Customers
FocusGlobal
Customers+7%

Chocolate: Cadbury Dairy Milk …
CDM+9%
22

• Growth driven by successful format and flavour innovation
Candy: Eclairs
23
Stick Pack in China Affordable trader friendly packs in South Africa
Eclairs
23%

Gum: Longer Lasting Gum
Centre-Filled Gum
• Launched in 2005
• Sold in 25 countries
• Annual revenues c£250m
Longer-Lasting Gum
• Launched in 2006
• Sold in 12 countries
• Annual revenues c£180m
24
Trident+12%

First Half 2008: Strong Commercial Delivery
Revenue +7%
Chocolate +6%
Candy +7%
Gum +10%
Focus brands +9%
Focus markets +9%
Focus customers +7%
Emerging markets +13%
2007 market share +30bps
25

26

Ken HannaChief Financial Officer
Financial Review

Key Messages
• Delivery
• Growth momentum
• Efficiency programme
• Capital efficiency
28

Our Performance Scorecard
Be the World’s BIGGEST and BEST Confectionery Company
1. Growth: fewer, faster, bigger, better
2. Efficiency: relentless focus on cost & efficiency
3. Capabilities: ensure world class quality
To Deliver Superior Shareowner Returns
PerformanceScorecard
GoverningObjective
Vision
• Organic revenue growth of 4%-6% pa
• Mid-teen trading margins by end 2011
• Total confectionery share gain
• Efficient balance sheet
• Strongdividendgrowth
• Growth in ROIC
Priorities
• Organic revenue growth of 4%-6% pa
• Total confectionery share gain
• Mid-teen trading margins by end 2011
• Strong dividend growth
• Efficient balance sheet
• Growth in ROIC29

Revenue and Profit Growth
Half Year (£m)Continuing Operations 2008 Re-presented
2007 %%
(constant currency)
Revenue 2,653 2,326 14% 7%
Underlying profit from operations* 248 168 48% 35%
margin 9.3% 7.2% +210bps +190bps
Associates 4 5
Underlying net finance cost (29) (20)
Underlying profit before tax 223 153 46% 33%
Underlying taxation (65) (46)
Underlying profit after tax 158 107 48% 35%
Pro forma EPS 11.7p 8.0p 46% 34%
Pro forma no. underlying shares 1,345 1,335
30* Profit from operations before intangibles amortisation, goodwill impairment, restructuring, non-trading items and IAS39 adjustment

Growth Momentum Continuing
• First half revenue performance builds on strong run-rate
31
6.2% 6.5%
4.2%
7.1%
2004 2005 2006 2007
6.2% Cadbury CAGR 2004 – 20075.1% market CAGR 2004 - 2007
Cadbury Confectionery Revenue Growth
1H 2008
7.3%
2H 20071H 2007
6.1%
8.0%
Note: growth rates rebased to prior period exchange rates
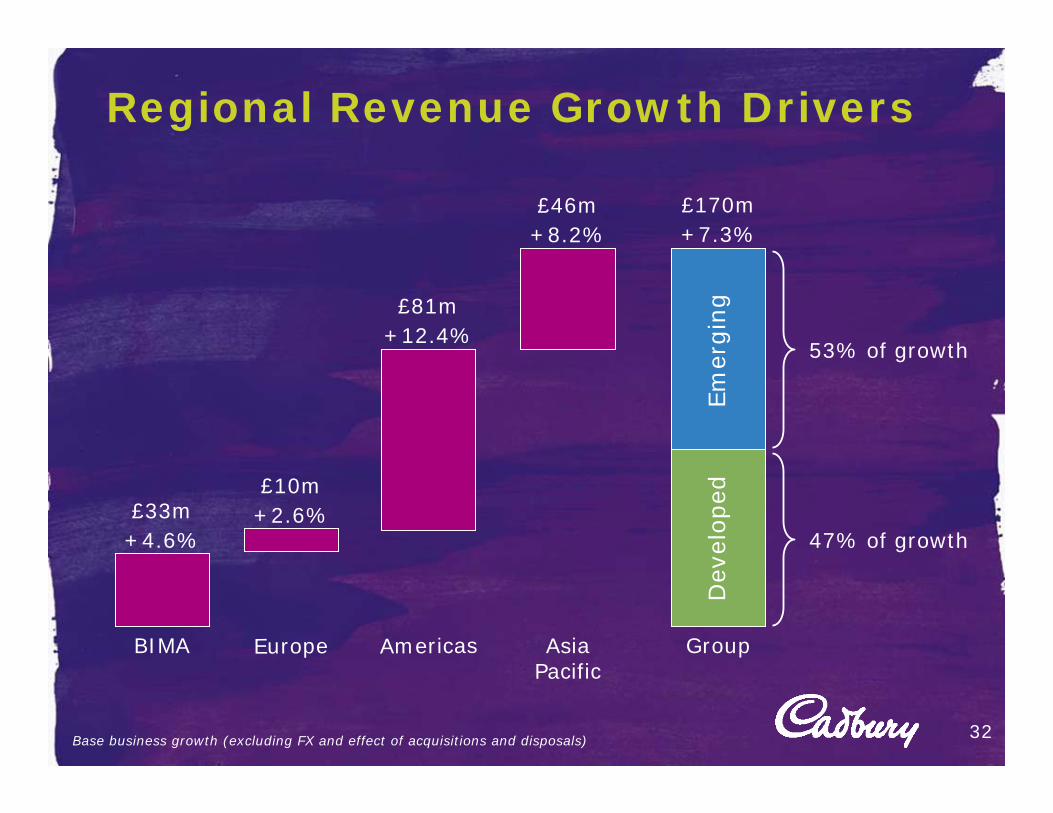
Regional Revenue Growth Drivers
32
Europe
£10m+2.6%
Americas
£81m+12.4%
Asia Pacific
£46m+8.2%
£33m+4.6%
BIMA Group
£170m+7.3%
Base business growth (excluding FX and effect of acquisitions and disposals)
53% of growth
47% of growth
Dev
eloped
Em
ergin
g
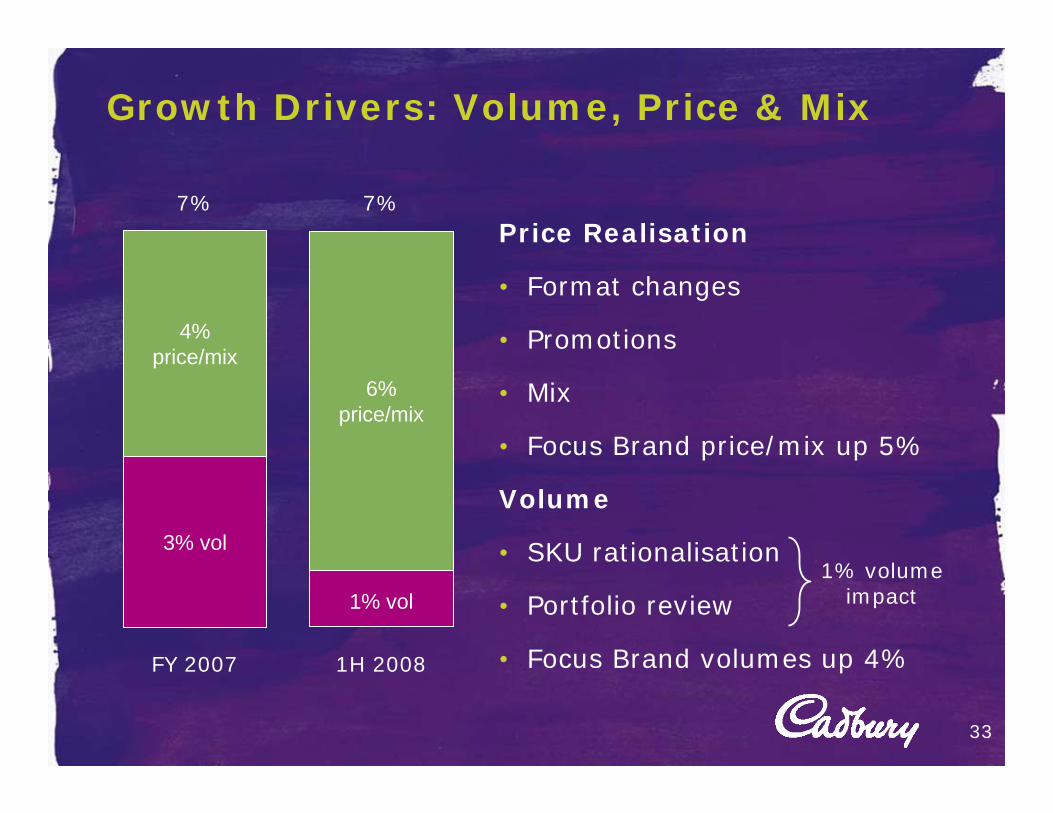
Growth Drivers: Volume, Price & Mix
Price Realisation
• Format changes
• Promotions
• Mix
• Focus Brand price/mix up 5%
Volume
• SKU rationalisation
• Portfolio review
• Focus Brand volumes up 4%
33
FY 2007 1H 2008
7%
6%price/mix
1% vol
7%
4%price/mix
3% vol1% volume
impact

Mid-teens Margins by 2011
34
2007 2011
• Central Costs
• SG&A
• Supply Chain
• Mix/Leverage
• Portfolio
rationalisation
• Underperforming
markets
• Reinvestment
• Cost Headwinds

Regional Underlying Profit Drivers
35
£6m
9.1%
H1 2007
7.2%
£14m
H1 2008
£30m
BIMA Europe Americas APAC M&A
£0m
£(2)m£11m
Group
At constant currencyNote: Regional uplifts given pre allocation of Business Improvement Costs

Run Rate Margin
Operating margin improvement* ConstantCurrency
ActualCurrency
2H 2007 +80 bps +70 bps
1H 2008 +190 bps +210 bps
Last Twelve Months +130 bps +130 bps
36
*(excl. Business Improvement Costs)

Progress On Central Costs
£m 2007 2008
Central costs pre BIC (69) (58)
As percentage of revenue 3.0% 2.2%
Reallocation
Business Improvement Costs 4 (3)
Revised central cost base (65) (61)
As percentage of revenue 2.8% 2.3%
• Benefit of cost savings initiatives coming through
• On track for our target of ‘below 2%’ of revenue
37

Americas SG&A Programme
• Move from 5 to
3 business units
• Eliminating duplication
• Functions aggregated for scale
• Double hatting
• 15% headcount reduction in G&A across the
Americas
• SG&A down by 230bps
38

Britain & Ireland Supply Chain Reconfiguration
• Coolock (Ireland) –
headcount reduction 30%
• Closure of Somerdale and
move of Milk Tray from
Bournville to Poland
- UK headcount reduction by
2010 c.700
39
Warsaw
Skarbimierz
Wroclaw
Sheffield
Somerdale
Bournville
Coolock
Dublin
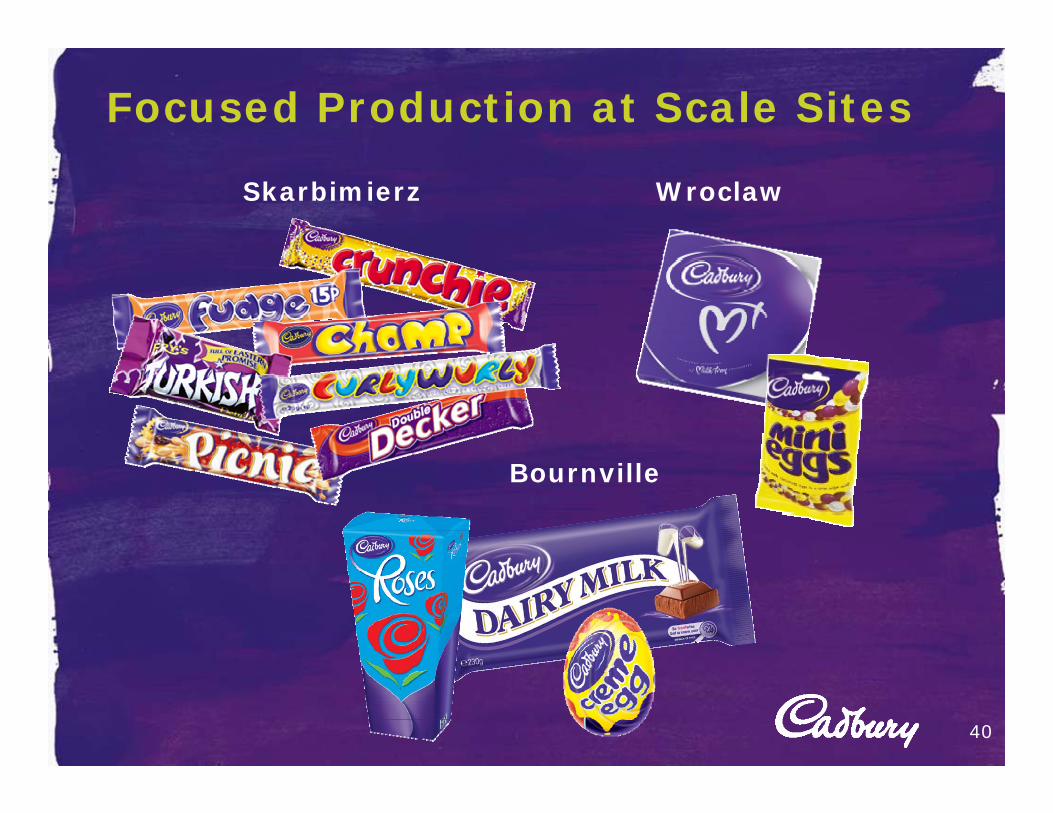
Focused Production at Scale Sites
40
Skarbimierz Wroclaw
Bournville

Portfolio Rationalisation in Egypt
• Major reconfiguration project to revitalise business and
materially improve margins
• Improved profitability in lower income segments by
changing the value proposition
• Reduced overheads to improve efficiencies
– 200 heads
• Accelerated growth in premium segments41

Commodity Cost Increases
42
£m 2007 1Haverage
2007 FY average
2008 1H average
% Change vs. FY 2007 Current (2)
World sugar, c/lb(1) 10.3 10.2 13.2 29% 13.8
Cocoa, £/tonne(1) 940 953 1,306 37% 1,408
Oil, $/barrel(1) 65 73 109 50% 127
Milk(3), p/litre 17.8 20.9 26.4 26% 27.2
(1) Source: Bloomberg(2) As at 28 July 2008(3) UK liquid milk farmgate price
• Effect of oil prices feeding through into 2H and beyond
• Cocoa - lagged impact of cost increases
• 5-6% increase in commodity costs for 2008
• Commodity increases being managed by price realisation

Progress in Underperforming Markets
Half year (£m) 2007 2008
Sales 96 123
Underlying operating loss (14) (10)
43Aggregate of Nigeria, Russia and China. Values at the prevailing FX rate for the period
• Russia impacted by change to distribution platform
• Underperforming markets expected to show continued
progress in the second half

Restructuring Costs
Half year (£m) 2007 2008
Restructuring
Restructuring - Vision into Action (22) (49)
Americas Beverages separation costs (4) (14)
Gumlink (8) (3)
Acquisition integration - (5)
Total (34) (71)
44
• Total demerger costs (including tax, financing and
discontinued) around £145m (07/08)

Debt Profile
• Maintaining BBB rating; aiming for BBB+
• Issued a new £350m 10-year bond at 7.25% in July 2008
• Average interest rates will trend higher as older debt matures
• Over £1bn of undrawn bank facilities
£bill
ion
Bond Debt by Maturity
45

Balance Sheet Ratios
Dec 2007 Jun 2008
Net debt £m £3,219m £1,700m
Net debt/EBITDA# 2.5x 2.2x
EBITDA# /Net interest 7.6x 8.6x
EBIT/Net interest 5.9x 6.3x
46
Ratios calculated for the total group on a rolling 12 month basis# EBITDA is defined as earnings before interest, tax, depreciation, intangibles amortisation,
goodwill impairment, restructuring costs, non-trading items, IAS 39 adjustment and excludes associates
• Note: 31 December 07 includes Americas beverages business
• 30 June 2008 EBITDA, EBIT and net interest on a continuing groupbasis

47

Todd StitzerChief Executive Officer
Summary and Close

First Half 2008: Summary
• Strong first revenue and margin performance
• Revenues ahead of goal range
– Strong growth across all categories
• Excellent margin progress
– Tight cost control
– Good price realisation
– Positive mix
• Benefits of VIA cost reduction
49

2008 Outlook
• Confectionery: a highly defensive category
• Demand has remained strong
• Cycling demanding 2H 2007 comparatives
• Strong revenue momentum and commercial programmes
• Detailed cost reduction plans
50
Revenues around top end of goal range
Margins in line with market consensus

Conclusion
• Revisiting cost structure
• Reviewing management talent pool
• Reappraising portfolio of assets and businesses
• Maintaining commitment to marketing and innovation
51
Underpinning commitment to mid-teens
margins by 2011

52

Supplementary Information
53

Sales Analysis
Half year (£m) 2007 Base Business M&A FXeffects
2008
BIMA 717 33 (26) 9 733
Europe 391 10 34 61 496
Americas 651 81 (15) 32 749
Asia Pacific 563 46 (4) 66 671
Central 4 - - - 4
Total Group 2,326 170 (11) 168 2,653
54

Underlying Profit from Operations
Half year (£m) 2007 BaseBusiness
M&A Change in BIC*
FX effects
2008
BIMA 54 14 (2) 1 1 68
Europe 30 - 2 (4) 7 35
Americas 109 30 (1) 1 6 145
Asia Pacific 40 6 (1) 9 7 61
Central costs (65) 11 - (7) - (61)
Total 168 61 (2) - 21 248
Underlying profit from operations before associates, intangibles amortisation, goodwill impairment, restructuring, non-trading items and IAS39 adjustment* Business improvement costs 55

Re-presented FY07 Income Statement, 1H and FY
Re-presented 2007 1H FY#
Revenue 2,326 5,093
Underlying profit from operations* 168 497
Associates 5 8
Net finance cost (20) (50)
Underlying profit before tax* 153 455
Restructuring (34) (165)
Amortisation and impairment (15) (18)
Non-trading items (2) 2
IAS 39 adjustment 10 4
Reported profit before tax 112 278
Taxation (48) (112)
Discontinued operations 118 241
Minorities - (2)
Reported earnings 182 405
* Before intangibles amortisation, goodwill impairment, restructuring, non-trading items and IAS39 adjustment
# 2007 results have been re-presented to include Americas Beverages within discontinued operations 56

EPS Drivers
Half year (£m) Continuing ops UEPS pro forma %
2007 8.0p -
Base business growth 3.4p 42%
Acquisitions and disposals (0.6)p (7)%
Foreign exchange 1.0p 12%
Change in number of shares (0.1)p (1)%
2008 11.7p 46%
57

Technical Guidance
FY 2008
Ongoing business improvement cost: c. 0.5% of revenue
Capital expenditure (confectionery only, incl. VIA) c£400m
VIA restructuring (P&L): c. £130m
Underlying net interest rate: 6.0%
Underlying tax rate: circa 29%
58

Separation costs
Separation costs recognised in 2007 P&L £45m
2008 separation costs P&L impact (all 1H) – discontinued: £98m
2008 confectionery separation costs P&L impact (all 1H) – restructuring: £14m
Total separation costs (P&L) £157m
Net finance and tax benefit £(14)m
Net total P&L impact £143m
Separation costs (cash, 2007) £35m
Separation costs (cash, 1H 2008) £150m
Separation costs expected in H2(1) £40m
Total separation costs – cash(2) £260m
(1) Separation costs expected in H2 and those settled by DPSG(2) Includes c. £35m costs paid post separation by DPSG. Net impact of post 2008 separation
cash flows broadly neutral 59

Non-Trading Items
Half year (£m) 2007 2008
Disposal of properties 14 1
Disposal of non-core
businesses(4) (7)
Impairment of China
property, plant and
equipment
(12) -
Reported (2) (6)
60

Balance Sheet
Half year (£m) 2007 2008
Non-current assets 4,372 5,137
Net working capital 95 51
Assets held for sale less associated liabilities 2,851 3
Net retirement benefit liability (66) (18)
Provisions and deferred tax liabilities (387) (458)
Net borrowings – continuing group (3,062) (1,700)
Net assets 3,803 3,015
Ordinary shareholders’ funds 3,793 3,006
Minority interests 10 9
Total capital employed 3,803 3,015
61

Cash FlowHalf Year (£m) 2007 2008
Underlying profit from operations* 425 405
Restructuring (41) (78)
Depreciation 121 126
Other items (20) (12)
Working capital (155) (163)
Cash generated from operations 330 278
Capital expenditure (178) (217)
Disposal of fixed assets 31 4
Interest (81) (105)
Tax (excluding disposals) (138) (87)
Pension funding 38 18
Free cash flow 2 (109)
* Profit from operations before intangibles amortisation, goodwill impairment, restructuring, non-trading items and IAS39 adjustmentIncludes profit from discontinued operations
• 2007 includes full period of Americas beverages, 2008 includes Americas beverages to date of demerger
62

Borrowing Profile
Half year 2007 2008
Debt maturity profile
Less than 1 year 43% 29%
1-3 years 38% 42%
More than 3 years 19% 29%
Fixed rate debt:
% total debt 64% 73%
Average length of fix 2.6yrs 2.2yrs
Average interest rate 4.4% 4.5%
Group average interest rate 5.2% 5.5%
• 2007 includes full period of Americas beverages• 2008 average interest rate on confectionery business only• Note: 2008 figures are as at 30 June 2008, prior to the issue of
the £350m bond 63

Sales, Profits and Borrowings by CurrencyHalf year (£m) 2008 %
Sales generated in:US dollars 290 11%Sterling 496 19%Euro 333 12%Australian dollars 402 15%Other 1,133 43%
Underlying operating profit* generated in:US dollars 49 20%Sterling (25) (10)%Euro 44 18%Australian dollars 35 14%Other 145 58%
Net borrowing held in:US dollars 694 41%Sterling 877 52%Euro 61 3%Other 68 4%
* Profit from operations before intangibles amortisation, restructuring, non-trading items and IAS39 adjustment
64

Exchange Rates
Rate vs Sterling H1 2007average
H1 2008average
% mvtaverage
US $ 1.98 1.99 0.5%
Canadian $ 2.23 1.99 (10.7)%
Euro 1.48 1.30 (12.5)%
Australian $ 2.44 2.15 (11.9)%
South African Rand 14.12 15.10 6.9%
Brazilian Real 4.04 3.37 (16.5)%
Mexican Peso 21.59 21.07 (2.4)%
65


