
2008 Canadian Water Attitudes Survey, courtesy RBC and Unilever Canada. 1© 2008 Ipsos Public Affairs Privileged and confidential
2009 Canadian Water
Attitudes Study
March, 2009
The 2009 Canadian Water Attitudes Study is made available to NGOs and other interested parties, courtesy of RBC and Unilever Canada.
We encourage the broad dissemination of the data and findings of this study, and hope the information helps contribute to a healthy conversation about the value and vulnerability of water in Canada.
You are welcome to refer to, reprint or redistribute this information, and we ask that you attribute the source as the “2009 Canadian Water Attitudes Study, commissioned by RBC and Unilever Canada.”
2008 Canadian Water Attitudes Survey, courtesy RBC and Unilever Canada.
2
About The Canadian Water Attitudes Study
Unilever Unilever, one of the world’s largest consumer products companies, adds vitality to life by meeting everyday needs for nutrition,
hygiene and personal care. Every day, 150 million people choose Unilever brands to feed their families, and to clean themselves and their homes. With a steadfast commitment to water sustainability, Unilever strives to lead by example and remains committed to further reducing its water footprint. For ten years running, Unilever has been acknowledged as the food industry category leader on the Dow Jones Sustainability Index for their environmental policies. For the fourth year running, Unilever was also named amongst the ‘Global 100 Most Sustainable Corporations in the World’ by Corporate Knights and Innovest, an international finance and investment advisory firm. Unilever is also an active participant in several water sustainability programs across Canada including EcoVoyageurs, a national school-based education program in which students are encouraged to reduce their own ‘footprint’ in five key areas - transportation, food, waste, water and packaging. In 2008, Unilever Canada launched Go Blue, a national awareness program which to educate consumers about steps they can take to conserve water in their daily lives. For more information, visit www.unilever.com.
RBC Canada’s largest bank as measured by assets and market capitalization, RBC is also one of North America’s leading diversified
financial services companies and among the largest banks in the world, as measured by market capitalization. It employs more than 80,000 full- and part-time employees who serve more than 18 million personal, business, public sector and institutional clients through offices in Canada, the U.S. and 52 other countries. RBC is listed on the 2008-2009 Dow Jones Sustainability Index, recognizing the world’s financial, social and environmental corporate leaders, as well as the Jantzi Social Index and the FTSE4Good Index. The company was recently named to the “Global 100: Most Sustainable Corporations in the World” 2009 list. RBC was also among 67 companies and one of only 18 financial institutions worldwide named to the Carbon Disclosure Leadership Index 2008, a prestigious honour roll of world leaders at understanding and managing the financial risks and opportunities resulting from climate change. In 2007, RBC launched the RBC Blue Water Project, a 10-year, $50 million philanthropic commitment to supporting organizations that protect watersheds and ensure access to clean drinking water. For more information, visit www.rbc.com/bluewater.
The 2009 Canadian Water Attitudes Study was commissioned by Unilever Canada and RBC, and administered by Ipsos Reid from February 5 to 12, 2009. It included a sample of 2,165 adult Canadians from the general population across Canada. The results are considered accurate to within ± 2.2 per cent 19 times out of 20, of what the results would have been had the entire adult population in Canada been polled. The data were weighted by region, age and sex according to 2006 Census data.

2008 Canadian Water Attitudes Survey, courtesy RBC and Unilever Canada.
3
Executive Summary
Water as an Important Environmental Concern• There is still a ways to go to raise the profile of water as a top environmental issue in the minds of
Canadians. When prompted, Canadians are concerned about the quality and quantity of Canada’s freshwater supply, yet when judged against other environmental concerns, water quality/pollution comes in third behind climate change and air pollution. Generally speaking, Canadians are more likely to be concerned with the quality of water than the supply of water.
Quality of Water• While most Canadians remain at least somewhat confident in the safety of Canada’s fresh water
supply, both in general and in their homes, Canadians are less confident about the quality and safety of Canada’s water supply compared to a year ago. The majority drinks their municipality’s tap water, however half of these filter their tap water before drinking. Most have not noticed any changes to the quality of their water supply, but among those that have, they are more likely to report negative changes in the quality.
Supply of Water• Canadians are becoming less confident in the supply of Canada’s freshwater supply. Nearly all
Canadians agree that Canada has one of the largest supplies of freshwater, and understand that parts of the world are facing a water crisis. Most believe that without good conservation habits, Canada could be at risk of a water shortage as well.
• Canadians are divided on what the largest threat is to our water supply and underestimate that impact that personal or household use has on our supply. Most Canadians believe that they use less water than the average Canadian, and upon hearing the actual average personal consumption level, concern increases. While individuals think they do reasonably well conserving water, they do not think the same about everybody else.

2008 Canadian Water Attitudes Survey, courtesy RBC and Unilever Canada.
4
Executive Summary
Water Conservation Habits• There has been no increase in reported conservation habits over the past year, despite an increased
belief in the importance of doing so. While Canadians think that it is important to do a wide range of
things around the home in order to conserve water, their reported incidence of following through on
these things is much lower.
• Slightly more Canadians know than don’t know the amount that they pay for water in their home. But
more know the amount of money they pay each month for electricity than water. In this vein, while the
majority says that they put an equal amount of effort into conserving water as they do energy, among
those who don’t, more Canadians say that make a greater effort to conserve electricity than water. A
plurality believes that more education would be the key to helping them conserve more water.
Corporate Actions• One-in-ten Canadians say they have boycotted a company as a result of learning they misused water.
Two in ten say they began supporting a company because they learned that company used water
responsibly.
• There is no corporate leader in water protection or conservation. One in ten Canadians are aware of
RBC and Unilever’s efforts to raise the profile of water protection and conservation. When told of their
respective initiatives, the vast majority of Canadians support their involvement in water
conservation/protection programs. There is upside potential for being recognized for these initiatives.
Three-quarters of Canadians say they feel more favourable toward these companies as a result of
learning that they were involved in the initiatives (roughly one-third much more favourable).

2008 Canadian Water Attitudes Survey, courtesy RBC and Unilever Canada.
5
Concern for Issues
Healthcare trumps other concerns below, but concern for water is relatively high when prompted.
Question: Below is a list of issues that you might be concerned about. For each, please tell me the degree to which you are or are not concerned.Base: All Respondents 2009 n=2165, 2008 n=2309
62%
61%
45%
22%
45%
43%
41%
41%
35%
28%
38%
32%
35%
22%
23%
23%
31%
33%
40%
48%
40%
41%
42%
41%
46%
51%
42%
46%
45%
47%
42%
43%
92%
94%
85%
70%
84%
84%
83%
82%
81%
79%
80%
78%
80%
69%
64%
66%
Availability of adequate health care in Canada
2008
Stability of the financial markets
2008The long-term supply/quality of Canada's fresh
water2008
Global warming and climate change
2008
Global poverty and its implications
2008
Canada's public education system
2008
The value of the Canadian Dollar
2008
The mission in Afghanistan
2008
Very concerned Somewhat concernedB
ritish C
olu
mb
ia
Alb
erta
Prairies
On
tario
Qu
ebec
Atlan
tic
93% 94% 88% 93% 93% 92%
90% 91% 86% 90% 72% 82%
86% 85% 85% 86% 80% 88%
83% 78% 83% 82% 86% 81%
85% 83% 89% 78% 78% 86%
83% 84% 75% 82% 75% 85%
85% 88% 78% 84% 64% 90%
73% 73% 75% 67% 45% 80%

2008 Canadian Water Attitudes Survey, courtesy RBC and Unilever Canada.
6
Most Concerning Environmental Issues (unaided)
Question: Now, thinking specifically about the environment, what two issues would you say you’re most concerned about?Base: All Respondents n = 2165
TOTAL
43%
21%20%
15%11%
11%9%
9%9%
6%
6%6%
4%4%4%4%
3%3%
3%2%2%2%
2%
2%2%1%1%
1%1%
10%2%
Global warming/ climate change
Air pollution/ smogWater pollution/ water quality
Pollution (general)
Fresh water supply/ water conservationWaste management/ landfills
Deforestation
Wildlife/ earth destructionRecycling
Natural resources depletion
Greenhouse gases/ carbon emissionsWater (unspecified)
Energy issues/ using renewable energy
Healthcare/ health problemsOzone layer depletion
Industrial pollution/ chemical use/ tarsandsPeople/ companies/ government indifference
Economy/ economic crisis
Dependency on fossil fuels/ oil/ gasToo many cars/ car pollution
Overconsumption/ overpopulation
Food supply/ qualityPoverty/ unemployment
Use of plastic/ overpackaging
Environment (general)Political manipulation using environment as an excuse
The future of our planet/ of humanity
EducationNoneOther
(Dk/Ns)
Water is the number three environmental issue behind climate change and air pollution that Canadians are most concerned about, unaided.

2008 Canadian Water Attitudes Survey, courtesy RBC and Unilever Canada.
7
Most Concerning Environmental Issues (aided)
Question: Once again focusing specifically on the environment, from the list below, please select the two issues below that you’re most concerned about:Base: All Respondents n = 2165
46%
40%
24%
22%
21%
18%
16%
9%
2%
Global warming and climate change
Pollution of the air
The long-term supply of fresh water in Canada
The quality of drinking water in Canada
Depleting Canada's supply of non-renewable natural resources
The effects of humans on animals and their habitat
The actions of government on protecting the environment
The state of sensitive eco-systems
None of these issues concern me
British
Co
lum
bia
Alb
erta
Prairies
On
tario
Qu
ebec
Atlan
tic
44% 41% 38% 42% 58% 42%
34% 33% 35% 44% 42% 38%
27% 35% 34% 23% 17% 21%
14% 17% 24% 22% 27% 24%
28% 22% 21% 23% 12% 25%
18% 20% 12% 19% 16% 20%
16% 19% 21% 14% 18% 15%
14% 9% 12% 8% 8% 7%
2% 3% 2% 3% 1% 4%
Global warming/climate change and air pollution concern come ahead of concern for water, but concern remains high when compared to other resources.
46%
2008 Canadian Water Attitudes Survey, courtesy RBC and Unilever Canada.
8
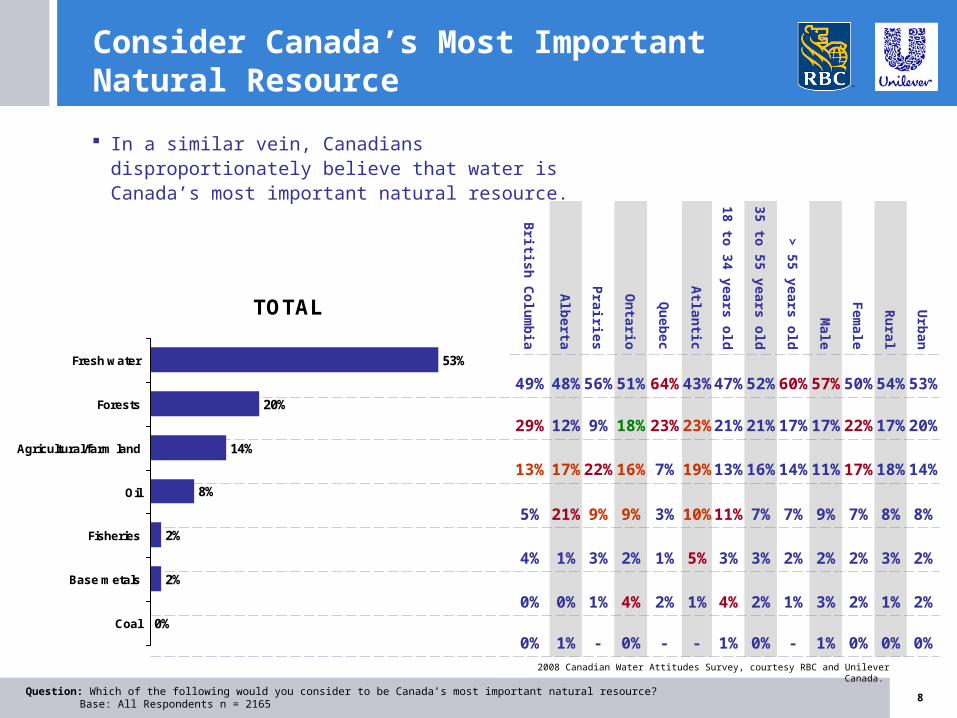
Consider Canada’s Most ImportantNatural Resource
Question: Which of the following would you consider to be Canada’s most important natural resource?Base: All Respondents n = 2165
TOTAL
53%
20%
14%
8%
2%
2%
0%
Fresh water
Forests
Agricultural/farm land
Oil
Fisheries
Base metals
Coal
British
Co
lum
bia
Alb
erta
Prairies
On
tario
Qu
ebec
Atlan
tic
18 to 34 years o
ld
35 to 55 years o
ld
> 55 years o
ld
Male
Fem
ale
Ru
ral
Urb
an
49% 48% 56% 51% 64% 43% 47% 52% 60% 57% 50% 54% 53%
29% 12% 9% 18% 23% 23% 21% 21% 17% 17% 22% 17% 20%
13% 17% 22% 16% 7% 19% 13% 16% 14% 11% 17% 18% 14%
5% 21% 9% 9% 3% 10% 11% 7% 7% 9% 7% 8% 8%
4% 1% 3% 2% 1% 5% 3% 3% 2% 2% 2% 3% 2%
0% 0% 1% 4% 2% 1% 4% 2% 1% 3% 2% 1% 2%
0% 1% - 0% - - 1% 0% - 1% 0% 0% 0%
In a similar vein, Canadians disproportionately believe that water is Canada’s most important natural resource.

2008 Canadian Water Attitudes Survey, courtesy RBC and Unilever Canada.
9
61%
49%
57%
41%
35%
18%
8%
32%
43%
33%
46%
48%
44%
38%
33%
93%
92%
91%
86%
83%
61%
46%
39%6%
Quality Canada's fresh water
Canada's forests
Availability Canada's fresh water
Canada's agricultural land/farm land
Canada's fisheries/fish stock
Canada's oil reserves
Canada's metals - copper and nickel
Canada's coal resources
Concern for Natural Resources
Question: How concerned are you about the declining state of following?Base: All Respondents n = 2165
British
Co
lum
bia
Alb
erta
Prairies
On
tario
Qu
ebec
Atlan
tic
18 to 34 years o
ld
35 to 55 years o
ld
> 55 years o
ld
Male
Fem
ale
Ru
ral
Urb
an
92% 92%95% 93%92%92% 89% 93%95% 91% 94%95%92%
92% 91%90% 93%90%94% 91% 91%93% 91% 92%93%91%
94% 87%92% 92%88%93% 87% 91%94% 88% 94%92%90%
89% 89%84% 90%77%89% 81% 86%91% 83% 89%89%86%
90% 85%81% 85%75%86% 75% 82%91% 82% 85%84%83%
67% 71%64% 68%41%69% 59% 60%65% 55% 67%68%60%
56% 48%51% 52%24%56% 47% 41%50% 42% 49%47%46%
47% 49%43% 47%14%50% 42% 36%40% 31% 46%46%38%
When stacked against other resources in Canada, more are concerned about the declining state of water than any other resources listed.

2008 Canadian Water Attitudes Survey, courtesy RBC and Unilever Canada.
10
29%
28%
18%
12%
6%
4%
2%
0%
0%
Quality of Canada's fresh water
Availability of Canada's fresh water
Canada's forests
Canada's agricultural land/farm land
Canada's oil reserves
Canada's fisheries
None of these issues concern me
Canada's coal resources
Canada's metals - copper and nickel
Most Concerned About…
Question: And, which are you most concerned about? Base: All Respondents n = 2165
British
Co
lum
bia
Alb
erta
Prairies
On
tario
Qu
ebec
Atlan
tic
18 to 34 years o
ld
35 to 55 years o
ld
> 55 years o
ld
Male
Fem
ale
Ru
ral
Urb
an
23% 23% 30% 30% 34% 25% 23% 31% 32% 30% 28% 29% 29%
27% 35% 34% 26% 27% 27% 24% 28% 32% 26% 29% 31% 27%
25% 16% 12% 16% 23% 15% 26% 18% 12% 18% 19% 14% 19%
13% 11% 10% 15% 7% 12% 10% 11% 14% 10% 14% 14% 12%
4% 7% 9% 8% 3% 4% 8% 5% 4% 7% 5% 6% 6%
5% 5% 3% 3% 4% 11% 5% 4% 4% 6% 3% 3% 5%
3% 4% 3% 2% 1% 5% 2% 3% 1% 3% 2% 1% 2%
1% 1% - 0% 0% 1% 1% 0% 0% 1% 0% 1% 0%
- - - 1% - - 0% 0% 0% 0% 0% 0% 0%
Once again, water is placed ahead of other natural resources, with concern for availability and quality roughly equal.
57%

2008 Canadian Water Attitudes Survey, courtesy RBC and Unilever Canada.
11
Level of Confidence That Canada Has Enough Fresh Water to Meet Long-Term Goals
Question: Now, thinking specifically about Canada’s supply of fresh water, how confident are you that Canada as a whole has enough freshwater to meet our long-term needs?Base: All Respondents 2009 n = 2165, 2008 n = 2309
Confidence that Canada has enough freshwater supply for the long-term has declined. Quebecers are disproportionately less confident in Canada’s long-term supply of fresh water and women are less
confident than men.
15%
16%
11%
15%
18%
11%
16%
13%
22%
11%
16%
55%
56%
57%
57%
62%
56%
47%
56%
51%
55%
58%
55%
54%
57%
54%
77%
74%
58%
73%
67%
68%
73%
77%
62%
68%
70%
8%
16%
17%
25%
Total 2009
2008
British Columbia
Alberta
PrairiesOntario
Quebec
Atlantic
18 to 34 years old
35 to 55 years old
Older than 55 years old
Male
Female
Rural
Urban
Very confident Somewhat confident
81%
70%
68%
73%

2008 Canadian Water Attitudes Survey, courtesy RBC and Unilever Canada.
12
22%
29%14%
25%24%
18%
22%20%
29%
22%22%
52%52%
52%53%
58%52%
50%50%
52%52%
52%
50%54%
50%53%
74%84%
81%67%
83%76%
68%76%
74%72%
77%
80%69%
72%75%
32%
26%
25%
16%
Total 20092008
British ColumbiaAlbertaPrairiesOntarioQuebecAtlantic
18 to 34 years old35 to 55 years old
Older than 55 years old
MaleFemale
RuralUrban
Very confident Somewhat confident
Regional Concerns
Question: And focusing specifically on your region of Canada, how confident are you that it has enough freshwater to meet your region’s long-term needs?Base: All Respondents 2009 n = 2165, 2008 n = 2309
Canadian’s confidence in their region’s available water has also declined over the past year. Canadians tend to be more confident that their region has enough fresh-water to meet their needs than other parts of Canada.

2008 Canadian Water Attitudes Survey, courtesy RBC and Unilever Canada.
13
17%
21%19%18%20%
6%
20%15%
20%
12%17%
55%56%
61%56%61%57%
48%57%
55%56%55%
55%55%
51%56%
81%
82%75%
79%77%
54%74%
75%71%70%
75%69%
64%73%
13%
15%
18%
25%72%Total 2009
2008
British ColumbiaAlbertaPrairiesOntarioQuebecAtlantic
18 to 34 years old35 to 55 years old
Older than 55 years old
MaleFemale
RuralUrban
Very confident Somewhat confident
Confidence in the Safety of Water
Question: Overall, How confident are you about the safety and quality of Canada’s drinking water?Base: All Respondents 2009 n = 2165, 2008 n = 2309
Confidence in the safety of Canada’s water supply has also declined over the past year. Quebecers are also less confident in the safety of their water as are rural Canadians.
2008 Canadian Water Attitudes Survey, courtesy RBC and Unilever Canada.
14
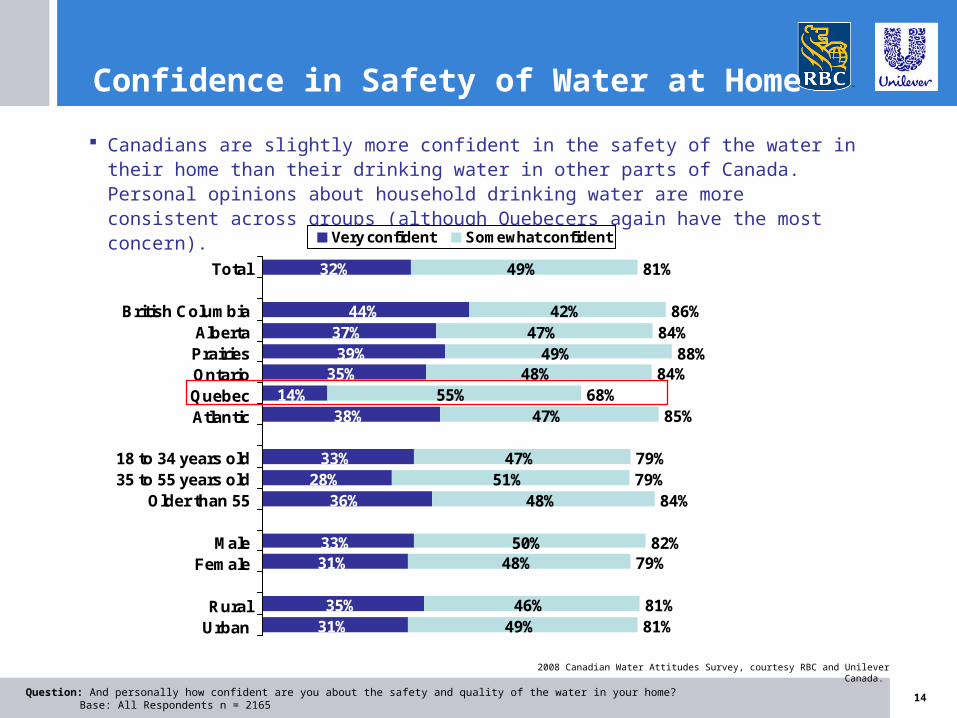
Confidence in Safety of Water at Home
Question: And personally how confident are you about the safety and quality of the water in your home?Base: All Respondents n = 2165
Canadians are slightly more confident in the safety of the water in their home than their drinking water in other parts of Canada. Personal opinions about household drinking water are more consistent across groups (although Quebecers again have the most concern).
32%
44%37%39%
35%14%
38%
33%28%
36%
33%31%
35%31%
49%
42%47%
49%48%
55%47%
47%51%
48%
50%48%
46%49%
81%
86%84%
88%84%
68%85%
79%79%
84%
82%79%
81%81%
Total
British ColumbiaAlbertaPrairiesOntarioQuebecAtlantic
18 to 34 years old35 to 55 years old
Older than 55
MaleFemale
RuralUrban
Very confident Somewhat confident

2008 Canadian Water Attitudes Survey, courtesy RBC and Unilever Canada.
15
Noticeable Changes to Quality of Water
Question: Have you personally noticed any recent changes to the quality of your tap water?Base: All Respondents n = 2165
Most Canadians have not noticed any changes to the quality of their tap water. However, by a 3:1 ratio, more have noticed changes for the worse than for the better.
7%
9%
9%
8%
3%
9%
10%
5%
6%
8%
5%
6%
7%
20%
19%
23%
14%
20%
21%
19%
18%
22%
18%
18%
22%
17%
20%
74%
72%
68%
73%
76%
72%
73%
73%
75%
74%
73%
77%
73%
7%
0
0
0
78%
Total
British ColumbiaAlbertaPrairiesOntarioQuebecAtlantic
18 to 34 years old35 to 55 years old
Older than 55
MaleFemale
RuralUrban
Yes - for the Better Yes - For the Worse No - not at alll

2008 Canadian Water Attitudes Survey, courtesy RBC and Unilever Canada.
16
Drinking Water in the Home
Question: In your home, what source of water do you typically drink?Base: All Respondents n = 2165
While most (68%) Canadians still typically drink their tap water, only four in ten drink it directly from the tap. One-third of Canadians do not drink the tap water in their home.
41%
27%
17%
12%
5%
Tap water (directly from the tap)
Filtered water (from the tap, butthrough another filtering system)
Water from a large-jug cooler
Individually-sized bottled water
Some other source (PLEASE SPECIFY)
British
Co
lum
bia
Alb
erta
Prairies
On
tario
Qu
ebec
Atlan
tic
18 to 34 years o
ld
35 to 55 years o
ld
> 55 years o
ld
Male
Fem
ale
Ru
ral
Urb
an
45% 41% 35% 34% 52% 32% 40% 42% 39% 44% 37% 36% 42%
29% 28% 29% 33% 13% 36% 31% 23% 29% 25% 30% 24% 28%
13% 19% 28% 15% 20% 21% 14% 19% 18% 16% 19% 26% 16%
9% 7% 6% 15% 12% 8% 13% 13% 10% 12% 11% 8% 13%
5% 6% 3% 4% 5% 6% 4% 5% 5% 4% 5% 9% 4%

2008 Canadian Water Attitudes Survey, courtesy RBC and Unilever Canada.
17
Attitudes Towards Canada’s Fresh Water
Question: Do you agree or disagree with following statementsBase: All Respondents n = 2165
44%
43%
33%
20%
19%
17%
48%
46%
50%
55%
47%
20%
91%
89%
84%
75%
66%
37%
Canada has more fresh water thanmost other places in the world.
There is a growing fresh watercrisis on the planet.
Without good conservation habits,Canada will have a fresh water
shortage in the future.
Canada is at risk of a fresh waterquality problem.
Canada is at risk of fresh watersupply shortages
I don't generally drink tap water athome because I worry about the
quality of the water.
Strongly agree Somewhat agree
British
Co
lum
bia
Alb
erta
Prairies
On
tario
Qu
ebec
Atlan
tic
18 to 34 years o
ld
35 to 55 years o
ld
> 55 years o
ld
Male
Fem
ale
Ru
ral
Urb
an
91% 92% 89% 91% 92% 91% 90% 91% 92% 94% 89% 91% 92%
89% 92% 89% 90% 85% 94% 85% 90% 92% 89% 89% 88% 89%
85% 91% 79% 84% 81% 84% 83% 85% 84% 80% 87% 85% 83%
74% 81% 75% 74% 76% 74% 71% 77% 77% 71% 79% 79% 74%
71% 75% 68% 66% 57% 73% 66% 65% 67% 58% 74% 71% 65%
35% 42% 30% 41% 32% 40% 43% 37% 33% 37% 38% 35% 38%
Most believe that there is a growing fresh water crisis on the planet, and that we’re at risk of a shortage. Slightly more Canadians agree that we are at risk of a quality problem than supply shortages. A large majority of Canadians believe that good conservation habits are needed to avoid a shortage.

2008 Canadian Water Attitudes Survey, courtesy RBC and Unilever Canada.
18
Biggest Threat to Canada’sFresh Water Supply
Question: What do you think is the biggest threat to Canada’s freshwater supply? [select one only]Base: All Respondents 2009 n = 2165, 2008 n = 2309
TOTAL
19%
17%
12%
12%
8%
8%
8%
7%
6%
3%
1%
19%
28%
15%
10%
7%
4%
Run-off of pollutants from land to water
Mass exports of water to the U.S.
Illegal dumping of toxins
Mismanagement of water by municipal, provincial andfederal governments
Global warming and climate change
Wasteful use by industrial companies
Lack of knowledge about Canada's freshwater
The legal release of toxins
Wasteful use by individual consumers
Inadequate infrastructure
Wasteful use by agriculture
2009
2008
Canadians continue to believe that pollutants and mass exports to the US are the biggest threat to Canada’s fresh water supply. Only 6% unaided mention individual consumers as a top threat.

2008 Canadian Water Attitudes Survey, courtesy RBC and Unilever Canada.
19
Impact of Climate Change on Canada’s Supply and Quality of Fresh Water
Question: What impact, if any do you believe climate change will have on Canada’s supply and quality of fresh water?Base: All Respondents n = 2165
71%
18%
12%
Negative impact
No impact
Positive impact
British
Co
lum
bia
Alb
erta
Prairies
On
tario
Qu
ebec
Atlan
tic
18 to 34 years o
ld
35 to 55 years o
ld
> 55 years o
ld
Male
Fem
ale
Ru
ral
Urb
an
70% 72% 68% 67% 79% 68% 72% 73% 67% 68% 74% 72% 70%
19% 17% 22% 19% 13% 22% 16% 17% 20% 20% 16% 17% 18%
11% 11% 10% 15% 9% 11% 12% 10% 14% 13% 11% 11% 12%
Most believe that climate change will have a negative impact on Canada’s supply and quality of fresh water. However, roughly one in eight (12%) believe that the impact will be positive for Canada.

2008 Canadian Water Attitudes Survey, courtesy RBC and Unilever Canada.
20
Awareness of Any Laws or Regulations That Protect Canada’s Supply of Fresh Water
Question: Are you aware of any laws or regulations that protect Canada’s supply of freshwater?Base: All Respondents n = 2165
77%
23%
No
Yes
British
Co
lum
bia
Alb
erta
Prairies
On
tario
Qu
ebec
Atlan
tic
18 to 34 years o
ld
35 to 55 years o
ld
> 55 years o
ld
Male
Fem
ale
Ru
ral
Urb
an
71% 77% 69% 73% 89% 73% 75% 81% 73% 72% 81% 78% 76%
29% 23% 31% 28% 11% 27% 25% 19% 27% 28% 19% 22% 24%
Canadians are by and large unaware of any laws or regulations that protect Canada’s supply of fresh water.

2008 Canadian Water Attitudes Survey, courtesy RBC and Unilever Canada.
21
Largest Water Consumers
Question: Which one of the following do you believe uses the most fresh water?Base: All Respondents n = 2165
48%
37%
15%
Canada's Industriesand Businesses (e.g
manufacturing,energy,
telecommunicationsetc)
Canadian households
Canada's agriculturalsector (farms)
British
Co
lum
bia
Alb
erta
Prairies
On
tario
Qu
ebec
Atlan
tic
18 to 34 years o
ld
35 to 55 years o
ld
> 55 years o
ld
Male
Fem
ale
Ru
ral
Urb
an
34% 46% 44% 48% 57% 45% 43% 49% 51% 49% 47% 53% 47%
44% 40% 34% 39% 28% 41% 36% 37% 39% 37% 37% 35% 37%
22% 14% 22% 13% 15% 14% 22% 15% 11% 15% 16% 12% 16%
More Canadians believe industry and business uses more water than households. This could suggest a “not my fault” attitude.

2008 Canadian Water Attitudes Survey, courtesy RBC and Unilever Canada.
22
Total Amount of Water You Use Personally in an Average Day
Question: If you had to guess, what do you think is the total amount of water you personally use in an average day including drinking, showering, bathing, toilet flushing, laundry, dish washing etc. Base: All Respondents n = 2165
23%
15%
11%
10%
3%
38%
100 litres or more
1 to 24 litres
25 to 49 litres
50 to 74 litres
75 to 99 litres
Don't Know
MEAN
British
Co
lum
bia
Alb
erta
Prairies
On
tario
Qu
ebec
Atlan
tic
18 to 34 years o
ld
35 to 55 years o
ld
> 55 years o
ld
Male
Fem
ale
Ru
ral
Urb
an
24% 23% 25% 21% 25% 24% 22% 23% 24% 29% 18% 29% 22%
13% 14% 10% 17% 14% 17% 20% 14% 11% 17% 13% 11% 16%
10% 13% 11% 12% 12% 4% 13% 11% 10% 14% 9% 9% 11%
7% 9% 12% 10% 11% 5% 9% 9% 10% 11% 9% 10% 10%
4% 2% 3% 3% 4% 5% 4% 3% 3% 4% 3% 3% 3%
42% 39% 40% 38% 34% 46% 32% 40% 41% 26% 50% 39% 38%
66 litres a day 69 69 73 61 72 52 68 63 66 78 54 75 64
On average, Canadians think they use 66 litres of water, on average, each day.
Correct answer

2008 Canadian Water Attitudes Survey, courtesy RBC and Unilever Canada.
23
Level of Concern About Canadian’s Water Usage
Question: In fact, Canadians on average use 329 liters of water per person, each day. This is twice the amount used by Europeans who enjoy a similar standard of living. How concerned are you about Canadians’ water usage? Base: All Respondents n = 2165
41% 49% 90%
Very concerned Somewhat concerned
British
Co
lum
bia
Alb
erta
Prairies
On
tario
Qu
ebec
Atlan
tic
18 to 34 years o
ld
35 to 55 years o
ld
> 55 years o
ld
Male
Fem
ale
Ru
ral
Urb
an
93% 90% 89% 90% 89% 87% 91% 90% 88% 86% 93% 92% 89%
After hearing about the average Canadian’s use of water (329 litres), most are concerned about Canadians’ water usage.

2008 Canadian Water Attitudes Survey, courtesy RBC and Unilever Canada.
24
TOTAL
36%
24%
23%
14%
12%
8%
8%
8%
8%
7%
6%
3%
3%
2%
1%
3%
6%
7%
Less/ shorter showers
Don't leave the tap running (while brushing teeth, etc.)
Low flush toilets/ flush less
Do laundry less frequently/ do only full loads
Wash dishes less often/ wash dishes by hand
Reduce lawn/ driveway watering
Water efficient appliances
Low flow taps/ shower heads
Use water wisely/ conserve more
I already conserve my useage
Collect and reuse rain water/ grey water (to waterlawns etc.)
Fix leaky taps/ toilets
Less car washing
Use water cooler/ heater
Drink less water
None
Other
(Dk/Ns)
Ideas To Personally Reduce Water Consumption
Question: How do you think you personally could reduce the amount of water you use? Base: All Respondents n = 2165
Conservation in the bathroom leads the list of ideas to personally reduce amount of water used.

2008 Canadian Water Attitudes Survey, courtesy RBC and Unilever Canada.
25
Have a Water Meter
Question: Do you have a water meter?Base: All Respondents n = 2165
39%
52%
9%
Yes
No
DK
British
Co
lum
bia
Alb
erta
Prairies
On
tario
Qu
ebec
Atlan
tic
18 to 34 years o
ld
35 to 55 years o
ld
> 55 years o
ld
Male
Fem
ale
Ru
ral
Urb
an
23% 59% 72% 55% 10% 28% 30% 40% 47% 40% 39% 30% 41%
The incidence of water meters in homes varies greatly across the country.

2008 Canadian Water Attitudes Survey, courtesy RBC and Unilever Canada.
26
Knowledge of Monthly Water Bill
Question: Do you know how much you pay for the following each month?Base: All Respondents n = 2165
40%
34%
26%
Yes
No
The fee isincludedin my
rental/condo fees
Among those whose water bill is not included in their rental/condo fees, more (54%) know than don’t know (46%) how much they pay.
British
Co
lum
bia
Alb
erta
Prairies
On
tario
Qu
ebec
Atlan
tic
18 to 34 years o
ld
35 to 55 years o
ld
> 55 years o
ld
Male
Fem
ale
Ru
ral
Urb
an
29% 59% 63% 51% 17% 38% 27% 41% 51% 41% 40% 47% 39%
40% 16% 18% 23% 59% 37% 40% 34% 29% 33% 35% 38% 33%
31% 25% 20% 26% 24% 25% 34% 25% 19% 27% 25% 16% 28%
Those With Water Meter: 70% Yes
Those Without a Meter: 21% Yes

2008 Canadian Water Attitudes Survey, courtesy RBC and Unilever Canada.
27
Consciously Put More Effort Into Reducing Your Energy Consumption or Your Water Consumption
Question: Do you consciously put more effort into reducing your energy consumption (electricity) or your water consumption?Base: All Respondents n = 2165
65%
28%
4%
3%
Both equally
Energy
Neither
Water
Most say they put an equal amount of effort into reducing their energy and water consumption, but significantly more put a greater effort into saving energy than water.
British
Co
lum
bia
Alb
erta
Prairies
On
tario
Qu
ebec
Atlan
tic
18 to 34 years o
ld
35 to 55 years o
ld
> 55 years o
ld
Male
Fem
ale
Ru
ral
Urb
an
64% 70% 64% 59% 76% 51% 56% 66% 70% 61% 68% 63% 65%
31% 24% 29% 34% 17% 33% 33% 28% 24% 29% 27% 31% 27%
2% 4% 5% 4% 4% 10% 5% 4% 3% 5% 3% 4% 4%
3% 2% 2% 4% 3% 6% 6% 2% 2% 4% 2% 3% 3%

2008 Canadian Water Attitudes Survey, courtesy RBC and Unilever Canada.
28
45%
55%
45%
56%
Bath
10-MinuteShower
20092008
British
Co
lum
bia
Alb
erta
Prairies
On
tario
Qu
ebec
Atlan
tic
18 to 34 years o
ld
35 to 55 years o
ld
> 55 years o
ld
Male
Fem
ale
Ru
ral
Urb
an
57% 49% 54% 54% 63% 44% 47% 56% 62% 57% 54% 58% 55%
44% 51% 46% 46% 37% 56% 53% 44% 38% 43% 46% 42% 45%
Bath versus Shower
Question: Which do you think uses more water?Base: All Respondents 2009 n = 2165, 2008 n=2309
Just over half of Canadians correctly know that a bath uses more water than a 10-minute shower.
2008 Canadian Water Attitudes Survey, courtesy RBC and Unilever Canada.
29
British
Co
lum
bia
Alb
erta
Prairies
On
tario
Qu
ebec
Atlan
tic
18 to 34 years o
ld
35 to 55 years o
ld
> 55 years o
ld
Male
Fem
ale
Ru
ral
Urb
an
36% 36% 29% 35% 41% 36% 23%36%49% 41% 33% 40% 36%
38% 42% 37% 39% 36% 37% 39%42%32% 37% 39% 41% 38%
14% 10% 17% 13% 11% 8% 22%11% 6% 11% 13% 6% 14%
5% 3% 1% 4% 2% 10% 8% 2% 1% 3% 4% 3% 4%
5% 8% 10% 6% 9% 8% 4% 7% 11% 5% 10% 8% 7%
37%
38%
12%
4%
7%
43%
39%
9%
2%
6%
1 to 5 minutes
6 to 10 minutes
11 to 15minutes
16 to 20minutes
I don't takeshowers
2009
2008
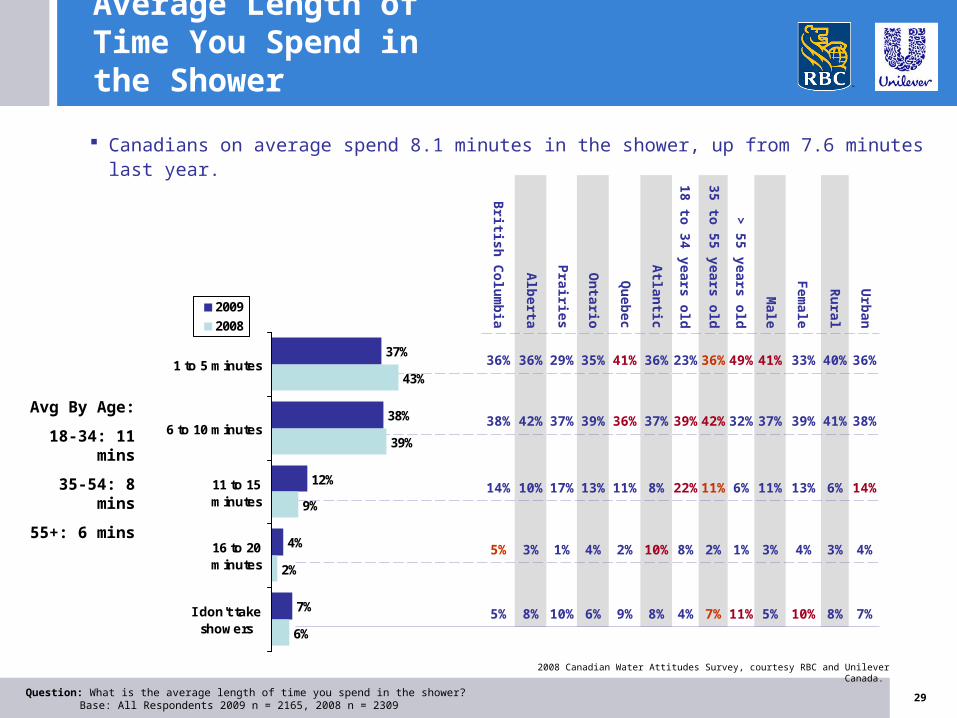
Average Length of Time You Spend in the Shower
Question: What is the average length of time you spend in the shower?Base: All Respondents 2009 n = 2165, 2008 n = 2309
Canadians on average spend 8.1 minutes in the shower, up from 7.6 minutes last year.
Avg By Age:
18-34: 11 mins
35-54: 8 mins
55+: 6 mins
2008 Canadian Water Attitudes Survey, courtesy RBC and Unilever Canada.
30
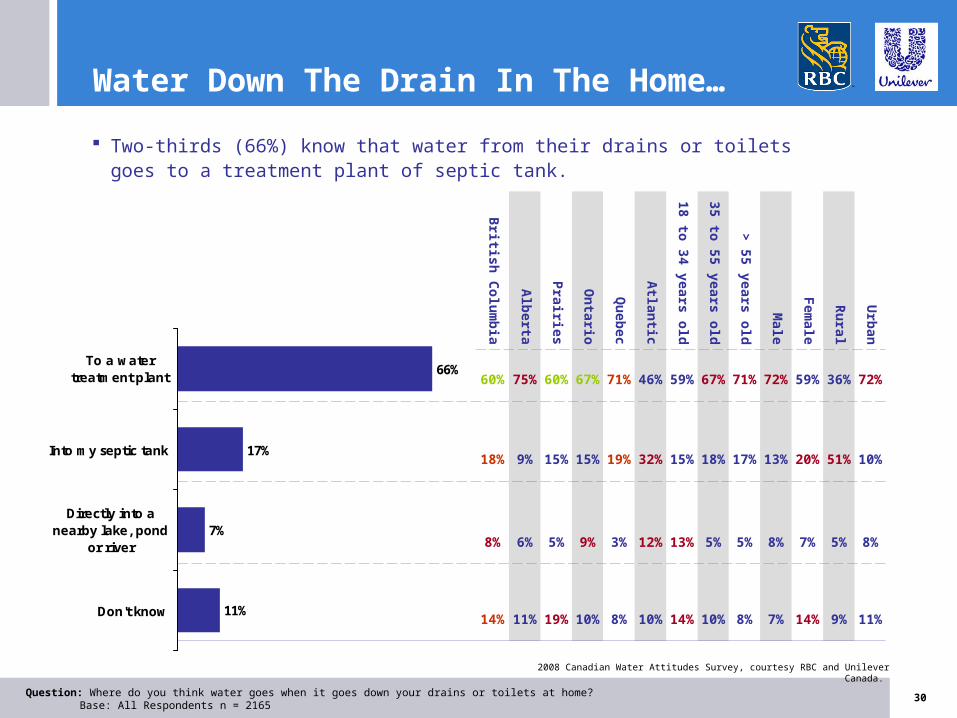
Water Down The Drain In The Home…
Question: Where do you think water goes when it goes down your drains or toilets at home?Base: All Respondents n = 2165
66%
17%
7%
11%
To a watertreatment plant
Into my septic tank
Directly into anearby lake, pond
or river
Don't know
Two-thirds (66%) know that water from their drains or toilets goes to a treatment plant of septic tank.
British
Co
lum
bia
Alb
erta
Prairies
On
tario
Qu
ebec
Atlan
tic
18 to 34 years o
ld
35 to 55 years o
ld
> 55 years o
ld
Male
Fem
ale
Ru
ral
Urb
an
60% 75% 60% 67% 71% 46% 59% 67% 71% 72% 59% 36% 72%
18% 9% 15% 15% 19% 32% 15% 18% 17% 13% 20% 51% 10%
8% 6% 5% 9% 3% 12% 13% 5% 5% 8% 7% 5% 8%
14% 11% 19% 10% 8% 10% 14% 10% 8% 7% 14% 9% 11%
2008 Canadian Water Attitudes Survey, courtesy RBC and Unilever Canada.
31
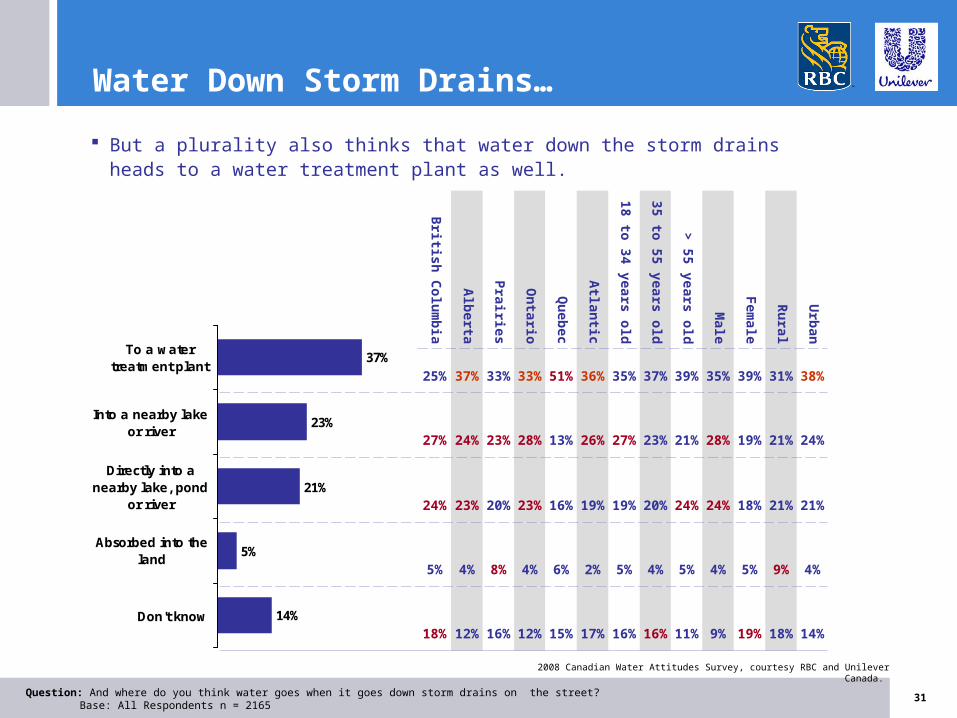
Water Down Storm Drains…
Question: And where do you think water goes when it goes down storm drains on the street?Base: All Respondents n = 2165
37%
23%
21%
5%
14%
To a watertreatment plant
Into a nearby lakeor river
Directly into anearby lake, pond
or river
Absorbed into theland
Don't know
But a plurality also thinks that water down the storm drains heads to a water treatment plant as well.
British
Co
lum
bia
Alb
erta
Prairies
On
tario
Qu
ebec
Atlan
tic
18 to 34 years o
ld
35 to 55 years o
ld
> 55 years o
ld
Male
Fem
ale
Ru
ral
Urb
an
25% 37% 33% 33% 51% 36% 35% 37% 39% 35% 39% 31% 38%
27% 24% 23% 28% 13% 26% 27% 23% 21% 28% 19% 21% 24%
24% 23% 20% 23% 16% 19% 19% 20% 24% 24% 18% 21% 21%
5% 4% 8% 4% 6% 2% 5% 4% 5% 4% 5% 9% 4%
18% 12% 16% 12% 15% 17% 16% 16% 11% 9% 19% 18% 14%
2008 Canadian Water Attitudes Survey, courtesy RBC and Unilever Canada.
32
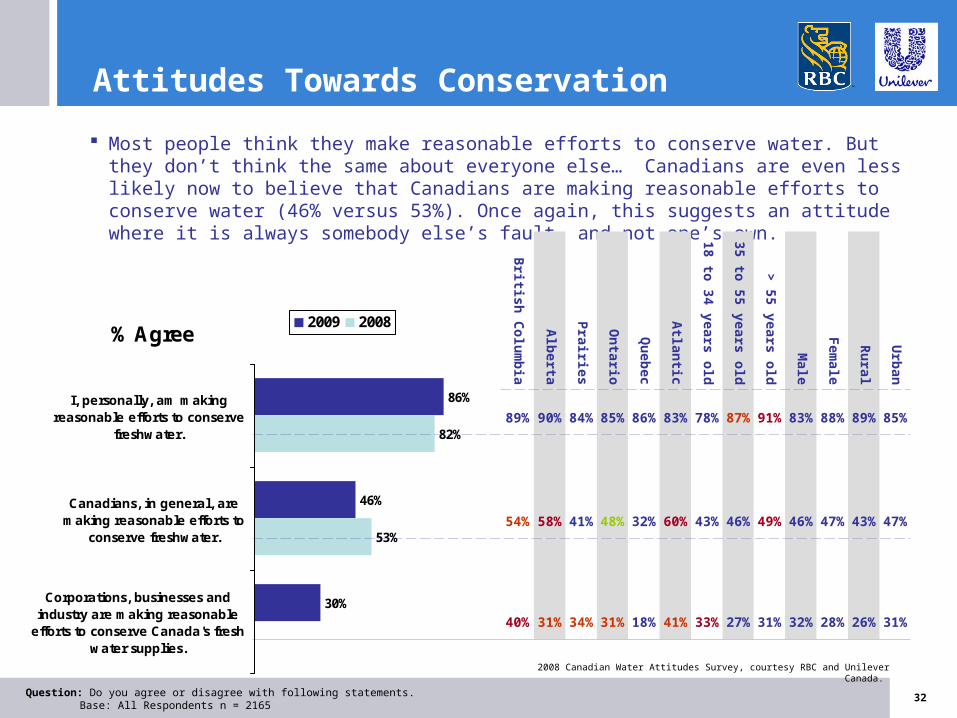
Attitudes Towards Conservation
Question: Do you agree or disagree with following statements.Base: All Respondents n = 2165
% Agree
86%
46%
30%
82%
53%
I, personally, am makingreasonable efforts to conserve
freshwater.
Canadians, in general, aremaking reasonable efforts to
conserve freshwater.
Corporations, businesses andindustry are making reasonable
efforts to conserve Canada's freshwater supplies.
2009 2008
Most people think they make reasonable efforts to conserve water. But they don’t think the same about everyone else… Canadians are even less likely now to believe that Canadians are making reasonable efforts to conserve water (46% versus 53%). Once again, this suggests an attitude where it is always somebody else’s fault, and not one’s own.
British
Co
lum
bia
Alb
erta
Prairies
On
tario
Qu
ebec
Atlan
tic
18 to 34 years o
ld
35 to 55 years o
ld
> 55 years o
ld
Male
Fem
ale
Ru
ral
Urb
an
89% 90% 84% 85% 86% 83% 78% 87% 91% 83% 88% 89% 85%
54% 58% 41% 48% 32% 60% 43% 46% 49% 46% 47% 43% 47%
40% 31% 34% 31% 18% 41% 33% 27% 31% 32% 28% 26% 31%

2008 Canadian Water Attitudes Survey, courtesy RBC and Unilever Canada.
33
Conservation… cont’d
Question: Thinking about water conservation, how important is it to you, personally, to conserve freshwater on an ongoing basis?Base: All Respondents n = 2165
57%
61%
38%
35%
2009
2008
Very important Somewhat important
Most believe it is important to conserve freshwater on an ongoing basis.
British
Co
lum
bia
Alb
erta
Prairies
On
tario
Qu
ebec
Atlan
tic
18 to 34 years o
ld
35 to 55 years o
ld
> 55 years o
ld
Male
Fem
ale
Ru
ral
Urb
an
97% 94% 97% 94% 97% 91% 93% 96% 96% 92% 98% 96% 95%95%
96%
2008 Canadian Water Attitudes Survey, courtesy RBC and Unilever Canada.
34
20%
15%
54%
58%
74%
73%
2009
2008
Try very hard Try reasonably hard
British
Co
lum
bia
Alb
erta
Prairies
On
tario
Qu
ebec
Atlan
tic
18 to 34 years o
ld
35 to 55 years o
ld
> 55 years o
ld
Male
Fem
ale
Ru
ral
Urb
an
72% 77% 67% 70% 84% 65% 64% 77% 79% 72% 76% 80% 73%
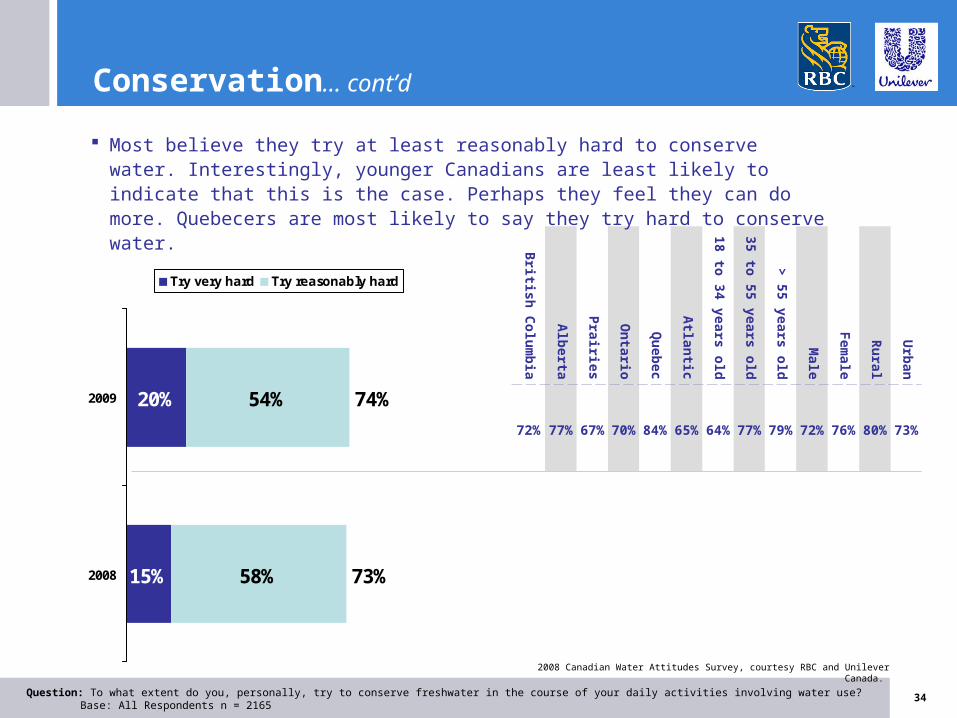
Conservation… cont’d
Question: To what extent do you, personally, try to conserve freshwater in the course of your daily activities involving water use?Base: All Respondents n = 2165
Most believe they try at least reasonably hard to conserve water. Interestingly, younger Canadians are least likely to indicate that this is the case. Perhaps they feel they can do more. Quebecers are most likely to say they try hard to conserve water.

2008 Canadian Water Attitudes Survey, courtesy RBC and Unilever Canada.
35
79%72%
72%61%
64%61%
60%43%
66%59%
62%54%
63%50%
48%38%
55%
51%46%
34%32%
39%
7%5%
18%24%
24%34%
32%36%
34%45%
28%34%
32%36%
30%39%
43%49%
36%
36%40%
45%47%
22%
29%27%
97%96%
96%95%
96%97%
95%88%
94%93%
93%90%
93%89%
91%87%
91%
87%86%
79%79%
61%
36%32%
Avoid unnecessary water use2008
Check your toilet for leaks/ Repair or replace leakyfaucets
2008
Purchase water-efficient appliances2008
Take shorter showers2008
Install low-flow toilets that use less water per flush2008
Install low-flow shower heads2008
Turn-off the water while brushing your teeth2008
Avoid watering your lawn in the summer2008
Washing your car w ith a bucket instead of a hose
Use rain barrels to collect water for use in yourgarden/lawn
2008
Use concentrated household products 2008
Other (specify)
Donate to a registered water charity2008
Very important Somewhat important
The Importance Of Conserving Through Various Activities
Question: How important do you think each of these items is to conserving fresh water?Base: All Respondents 2009 n = 2165, 2008 n = 2309
Importance/knowledge
of simple methods to conserve water such as of avoiding unnecessary water use, correcting leaks, taking shorter showers, installing low-flow toilets, turning off water while brushing teeth, and avoiding watering lawn in summer have all increased over the past year.

2008 Canadian Water Attitudes Survey, courtesy RBC and Unilever Canada.
36
74%76%
53%48%
70%69%
61%58%
52%50%
48%49%
50%51%
57%61%
45%
48%50%
48%
25%25%
5%3%
18%18%
37%41%
20%22%
27%30%
35%37%
36%37%
32%34%
22%21%
29%
22%22%
18%
20%18%
9%7%
94%
90%89%
90%91%
88%88%
88%87%
84%86%
82%85%
79%82%
74%
71%72%
65%
45%43%
14%10%
92%Avoid unnecessary water use2008
Take shorter showers2008
Check your toilet for leaks/ leaky faucets2008
Turn-off the water while brushing your teeth2008
Use concentrated household products 2008
Avoid watering your lawn in the summer2008
Purchase water-efficient appliances2008
Install low-flow shower heads2008
Washing your car with a bucket instead of a hose
Install low-flow toilets that use less water per flush2008
Other (specify)
Use rain barrels to collect water for use in your2008
Donate to a registered water charity2008
Always Sometimes
Actions Speak Louder Than Words
Question: Now, thinking about this same list, what do you do to help conserve freshwater?Base: All Respondents 2009 n = 2165, 2008 n=2309
Conservation habits have not increased over the past year.
There has been little change in the behaviours or actions of Canadians when it comes to conserving water.
Still only half of Canadians take shorter showers or avoid watering their lawn in summer to conserve water.

2008 Canadian Water Attitudes Survey, courtesy RBC and Unilever Canada.
37
30%
15%
11%
11%
9%
9%
8%
7%
1%
33%
20%
10%
13%
8%
More education about ways to conservewater
Rebates from companies
A water shortage
By-laws to control usage/ Enforced waterquotas
More information about how much water isused to make products I purchase
Higher charges for water
Government standards for products thatuse water
Companies leading by example
Celebrity endorsement
2009
2008
Encouraging Conservation
Question: Which of the following would be the most likely to encourage you to conserve more freshwater?Base: All Respondents 2009 n = 2165, 2008 n = 2309
More Canadians say that education, not necessarily rebates, would encourage them to conserve more fresh water. That said, one-quarter of Canadians feel rebates or higher water changes would be the most effective encouragement.
2008 Canadian Water Attitudes Survey, courtesy RBC and Unilever Canada.
38
TOTAL
88%
12%
No
Yes
British
Co
lum
bia
Alb
erta
Prairies
On
tario
Qu
ebec
Atlan
tic
18 to 34 years o
ld
35 to 55 years o
ld
> 55 years o
ld
Male
Fem
ale
Ru
ral
Urb
an
86% 87% 93% 88% 88% 91% 82% 88% 93% 86% 90% 88% 88%
14% 13% 8% 12% 12% 9% 18% 12% 7% 14% 10% 12% 12%
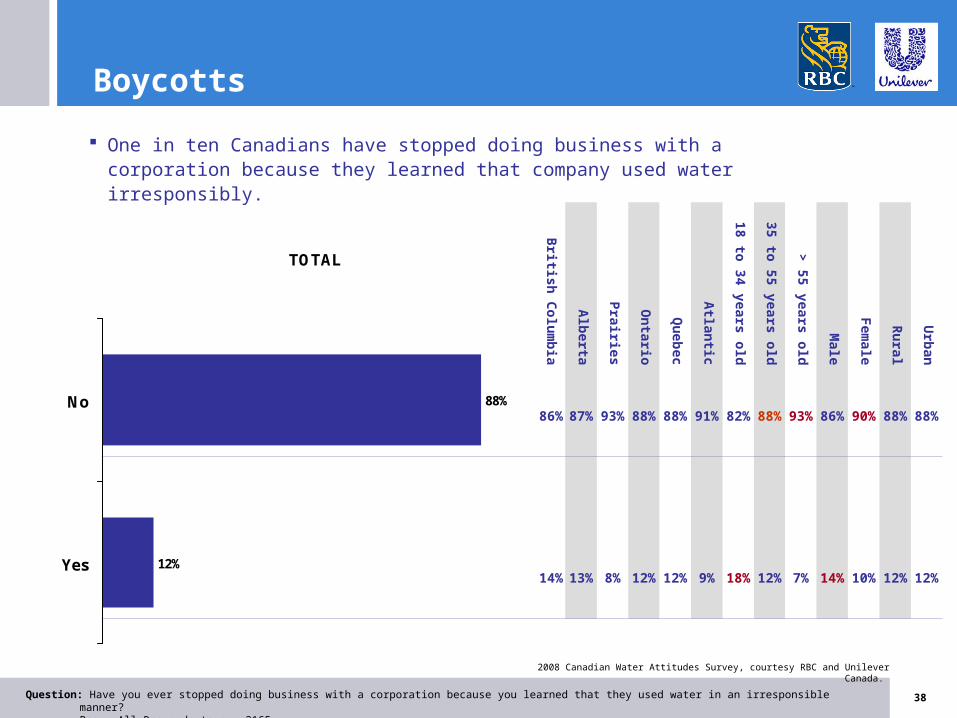
Boycotts
Question: Have you ever stopped doing business with a corporation because you learned that they used water in an irresponsible manner?Base: All Respondents n = 2165
One in ten Canadians have stopped doing business with a corporation because they learned that company used water irresponsibly.

2008 Canadian Water Attitudes Survey, courtesy RBC and Unilever Canada.
39
TOTAL
82%
18%
No
Yes
British
Co
lum
bia
Alb
erta
Prairies
On
tario
Qu
ebec
Atlan
tic
18 to 34 years o
ld
35 to 55 years o
ld
> 55 years o
ld
Male
Fem
ale
Ru
ral
Urb
an
79% 82% 87% 83% 80% 82% 73% 82% 89% 80% 83% 82% 82%
22% 19% 13% 17% 20% 18% 27% 18% 11% 20% 17% 18% 18%
Supporting Companies That Use Water Responsibly
Question: And have you ever decided to do business with a corporation because you learned they used water in a responsible manner?Base: All Respondents n = 2165
Two in ten say they’ve started doing business with a corporation that they learned used water responsibly.


