
2000 AIR EMISSIONS INVENTORY
BADLANDS NATIONAL PARKSOUTH DAKOTA
FINAL
U.S. NATIONAL PARK SERVICE
FEBRUARY 2003

FINAL
2000 AIR EMISSIONS INVENTORY
BADLANDS NATIONAL PARKSOUTH DAKOTA
Prepared for:
National Park ServiceWASO - Air Resources Division12795 West Alameda Parkway
Denver, CO 80228
Prepared by:
EA Engineering, Science, and Technology, Inc.15 Loveton Circle
Sparks, MD 21152(410) 771-4950
FEBRUARY 2003
Cover photo courtesy of the NPS


2000 Air Emission s Inventory Badlands National Park, SD
CONTENTS
National Park Service
ii
February 2003
Page
FIGURES ivTABLES iv
I. INTRODUCTION 1
1.11.21.31.41.5
Background 1Typical Air Emission Sources 1Inventory Methodology 1
Park Description 2Air Quality Status 5
2. STATIONARY AND AREA SOURCE EMISSIONS 6
2.1 Stationary Sources 6
2.1.1 Space and Water Heating Equipment 62.1.2 Generators 62.1.3 Fuel Storage Tanks 9
2.2 Area Sources 1 0
2.1.3 Woodstoves 1 02.2.1 Campfires 1 02.2.2 Wildland Fires and Prescribed Burning 102.2.3 Miscellaneous Area Sources 11
2.3 Summary of Stationary and Area Source Emissions 11
3. MOBILE SOURCE EMISSIONS 13
3.1 Highway Vehicles 13
3.1.1 Visitor Vehicles 133.1.2 NPS Vehicles 15
3.2 Nonroad Vehicles 15
3.2.1 NPS Nonroad Vehicles 153.2.2 Tour Helicopters 16
3.3 Summary of Mobile Source Emissions 1 6

2000 Air Emissions Inventory Badlands National Park, SD
CONTENTS (Continued)
4.
BADLANDS NP AND REGIONAL EMISSIONS 18
4.1
Badlands NP Summary 18
4.2
Regional Air Emissions 18
5.
COMPLIANCE AND RECOMMENDATIONS 20
5.1
Compliance 20
5.2
Recommendations 20
6.
REFERENCES 22
APPENDIX A - FUEL DATA AND EMISSION FACTORSAPPENDIX B - EMISSION CALCULATIONS
APPENDIX C - PUBLIC USE DATA
Page
National Park Service
iii
February 2003
2000 Air Emissions Inventory Badlands National Park, SD
FIGURES
Number
Title
Page
1
Badlands National Park Location 3
2
Cedar Pass Area 3
3
Badlands National Park ....4
TABLES
Number
Title
Page
I
Badlands National Park Developed Areas 2
2
2000 Actual Air Emissions from Badlands National Park Heating Equipment 7
3
2000 Potential Air Emissions from Badlands National Park Heating Equipment S
4
2000 Actual and Potential Air Emissions from Badlands NP Generators 9
5
2000 Badlands NP Fuel Tank Emissions 10
6
Prescribed Burning Air Emissions from Badlands NP 10
7
Summary of 2000 Stationary and Area Source Emissions at Badlands NP 1 2
8
NPS Road Vehicles at Badlands NP 15
9
NPS Nonroad Vehicles at Badlands NP 16
10
Summary of 2000 Mobile Source Emissions at the Badlands NP 17
11
Emissions from Badlands NP 1 8
12
Estimated Annual Emissions from Badlands NP, Surrounding Counties,and the State of South Dakota 19
National Park Service
iv
July 2002


2000 Air Emissions Inventory
Badlands National Park, SD
1.1 BACKGROUND
In August of 1999, the National Park Service (NPS) embarked on the Natural Resource
Challenge, a major effort to substantially improve how the NPS manages the natural resources
under its care. As part of Natural Resource Challenge, the NPS Air Resources Division (ARD)
was tasked with the responsibility of expanding efforts to monitor and understand air quality and
related values in the parks. In addition, the NPS Environmental Leadership policy directs the
NPS to manage the parks in a manner "that demonstrates sound environmental stewardship by
implementing sustainable practices in all aspects of NPS management...." In order to achieve
both of these objectives, it is necessary to gain an understanding of air pollution emissions that
result from activities within the park. Development of an in-park air emissions inventory for
Badlands National Park (NP) serves three functions in this regard. First, it provides an
understanding of the sources and magnitude of in-park emissions and a basis for contrasting them
with emissions from the surrounding area. Second, it identifies existing and potential strategies
to mitigate in-park air emissions. Finally, it evaluates and ensures the compliance status of the
park relative to state and federal air pollution regulations.
1.2 TYPICAL AIR EMISSION SOURCES
Typical air emission sources within NPS units include stationary, area, and mobile sources.
Stationary sources can include fossil fuel-fired space and water heating equipment, generators,
fuel storage tanks, and wastewater treatment plants. Area sources may include prescribed
woodstoves and fireplaces, campfires, and prescribed burning and wild fires. Mobile sources
include vehicles operated by visitors and NPS employees and nonroard vehicles and equipment.
1.3 INVENTORY METHODOLOGY
The methodology to accomplish the air emissions inventory was outlined in a protocol that was
prepared at the initiation of the project (EA Engineering 2001). Tasks consisted of a site survey
in June 2002, interviews with Badlands NP personnel', review of applicable park records,
emission calculations, review of applicable state air quality regulations, an assessment of
mitigation measures and potential emission reduction initiatives, and report preparation. The
data were used in conjunction with a number of manual and computer software computational
tools to calculate emissions. Computational tools included U.S. Environmental Protection
1. INTRODUCTION
1 Sandee Dingman, Badlands National Park, Resource Management Specialist (605) 433-5262National Park Service
1
February 2003
2000 Air Emissions Inventory
Badlands National Park, SD
Agency (USEPA) emission factors such as the Factor Information Retrieval System (FIRE)
database, USEPA TANKS 4.0 model, U.S. Forest Service First Order Fire Effects Model
(FOFEM) 4.0 model, and USEPA MOBILE6.2 and PART5 mobile source emissions model. The
year 2000 was selected as the basis for the air emission inventory since data for that year were the
most recent available at the park. It should be noted that emissions are expected to vary from
year to year due to fluctuations in visitation, prescribed and wildland fires, and other activities.
Additional information on emission estimation methodology, including emission factors, are
provided in Appendices A and B.
1.4 PARK DESCRIPTION
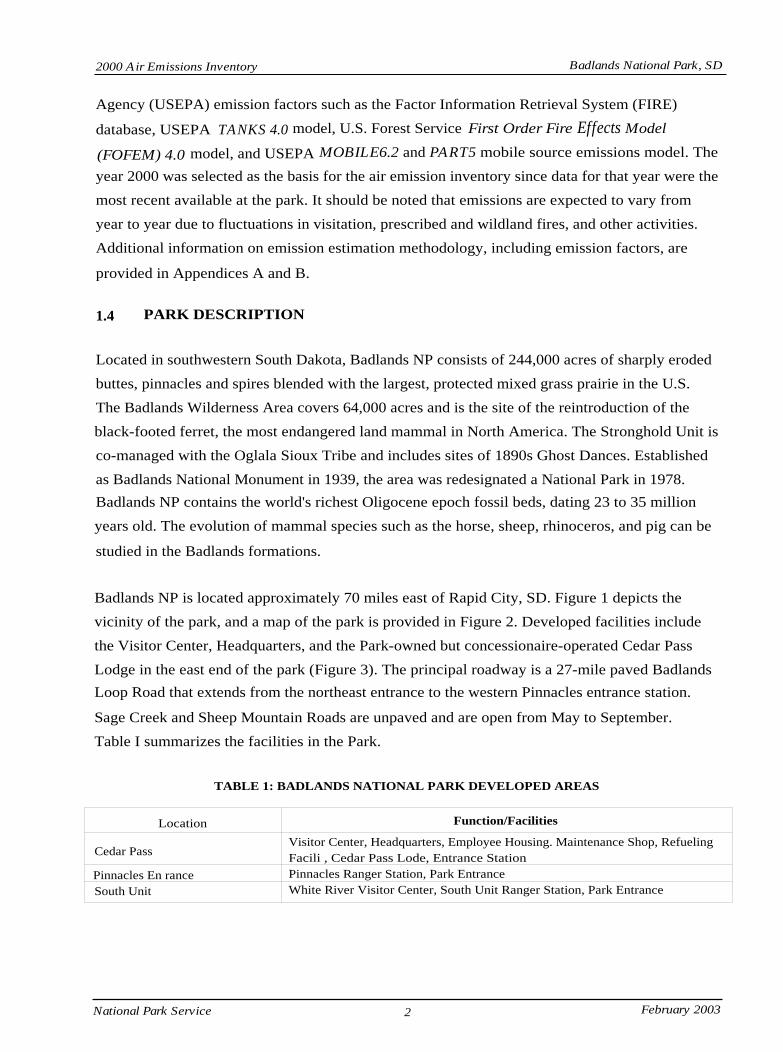
Located in southwestern South Dakota, Badlands NP consists of 244,000 acres of sharply eroded
buttes, pinnacles and spires blended with the largest, protected mixed grass prairie in the U.S.
The Badlands Wilderness Area covers 64,000 acres and is the site of the reintroduction of the
black-footed ferret, the most endangered land mammal in North America. The Stronghold Unit is
co-managed with the Oglala Sioux Tribe and includes sites of 1890s Ghost Dances. Established
as Badlands National Monument in 1939, the area was redesignated a National Park in 1978.
Badlands NP contains the world's richest Oligocene epoch fossil beds, dating 23 to 35 million
years old. The evolution of mammal species such as the horse, sheep, rhinoceros, and pig can be
studied in the Badlands formations.
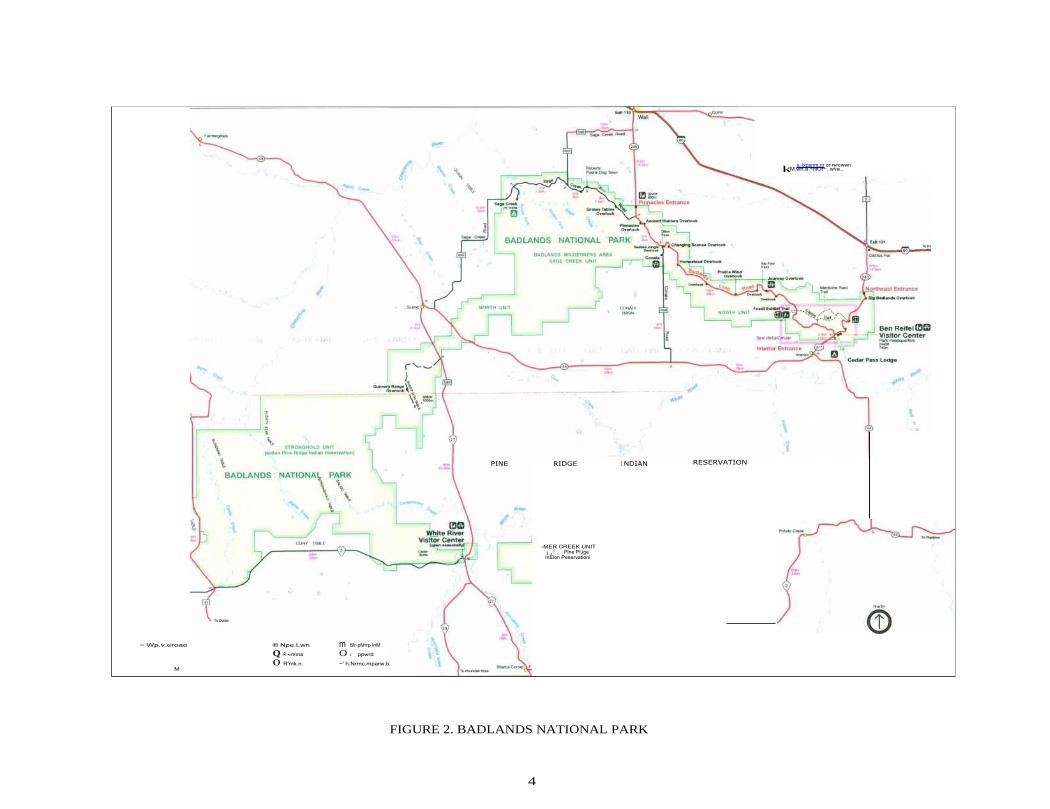
Badlands NP is located approximately 70 miles east of Rapid City, SD. Figure 1 depicts the
vicinity of the park, and a map of the park is provided in Figure 2. Developed facilities include
the Visitor Center, Headquarters, and the Park-owned but concessionaire-operated Cedar Pass
Lodge in the east end of the park (Figure 3). The principal roadway is a 27-mile paved Badlands
Loop Road that extends from the northeast entrance to the western Pinnacles entrance station.
Sage Creek and Sheep Mountain Roads are unpaved and are open from May to September.
Table I summarizes the facilities in the Park.
TABLE 1: BADLANDS NATIONAL PARK DEVELOPED AREAS
National Park Service 2 February 2003
Location Function/Facilities
Cedar PassVisitor Center, Headquarters, Employee Housing. Maintenance Shop, RefuelingFacili , Cedar Pass Lode, Entrance Station
Pinnacles En rance Pinnacles Ranger Station, Park Entrance
South Unit White River Visitor Center, South Unit Ranger Station, Park Entrance

2000 Air Emissions Inventory Badlands National Park, SD
ACK HILLSNATIONAL
FORESTMount
.ishmoreNationall emorial
0
01-P
is
0
590is
er
Keystone
Oelrichs
Rapid City
RIDLL
90
Wall
WoundedKnee
RESERVATION
0
Philip
73KadoF -
BUFFALO GAPNATIONAL
GRH . . .
FIGURE 1. BADLANDS NATIONAL PARK LOCATION
0
0.5
1 Kmu
0.5
Ben Reifel m®Visitor CenterPark Headquarters
t ,- Window TrailiNotch Trail
1 Cliff Shelf Nature Trail WT
National Park Service
FIGURE 2. CEDAR PASS AREA
3 February 2003

M
~ Wp.v.eroae
® Npe.Lwn m Slr-pMrrp InMQ R •rrmna O L ppwrd0 R'mk.n.
~' h.Nrmc.mparw.b
4
FIGURE 2. BADLANDS NATIONAL PARK
PINE
RIDGE
I NDIAN
RESERVATION
-MER CREEK UNITI d ! Plne PIJge
InElon Peeervationi
s. lxpsnm.nr or ryrcwwnkM.wn.a.~NOr~..wva.,

2000 Air Emissions Inventory
Badlands National Park, SD
1.5 AIR QUALITY STATUS
The South Dakota Department of Environment and Natural Resources administers the state's air
pollution program. The park is located in Pennington, Jackson, and Shannon Counties, which
are classified as attainment for all state and national ambient air quality standards. The Park has
hosted an IMPROVE visibility monitoring site since 1988 and operates two ozone monitors.
One is located on the roadside between Park Headquarters and the maintenance shop in Cedar
Pass, and the other is on the Old Northeast Road. The state Department of Environment and
Natural Resources recently co-located its own ozone monitor at the Park's Cedar Pass monitoring
station in order to correlate data collected using two different monitoring systems.
National Park Service
5
February 2003


2000 Air Emissions Inventory
Badlands National Park, SD
Actual criteria pollutant emissions from the heating equipment are summarized in Table 2.
Potential emissions for the propane heating equipment also were calculated by assuming that the
heating units were operated continuously during the year, and these emissions are noted in Table
3.
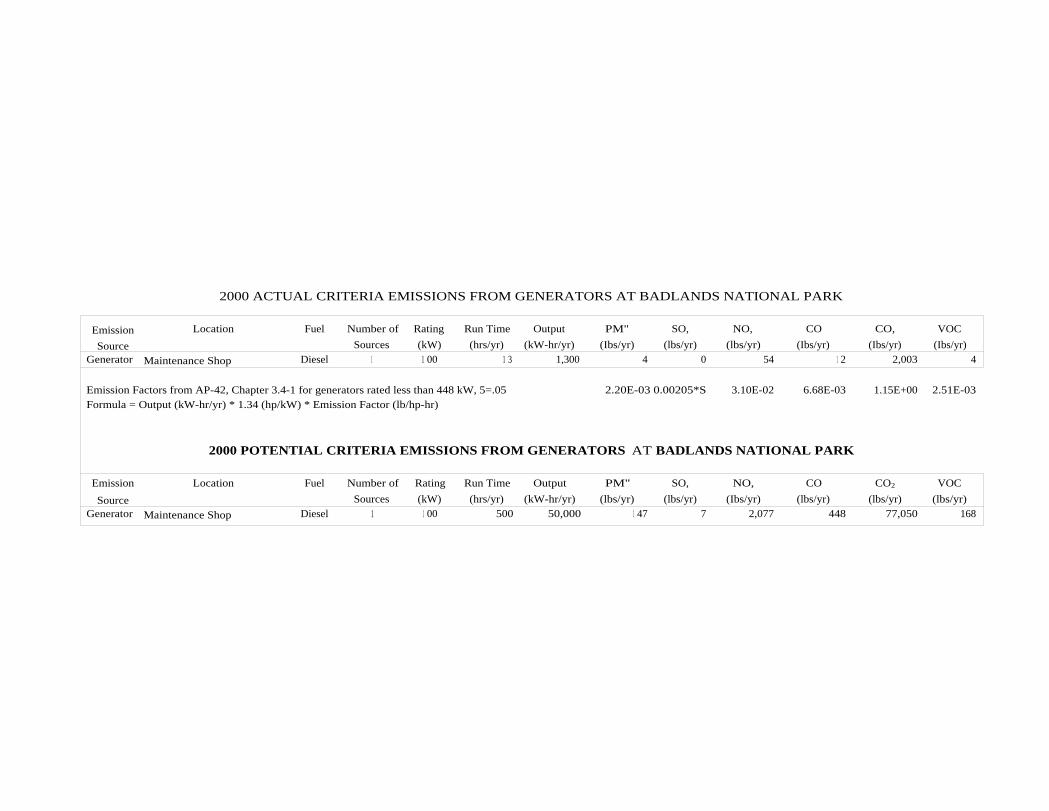
2.1.2 Generators
There is one stationary generator at the maintenance shop that is owned by West River Lyman
Jones, a water utility company. Emissions were calculated by multiplying the unit rating (kW) of
the generator by an estimated annual run time (hr/yr) to get the kW-hr/yr, and the appropriate
emission factors were then applied.
2. STATIONARY AND AREA SOURCE EMISSIONS
This section summarizes emissions from stationary sources at the Park for the year 2000. The
discussion is divided into sections covering emissions from combustion sources, fuel storage
sources, and area sources. The following emissions were calculated for each source: particulate
matter (PM10), sulfur dioxide (SO2), nitrogen oxides (NO X ), carbon monoxide (CO), and volatile
organic compounds (VOCs).
2.1 STATIONARY SOURCES
2.1.1 Space And Water Heating Equipment
There are approximately 55 propane space and water heating units in the Park, and criteria
emissions were calculated using the appropriate residential emission factors. For example, NOx
emissions from the propane furnace in the Headquarters building was calculated as follows:
100 kW x
1,144 gallons/yr x14 lb NOx
1,000 gallons
13 hours
yearx
1.34 hp
kWx
=161bPM10/yr
0.00220 lb PM
hp - hr= 4 lb PM/yr
National Park Service
6
February 2003

2000 Air Emissions Inventoiy
TABLE 2. 2000 ACTUAL AIR EMISSIONS FROM
BADLANDS NATIONAL PARK HEATING EQUIPMENT
Badlands National Park, SD
National Park Service
7
February 2003
Location No. Fuel
Fuel
Consumption(gal/yr)
PM10(lbs/yr)
SO2
(lbs/yr)NOx
(lbs/yr)
CO
(lbs/yr)
CO2
(lbs/yr)
VOC
(lbs/yr)
Headquarters 2 Propane 1,144 0 0 16 2 14,297 0
Conference Building 1 Propane 238 0 0 3 0 2,978 0
Ranger Office 1 Propane 238 0 0 3 0 2,978 0
Resource Management 1 Propane 286 0 0 4 1 3,574 0
Ben Reifel VisitorCenter
1 Propane 1,668 0 23 3 20,849 1
Wellness Center 1 Propane 191 0 0 3 0 2,383 0
Museum 1 Propane 83 0 0 1 0 1,042 0
Cedar Pass Residences 6 Propane 1,430 1 0 20 3 17,871 0
Cedar Pass Residences 1 Propane 179 0 0 3 0 2,234 0
Cedar Pass Apartment 2 Propane 953 0 0 13 2 11,914 0
Cedar Pass Apartment 2 Propane 953 0 0 13 2 11,914 0
Cedar Pass Apartment 2 Propane 953 0 0 13 2 11,914 0
Cedar Pass Apartment 2 Propane 953 0 0 13 2 11,914 0
Cedar Pass LodgeOffice
1 Propane 219 0 0 3 0 2,740 0
Cedar Pass Lodge 1 Propane 476 0 0 7 1 5,954 0
Cedar Pass Cottage 1 Propane 286 0 0 4 1 3,574 0
Cedar Pass Lodge 9 Propane 1,930 1 0 27 4 24,125
Cedar Pass Cottage 1 Propane 286 0 0 4 1 3,574 0
Cedar Pass Laundry I Propane 95 0 0 1 0 1,191 0
Pinnacles Fire Cache 1 Propane 477 0 0 7 1 5,957 0
Pinnacles Fee Office 1 Propane 58 0 0 1 0 730 0
Pinnacles Tack room 1 Propane 60 0 0 1 0 745 0
Pinnacles Residence 1 Propane 238 0 0 3 0 2,978 0
Northeast SupportBuilding
1 Propane 105 0 0 1 0 1,311 0
South Unit VisitorCenter
1 Propane 179 0 0 3 0 2,234 0
South Unit Fire Cache 1 Propane 238 0 0 3 2,978 0
South Unit Residence 1 Propane 226 0 0 3 0 2,830 0
Residences 11 Propane 1,048 0 0 15 2 13,105 0
Totals 15,191 0 213 30 189,888 5

2000 Air Emissions Inventory
TABLE 3. 2000 POTENTIAL AIR EMISSIONS FROMBADLANDS NATIONAL PARK HEATING EQUIPMENT
Badlands National Park, SD
Potential emissions also were calculated for the generators. According to EPA guidance on
calculating potential emissions from generators, 500 hours is an appropriate default assumption
for estimating the number of hours that an emergency generator could be expected to operate. 1
Actual and potential generator emissions are summarized in Table 4.
Calculating Potential to Emit (PTE) for Emergency Generators, Office of Air Quality Planning and Standards (MD-10) U.S. Environmental Protection Agency, September6, 1995.National Park Service
8
February 2003
Location No. FuelFuel
Consumption(gal/yr)
PM1 0
(Ibs/yr)SO 2
(Ibs/yr)NOX
(lbs/yr)CO
(Ibs/yr)CO2
(Ibs/yr)VOC
(Ibs/yr)Headquarters 2 Propane 45,954 18 1 643 92 574,426 14Conference Building 1 Propane 9,574 4 0 134 19 119,672 3Ranger Office 1 Propane 9,574 4 0 134 19 119,672 3Resource Management 1 Propane 11,489 5 0 161 23 143,607 3Ben Reifel VisitorCenter 1 Propane 67,016 27 1 938 134 837,705 20Wellness Center I Propane 7,659 3 0 107 15 95,738 2Museum 1 Propane 3,351 1 0 47 7 41,885 1Cedar Pass Residences 6 Propane 57,443 23 1 804 115 718,033 17Cedar Pass Residences 1 Propane 7,180 3 0 101 14 89,754 2Cedar Pass Apa ment 2 Propane 38,295 15 1 536 77 478,689 11Cedar Pass Apartment 2 Propane 38,295 15 1 536 77 478,689 11Cedar Pass Apa ent 2 Propane 38,295 15 1 536 77 478,689 11Cedar Pass Apartment 2 Propane 38,295 15 1 536 77 478,689 11Cedar Pass LodgeOffice
1 Propane 8,808 4 0 123 18 110,098 3Cedar Pass Lodge 1 Propane 19,138 8 0 268 38 239,225 6Cedar Pass Cottage 1 Propane 11,489 5 0 161 23 143,607 3Cedar Pass Lodge 9 Propane 77,548 31 1 1,086 155 969,344 23Cedar Pass Cottage 1 Propane 11,489 5 0 161 23 143,607 3Cedar Pass Laundry 1 Propane 3,830 2 0 54 8 47,869 1Pinnacles Fire Cache 1 Propane 19,148 8 0 268 38 239,344 6Pinnacles Fee Office 1 Propane 2,346 1 0 33 5 29,320 1Pinnacles Tack room I Propane 2,393 1 0 34 5 29,918 1Pinnacles Residence 1 Propane 9,574 4 0 134 19 119,672 3Northeast SupportBuilding Propane 4,212 2 0 59 8 52,656 1South Unit VisitorCenter 1 Propane 7,180 3 0 101 14 89,754 2
South Unit Fire Cache I Propane 9,574 4 0 134 19 119,672 3South Unit Residence 1 Propane 9,095 4 0 127 18 113,689 3Residences 11 Propane 42,125 17 1 590 84 526,557 13
Totals 610,366 244 11 8,545 1,221 7,629,577 183
2000 Air Emissions Inventory
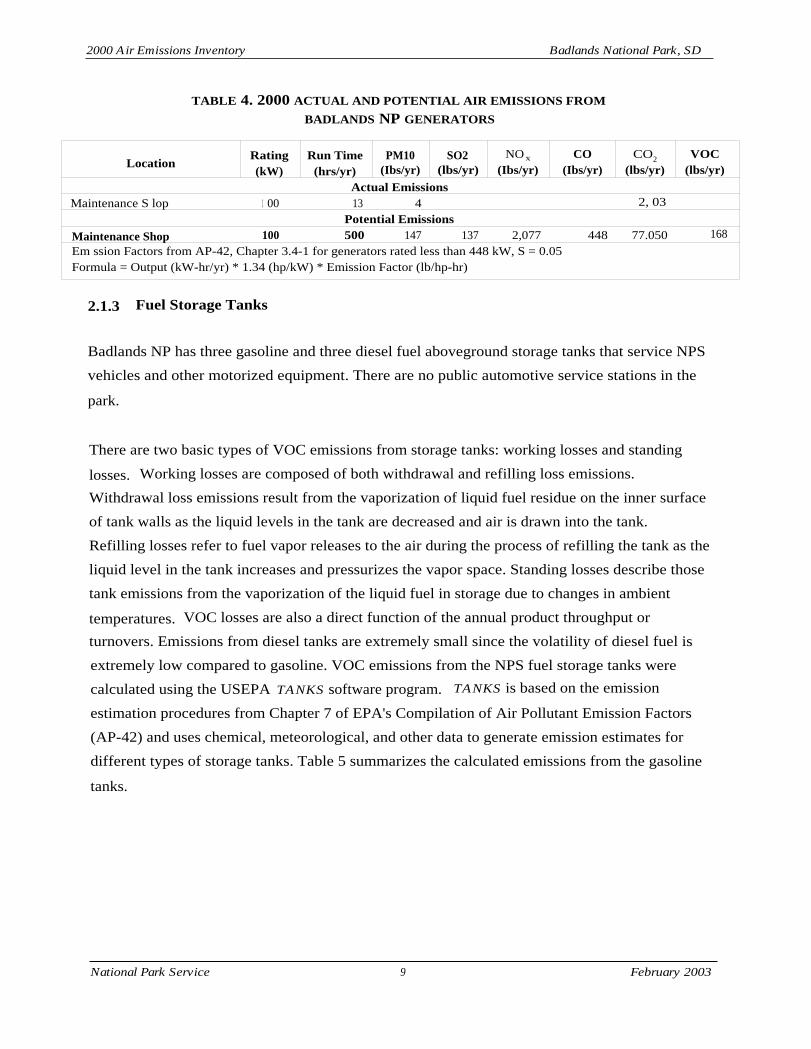
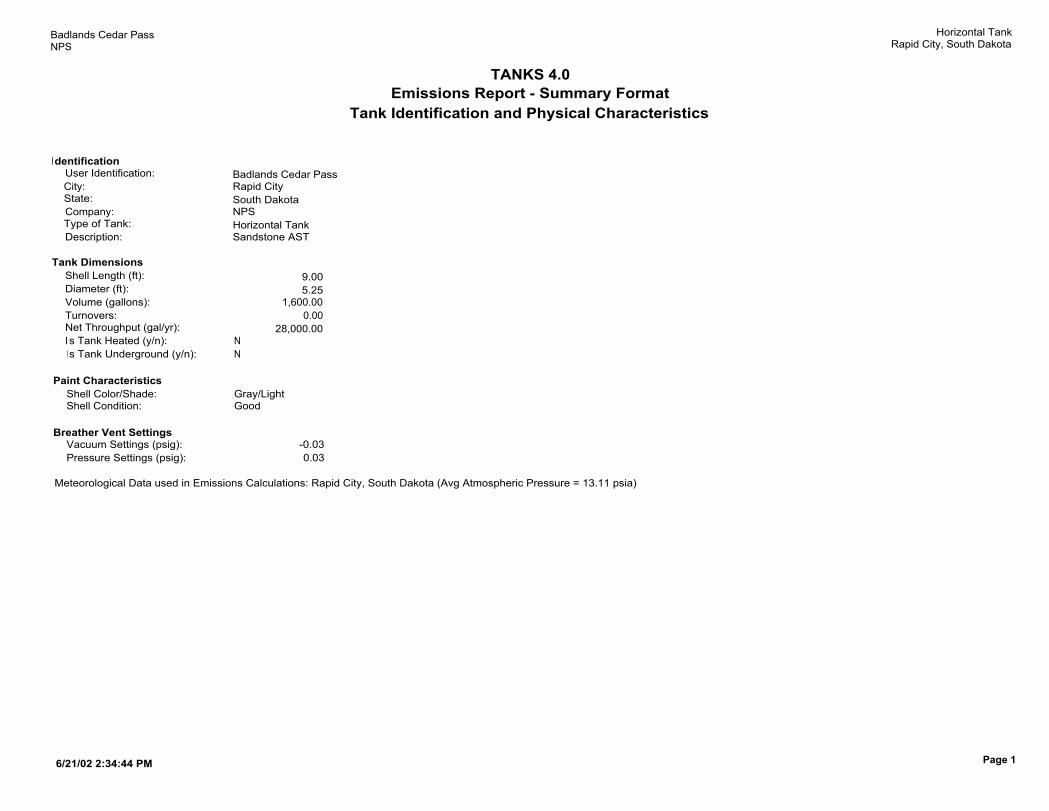
2.1.3 Fuel Storage Tanks
Badlands NP has three gasoline and three diesel fuel aboveground storage tanks that service NPS
vehicles and other motorized equipment. There are no public automotive service stations in the
park.
There are two basic types of VOC emissions from storage tanks: working losses and standing
losses. Working losses are composed of both withdrawal and refilling loss emissions.
Withdrawal loss emissions result from the vaporization of liquid fuel residue on the inner surface
of tank walls as the liquid levels in the tank are decreased and air is drawn into the tank.
Refilling losses refer to fuel vapor releases to the air during the process of refilling the tank as the
liquid level in the tank increases and pressurizes the vapor space. Standing losses describe those
tank emissions from the vaporization of the liquid fuel in storage due to changes in ambient
temperatures. VOC losses are also a direct function of the annual product throughput or
turnovers. Emissions from diesel tanks are extremely small since the volatility of diesel fuel is
extremely low compared to gasoline. VOC emissions from the NPS fuel storage tanks were
calculated using the USEPA TANKS software program. TANKS is based on the emission
estimation procedures from Chapter 7 of EPA's Compilation of Air Pollutant Emission Factors
(AP-42) and uses chemical, meteorological, and other data to generate emission estimates for
different types of storage tanks. Table 5 summarizes the calculated emissions from the gasoline
tanks.
TABLE 4. 2000 ACTUAL AND POTENTIAL AIR EMISSIONS FROM
BADLANDS NP GENERATORS
Badlands National Park, SD
National Park Service
9 February 2003
LocationRating(kW)
Run Time(hrs/yr)
PM10(Ibs/yr)
SO2(lbs/yr)
NOx
(Ibs/yr)CO
(Ibs/yr)CO2
(lbs/yr)VOC
(lbs/yr)
Actual EmissionsMaintenance S lop
1 00
13
4
2, 03
Potential Emissions
Maintenance Shop
100
500
147
137
2,077
448
77.050
168
Em ssion Factors from AP-42, Chapter 3.4-1 for generators rated less than 448 kW, S = 0.05Formula = Output (kW-hr/yr) * 1.34 (hp/kW) * Emission Factor (lb/hp-hr)

2000 Air Emissions Inventory
2.2 AREA SOURCES
2.2.1 Woodstoves
Park officials estimated that about 10 employee housing units equipped with woodstoves, but
that only two use them. However, there were no data on the quantity of wood consumed.
2.2.2 Campfires
Campfires are not permitted due to the extreme danger of prairie wildfire.
2.2.3 Wildland Fires and Prescribed Burning
Wildland fires are ignited naturally, usually by lightening and are typically suppressed, while
prescribed fires are ignited intentionally in order to achieve fire management objectives.
Prescribed burning is a land treatment process to accomplish natural resource management
objectives, including reducing the potential for destructive wildfires, eliminating excessive fuel
buildup, controlling insects and disease, improving wildlife habitat and forage production,
maintaining natural succession of plant communities, and restoring natural processes. Only
prescribed burning emissions are considered as anthropogenic emissions.
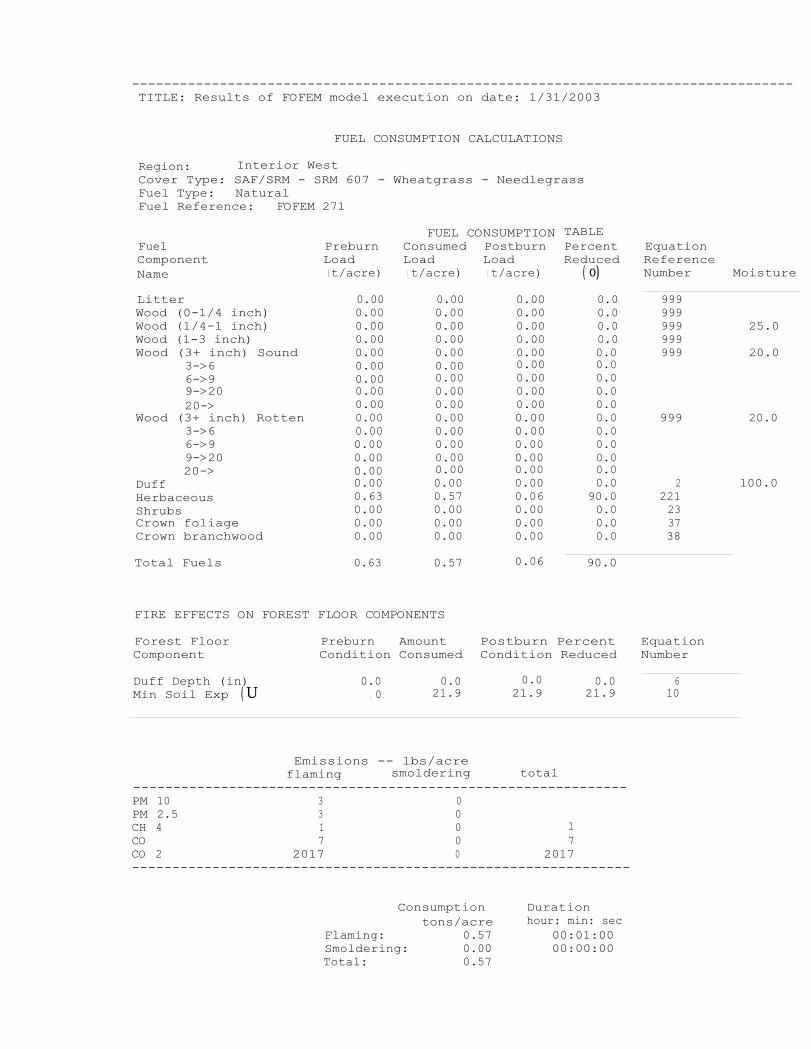
In 2001, there were three prescribed burns of prairie grassland that covered almost 4,000 acres,
but only one wildland fire that was less than an acre in size. The First Order Fire Effects Model
(FOFEM) was used to estimate emissions. FOFEM is a computer program developed by the
Intermountain Fire Sciences Lab, U.S. Forest Service to predict the effects of prescribed fire and
wildfire in forests and rangelands throughout the U.S. In particular, it quantifies emissions of
CO, PM 1 0 , and PM 2 _ 5 , which are summarized in Table 6.
TABLE 5: 2000 BADLANDS NP FUEL TANK EMISSIONS
Badlands National Park, SD
National Park Service
1 0
February 2003
Location Product Tank TypeVolume
(gal)Throughput
(gal/yr)VOC
(lbs/yr)
Cedar Pass Maintenance Gasoline AST 1,600 28,000 531
Pinnacles Ranger Station Gasoline AST 1,000 1,000 240
South Unit Ranger Station Gasoline AST 1,000 1,000 240
Total 30,000 1,011

2000 Air Emissions Inventory
As methane
2.2.4 Miscellaneous Area Sources
Miscellaneous area sources include food preparation, degreasers, paints and other surface
coatings, lighter fluid consumption, consumer solvents, and propane use by visitors in
recreational vehicles. However, there are no data on the consumption of these materials.
2.3 SUMMARY OF STATIONARY AND AREA SOURCE EMISSIONS
Table 7 summarizes the stationary and area source emissions calculated above in a format that
allows comparison between the various sources as well as providing totals for each pollutant or
pollutant category under consideration.
National Park Service
1 1
Badlands National Park, SD
TABLE 6: PRESCRIBED BURNING AIR EMISSIONS FROM BADLANDS NP
February 2003
Type AcresPM 10
tons/ r)PM2.5
tons/ rCo
(tons/ r)CO 2
(tons/ r)VOC 1
(tons/ r)
Grassland 3,874 5.81 5.81 13.56 3,907 1.94

2000 Air Emissions Inventory
TABLE 7: SUMMARY OF 2000 STATIONARY AND AREA SOURCE EMISSIONS AT BADLANDS NP
Badlands National Park, SD
National Park Service 12 July 2002
Particulates Sulfur Dioxide Nitrogen Oxides Carbon Monoxide Carbon Dioxide VOCsActivity lbs/yr tons/yr lbs/yr tons/yr lbs/yr tons/yr lbs/yr tons/yr lbs/yr tons/yr lbs/yr tons/yr
Stationary Sources
Heating Equipment 6 <0.01 <1 <0.01 213 0.11 30 0.02 189,888 95 5 <0.01
Generator 4 <0.01 <1 <0.01 54 0.03 12 0.01 2,003 1.00 4 <0.01
Gasoline Storage Tanks -- -- -- -- -- -- -- -- -- -- 1,011 0.51
Stationary Sources Subtotal 10 <0.01 <1 <0.01 267 0.13 42 0.02 191,891 96 1,020 0.51
Area Sources
Prescribed Fires
11,622
5.81
--
--
--
--
27,118
13.56 7,813,858
3,907
3,874
1.94
Totals -
Totals without Prescribed Fires
Particulates Sulfur Dioxide Nitrogen Oxides Carbon Monoxide Carbon Dioxide VOCs
lbs/yr tons/yr lbs/yr tons/yr lbs/yr tons/yr lbs/yr tons/yr lbs/yr tons/yr lbs/yr tons/yr
10 <0.01 <1 <0.01 267 0.13 42 0.02 191,891 96 1,020 0.51
Totals with Prescribed Fires 11,632 5.82 <0.01 267 0.13 27,160 13.58 8,005,750 4,003 4,894 2.45


2000 Air Emissions Inventory
Badlands National Park, SD
3. MOBILE SOURCE EMISSIONS
This section summarizes emissions from mobile sources at Badlands NP for 2000. Mobile
emission sources include highway and nonroad vehicles. The following emissions were
calculated for each source: particulate matter (PM 10), nitrogen oxides (NO,,), carbon monoxide
(CO), and volatile organic compounds (VOCs).
3.1 HIGHWAY VEHICLES
3.1.1 Visitor Vehicles
The only paved road through the park is the Badlands Loop Road, which is a 27-mile segment of
Route 240. The number of visitor vehicles operating in NPS units is often correlated to the
number of annual visitors to the park unit. The number of visitors to Badlands NP as estimated
by the NPS was approximately 974,333 in 2001. Using a people per vehicle factor of 2.4, the
number of visitor vehicles is estimated to be approximately 405,975. Assuming that these
vehicles entered the park at the Northeast or Northwest (Pinnacles) entrance stations and traveled
the paved road once and exited at the other entrance, then the estimated vehicle-miles-traveled
(VMT) by visitor vehicles was approximately 10,962,000 miles in 2001.
There are also two unpaved roads that are traveled by a small portion of visitor vehicles during
May-September. NPS officials estimated that the seasonal VMT for these unpaved roads, which
would generate considerably more fugitive dust than vehicles operating on paved roads, is
approximately 444,000 miles a year.
The majority of mobile source emissions can be categorized as either exhaust or evaporative
emissions. Exhaust emissions are related to the combustion of fuel in the engine and include
VOC, NOx, CO, and PM10. Exhaust emissions are dependent on a number of factors, including
engine load, engine design and age, combustion efficiency, emissions equipment such as catalytic
converters, and other factors. Evaporative emissions, which can occur while the vehicle is
running or at rest, are related to the volatilization of fuel from vapor expansion, leaks and
seepage, and fuel tank vapor displacement. Evaporative emissions are primarily dependent on
daily temperature cycles and fuel volatility. In addition to vehicle exhaust, PM10 emissions also
result from brake and tire wear, as well as the re-entrainment of dust from paved and unpaved
roads (referred to as fugitive dust).
National Park Service
1 3
February 2003
2000 Air Emissions Inventory
Badlands National Park, SD
Emission factors produced by the USEPA MOBILE6.2 model were used in conjunction with
vehicle miles traveled (VMT) data in order to estimate mobile source emissions for VOC (both
exhaust and evaporative), NOx, and CO. Similarly, emission factors produced by the PARTS
model were used in conjunction with VMT data to estimate PM10 emissions. MOBILE6.2
produces exhaust and evaporative emission factors for the following classes of vehicles: light
duty gasoline vehicles (LDGV), light duty gasoline trucks 1 (LDGT1), light duty gasoline trucks
2 (LDGT2), heavy duty gasoline vehicles (HDGV), light duty diesel vehicles (LDDV), light duty
diesel trucks (LDDT), heavy duty diesel vehicles (HDDV), and motorcycles. It also produces a
composite emission factor for all vehicles based on the vehicle class mix supplied to the model.
Inputs to the model include average vehicle speed, vehicle VMT mix, annual mileage
accumulation rates and registration distributions by age, inspection and maintenance (UM)
program information, fuel information, ambient temperature data, and others.
Both the MOBILE6.2 and PART5 models are typically used to support planning and modeling
efforts in urban or regional areas, and include default inputs suited for these applications.
Therefore it is suitable for applications over large, regional transportation networks. Application
of the MOBILE6.2 model required the utilization of unique inputs that were representative of
mobile source activity within the park. In particular, it was necessary to utilize unique inputs for
the visitor vehicle class mix and the vehicle age distribution.
The Center for Environmental Research and Technology within the College of Engineering at the
University of California's Riverside Campus (CE-CERT) established park-specific vehicle fleet
characterizations in developing air emission inventories for Zion National Park (CE-CERT,
2001). CE-CERT found that the distribution of vehicle ages in the park reflected a larger fraction
of newer vehicles than the overall model default vehicle age distribution.
In addition to VMT mix and age distribution, CE-CERT also established park-specific modeling
inputs for driving pattern characterization. CE-CERT found that park driving patterns differ
significantly from the default driving patterns typically used in mobile modeling, such as the
Federal Test Procedure (FTP). In particularly, they found that the FTP reflects both higher
speeds and a wider range of speeds than observed in the parks. However, since the MOBILE5b
model is not designed to readily incorporate unique driving pattern data, the default driving cycle
remains the basis for the mobile source emission estimates provided here.
Other important mobile modeling inputs that can significantly affect mobile emission factors are
the average speed, fuel characteristics, and UM program parameters. The average speed input to
National Park Service
1 4
February 2003
2000 Air Emissions Inventory
Badlands National Park, SD
the mobile models was assumed to be 35 mph. The fuel volatility was assumed to be RVP 13.4
(winter) and 8.3 (summer), and reformulated gasoline was not assumed to be present. Finally,
inspection/maintenance (UM) program inputs were not included since there are no UM programs
in South Dakota.
In order to account for seasonal differences in mobile emissions, separate MOBILE5b runs were
performed to produce emission factors for winter and summer. A composite emission factor for
each season, reflecting a park specific VMT mix adapted from the CE-CERT data, served as the
basis for mobile source emission estimates. Additional particulate emissions (or entrained road
dust) from vehicles operating in Badlands NP also were calculated based on VMT. A summary
of visitor vehicle emissions is provided in Table 10.
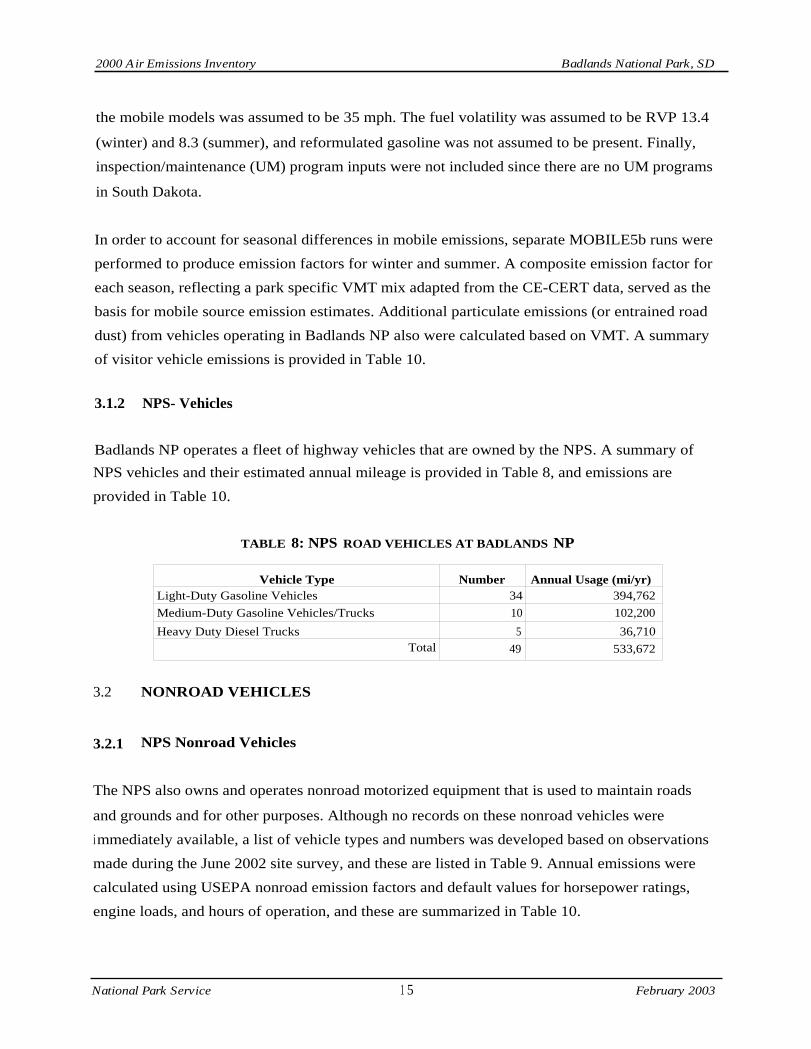
3.1.2 NPS- Vehicles
Badlands NP operates a fleet of highway vehicles that are owned by the NPS. A summary of
NPS vehicles and their estimated annual mileage is provided in Table 8, and emissions are
provided in Table 10.
TABLE 8: NPS ROAD VEHICLES AT BADLANDS NP
3.2 NONROAD VEHICLES
3.2.1 NPS Nonroad Vehicles
The NPS also owns and operates nonroad motorized equipment that is used to maintain roads
and grounds and for other purposes. Although no records on these nonroad vehicles were
immediately available, a list of vehicle types and numbers was developed based on observations
made during the June 2002 site survey, and these are listed in Table 9. Annual emissions were
calculated using USEPA nonroad emission factors and default values for horsepower ratings,
engine loads, and hours of operation, and these are summarized in Table 10.
National Park Service
1 5
February 2003
Vehicle Type Number Annual Usage (mi/yr)Light-Duty Gasoline Vehicles 34 394,762
Medium-Duty Gasoline Vehicles/Trucks 10 102,200
Heavy Duty Diesel Trucks 5 36,710Total 49 533,672

2000 Air Emissions Inventory
3.2.2 Tour Helicopters
A tour helicopter company is located immediately outside the northeast entrance to the park.Due to its close proximity to the park's boundary, emissions associated with takeoffs andlandings were calculated using the Federal Aviation Administration's Emissions and DispersionModeling System. Emissions from the Bell Model 47 were calculated assuming thatapproximately 1,984 flights were made per tourist season (Foch Associates, 2000), and these areprovided in Table 10.
3.4 SUMMARY OF MOBILE SOURCE EMISSIONS
Table 10 summarizes the mobile source emissions for road and nonroad vehicles and equipmentoperating in Badlands NP in 2000.
TABLE 9: NPS NONROAD VEHICLES AT BADLANDS NP
Badlands National Park, SD
National Park Service
1 6
February 2003
Vehicle Type Number
Tractor 1Grader 1Case LoaderBackhoe 2
Road Roller 1
Road Broom 1Bobcat Loader 1Mower 2
2000 Air Emissions Inventory
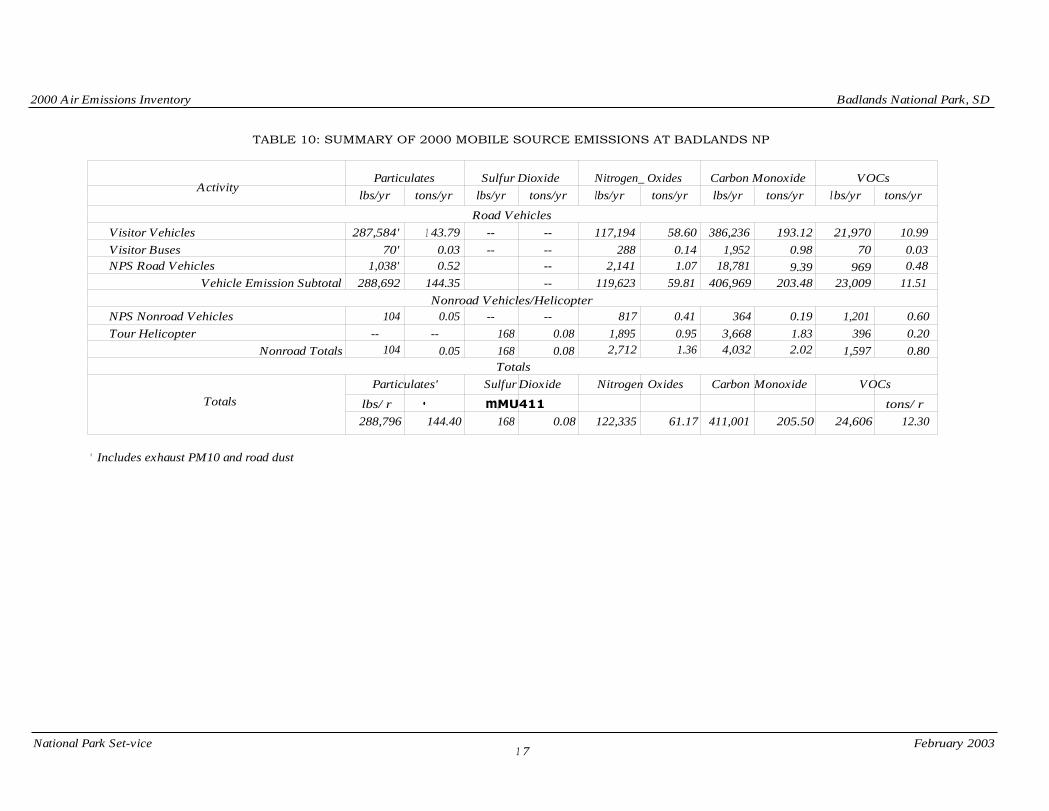
TABLE 10: SUMMARY OF 2000 MOBILE SOURCE EMISSIONS AT BADLANDS NP
' Includes exhaust PM10 and road dust
National Park Set-vice1 7
Badlands National Park, SD
February 2003
Particulates Sulfur Dioxide Nitrogen_ Oxides Carbon Monoxide VOCsActivity
lbs/yr tons/yr lbs/yr tons/yr lbs/yr tons/yr lbs/yr tons/yr lbs/yr tons/yr
Road Vehicles
Visitor Vehicles 287,584' 1 43.79 -- -- 117,194 58.60 386,236 193.12 21,970 10.99
Visitor Buses 70' 0.03 -- -- 288 0.14 1,952 0.98 70 0.03NPS Road Vehicles 1,038' 0.52 -- 2,141 1.07 18,781 9.39 969 0.48
Vehicle Emission Subtotal 288,692 144.35 -- 119,623 59.81 406,969 203.48 23,009 11.51
Nonroad Vehicles/HelicopterNPS Nonroad Vehicles 104 0.05 -- -- 817 0.41 364 0.19 1,201 0.60
Tour Helicopter -- -- 168 0.08 1,895 0.95 3,668 1.83 396 0.20
Nonroad Totals 104 0.05 168 0.08 2,712 1.36 4,032 2.02 1,597 0.80Totals
Totals
Particulates' Sulfur Dioxide Nitrogen Oxides Carbon Monoxide VOCs
lbs/ r • m,MU411 tons/ r
288,796 144.40 168 0.08 122,335 61.17 411,001 205.50 24,606 12.30


2000 Air Emissions Inventory
1 As methane
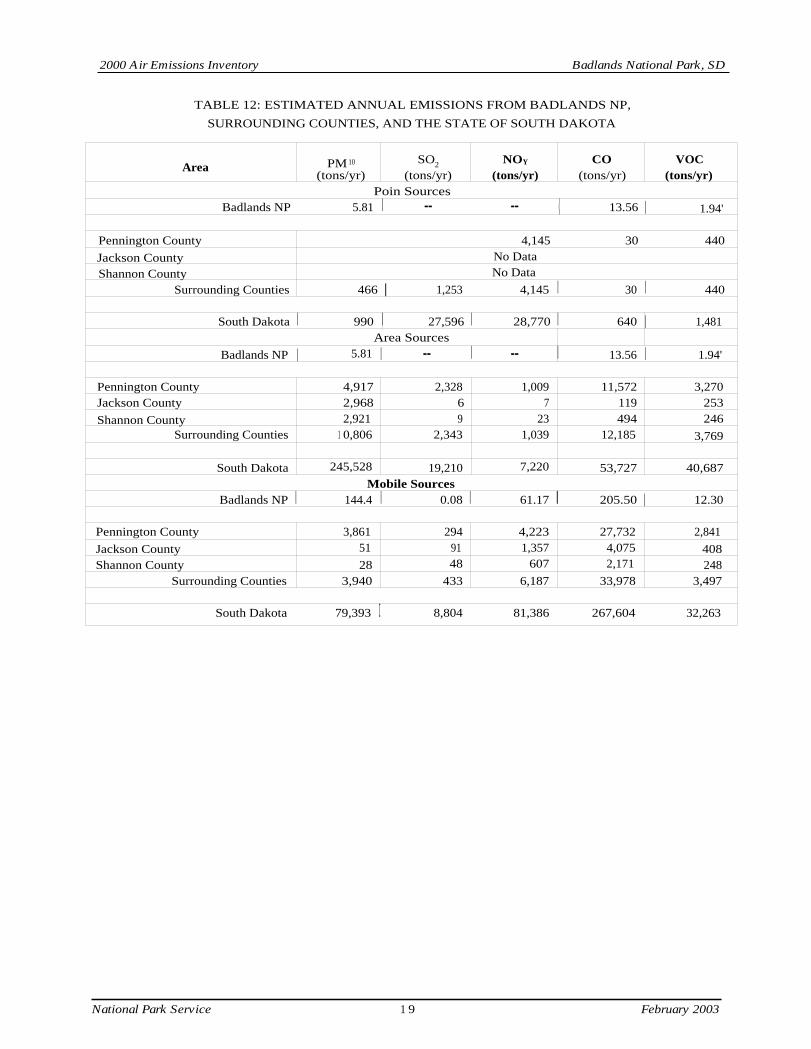
4.2 REGIONAL AIR EMISSIONS
Emission estimates for Pennington, Jackson, and Shannon Counties and the state of South
Dakota were obtained from the 1999 National Emission Inventory (NEI) maintained by USEPA.
However, no data were included in the statewide totals for stationary sources in Jackson and
Shannon Counties. It is important to note that differences may exist between the methodologies
used to generate the preserve emission inventory and those used to generate the NEI. For
example, gasoline storage tanks have been included as stationary sources for the Park, while the
NEI treats them as area sources. The majority of the emissions generated by point sources in
Pennington County are attributable to other industrial processes. Table 12 provides a comparison
of the Park emissions with those from the surrounding counties and the State of South Dakota.
4. BADLANDS NP AND REGIONAL AIR EMISSIONS
4.1 BADLANDS NP SUMMARY
A summary of Badlands NP emissions is provided in Table 11.
TABLE 11: ESTIMATED ANNUAL EMISSIONS FROM BADLANDS NP
SourcePM 10
SO 2
NO.x
CO
VOCs(tons)
(tons)
(tons)
(tons)
(tons)
Badlands National Park, SD
National Park Service
1 8
February 2003
Point Sources
Heating Equipment <0.01 <0.01 0.11 0.02 <0.01
Generators <0.01 <0.01 0.03 0.01 <0.01Gasoline Storage Tanks 0.51
Subtotal <0.01 <0.01 0.13 0.02 0.51Area Sources
Prescribed Burning 5.81 13.56 1.94'Subtotal 5.81 13.56 1.94'
Mobile'Sources
Road Vehicles 144.35 59.81 203.48 11.51Nonroad Vehicles 0.05 0.08 1.36 2.02 0.80
Subtotal 144.4 0.08 61.17 205.50 12.30Totals
Totals 5.86 <0.01
61.30 219.08
14.75
2000 Air Emissions Inventory
TABLE 12: ESTIMATED ANNUAL EMISSIONS FROM BADLANDS NP,
SURROUNDING COUNTIES, AND THE STATE OF SOUTH DAKOTA
Badlands National Park, SD
National Park Service
1 9
February 2003
Area PM 10
(tons/yr)SO2
(tons/yr)NOY
(tons/yr)CO
(tons/yr)VOC
(tons/yr)Poin Sources
Badlands NP 5.81 I
--
--
( 13.56 I 1.94'
Pennington County 4,145 30 440
Jackson County No Data
Shannon County No Data
Surrounding Counties 466 I
1,253
4,145 I 30 I 440
South Dakota I 990 I
27,596 I
28,770 I 640 I 1,481Area Sources
Badlands NP I 5.81 I
--
I
-- I 13.56 I 1.94'
Pennington County 4,917 2,328 1,009 11,572 3,270Jackson County 2,968 6 7 119 253
Shannon County 2,921 9 23 494 246Surrounding Counties 1 0,806 2,343 1,039 12,185 3,769
South Dakota 245,528 19,210 7,220 53,727 40,687Mobile Sources
Badlands NP I 144.4 I
0.08 I
61.17 I 205.50 I 12.30
Pennington County 3,861 294 4,223 27,732 2,841
Jackson County 51 91 1,357 4,075 408Shannon County 28 48 607 2,171 248
Surrounding Counties 3,940 433 6,187 33,978 3,497
South Dakota 79,393 I
8,804
81,386 267,604 32,263
2000 Air Emissions Inventory
Badlands National Park, SD
5. COMPLIANCE AND RECOMMENDATIONS
5.1 COMPLIANCE
The park is located in Pennington, Jackson, and Shannon Counties, which are classified as
attainment for all state and national ambient air quality standards. The South Dakota Department
of Environment and Natural Resources administers the state's air pollution program. Park
personnel should coordinate with the agency on permit issues relating to stationary sources, as
well as prescribed burning activities. The South Dakota regulations do not address very many
specific issues. For example, although they address major stationary sources, they do not set
thresholds for triggering the need for a permit. With respect to open burning, the state
regulations do not identify what is permissible to open burn; however, Pennington County has
developed open burning regulations for the City of Rapid City and the area immediately
surrounding the city limits.
With respect to wildland and prescribed fires, the state is working with the National Park
Service, National Forest Service, Bureau of Land Management, and State Forest Service to
develop Smoke Management Plans for the Black Hills region. The plans will follow EPA issued
policy on wildland and prescribed fires to minimize air quality impacts.
5.2 RECOMMENDATIONS
Actions to promote sustainable development in the design, retrofit, and construction of park
facilities have associated air quality benefits. These include actions that reduce or replace
consumption of conventional fossil fuels and/or reduce the consumption of other resources.
Reductions in potable and non-potable water consumption also achieve concurrent reductions in
energy consumption and associated air emissions. Acquisition of energy efficient appliances
whenever possible also is an incremental energy saving measure that has associated air quality
benefits.
The park currently is investigating a visitor shuttle system to serve the needs of visitors to the
Castle Trail Complex during the peak and shoulder seasons. The system would serve hiking
trails in the North Unit of the park as well as visitor parking areas near Cedar Pass and along the
eastern end of the 27-mile Badlands Loop Road. Alternative fuels may also be investigated.
Emissions from the Park are minor, both in comparison to State totals and to other NPS units.
The principal air emission issues relate to planned energy production facilities in the Powder
National Park Service
20
February 2003

2000 Air Emissions Inventory
Badlands National Park, SD
River Basin in northeast Wyoming. These facilities include three low sulfur coal power plants
that are in the planning stages and approximately 40,000 coal seam methane extraction wells.
Although each well does not constitute a significant air emission source, collectively, they can
impact the Park's air quality resources. Park officials are well aware of these developments and
are monitoring their permitting status.
National Park Service
2 1
February 2003
2000 Air Emissions Inventory
Badlands National Park, SD
6. REFERENCES
BRACO Resource Services. 2001. Department of Energy SA VEnergy Audit, Badlands National
Park. November
College of Engineering at the University of California's Riverside Campus (CE-CERT). 2001.Air Emissions Inventory for Zion National Park.
EA Engineering, Science, and Technology. 2001. Air Emission Inventory Preparation Plan.Prepared for the National Park Service. November.
Federal Highway Administration. 1998. The Road Inventory of Badlands National Park.
September.
Foch Associates. 2000. Tour Helicopter Noise Intrusions on the Soundscape at BadlandsNational Park During April-October 1999. June 11.
University of Idaho. 2001. Badlands National Park Visitor Study, Summer 2000. July
USEPA, 1991. Nonroad Engine and Vehicle Emission Study Report. EPA-21 A-2001 and
EPA460/3-91-02. November.
USEPA, 1995a. Compilation ofAir Pollution Emission Factors AP-42, Fifth Edition, Volume I:Stationary Point and Area Sources.
USEPA, 1995b. Highway Vehicle Particulate Emission Modeling Software "PARTS". Office ofTransportation and Air Quality.
USEPA, 2000a. Factor Information REtrieval (FIRE) Data System. Office of Air Quality
Planning and Standards.
USEPA, 2000b. TANKS 4.09a. Office of Air Quality Planning and Standards.
USEPA, 2002. User's Guide to MOBILE6.1 and MOBILE6.2 Mobile Source Emission Factor
Model. EPA420-R-02-010. Office of Air and Radiation. March.
U.S. Federal Aviation Administration. 1997. Emissions and Dispersion Modeling System.Version 3.23. Office of Environment and Energy. February.
U.S. Forest Service. 1997. First Order Fire Effects Model (FOFEM) 4.0 User's Guide.
January.
National Park Service
2 2
February 2003

APPENDIX A
FUEL DATA AND EMISSION FACTORS

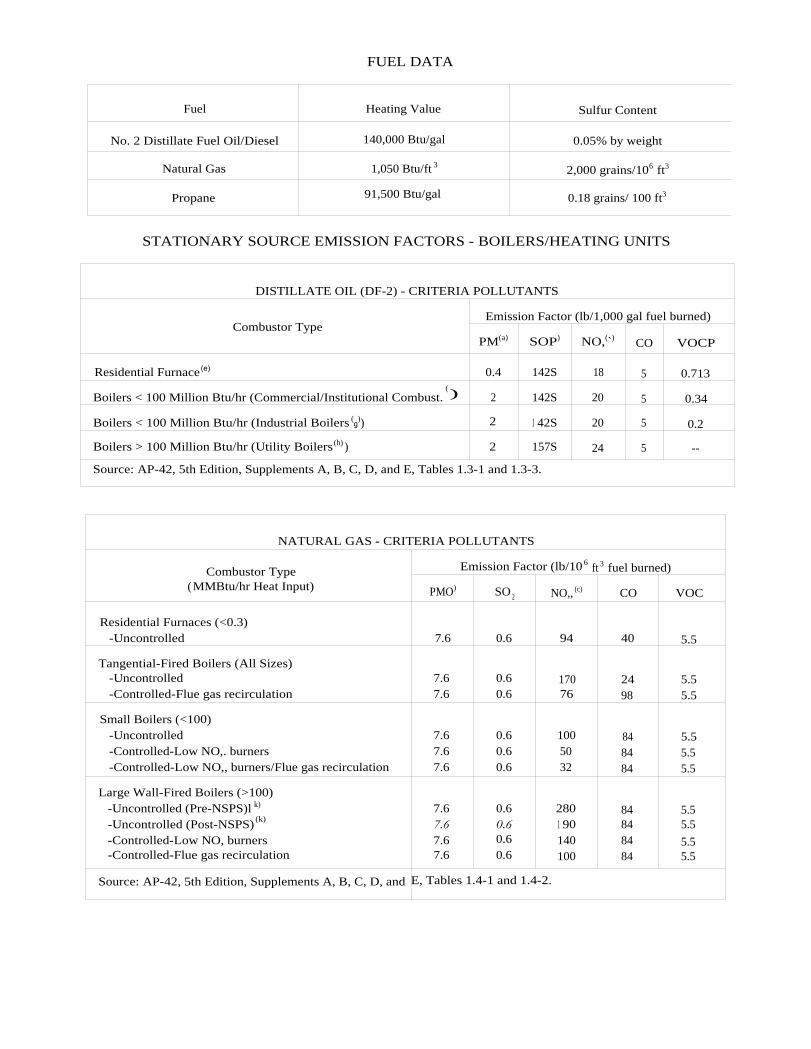
FUEL DATA
STATIONARY SOURCE EMISSION FACTORS - BOILERS/HEATING UNITS
NATURAL GAS - CRITERIA POLLUTANTS
Combustor Type(MMBtu/hr Heat Input)
Emission Factor (lb/10 6 ft 3 fuel burned)
PMO) SO 2 NO,, (c) CO VOC
Residential Furnaces (<0.3)-Uncontrolled 7.6 0.6 94 40 5.5
Tangential-Fired Boilers (All Sizes)-Uncontrolled 7.6 0.6 170 24 5.5-Controlled-Flue gas recirculation 7.6 0.6 76 98 5.5
Small Boilers (<100)-Uncontrolled 7.6 0.6 100 84 5.5-Controlled-Low NO,. burners 7.6 0.6 50 84 5.5-Controlled-Low NO,, burners/Flue gas recirculation 7.6 0.6 32 84 5.5
Large Wall-Fired Boilers (>100)-Uncontrolled (Pre-NSPS)l k) 7.6 0.6 280 84 5.5-Uncontrolled (Post-NSPS) (k) 7.6 0.6 1 90 84 5.5-Controlled-Low NO, burners 7.6 0.6 140 84 5.5-Controlled-Flue gas recirculation 7.6 0.6 100 84 5.5
Source: AP-42, 5th Edition, Supplements A, B, C, D, and E, Tables 1.4-1 and 1.4-2.
DISTILLATE OIL (DF-2) - CRITERIA POLLUTANTS
Emission Factor (lb/1,000 gal fuel burned)Combustor Type
PM(a) SOP) NO,(`) CO VOCP
Residential Furnace (e) 0.4 142S 18 5 0.713
Boilers < 100 Million Btu/hr (Commercial/Institutional Combust.() 2 142S 20 5 0.34
Boilers < 100 Million Btu/hr (Industrial Boilers (g)) 2 1 42S 20 5 0.2
Boilers > 100 Million Btu/hr (Utility Boilers (h) ) 2 157S 24 5 --
Source: AP-42, 5th Edition, Supplements A, B, C, D, and E, Tables 1.3-1 and 1.3-3.
Fuel Heating Value Sulfur Content
No. 2 Distillate Fuel Oil/Diesel 140,000 Btu/gal 0.05% by weight
Natural Gas 1,050 Btu/ft 3 2,000 grains/106 ft3
Propane 91,500 Btu/gal 0.18 grains/ 100 ft3

STATIONARY SOURCE EMISSION FACTORS - BOILERS/HEATING UNITS (Continued)
STATIONARY SOURCE EMISSION FACTORS - GENERATORS
For generators rated at less than or equal to 448 kW (600 hp):
For generators rated at greater than 448 kW (600 hp):
FIREPLACE EMISSION FACTORS
Fuel Type Emission Factor (lb/ton)
PM° ) SO,, NO.(`) CO VOC
Wood 34.6 0.4 2.6 252.6 229.0
Source: AP-42, 5th Edition, Supplements A, B, C, D, and E, Table 1.9-1.
Emission Factor (lb/hp-hr)Fuel Type
PM SO X(b) NO, CO VOC
DF-2 0.0007 (8.09 E-03)S 0.024 5.5 E-03 6.4 E-04
Source: AP-42, 5th Edition, Supplements A, B, C, D, and E, Table 3.4-1.
Fuel Type
Emission Factor (lb/hp-hr)
PM SO,, NO, CO VOC
DF-2 2.20 E-03 ,
2.05 E-03 0.031 6.68 E-03 2.51 E-03
Gasoline 7.21 E-04 5.91 E-04 0.011 0.439 0.022
l
Natural Gas/Propane 1.54 E-04 7.52 E-03(S) 3.53 E-03 8.6 E-04 1.92 E-04
Source: AP-42, 5th Edition, Supplements A, B, C, D, and E, Table 3.3-1 and 3.1-1
PROPANE (LPG) - CRITERIA POLLUTANTS
Combustor TypeEmission Factor (lb/1,000 al fuel burned)
PM ( a )S02
(b) NO,(` ) CO VOCd,
Commercial Boilers(f) 0.4 0.10S 14 1.9 0.3
Industrial Boilers(s ) 0.6 0.10S 19 3.2 0.3
Source: AP-42. 5th Edition, Supplements A, B, C, D, and E, Table 1.5-1.

WOODSTOVE EMISSION FACTORS
STATIONARY SOURCE EMISSION FACTORS - SURFACE COATING OPERATIONS
(a)
PM = Filterable Particulate Matter.(b)
These factors must be multiplied by the fuel sulfur content (for example, if the sulfur content is 0.05%, thenS equals 0.05).
(c)
Expressed as NO2 .(d) Emission factors given in AP-42 are actually for non-methane total organic compounds (NMTOC) which
includes all VOCs and all exempted organic compounds (such as ethane, toxics and HAPs, aldehydes andsemivolatile compounds) as measured by EPA reference methods.
(e)
Unit Rating <300,000 Btu/hr.
(f)
Unit Rating 3300,000 Btu/hr, but <10,000,000 Btu/hr.(g)
Unit Rating 310,000,000 Btu/hr, but <100,000,000 Btu/hr.
(h)
Unit Rating 3100,000,000 Btu/hr.(i)
POM = Particulate POM only.(j)
PM = Filterable Particulate Matter + Condensible Particulate Matter.
(k)
NSPS = New Source Performance Standard as defined in 40 CFR 60 Subparts D and Db. Post-NSPS unitsare boilers with greater than 250 MMBtu/hr of heat input that commenced construction, modification, orreconstruction after August 17, 1971, and units with heat input capacities between 100 and 250 MMBtu/hrthat commenced construction, modification, or reconstruction after June 19, 1984.
(I)
Emission factors are given on a fuel input basis (lb/MMBtu). To convert to a power output basis (lb/hp-hr),use an average brake-specific fuel consumption (BSFC) of 7,000 Btu/hp-hr.
Surface Coating Type VOC Emission Factor (lb/gal)
Paint: Solvent Base 5.6
Paint: Water Base 1.3
Enamel: General 3.5
Lacquer: General 6.1
Primer: General 6.6
Varnish/Shellac: General 3.3
Thinner: General 7.36
Adhesive: General 4.4
Source: Calculation Methods for Criteria Air Pollutant Emission Inventories, AL/OE-TR- 1 994-0049,July 1994. Armstrong Laboratory.
Stove TypeEmission Factor (lb/ton)
PM° ) SOX NO,, (c) CO VOC
Conventional 30.6 0.4 2.8 230.8 53
Noncatalytic 1 9.6 0.4 -- 140.8 12
Catalytic 20.4 0.4 2.0 1 04.4 1 5
Source: AP-42, 5th Edition, Supplements A, B, C, D, and E, Table 1.10-1.

APPENDIX B
EMISSION CALCULATIONS

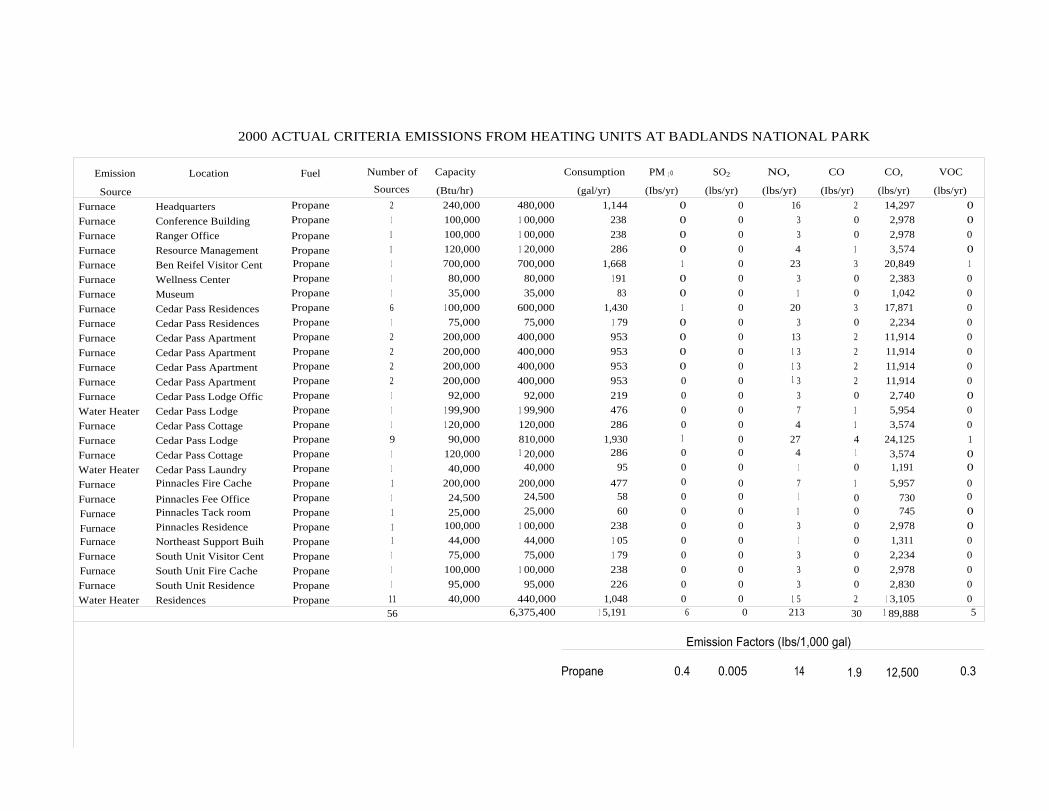
2000 ACTUAL CRITERIA EMISSIONS FROM HEATING UNITS AT BADLANDS NATIONAL PARK
Emission
Source
Location Fuel Number of
Sources
Capacity
(Btu/hr)
Consumption
(gal/yr)
PM 1 0
SO2
(Ibs/yr)
(lbs/yr)
NO,
(lbs/yr)
CO
(Ibs/yr)
CO,
(lbs/yr)
VOC
(lbs/yr)
Furnace Headquarters Propane 2 240,000 480,000 1,144 0 0 16 2 14,297 0
Furnace Conference Building Propane 1 100,000 1 00,000 238 0 0 3 0 2,978 0
Furnace Ranger Office Propane 1 100,000 1 00,000 238 0 0 3 0 2,978 0
Furnace Resource Management Propane 1 120,000 1 20,000 286 0 0 4 1 3,574 0
Furnace Ben Reifel Visitor Cent Propane 1 700,000 700,000 1,668 1 0 23 3 20,849 1
Furnace Wellness Center Propane 1 80,000 80,000 1 91 0 0 3 0 2,383 0
Furnace Museum Propane 1 35,000 35,000 83 0 0 1 0 1,042 0
Furnace Cedar Pass Residences Propane 6 1 00,000 600,000 1,430 1 0 20 3 17,871 0
Furnace Cedar Pass Residences Propane 1 75,000 75,000 1 79 0 0 3 0 2,234 0
Furnace Cedar Pass Apartment Propane 2 200,000 400,000 953 0 0 13 2 11,914 0
Furnace Cedar Pass Apartment Propane 2 200,000 400,000 953 0 0 1 3 2 11,914 0
Furnace Cedar Pass Apartment Propane 2 200,000 400,000 953 0 0 1 3 2 11,914 0
Furnace Cedar Pass Apartment Propane 2 200,000 400,000 953 0 0 1 3 2 11,914 0
Furnace Cedar Pass Lodge Offic Propane 1 92,000 92,000 219 0 0 3 0 2,740 0
Water Heater Cedar Pass Lodge Propane 1 1 99,900 1 99,900 476 0 0 7 1 5,954 0
Furnace Cedar Pass Cottage Propane 1 1 20,000 120,000 286 0 0 4 1 3,574 0
Furnace Cedar Pass Lodge Propane 9 90,000 810,000 1,930 1 0 27 4 24,125 1
Furnace Cedar Pass Cottage Propane 1 120,000 1 20,000 286 0 0 4 1 3,574 0
Water Heater Cedar Pass Laundry Propane 1 40,000 40,000 95 0 0 1 0 1,191 0
Furnace Pinnacles Fire Cache Propane 1 200,000 200,000 477 0 0 7 1 5,957 0
Furnace Pinnacles Fee Office Propane 1 24,500 24,500 58 0 0 1 0 730 0
Furnace Pinnacles Tack room Propane 1 25,000 25,000 60 0 0 1 0 745 0
Furnace Pinnacles Residence Propane 1 100,000 1 00,000 238 0 0 3 0 2,978 0
Furnace Northeast Support Buih Propane 1 44,000 44,000 1 05 0 0 1 0 1,311 0
Furnace South Unit Visitor Cent Propane 1 75,000 75,000 1 79 0 0 3 0 2,234 0
Furnace South Unit Fire Cache Propane 1 100,000 1 00,000 238 0 0 3 0 2,978 0
Furnace South Unit Residence Propane 1 95,000 95,000 226 0 0 3 0 2,830 0
Water Heater Residences Propane 11 40,000 440,000 1,048 0 0 1 5 2 1 3,105 0
56 6,375,400 1 5,191 6 0 213 30 1 89,888 5
Emission Factors (Ibs/1,000 gal)
Propane 0.4
0.005
14
1.9 12,500 0.3
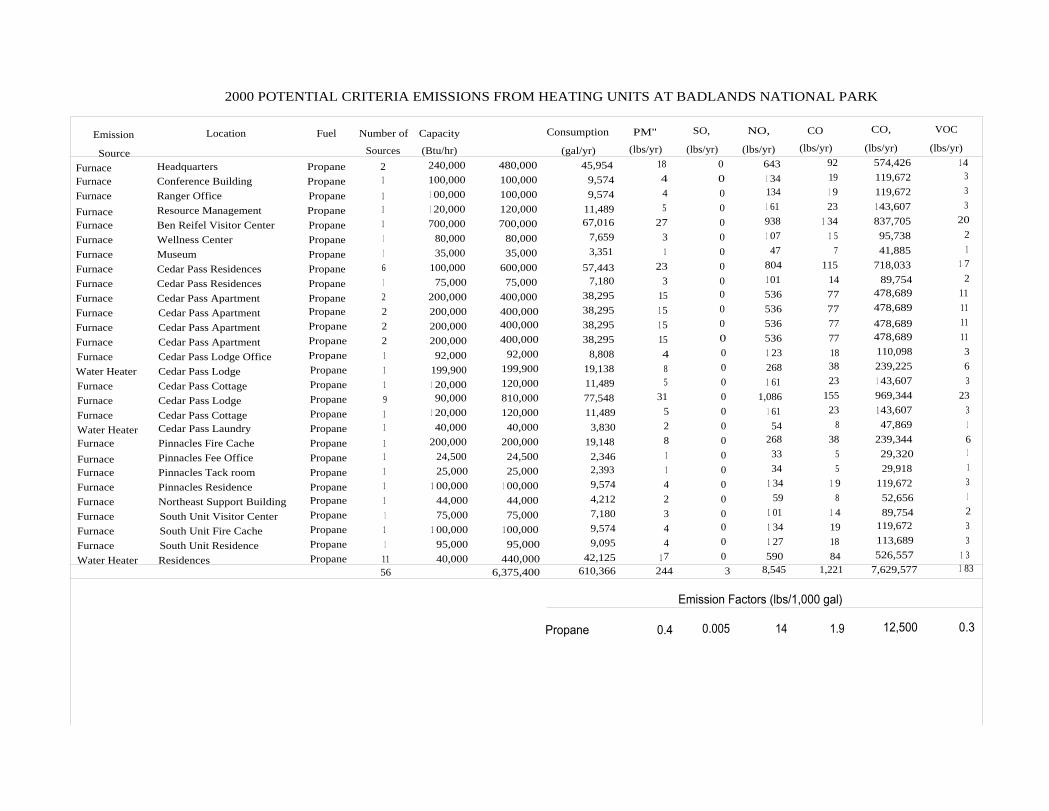
2000 POTENTIAL CRITERIA EMISSIONS FROM HEATING UNITS AT BADLANDS NATIONAL PARK
Emission
Source
Location Fuel Number of
Sources
Capacity
(Btu/hr)
Consumption
(gal/yr)
PM"
(lbs/yr)
SO,
NO,
(lbs/yr)
(lbs/yr)
CO
(lbs/yr)
CO,
(lbs/yr)
VOC
(lbs/yr)
Furnace Headquarters Propane 2 240,000 480,000 45,954 18 0 643 92 574,426 1 4
Furnace Conference Building Propane 1 100,000 100,000 9,574 4 0 1 34 19 119,672 3
Furnace Ranger Office Propane 1 1 00,000 100,000 9,574 4 0 134 1 9 119,672 3
Furnace Resource Management Propane 1 1 20,000 120,000 11,489 5 0 1 61 23 1 43,607 3
Furnace Ben Reifel Visitor Center Propane 1 700,000 700,000 67,016 27 0 938 1 34 837,705 20
Furnace Wellness Center Propane 1 80,000 80,000 7,659 3 0 1 07 1 5 95,738 2
Furnace Museum Propane 1 35,000 35,000 3,351 1 0 47 7 41,885 1
Furnace Cedar Pass Residences Propane 6 100,000 600,000 57,443 23 0 804 115 718,033 1 7
Furnace Cedar Pass Residences Propane 1 75,000 75,000 7,180 3 0 1 01 14 89,754 2
Furnace Cedar Pass Apartment Propane 2 200,000 400,000 38,295 15 0 536 77 478,689 11
Furnace Cedar Pass Apartment Propane 2 200,000 400,000 38,295 1 5 0 536 77 478,689 11
Furnace Cedar Pass Apartment Propane 2 200,000 400,000 38,295 1 5 0 536 77 478,689 11
Furnace Cedar Pass Apartment Propane 2 200,000 400,000 38,295 15 0 536 77 478,689 11
Furnace Cedar Pass Lodge Office Propane 1 92,000 92,000 8,808 4 0 1 23 18 110,098 3
Water Heater Cedar Pass Lodge Propane 1 199,900 199,900 19,138 8 0 268 38 239,225 6
Furnace Cedar Pass Cottage Propane 1 1 20,000 120,000 11,489 5 0 1 61 23 1 43,607 3
Furnace Cedar Pass Lodge Propane 9 90,000 810,000 77,548 31 0 1,086 155 969,344 23
Furnace Cedar Pass Cottage Propane 1 1 20,000 120,000 11,489 5 0 1 61 23 1 43,607 3
Water Heater Cedar Pass Laundry Propane 1 40,000 40,000 3,830 2 0 54 8 47,869 1
Furnace Pinnacles Fire Cache Propane 1 200,000 200,000 19,148 8 0 268 38 239,344 6
Furnace Pinnacles Fee Office Propane 1 24,500 24,500 2,346 1 0 33 5 29,320 1
Furnace Pinnacles Tack room Propane 1 25,000 25,000 2,393 1 0 34 5 29,918 1
Furnace Pinnacles Residence Propane 1 1 00,000 1 00,000 9,574 4 0 1 34 1 9 119,672 3
Furnace Northeast Support Building Propane 1 44,000 44,000 4,212 2 0 59 8 52,656 1
Furnace South Unit Visitor Center Propane 1 75,000 75,000 7,180 3 0 1 01 1 4 89,754 2
Furnace South Unit Fire Cache Propane 1 1 00,000 1 00,000 9,574 4 0 1 34 19 119,672 3
Furnace South Unit Residence Propane 1 95,000 95,000 9,095 4 0 1 27 18 113,689 3
Water Heater Residences Propane 11 40,000 440,000 42,125 1 7 0 590 84 526,557 1 3
56 6,375,400 610,366 244 3 8,545 1,221 7,629,577 1 83
Emission Factors (lbs/1,000 gal)
Propane 0.4 0.005
14
1.9 12,500 0.3
2000 ACTUAL CRITERIA EMISSIONS FROM GENERATORS AT BADLANDS NATIONAL PARK
Emission
Location
Fuel
Number of Rating Run Time
Output
PM"
SO,
NO,
CO
Source
Sources
(kW)
(hrs/yr)
(kW-hr/yr)
(Ibs/yr)
(lbs/yr)
(lbs/yr)
(Ibs/yr)
CO,
(Ibs/yr)
VOC
(Ibs/yr)Generator Maintenance Shop
Diesel
1
1 00
1 3
1,300
4
0
54
1 2 2,003 4
Emission Factors from AP-42, Chapter 3.4-1 for generators rated less than 448 kW, 5=.05
2.20E-03 0.00205*S
3.10E-02
6.68E-03Formula = Output (kW-hr/yr) * 1.34 (hp/kW) * Emission Factor (lb/hp-hr)
1.15E+00 2.51E-03
2000 POTENTIAL CRITERIA EMISSIONS FROM GENERATORS AT BADLANDS NATIONAL PARK
Emission Location
Fuel
Number of Rating Run Time
Output
PM"
SO,
NO,
CO CO2 VOC
Source Sources
(kW)
(hrs/yr)
(kW-hr/yr)
(lbs/yr)
(lbs/yr)
(Ibs/yr)
(lbs/yr) (lbs/yr) (lbs/yr)Generator Maintenance Shop
Diesel
1
1 00
500
50,000
1 47
7
2,077
448 77,050 168

Badlands Cedar PassNPS
6/21/02 2:34:44 PM
TANKS 4.0Emissions Report - Summary Format
Tank Identification and Physical Characteristics
Meteorological Data used in Emissions Calculations: Rapid City, South Dakota (Avg Atmospheric Pressure = 13.11 psia)
Horizontal TankRapid City, South Dakota
Page 1
I dentificationUser Identification:City:State:Company:Type of Tank:Description:
Badlands Cedar PassRapid CitySouth DakotaNPSHorizontal TankSandstone AST
Tank DimensionsShell Length (ft): 9.00Diameter (ft): 5.25Volume (gallons): 1,600.00Turnovers: 0.00Net Throughput (gal/yr): 28,000.00Is Tank Heated (y/n):I s Tank Underground (y/n):
Paint CharacteristicsShell Color/Shade:Shell Condition:
NN
Gray/LightGood
Breather Vent SettingsVacuum Settings (psig): -0.03Pressure Settings (psig): 0.03

Badlands Cedar PassNPS
6/21/02 2:34:44 PM
TANKS 4.0Emissions Report - Summary Format
Liquid Contents of Storage Tank
Horizontal TankRapid City, South Dakota
Page 2
Daily Liquid Surf.Liquid
Bulk Vapor Liquid VaporTemperatures (deg F) Temp. Vapor Pressures (psia) Mol. Mass Mass Mol. Basis for Vapor Pressure
Mixture/Component Month Avg.
Min. Max. (deq F) Avg.
Min. Max. Weight Fract. Fract, Weight Calculations
Gasoline (RVP 9) All 53.53
43.82 63.25 48.77 4.0537
3.3197 4.9134 67.0000 92.00 Option 4: RVP=9, ASTM Slope=3

Badlands Cedar PassNPS
Annual Emissions Report
TANKS 4.0Emissions Report - Summary Format
Individual Tank Emission Totals
6/21/02 2:34:44 PM
Horizontal TankRapid City, South Dakota
Page 3
Losses(lbs)Components Working Loss Breathing Loss Total EmissionsGasoline (RVP 9) 181.06 350.04 531.10

Badlands PinnaclesNPS
6/21/02 2:37:35 PM
TANKS 4.0Emissions Report - Summary Format
Tank Identification and Physical Characteristics
Meteorological Data used in Emissions Calculations: Rapid City, South Dakota (Avg Atmospheric Pressure = 13.11 psia)
Horizontal TankRapid City, South Dakota
Page 1
I dentificationUser Identification:City:State:Company:Type of Tank:Description:
Badlands PinnaclesRapid CitySouth DakotaNPSHorizontal TankAST
Tank DimensionsShell Length (ft): 6.00Diameter (ft): 5.25Volume (gallons): 1,000.00Turnovers: 0.00Net Throughput (gal/yr): 1,000.00I s Tank Heated (y/n):I s Tank Underground (y/n):
Paint CharacteristicsShell Color/Shade:Shell Condition:
NN
Gray/LightGood
Breather Vent SettingsVacuum Settings (psig): -0.03Pressure Settings (psig): 0.03

Badlands PinnaclesNPS
TANKS 4.0Emissions Report - Summary Format
Liquid Contents of Storage Tank
6/21/02 2:37:35 PM
Horizontal TankRapid City, South Dakota
Page 2
Daily Liquid Surf.Liquid
Bulk Vapor Liquid VaporTemperatures (deg F) Temp. Vapor Pressures (psia) Mot. Mass Mass Mol. Basis for Vapor PressureMixture/Com onent Month A
Min. Max. de F Av
Min. Max Wei t Fract. Fract. Wei ht CalculationsGasoline (RVP 9) All 53.53
43.82 63.25 48.77 4.0537
3.3197 4.9134 67.0000 92.00 Option 4: RVP=9, ASTM Slope=3

Badlands PinnaclesNPS
6/21/02 2:37:35 PM
TANKS 4.0Emissions Report - Summary Format
I ndividual Tank Emission Totals
Horizontal TankRapid City, South Dakota
Page 3
Annual Emissions Report
Losses(lbs)Components Working Loss Breathing Loss Total EmissionsGasoline (RVP 9) 6.47 233.36 239.83
-----------------------------------------------------------------------------------TITLE: Results of FOFEM model execution on date: 1/31/2003
FIRE EFFECTS ON FOREST FLOOR COMPONENTS
Emissions -- lbs/acreflaming
smoldering
total--------------------------------------------------------------
--------------------------------------------------------------
FUEL CONSUMPTION CALCULATIONS
Region:
Interior WestCover Type: SAF/SRM - SRM 607 - Wheatgrass - NeedlegrassFuel Type: NaturalFuel Reference: FOFEM 271
FuelComponentName
PreburnLoad(t/acre)
FUELConsumedLoad
( t/acre)
CONSUMPTIONPostburnLoad
( t/acre)
TABLEPercentReduced( o)
EquationReferenceNumber Moisture
Litter 0.00 0.00 0.00 0.0 999Wood (0-1/4 inch) 0.00 0.00 0.00 0.0 999Wood (1/4-1 inch) 0.00 0.00 0.00 0.0 999 25.0Wood (1-3 inch) 0.00 0.00 0.00 0.0 999Wood (3+ inch) Sound 0.00 0.00 0.00 0.0 999 20.0
3->6 0.00 0.00 0.00 0.06->9 0.00 0.00 0.00 0.09->20 0.00 0.00 0.00 0.020-> 0.00 0.00 0.00 0.0
Wood (3+ inch) Rotten 0.00 0.00 0.00 0.0 999 20.03->6 0.00 0.00 0.00 0.06->9 0.00 0.00 0.00 0.09->20 0.00 0.00 0.00 0.020-> 0.00 0.00 0.00 0.0
Duff 0.00 0.00 0.00 0.0 2 100.0Herbaceous 0.63 0.57 0.06 90.0 221Shrubs 0.00 0.00 0.00 0.0 23Crown foliage 0.00 0.00 0.00 0.0 37Crown branchwood 0.00 0.00 0.00 0.0 38Total Fuels 0.63 0.57 0.06 90.0
PM 10 3 0PM 2.5 3 0CH 4 1 0 1CO 7 0 7CO 2 2017 0 2017
Forest Floor Preburn Amount Postburn Percent EquationComponent Condition Consumed Condition Reduced NumberDuff Depth (in) 0.0
0.0 0.0
0.0 6Min Soil Exp ( U . 0
21.9 21.9
21.9 10
Consumptiontons/acre
Durationhour: min: sec
Flaming: 0.57 00:01:00Smoldering: 0.00 00:00:00Total: 0.57
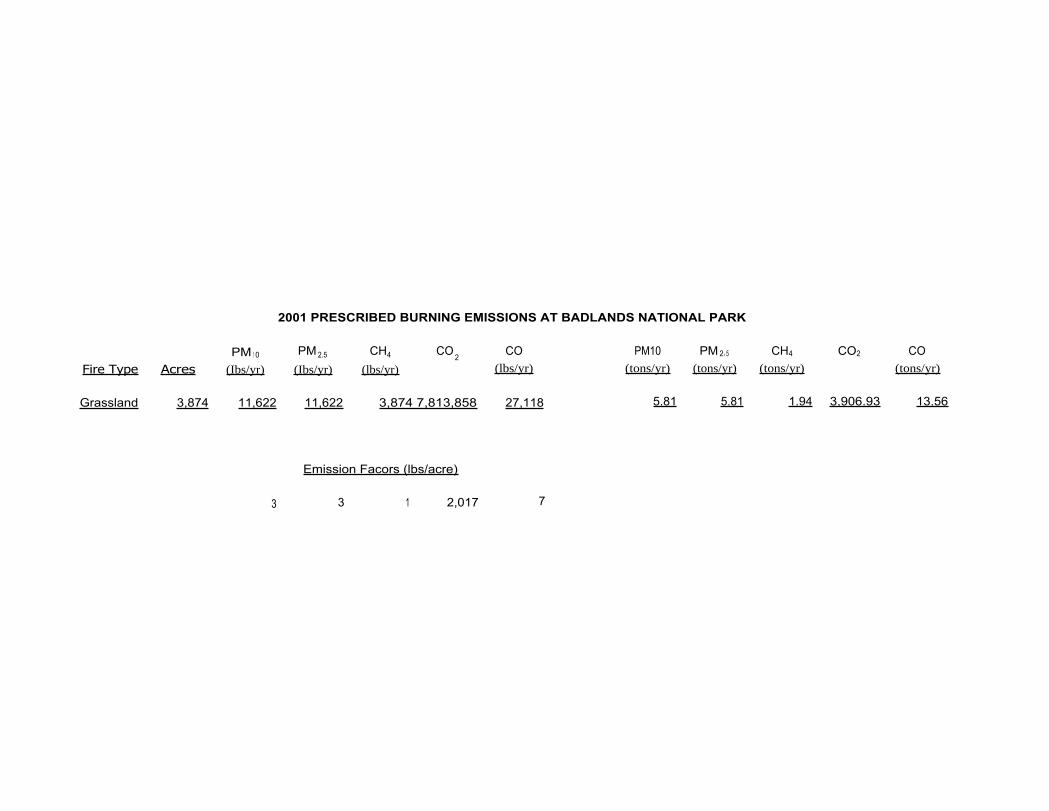
2001 PRESCRIBED BURNING EMISSIONS AT BADLANDS NATIONAL PARK
PM 1 0
PM 2.5
CH4
CO 2
CO
PM10
PM 2, 5
CH4
CO2
CO Fire Type Acres (Ibs/yr) (Ibs/yr) (lbs/yr) (lbs/yr) (tons/yr) (tons/yr) (tons/yr) (tons/yr)
Grassland 3,874 11,622 11,622 3,874 7,813,858 27,118 5.81 5.81 1.94 3,906.93 13.56
Emission Facors (lbs/acre)
3
3
1
2,017
7
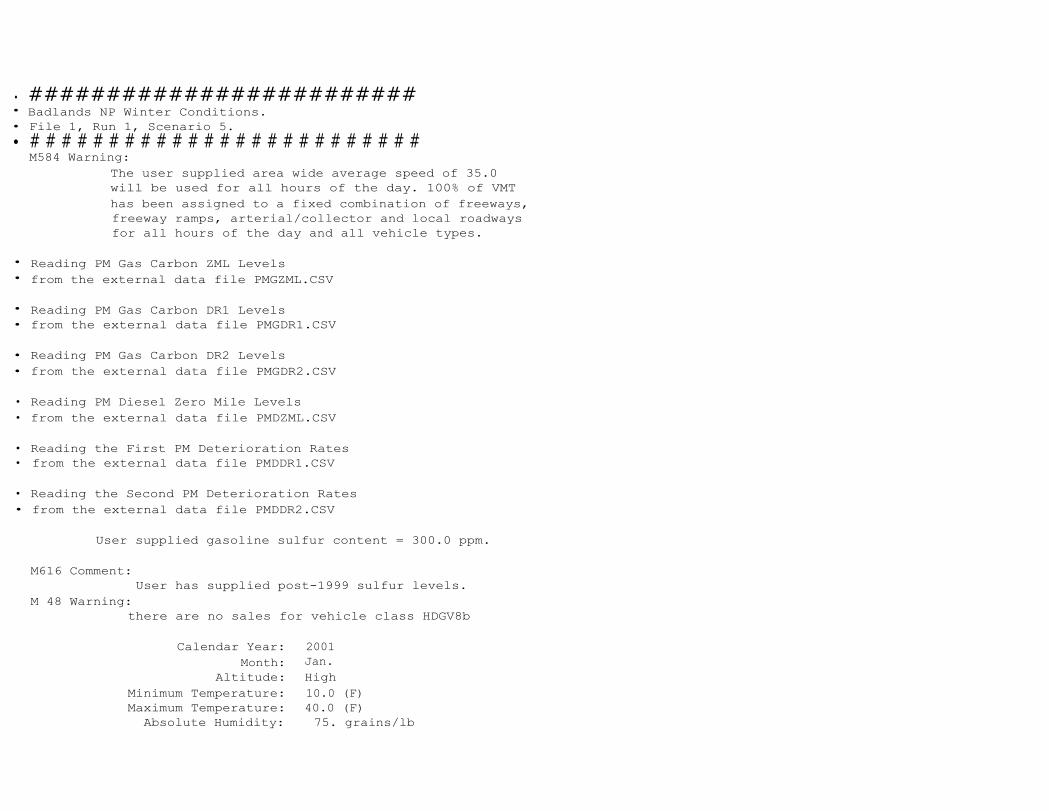
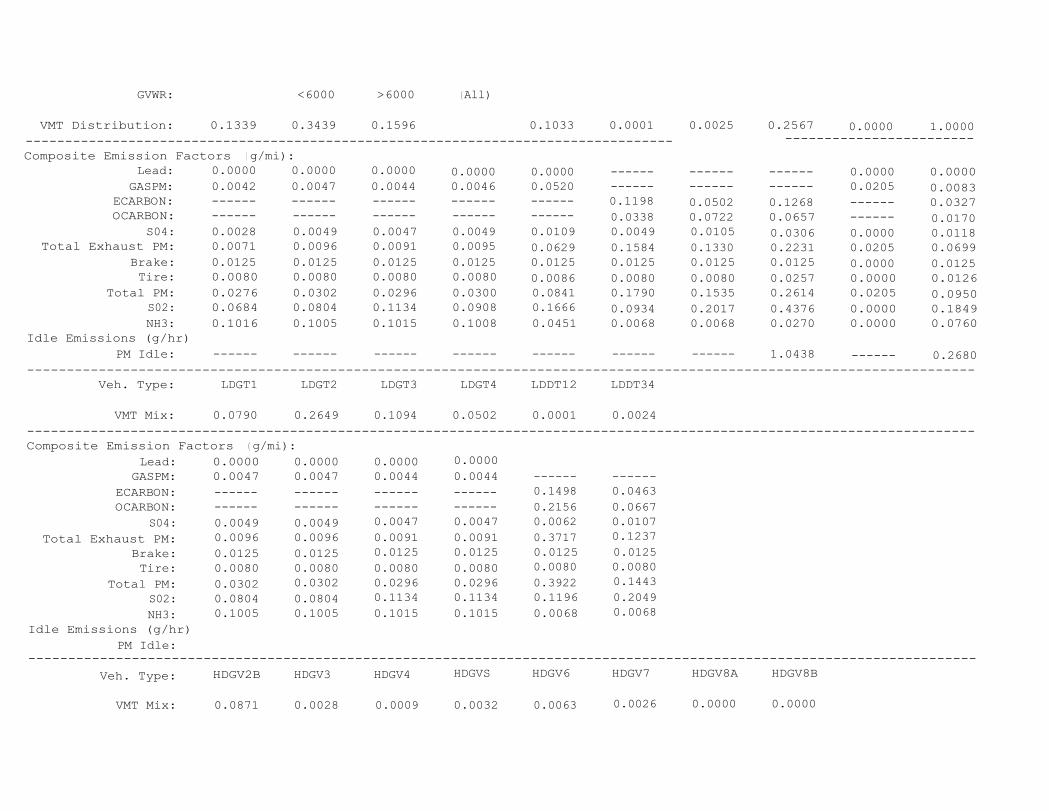
• #########################•
Badlands NP Winter Conditions.•
File 1, Run 1, Scenario 5.•
# # # # # # # # # # # # # # # # # # # # # # # # #M584 Warning:
The user supplied area wide average speed of 35.0will be used for all hours of the day. 100% of VMThas been assigned to a fixed combination of freeways,freeway ramps, arterial/collector and local roadwaysfor all hours of the day and all vehicle types.
•
Reading PM Gas Carbon ZML Levels•
from the external data file PMGZML.CSV
•
Reading PM Gas Carbon DR1 Levels•
from the external data file PMGDR1.CSV
•
Reading PM Gas Carbon DR2 Levels•
from the external data file PMGDR2.CSV
•
Reading PM Diesel Zero Mile Levels•
from the external data file PMDZML.CSV
•
Reading the First PM Deterioration Rates•
from the external data file PMDDR1.CSV
•
Reading the Second PM Deterioration Rates•
from the external data file PMDDR2.CSV
User supplied gasoline sulfur content = 300.0 ppm.
M616 Comment:User has supplied post-1999 sulfur levels.
M 48 Warning:there are no sales for vehicle class HDGV8b
Calendar Year: 2001Month: Jan.
Altitude: HighMinimum Temperature: 10.0 (F)Maximum Temperature: 40.0 (F)
Absolute Humidity:
75. grains/lb

Nominal Fuel RVP: 13.4 psiWeathered RVP: 13.4 psi
Fuel Sulfur Content: 299. ppm
Exhaust I/M Program: NoEvap I/M Program: No
ATP Program: NoReformulated Gas: No
Vehicle Type:
LDGV
LDGT12
LDGT34
LDGT
HDGV
LDDV
LDDT
HDDV
MC All VehGVWR:
<6000
>6000
(All)____
_ ____
_____VMT Distribution: 0.1339 0.3439 0.1596 0.1033 0.0001 0.0035 0.2567 0.0000 1.0000--------------------------------------------------------------------------------------------------
Compooite Emission Factors (g/mi):Composite VOC ` 0.823 1.150 1.039 1.115 0.984 0.410 0.466 0.810 0.00 0.982Composite CO ~ 20.08 36.58 23.74 25.68 29.05 1.278 1.006 4.431 0.00 19.757Composite NOX ~
0.878
1.282
1.493
1.349
3.980
1.254
1.231
14.858
0.08
5.026------------------------------------------------------------------------------------------------------
vah. Type:
LDGT1
LDGT2
LDGT3
LDGT4
LDDT12
LDDT34
VMT Mix:
0.0790
0.2649
0.1094
0.0502
0.0001
0.0024___________________________________________________________________________________________________Compooite Emission Factors (g/mi):
Composite VOC 1.076 1.172 1.010 1.101 2.424 0.390Composite CO ~ 25.85 26.80 23.62 24.02 6.522 0.792Composite NOX ~
1.007
1.364
1.347
1.812
2.555
1.179_________________________________________________________________________________________________________
Veh. Type:
HDGV2B
HDGV3
HDGV4
BoGv5
HDGV6
HDGV7
HDGV8A
aDGV8B
VMT Mix:
0.0871
0.0028
0.0003
0.0032
0.0063
0.0026
0.0000
0.0000--------------------------------------------------------------------------------------------------
-----
----------------------------------------------------------------------------------------------------------------------Veh. Type:
HDDV2B
HDDV3
HDDV4
HDDV5
HDDV6
HDDV7
HDDV8A
HDDV8B------
----nnMT Mix:
0.0299
0.0092
0.0081
0.0038
0.0187
0.0274
0.0330
0.1190________________________________________________________________________________________________Composite Emission Factors (g/mi):
Compoaite Emission Factors ( g/mi):Composite VOC ~ 0.959 0.976 1.007 1.140 1.131 1.241 1.354 0.000Composite CO ~ 28.18 29.09 29.80 34.22 33.97 37.43 40.56 0.00Composite NOX ~ 3.920 4.076 3.727 4.285 4.258 4.692 5.086 0.000

----------------------------------------------------------------------------------------------------------------------
•
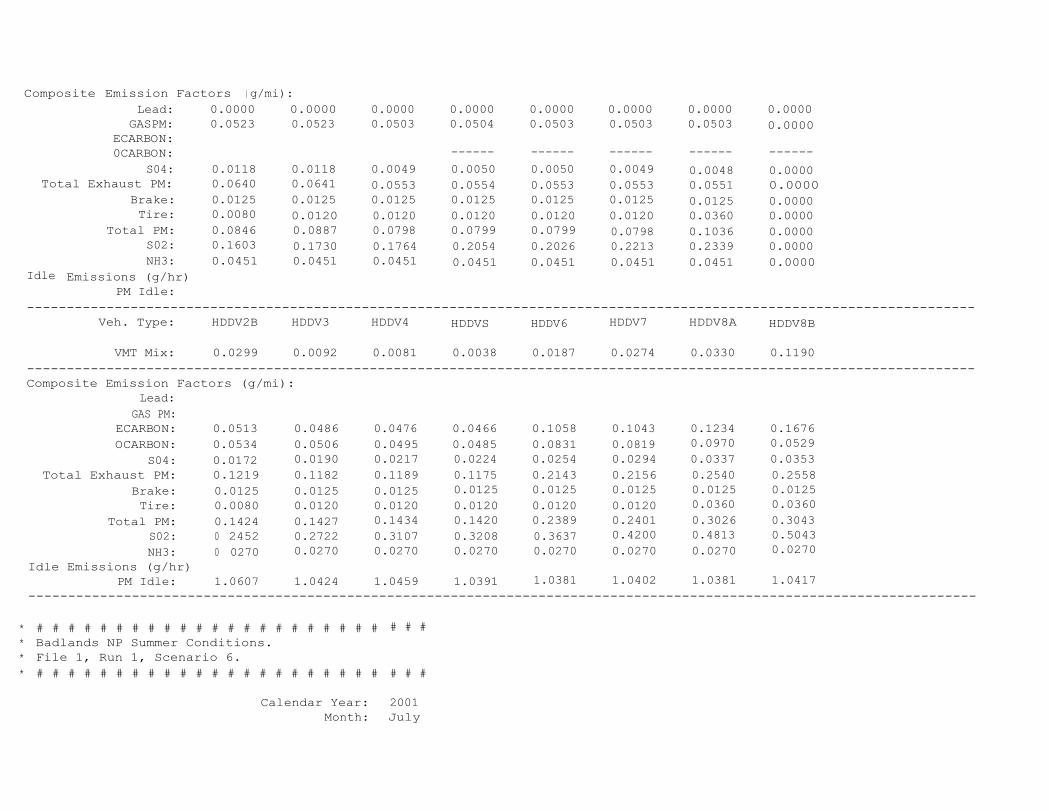
# # # # # # # # # # # # # # # # # # # # # # # # #•
Badlands NP Summer Conditions.•
File 1, Run 1, Scenario 6.•
# # # # # # # # # # # # # # # # # # # # # # # # #M584 Warning:
The user supplied area wide average speed of 35.0will be used for all hours of the day. 100% of VMThas been assigned to a fixed combination of freeways,freeway ramps, arterial/collector and local roadwaysfor all hours of the day and all vehicle types.
•
Reading PM Gas Carbon ZML Levels•
from the external data file PMGZML.CSV
•
Reading PM Gas Carbon DR1 Levels•
from the external data file PMGDR1.CSV
•
Reading PM Gas Carbon DR2 Levels•
from the external data file PMGDR2.CSV
•
Reading PM Diesel Zero Mile Levels•
from the external data file PMDZML.CSV
•
Reading the First PM Deterioration Rates•
from the external data file PMDDR1.CSV
•
Reading the Second PM Deterioration Rates•
from the external data file PMDDR2.CSV
User supplied gasoline sulfur content = 300.0 ppm.
M616 Comment:User has supplied post-1999 sulfur levels.
M 48 Warning:there are no sales for vehicle class HDGV8b
Calendar Year: 2001
Composite VOC : 0.378 0.430 0.502 0.538 0.776 0.963 0.827 0.932Composite CO 1.941 2.258 2.634 2.859 2.832 3.515 4.997 5.670Composite NOX : 4.149 4.695 5.517 5.943 9.043 11.209 17.871 20.215
Exhaust I/M Program: NoEvap I/M Program: No
ATP Program: NoReformulated Gas: No
Vehicle Type:
LDGV
LDGT12
LDGT34
LDGT
HDGV
LDDVGVWR:
<6000
>6000
( All)
VMT Distribution:
0.1339
0.3439
0.1596
0.1034
0.0001-------------------------------------------------------------------------------------------------------------------
Composite Emission Factors (g/mi):
----------------------------------------------------------------------------------------------------------------------Veh. Type:
LDGT1
LDGT2
LDGT3
LDGT4
LDDT12
LDDT34------
------VMT Mix:
0.0790
0.2649
0.1094
0.0502
0.0001
0.0024----------------------------------------------------------------------------------------------------------------------Composite Emission Factors (g/mi):
Veh. Type:
HDGV2B
HDGV3
HDGV4----------------------------------------------------------------------------------------------------------------------
HDGV5
HDGV6
HDGV7
HDGV8A
HDGV8B
VMT Mix:
0.0874
0.0028
0.0009
0.0031
0.0062
0.0026
0.0000
0.0000---------------------------------------------------------------------------------------------------
LDDT
HDDV
MC All Veh
0.0025
0.2566
0.0000
1.0000
---------------
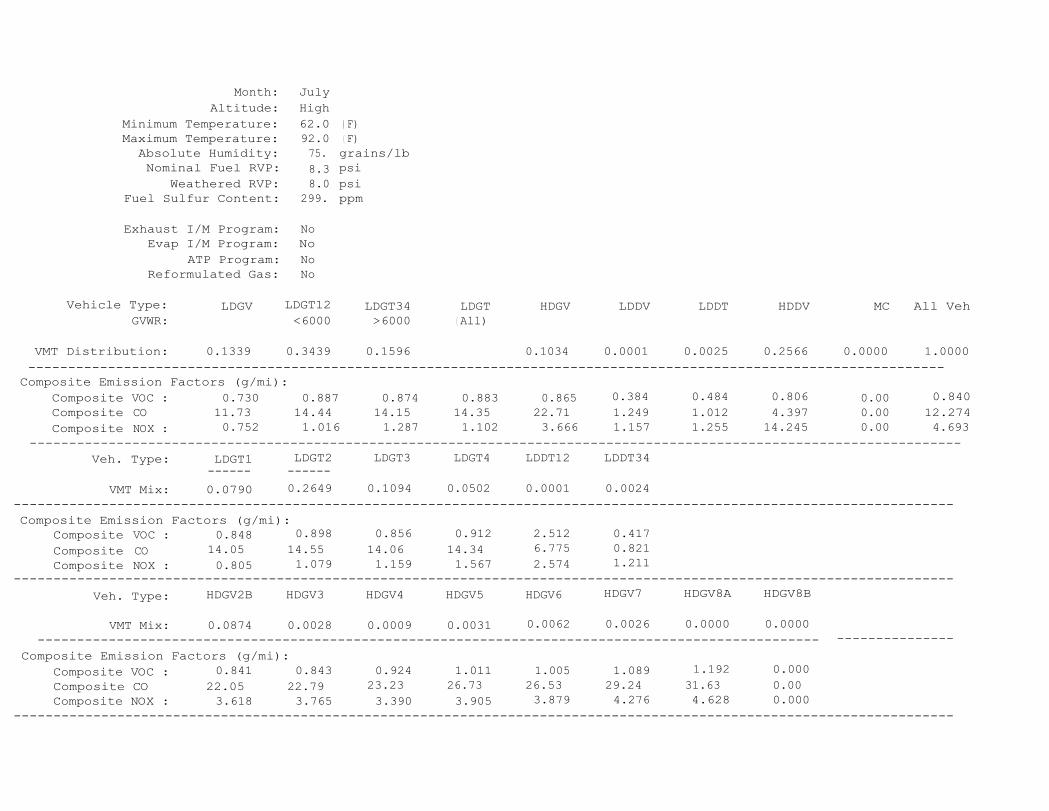
Composite Emission Factors (g/mi):Composite VOC : 0.841 0.843 0.924 1.011 1.005 1.089 1.192 0.000Composite CO 22.05 22.79 23.23 26.73 26.53 29.24 31.63 0.00Composite NOX :
3.618
3.765
3.390
3.905
3.879
4.276
4.628
0.000----------------------------------------------------------------------------------------------------------------------
Composite VOC : 0.730 0.887 0.874 0.883 0.865 0.384 0.484 0.806 0.00 0.840Composite CO 11.73 14.44 14.15 14.35 22.71 1.249 1.012 4.397 0.00 12.274Composite NOX : 0.752 1.016 1.287 1.102 3.666 1.157 1.255 14.245 0.00 4.693
Composite VOC : 0.848 0.898 0.856 0.912 2.512 0.417Composite CO 14.05 14.55 14.06 14.34 6.775 0.821Composite NOX : 0.805 1.079 1.159 1.567 2.574 1.211
Month:Altitude:
Minimum Temperature:
JulyHigh62.0 ( F)
Maximum Temperature: 92.0 ( F)Absolute Humidity: 75. grains/lbNominal Fuel RVP: 8.3 psi
Weathered RVP: 8.0 psiFuel Sulfur Content: 299. ppm

Veh. Type:
HDDV2B
HDDV3
HDDV4
HDDV5
HDDV6
HDDV7
HDDV8A
HDDV8E
VMT Mix:
0.0296
0.0092
0.0081
0.0039
0.0188
0.0274
0.0330
0.1190----------------------------------------------------------------------------------------------------------------------Composite Emission Factors (g/mi):
----------------------------------------------------------------------------------------------------------------------
Composite VOC : 0.374 0.426 0.498 0.534 0.773 0.959 0.822 0.926Composite CO 1.956 2.270 2.648 2.871 2.810 3.487 4.951 5.612Composite NOX : 4.077 4.617 5.427 5.847 8.744 10.841 17.060 19.274
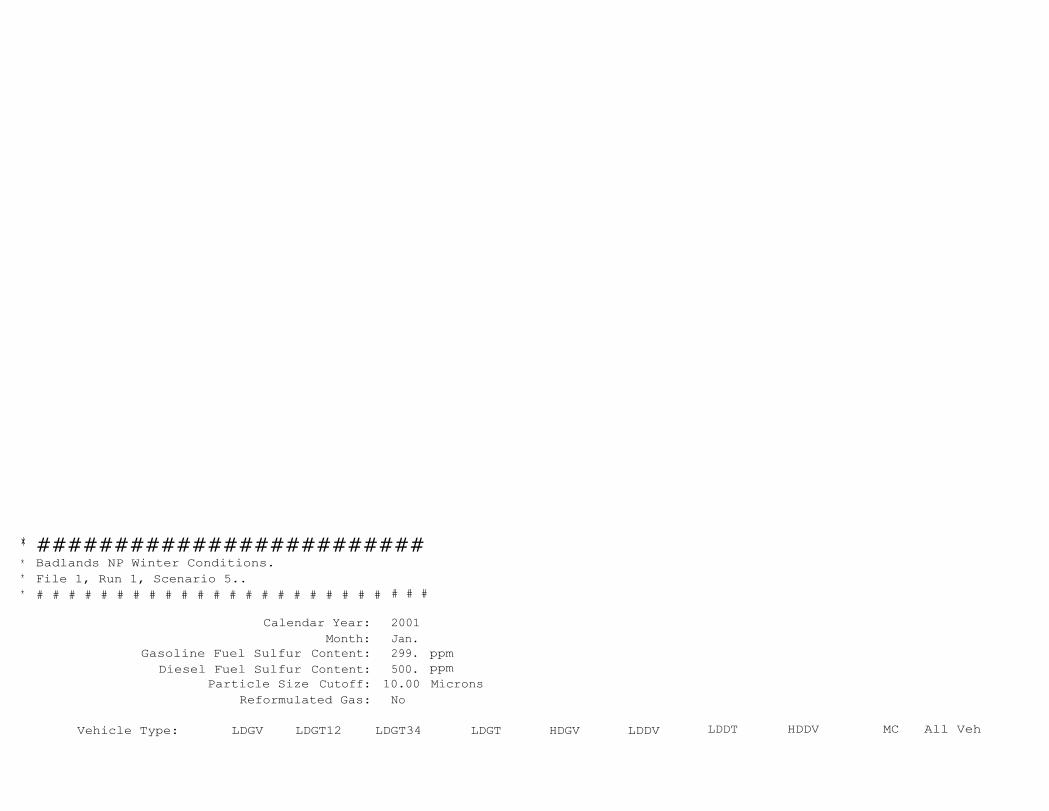
* #########################
Vehicle Type:
LDGV
LDGT12
LDGT34
LDGT
HDGV
LDDV
LDDT
HDDV
MC All Veh
* Badlands NP Winter Conditions.* File 1, Run 1, Scenario 5..* # # # # # # # # # # # # # # # # # # # # # # # # #
Calendar Year: 2001Month: Jan.
Gasoline Fuel SulfurDiesel Fuel Sulfur
Particle Size
Content:Content:Cutoff:
299.500.
10.00No
ppmppmMicrons
Reformulated Gas:
VMT Mix:
-----------------------------------------------------------------------------------------------------------------------Veh. Type:
LDGT1
LDGT2
LDGT3
LDGT4
LDDT12
LDDT34
VMT Mix:
0.0790
0.2649
0.1094
0.0502
0.0001
0.0024-----------------------------------------------------------------------------------------------------------------------
PM Idle:-----------------------------------------------------------------------------------------------------------------------
Veh. Type:
HDGV2B
HDGV3
HDGV4
HDGVS
HDGV6
HDGV7
HDGV8A
HDGV8B
0.0871
0.0028
0.0009
0.0032
0.0063
0.0026
0.0000
0.0000
GVWR: <6000 >6000 (All)
VMT Distribution: 0.1339 0.3439 0.1596 0.1033 0.0001 0.0025 0.2567 0.0000 1.0000---------------------------------------------------------------------------------- ------------------------Composite Emission Factors ( g/mi):
Lead: 0.0000 0.0000 0.0000 0.0000 0.0000 ------ ------ ------ 0.0000 0.0000GASPM: 0.0042 0.0047 0.0044 0.0046 0.0520 ------ ------ ------ 0.0205 0.0083
ECARBON: ------ ------ ------ ------ ------ 0.1198 0.0502 0.1268 ------ 0.0327OCARBON: ------ ------ ------ ------ ------ 0.0338 0.0722 0.0657 ------ 0.0170
S04: 0.0028 0.0049 0.0047 0.0049 0.0109 0.0049 0.0105 0.0306 0.0000 0.0118Total Exhaust PM: 0.0071 0.0096 0.0091 0.0095 0.0629 0.1584 0.1330 0.2231 0.0205 0.0699
Brake: 0.0125 0.0125 0.0125 0.0125 0.0125 0.0125 0.0125 0.0125 0.0000 0.0125Tire: 0.0080 0.0080 0.0080 0.0080 0.0086 0.0080 0.0080 0.0257 0.0000 0.0126
Total PM: 0.0276 0.0302 0.0296 0.0300 0.0841 0.1790 0.1535 0.2614 0.0205 0.0950S02: 0.0684 0.0804 0.1134 0.0908 0.1666 0.0934 0.2017 0.4376 0.0000 0.1849NH3: 0.1016 0.1005 0.1015 0.1008 0.0451 0.0068 0.0068 0.0270 0.0000 0.0760
Idle Emissions (g/hr)PM Idle: ------ ------ ------ ------ ------ ------ ------ 1.0438 ------ 0.2680
Composite Emission Factors ( g/mi):Lead: 0.0000 0.0000 0.0000 0.0000
GASPM: 0.0047 0.0047 0.0044 0.0044 ------ ------ECARBON: ------ ------ ------ ------ 0.1498 0.0463OCARBON: ------ ------ ------ ------ 0.2156 0.0667
S04: 0.0049 0.0049 0.0047 0.0047 0.0062 0.0107Total Exhaust PM: 0.0096 0.0096 0.0091 0.0091 0.3717 0.1237
Brake: 0.0125 0.0125 0.0125 0.0125 0.0125 0.0125Tire: 0.0080 0.0080 0.0080 0.0080 0.0080 0.0080
Total PM: 0.0302 0.0302 0.0296 0.0296 0.3922 0.1443S02: 0.0804 0.0804 0.1134 0.1134 0.1196 0.2049NH3:
Idle Emissions (g/hr)0.1005 0.1005 0.1015 0.1015 0.0068 0.0068
PM Idle:-----------------------------------------------------------------------------------------------------------------------
Veh. Type:
HDDV2B
HDDV3
HDDV4
HDDVS
HDDV6
HDDV7
HDDV8A
HDDV8B
VMT Mix:
0.0299
0.0092
0.0081
0.0038
0.0187
0.0274
0.0330
0.1190-----------------------------------------------------------------------------------------------------------------------Composite Emission Factors (g/mi):
-----------------------------------------------------------------------------------------------------------------------
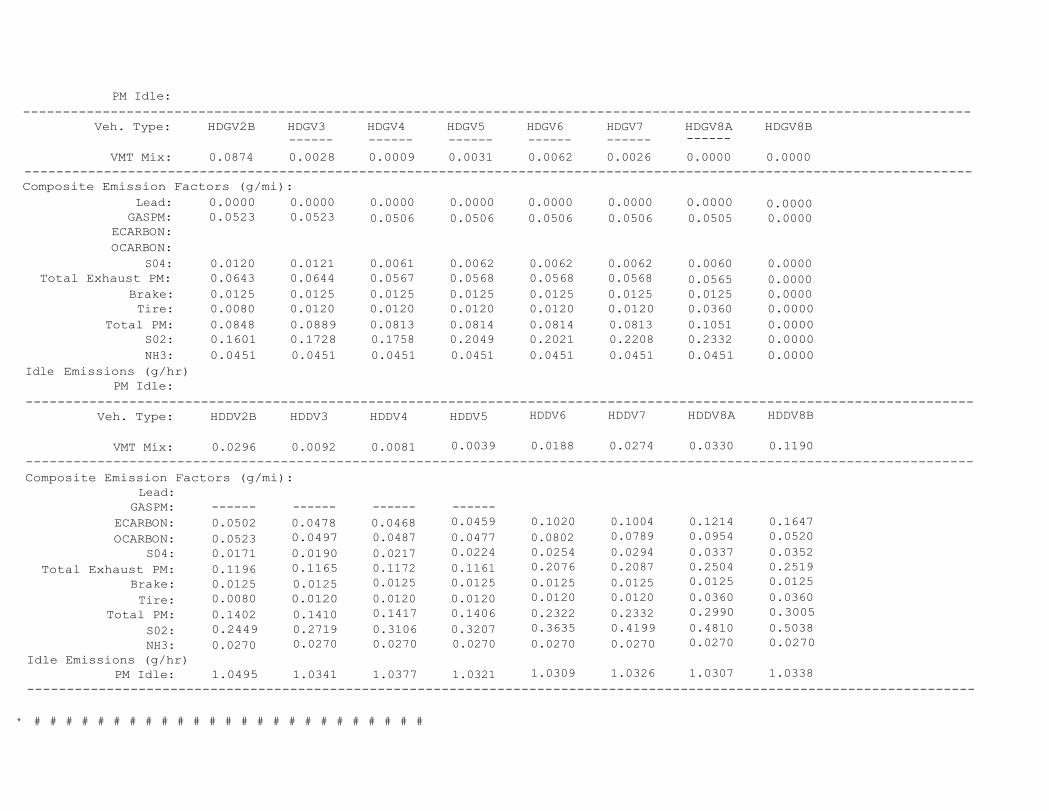
* # # # # # # # # # # # # # # # # # # # # # # # # #* Badlands NP Summer Conditions.* File 1, Run 1, Scenario 6.* # # # # # # # # # # # # # # # # # # # # # # # # #
Calendar Year: 2001Month: July
Lead:GAS PM:
ECARBON: 0.0513 0.0486 0.0476 0.0466 0.1058 0.1043 0.1234 0.1676OCARBON: 0.0534 0.0506 0.0495 0.0485 0.0831 0.0819 0.0970 0.0529
S04: 0.0172 0.0190 0.0217 0.0224 0.0254 0.0294 0.0337 0.0353Total Exhaust PM: 0.1219 0.1182 0.1189 0.1175 0.2143 0.2156 0.2540 0.2558
Brake: 0.0125 0.0125 0.0125 0.0125 0.0125 0.0125 0.0125 0.0125Tire: 0.0080 0.0120 0.0120 0.0120 0.0120 0.0120 0.0360 0.0360
Total PM: 0.1424 0.1427 0.1434 0.1420 0.2389 0.2401 0.3026 0.3043S02: 0 2452 0.2722 0.3107 0.3208 0.3637 0.4200 0.4813 0.5043NH3: 0 0270 0.0270 0.0270 0.0270 0.0270 0.0270 0.0270 0.0270
Idle Emissions (g/hr)PM Idle: 1.0607 1.0424 1.0459 1.0391 1.0381 1.0402 1.0381 1.0417
Composite Emission Factors ( g/mi):0.0000 0.0000 0.0000 0.0000 0.0000 0.0000 0.0000Lead: 0.0000
GASPM: 0.0523 0.0523 0.0503 0.0504 0.0503 0.0503 0.0503 0.0000ECARBON:0CARBON: ------ ------ ------ ------ ------
S04: 0.0118 0.0118 0.0049 0.0050 0.0050 0.0049 0.0048 0.0000Total Exhaust PM: 0.0640 0.0641 0.0553 0.0554 0.0553 0.0553 0.0551 0.0000
Brake: 0.0125 0.0125 0.0125 0.0125 0.0125 0.0125 0.0125 0.0000Tire: 0.0080 0.0120 0.0120 0.0120 0.0120 0.0120 0.0360 0.0000
Total PM: 0.0846 0.0887 0.0798 0.0799 0.0799 0.0798 0.1036 0.0000S02: 0.1603 0.1730 0.1764 0.2054 0.2026 0.2213 0.2339 0.0000NH3: 0.0451 0.0451 0.0451 0.0451 0.0451 0.0451 0.0451 0.0000
Idle Emissions (g/hr)
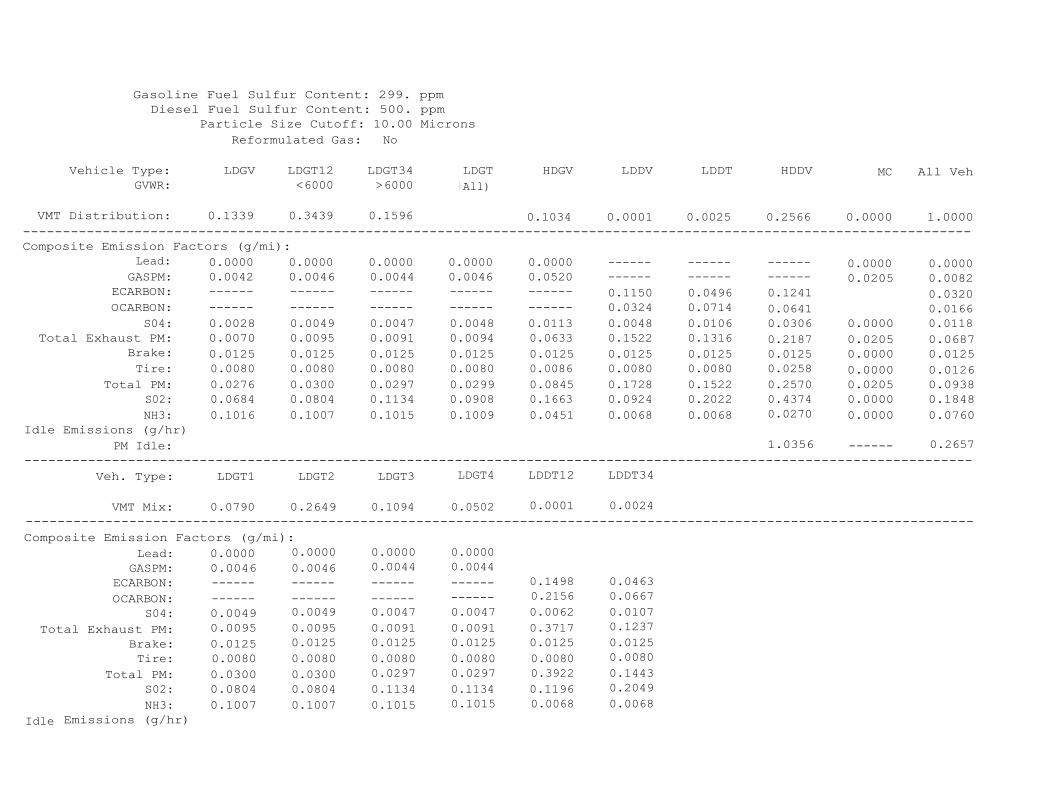
Gasoline Fuel Sulfur Content: 299. ppmDiesel Fuel Sulfur Content: 500. ppm
Particle Size Cutoff: 10.00 MicronsReformulated Gas: No
Vehicle Type:
LDGV
LDGT12
LDGT34
LDGT
HDGV
LDDV
LDDT
HDDV
MC All VehGVWR:
<6000
>6000
( All)
VMT Distribution:-----------------------------------------------------------------------------------------------------------------------Composite Emission Factors (g/mi):
0.1339 0.3439 0.1596 0.1034 0.0001 0.0025 0.2566 0.0000 1.0000
-----------------------------------------------------------------------------------------------------------------------Veh. Type:
LDGT1
LDGT2
LDGT3
LDGT4
LDDT12
LDDT34
VMT Mix:
0.0790
0.2649
0.1094
0.0502
0.0001
0.0024
-----------------------------------------------------------------------------------------------------------------------
Lead: 0.0000 0.0000 0.0000 0.0000 0.0000 ------ ------ ------ 0.0000 0.0000GASPM: 0.0042 0.0046 0.0044 0.0046 0.0520 ------ ------ ------ 0.0205 0.0082
ECARBON: ------ ------ ------ ------ ------ 0.1150 0.0496 0.1241 0.0320OCARBON: ------ ------ ------ ------ ------ 0.0324 0.0714 0.0641 0.0166
S04: 0.0028 0.0049 0.0047 0.0048 0.0113 0.0048 0.0106 0.0306 0.0000 0.0118Total Exhaust PM: 0.0070 0.0095 0.0091 0.0094 0.0633 0.1522 0.1316 0.2187 0.0205 0.0687
Brake: 0.0125 0.0125 0.0125 0.0125 0.0125 0.0125 0.0125 0.0125 0.0000 0.0125Tire: 0.0080 0.0080 0.0080 0.0080 0.0086 0.0080 0.0080 0.0258 0.0000 0.0126
Total PM: 0.0276 0.0300 0.0297 0.0299 0.0845 0.1728 0.1522 0.2570 0.0205 0.0938S02: 0.0684 0.0804 0.1134 0.0908 0.1663 0.0924 0.2022 0.4374 0.0000 0.1848NH3: 0.1016 0.1007 0.1015 0.1009 0.0451 0.0068 0.0068 0.0270 0.0000 0.0760
Idle Emissions (g/hr)PM Idle: 1.0356 ------ 0.2657
Composite Emission Factors (g/mi):0.0000 0.0000Lead: 0.0000 0.0000
GASPM: 0.0046 0.0046 0.0044 0.0044ECARBON: ------ ------ ------ ------ 0.1498 0.0463OCARBON: ------ ------ ------ ------ 0.2156 0.0667
S04: 0.0049 0.0049 0.0047 0.0047 0.0062 0.0107Total Exhaust PM: 0.0095 0.0095 0.0091 0.0091 0.3717 0.1237
Brake: 0.0125 0.0125 0.0125 0.0125 0.0125 0.0125Tire: 0.0080 0.0080 0.0080 0.0080 0.0080 0.0080
Total PM: 0.0300 0.0300 0.0297 0.0297 0.3922 0.1443S02: 0.0804 0.0804 0.1134 0.1134 0.1196 0.2049NH3: 0.1007 0.1007 0.1015 0.1015 0.0068 0.0068
Idle Emissions (g/hr)
PM Idle:-----------------------------------------------------------------------------------------------------------------------
Veh. Type:
HDGV2B
HDGV3
HDGV4
HDGV5
HDGV6
HDGV7
HDGV8A
HDGV8B
Emissions (g/hr)PM Idle:
Idle
------
------
------
------
------
------VMT Mix:
0.0874
0.0028
0.0009
0.0031
0.0062
0.0026
0.0000
0.0000-----------------------------------------------------------------------------------------------------------------------Composite Emission Factors (g/mi):
-----------------------------------------------------------------------------------------------------------------------Veh. Type:
HDDV2B
HDDV3
HDDV4
HDDV5
HDDV6
HDDV7
HDDV8A
HDDV8B
VMT Mix:
0.0296
0.0092
0.0081
0.0039
0.0188
0.0274
0.0330
0.1190-----------------------------------------------------------------------------------------------------------------------Composite Emission Factors (g/mi):
-----------------------------------------------------------------------------------------------------------------------
* # # # # # # # # # # # # # # # # # # # # # # # # #
Lead: 0.0000 0.0000 0.0000 0.0000 0.0000 0.0000 0.0000 0.0000GASPM: 0.0523 0.0523 0.0506 0.0506 0.0506 0.0506 0.0505 0.0000
ECARBON:OCARBON:
S04: 0.0120 0.0121 0.0061 0.0062 0.0062 0.0062 0.0060 0.0000Total Exhaust PM: 0.0643 0.0644 0.0567 0.0568 0.0568 0.0568 0.0565 0.0000
Brake: 0.0125 0.0125 0.0125 0.0125 0.0125 0.0125 0.0125 0.0000Tire: 0.0080 0.0120 0.0120 0.0120 0.0120 0.0120 0.0360 0.0000
Total PM: 0.0848 0.0889 0.0813 0.0814 0.0814 0.0813 0.1051 0.0000S02: 0.1601 0.1728 0.1758 0.2049 0.2021 0.2208 0.2332 0.0000NH3: 0.0451 0.0451 0.0451 0.0451 0.0451 0.0451 0.0451 0.0000
Lead:GASPM: ------ ------ ------ ------
ECARBON: 0.0502 0.0478 0.0468 0.0459 0.1020 0.1004 0.1214 0.1647OCARBON: 0.0523 0.0497 0.0487 0.0477 0.0802 0.0789 0.0954 0.0520
S04: 0.0171 0.0190 0.0217 0.0224 0.0254 0.0294 0.0337 0.0352Total Exhaust PM: 0.1196 0.1165 0.1172 0.1161 0.2076 0.2087 0.2504 0.2519
Brake: 0.0125 0.0125 0.0125 0.0125 0.0125 0.0125 0.0125 0.0125Tire: 0.0080 0.0120 0.0120 0.0120 0.0120 0.0120 0.0360 0.0360
Total PM: 0.1402 0.1410 0.1417 0.1406 0.2322 0.2332 0.2990 0.3005S02: 0.2449 0.2719 0.3106 0.3207 0.3635 0.4199 0.4810 0.5038NH3: 0.0270 0.0270 0.0270 0.0270 0.0270 0.0270 0.0270 0.0270
Idle Emissions (g/hr)PM Idle: 1.0495 1.0341 1.0377 1.0321 1.0309 1.0326 1.0307 1.0338
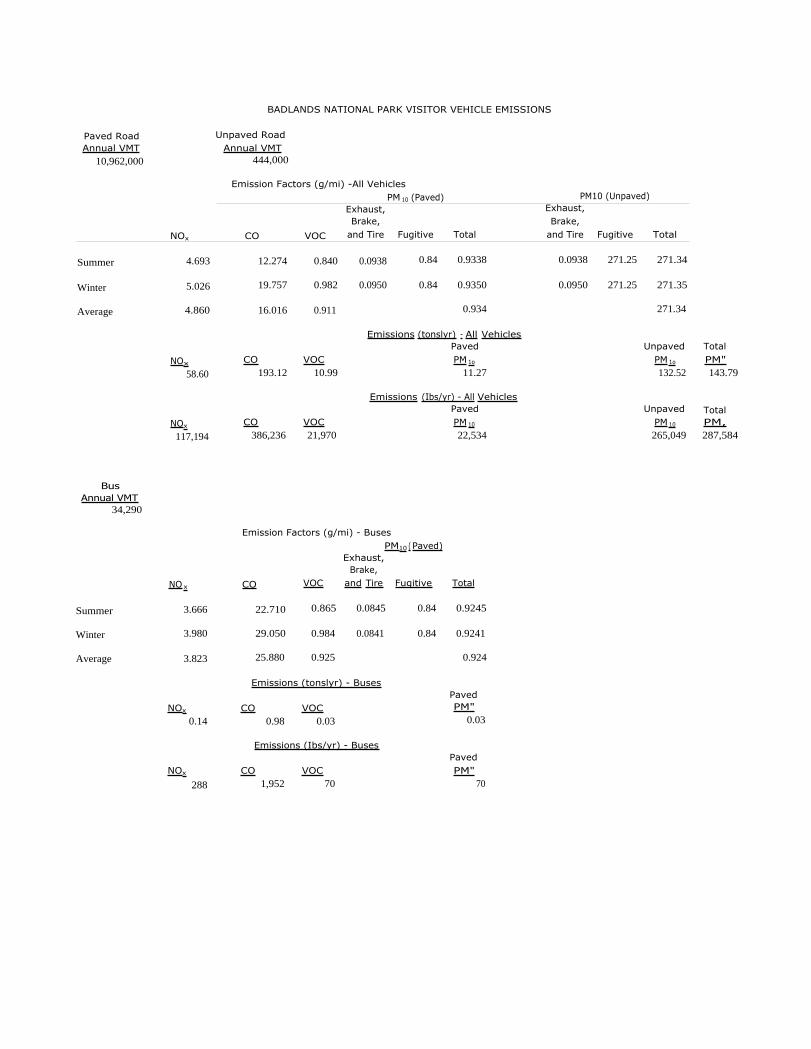
Emissions (tonslyr) - All VehiclesPaved
Unpaved TotalNOx CO
VOC PM 1o PM 1o
PM"58.60
193.12
10.99
11.27
132.52
143.79
Emissions (Ibs/yr) - All VehiclesPaved
Unpaved TotalNOx CO
VOC PM 10
PM 10
PM,117,194
386,236
21,970
22,534
265,049 287,584
BusAnnual VMT
34,290
BADLANDS NATIONAL PARK VISITOR VEHICLE EMISSIONS
Emission Factors (g/mi) - BusesPM10 ( Paved)
Exhaust,Brake,
NO x
CO
VOC
and Tire Fugitive
Total
Summer 3.666 22.710 0.865 0.0845 0.84 0.9245
Winter 3.980 29.050 0.984 0.0841 0.84 0.9241
Average
3.823
25.880
0.925
0.924
Emissions (tonslyr) - BusesPaved
NOx CO VOC
PM"0.14
0.98
0.03
0.03
Emissions (Ibs/yr) - BusesPaved
NOx
CO VOC PM"288
1,952
70
70
Paved RoadAnnual VMT
10,962,000
Unpaved Road Annual VMT
444,000
Emission Factors (g/mi) -All VehiclesPM 10 (Paved) PM10 (Unpaved)
NOx CO VOC
Exhaust,Brake,
and Tire Fugitive Total
Exhaust,Brake,
and Tire Fugitive Total
Summer 4.693 12.274 0.840 0.0938 0.84 0.9338 0.0938
271.25 271.34
Winter 5.026 19.757 0.982 0.0950 0.84 0.9350 0.0950
271.25 271.35
Average 4.860 16.016 0.911 0.934 271.34

BADLANDS NATIONAL PARK NPS AND GSA VEHICLES
LDGV LDGT
HDGV HDDV Total
Total Miles 394,762 102,200
0 36,710 533,672
Emission Factors (9/mi) - LDGVPM 10
NO x CO
VOC
Exhaust,Brake, and
Tire Fugitive Total
Summer
Winter
Average
0.7520
0.8780
0.8150
NOx
11.7300
0.7300
20.0800
0.8230
15.9050
0.7765
0.0276
0.0276
0.8400
0.8400
0.8676
0.8676
0.8676
PM 10
Emissions (tons/yr) - LDGVCO
VOC0.35 6.91
0.34 0.38
Emission Factors (g/mi) - LDGT
NOx CO
VOC
Exhaust,Brake, and
Tire
PM10
Fugitive Total
Summer
Winter
Average
1.016
1.282
1.149
14.440
0.887
26.580
1.150
20.510
1.019
0.030
0.030
0.840
0.840
0.870
0.870
0.870
NOx
Emissions (tons/yr) - LDGTCO
VOC PM100.13 2.31
0.11 0.10
Emission Factors (9/mi) - HDGVPM,
NO x CO
VOC
Exhaust,Brake, and
Tire
Fugitive Total
Summer
Winter
Average
3.634
3.844
3.739
23.630
0.891
26.110
0.849
24.870
0.870
0.085
0.840
0.084
0.840
0.925
0.924
0.924
NOxEmissions (tonslyr) - HDGV
CO
VOC PM 100.00 0.00
0.00
Emission Factors (g/mi) - HDDVPM 70
0.00
NOx
Exhaust,Brake, and
CO
VOC
Tire
Fugitive Total
Summer 14.245 4.397
0.806
0.261 0.840 1.101
Winter 14.858 4.431
0.810
0.261 0.840 1.101
Average 14.552 4.414
0.808 1.101
NOx
Emissions (tons/yr) - HDDVCO
VOC PM 100.59 0.18
0.03 0.04
Emissions (tonslyr) - TotalNOx CO
VOC PM 101.07 9.39
0.48 0.52
Emissions (lbs/vr) - TotalNOx CO
VOC PM102,141 18,781 969 1,038
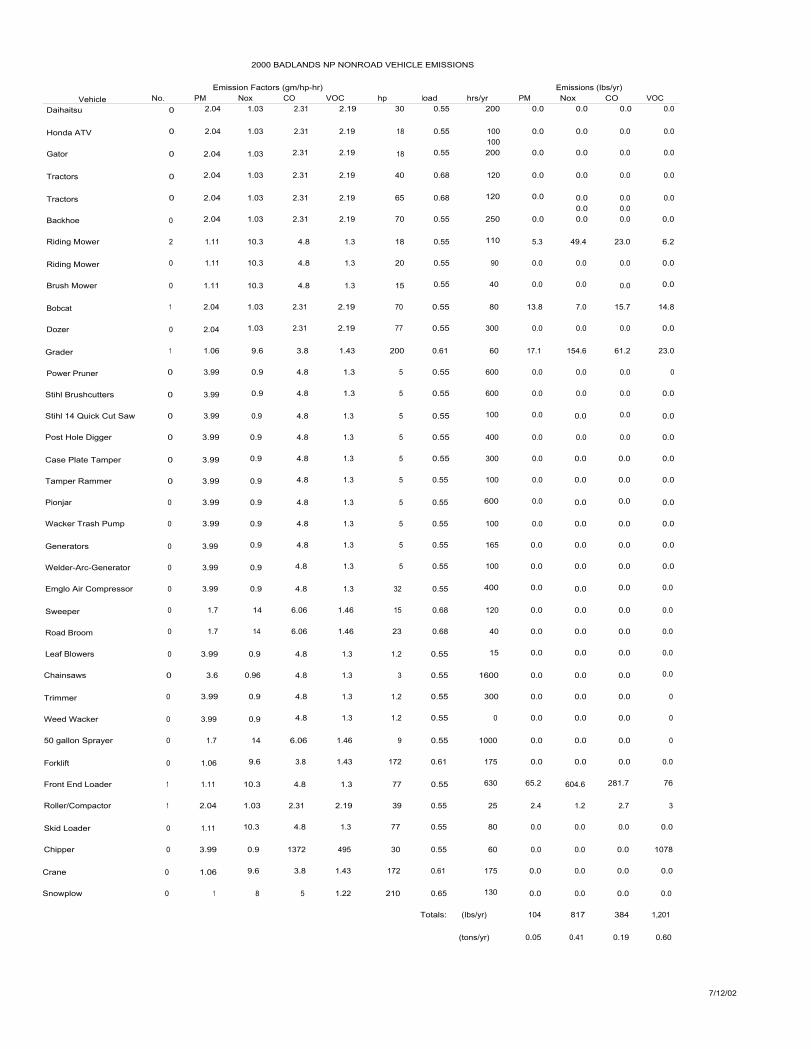
2000 BADLANDS NP NONROAD VEHICLE EMISSIONS
7/12/02
Emission Factors (gm/hp-hr) Emissions (Ibs/yr)Vehicle No. PM Nox CO VOC hp load hrs/yr PM Nox CO VOC
Daihaitsu 0 2.04 1.03 2.31 2.19 30 0.55 200 0.0 0.0 0.0 0.0
Honda ATV 0 2.04 1.03 2.31 2.19 18 0.55 100 0.0 0.0 0.0 0.0100
Gator 0 2.04 1.03 2.31 2.19 18 0.55 200 0.0 0.0 0.0 0.0
Tractors 0 2.04 1.03 2.31 2.19 40 0.68 120 0.0 0.0 0.0 0.0
Tractors 0 2.04 1.03 2.31 2.19 65 0.68 120 0.0 0.0 0.0 0.00.0 0.0
Backhoe 0 2.04 1.03 2.31 2.19 70 0.55 250 0.0 0.0 0.0 0.0
Riding Mower 2 1.11 10.3 4.8 1.3 18 0.55 110 5.3 49.4 23.0 6.2
Riding Mower 0 1.11 10.3 4.8 1.3 20 0.55 90 0.0 0.0 0.0 0.0
Brush Mower 0 1.11 10.3 4.8 1.3 15 0.55 40 0.0 0.0 0.0 0.0
Bobcat 1 2.04 1.03 2.31 2.19 70 0.55 80 13.8 7.0 15.7 14.8
Dozer 0 2.04 1.03 2.31 2.19 77 0.55 300 0.0 0.0 0.0 0.0
Grader 1 1.06 9.6 3.8 1.43 200 0.61 60 17.1 154.6 61.2 23.0
Power Pruner 0 3.99 0.9 4.8 1.3 5 0.55 600 0.0 0.0 0.0 0
Stihl Brushcutters 0 3.99 0.9 4.8 1.3 5 0.55 600 0.0 0.0 0.0 0.0
Stihl 14 Quick Cut Saw 0 3.99 0.9 4.8 1.3 5 0.55 100 0.0 0.0 0.0 0.0
Post Hole Digger 0 3.99 0.9 4.8 1.3 5 0.55 400 0.0 0.0 0.0 0.0
Case Plate Tamper 0 3.99 0.9 4.8 1.3 5 0.55 300 0.0 0.0 0.0 0.0
Tamper Rammer 0 3.99 0.9 4.8 1.3 5 0.55 100 0.0 0.0 0.0 0.0
Pionjar 0 3.99 0.9 4.8 1.3 5 0.55 600 0.0 0.0 0.0 0.0
Wacker Trash Pump 0 3.99 0.9 4.8 1.3 5 0.55 100 0.0 0.0 0.0 0.0
Generators 0 3.99 0.9 4.8 1.3 5 0.55 165 0.0 0.0 0.0 0.0
Welder-Arc-Generator 0 3.99 0.9 4.8 1.3 5 0.55 100 0.0 0.0 0.0 0.0
Emglo Air Compressor 0 3.99 0.9 4.8 1.3 32 0.55 400 0.0 0.0 0.0 0.0
Sweeper 0 1.7 14 6.06 1.46 15 0.68 120 0.0 0.0 0.0 0.0
Road Broom 0 1.7 14 6.06 1.46 23 0.68 40 0.0 0.0 0.0 0.0
Leaf Blowers 0 3.99 0.9 4.8 1.3 1.2 0.55 15 0.0 0.0 0.0 0.0
Chainsaws 0 3.6 0.96 4.8 1.3 3 0.55 1600 0.0 0.0 0.0 0.0
Trimmer 0 3.99 0.9 4.8 1.3 1.2 0.55 300 0.0 0.0 0.0 0
Weed Wacker 0 3.99 0.9 4.8 1.3 1.2 0.55 0 0.0 0.0 0.0 0
50 gallon Sprayer 0 1.7 14 6.06 1.46 9 0.55 1000 0.0 0.0 0.0 0
Forklift 0 1.06 9.6 3.8 1.43 172 0.61 175 0.0 0.0 0.0 0.0
Front End Loader 1 1.11 10.3 4.8 1.3 77 0.55 630 65.2 604.6 281.7 76
Roller/Compactor 1 2.04 1.03 2.31 2.19 39 0.55 25 2.4 1.2 2.7 3
Skid Loader 0 1.11 10.3 4.8 1.3 77 0.55 80 0.0 0.0 0.0 0.0
Chipper 0 3.99 0.9 1372 495 30 0.55 60 0.0 0.0 0.0 1078
Crane 0 1.06 9.6 3.8 1.43 172 0.61 175 0.0 0.0 0.0 0.0
Snowplow 0 1 8 5 1.22 210 0.65 130 0.0 0.0 0.0 0.0
Totals: (Ibs/yr) 104 817 384 1,201
(tons/yr) 0.05 0.41 0.19 0.60


EDMS 3.23 Emissions Inventory Report
Study Name: mystudy
Airport: Your Airport
Report Date: 07/12/02
SUMMARY(Tons/Year)
NAME CO
HC NOx
sox PM10
Aircraft 3.668 .396 1.895 .168
. 000
GSE/AGE/APU 20.384 1.278 . 406 .010
. 036
Total 24.052 1.674 2.301 .178
.036

** Denotes User Created Aircraft
AIRCRAFT EMISSIONS
EDMS 3.23 Emissions Inventory
(Tons/Year)
Aircraft Engine Mode CO HC NOx
sox PM10
SH-3E T58-GE-5 TAXI . 000 . 000 . 000 . 000 .000
SH-3E T58-GE-5 TKOF . 000 .000 . 000 . 000 . 000
SH-3E T58-GE-5 CLMB 1.724 . 238 1.091 . 092 . 000
SH-3E T58-GE-5 APCH 1.944 . 158 . 804 . 076 . 000
SH-3E T58-GE-5 APU . 000 . 000 . 000 . 000 . 000SH-3E T58-GE-5 GSE 20.384 1.278 . 406 . 010 . 036

APPENDIX C
PUBLIC USE DATA

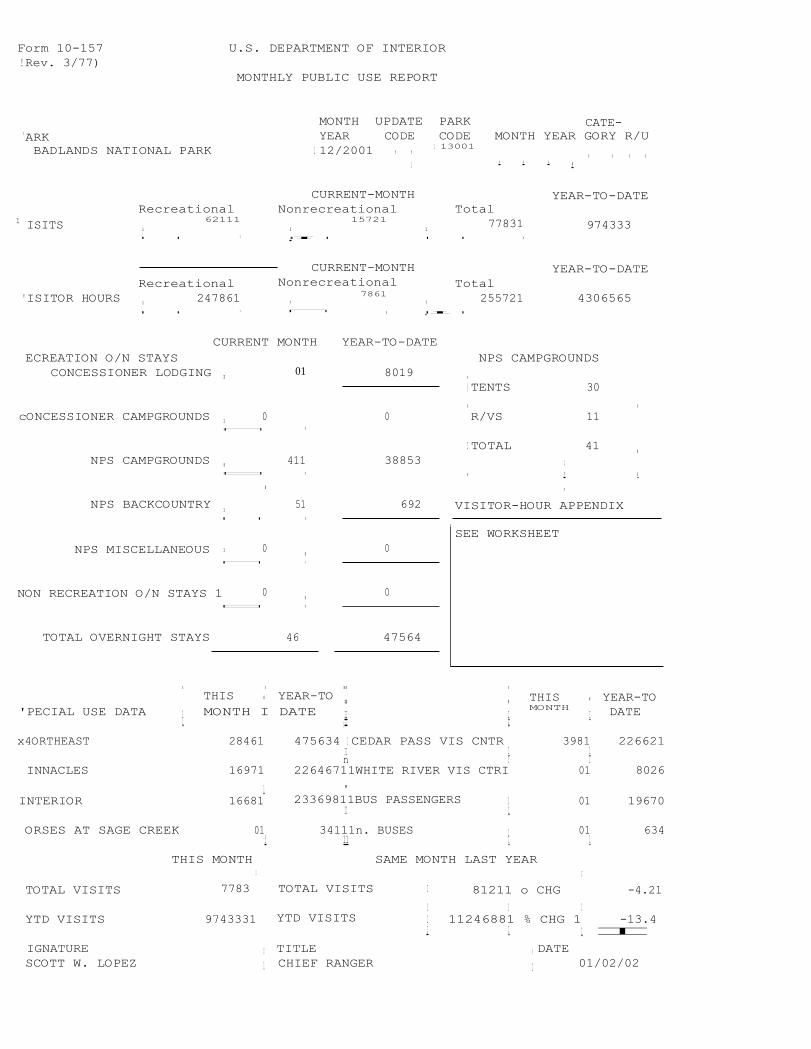
Form 10-157
U.S. DEPARTMENT OF INTERIOR!Rev. 3/77)
MONTHLY PUBLIC USE REPORT
MONTH UPDATE PARK
CATE-'ARK
YEAR
CODE CODE MONTH YEAR GORY R/UBADLANDS NATIONAL PARK
1 12/2001
1 1
I
1 13001
1
1
I
I1
1 1 1
1 ISITS
Recreational'ISITOR HOURS 1
247861I 1
CURRENT MONTH YEAR-TO-DATEECREATION O/N STAYS
CONCESSIONER LODGING I
01
cONCESSIONER CAMPGROUNDS 1
0I I
TOTAL VISITS
YTD VISITS
CURRENT-MONTH YEAR-TO-DATERecreational
Nonrecreational
Total1
62111
1
15721
1
77831
9743331 1
1I
I I
NPS CAMPGROUNDS I
411I I
I
I
NPS BACKCOUNTRY1
51I I
II 1
NPS MISCELLANEOUS 1
0
NON RECREATION O/N STAYS 1
0 II I
CURRENT-MONTHNonrecreational
1
7861
1
TOTAL OVERNIGHT STAYS
46
47564
YEAR-TO-DATETotal
255721
4306565I I
II
8019 I
( TENTS
301
1
0
R/VS 11
0
0
NPS CAMPGROUNDS
I TOTAL
41 I38853 II 1 i
692
VISITOR-HOUR APPENDIXI SEE WORKSHEET
I
I
II
ITHIS
I YEAR-TO11
I THIS
I YEAR-TO'PECIAL USE DATA
1 MONTH I DATE
II
I MONTH I DATE 1 II Ix4ORTHEAST
28461
475634I
1 CEDAR PASS VIS CNTRI
3981
226621 II I 1n
I
IINNACLES
16971
22646711WHITE RIVER VIS CTRI
01
80261
"INTERIOR
16681
23369811BUS PASSENGERS
1
01
19670 II IORSES AT SAGE CREEK
01
34111n. BUSES
1
01
634 f 11 I lTHIS MONTH
SAME MONTH LAST YEAR
7783I
TOTAL VISITS
I
81211 o CHGI
-4.211
1
19743331 YTD VISITS
1 11246881 % CHG 1
-13.4I I
IIIGNATURE I TITLE ( DATESCOTT W. LOPEZ
1 CHIEF RANGER
I
01/02/02


