
20 September 2016
Augean plc (“Augean” or “the Group”)
Interim results for the six months ended 30 June 2016 Augean, one of the UK’s leading specialist waste management businesses, announces its Interim Results for the six months ended 30 June 2016. Group financial highlights (excluding exceptional items)
Profit before tax increased by 1% to £3.1m (2015: £3.1m)
EBITDA(1)
increased by 15% to £6.7m (2015: £5.8m)
Net operating cash flows decreased by 19% to £5.3m (2015: £6.6m)
Return on capital employed(2)
decreased to 11.4%, from 11.7% in 2015
Basic earnings per share increased by 5% to 2.42p (2015: 2.30p)
Net debt increased to £12.9m, from £4.3m at December 2015 (£3.0m at June 2015), with £8.9m increase due to the acquisition of Colt Holdings in the period
Operational highlights and strategic developments
Acquisition of Colt Holdings, now part of the Industry & Infrastructure business unit, accelerating industrial
services capability, adding further revenues from tier-1 customers under framework agreements and delivering
synergies for the Group
Total volume of waste disposed by the Energy & Construction business increased by 45%, including strong
growth in APCR(3)
volumes
Material slowdown in the rate of UK Government spending in relation to nuclear decommissioning led to a
decline in volumes disposed of by Radioactive Waste Services
Significant improvement in profitability of the Industry & Infrastructure business
Increase in Total Waste Management (TWM) contracts and further long-term contract wins for Augean
Integrated Services, offset by unplanned operational downtime at East Kent HTI(4)
Continued focus on diversification of revenue streams in Augean North Sea Services, with significant contract
wins from strengthened relationships with tier-1 customers and investment in new site at Great Yarmouth
Outlook
Full year performance for 2016 anticipated to be in line with management expectations
Group remains well-placed to continue to take advantage of growth opportunities, in particular growth within the
APCR market and through the integration of the Colt Holdings acquisition.
Commenting on the Results, Dr Stewart Davies, Chief Executive, said:
“The Group has performed well in the first half of 2016, with particularly strong performances from its Energy &
Construction and Industry & Infrastructure businesses.
The Group is well-placed to continue to take advantage of growth opportunities and to deliver profit growth for 2016, in
particular due to additional APCR volumes secured in the first half and the integration of the Colt Holdings acquisition.
Accordingly, the Board remains confident of delivering full year financial results in line with market expectations.”
This announcement contains inside information for the purposes of Article 7 of EU Regulation 596/2014.

There will be a meeting for analysts at 9.00am today at the offices of FTI Consulting, 9th
Floor, 200 Aldersgate, Aldersgate Street, London, EC1A 4HD. For further information please call 020 3727 1203.
For further information, please call: Augean plc
Dr Stewart Davies, Chief Executive Richard Laker, Group Finance Director
01937 844 980
N+1 Singer
Shaun Dobson Richard Lindley Jen Boorer
020 7496 3000
FTI Consulting
Oliver Winters Fiona Walker
020 3727 1000
(1)
EBITDA means earnings before interest, taxation, depreciation and amortisation (2)
Return on capital employed is defined as operating profit, excluding exceptional items, divided by average capital employed, where capital employed is net assets excluding net debt (3)
APCR means Air Pollution Control Residues (4)
HTI means High Temperature Incinerator

Strategic report
Operating review
Introduction
In the first six months of 2016 the results of the Group, excluding exceptional items, show that, compared to the same
period in 2015:
Profit before taxation increased by 1% to £3.1m;
EBITDA(1)
increased by 15% to £6.7m;
Net operating cash flows decreased by 19% to £5.3m;
Return on capital employed(2)
decreased to 11.4%, from 11.7% in 2015
Basic earnings per share increased by 5% to 2.42p (2015: 2.30p)
The operating cash flow was used to fund the growth of the Group, with total organic capital investment of £3.6m, of
which £1.4m was maintenance capital expenditure and £2.2m was development capital expenditure, for future growth. In
May 2016, the Group acquired the entire issued share capital of Colt Holdings Limited, including its trading subsidiary,
Colt Industrial Services, for an initial net cash payment of £8.9m, including adjustments for normalised working capital
and cash acquired. The Group remains committed to growth through both organic and acquisitive means. Aside from its
operating cash flows, the Group had total available banking facilities of £20m at 30 June 2016, compared to net debt of
£12.9m. The net debt was equivalent to 1.0 times historic rolling 12 month EBITDA, before exceptional items, leaving the
Group in a position to continue to take advantage of medium term investment opportunities that would accelerate the
strategy and are value enhancing for shareholders.
Business performance
The Group operated through five business units during the period, with the performance of each set out below.
Energy & Construction (E&C)
Revenues, excluding landfill tax and intra-group trading, increased by 20% to £12.7m (2015: £10.5m) with a 45%
increase in the total volume of waste disposed by the E&C business to 301,500 tonnes in 2016, from 208,100 tonnes in
the first half of 2015. The operating profit of the E&C business unit grew by 42% to £4.3m (2015: £3.0m) and EBITDA
grew by 44% to £6.4m (2015: £4.4m), with the improvement in operating margin primarily due to the increase in APCR(3)
volumes, which are generally higher margin than the construction-derived waste streams also dealt with by E&C.
APCR volumes increased by 14,500 tonnes to 51,800 tonnes (39% increase compared to H1 2015), with average APCR
gate fees increasing by 2% to £88 per tonne with an overall increase in APCR revenue of 41% compared to the first half
of 2015. APCR volumes have grown strongly and are expected to grow further in the second half of 2016 as a result of
contract wins, which were announced in April 2016.
Volumes of other waste streams increased by 78,900 tonnes to 249,700 tonnes (46% increase compared to H1 2015).
The average gate fees on soils and other waste fell by 23% to £30 per tonne, with an overall increase in revenue of 11%,
due to the significant increase in volume. The average gate fee was impacted by changes in the mix of the specific waste
streams. Volumes of those waste streams which have the potential to be impacted by the update to landfill tax guidance,
issued by HMRC in December 2015, remained in line with management expectations for the first half of 2016 with no
significant impact on volumes or gate fees.
As the strategic traction of APCR volume growth is now being delivered, together with continued strong volumes of
construction and other waste streams, it is now considered that the E&C business profit will exceed previous
management expectations for the 2016 financial year.
Radioactive Waste Services (RWS)
The total revenue from the disposal and treatment of low level radioactive waste, excluding intra-group trading, fell by
53% to £0.6m (2015: £1.2m) in the period, with a decrease in operating profit to a loss £0.1m (2015: profit of £0.8m) and
a decrease in EBITDA to negative £0.1m (2015: positive £0.8m). This was generated from a total volume of 867 tonnes;
a decrease of 50% compared to 1,747 tonnes in the first half of 2015.
As signalled at the time of the 2015 full year results, in March 2016, there has been a material slowdown in the rate of
UK Government spending in relation to nuclear decommissioning since May 2015 which has continued in the first half of
2016.

An increase in volumes is anticipated in the second half of 2016 compared to the first half and Nuclear Decommissioning
Authority (NDA) forecasts indicate a recovery of 2017 volumes to similar levels to those seen in 2015. Aside from the
potential recovery of NDA volumes, further medium-term opportunities exist for the RWS business through growth in the
market for treatment of naturally occurring radioactive material and the incineration of low level radioactive waste.
However, in the short-term there remains a risk that UK Government spending on moving low level radioactive waste off
decommissioned sites continues to be deferred. Accordingly, it is currently expected that the RWS business will fall
materially short of management expectations for the 2016 financial year.
Industry & Infrastructure (I&I)
The I&I business unit generated revenue, excluding inter-segment sales, of £9.1m during the first six months of 2016, a
54% increase over the same period last year (H1 2015: £5.9m). This contributed to a significant improvement in
profitability, with an operating profit of £0.2m compared to an operating loss of £0.5m in the same period in the prior year.
The business generated a positive EBITDA of £0.5m, compared to a negative EBITDA of £0.1m in the first half of 2015.
The improvement in profitability was due to good performances across all of the main I&I sites, including the Avonmouth
site where a plan has been successfully executed to return the site to profitability during 2016.
On 18 May 2016, the Group acquired Colt Industrial Services, which now forms part of the I&I business unit. The results
of the business unit are not materially impacted by this acquisition in the first half of the year. Post period end, the
integration of Colt is substantially complete and the Colt business is expected to trade in line with expectations for 2016.
Given the performance of the I&I business unit in 2016 to date, it is now anticipated that the 2016 full year trading
performance of the business unit will be ahead of previous management expectations.
Augean Integrated Services (AIS)
Total revenue, excluding inter-segment sales, was £3.7m, an increase of 38% compared to the same period last year
(2015: £2.7m). This included £2.4m from the total waste management (TWM) business (2015: £1.8m), of which £1.6m
was under contracts (2015: £1.0m). The first half of 2016 saw further TWM contract wins with terms of three years and
above, which will positively impact the second half of 2016, with further positive impacts expected in 2017 and beyond.
The AIS business recorded an operating loss of £0.2m, an improvement from the £0.4m loss in the same period in 2015,
as well as positive EBITDA of £0.1m (2015: negative £0.3m). The East Kent high temperature incinerator experienced
some additional unplanned downtime during the first half of 2016; in particular during a scheduled plant maintenance
shutdown in May 2016 when additional work was required to be completed. A performance improvement programme is
underway at the site, which is targeting further improvement in profitability.
The further contract wins and the East Kent improvement programme are positively impacting the second half of 2016
and beyond. However, the unplanned operating shortfall at East Kent leads management to believe that the full year
performance of the AIS business unit will now be behind existing expectations for the 2016 full financial year.
Augean North Sea Services (ANSS)
Revenue fell by 26% to £6.0m (H1 2015: £8.1m), with a reduction in operating profit from £1.0m in the first half of 2015 to
an operating loss of £0.2m in 2016. EBITDA fell by 89% to £0.1m (H1 2015: £1.4m), reflecting the impact of challenging
conditions in the North Sea Oil & Gas market, as stated in March 2016.
The ANSS business continues to execute its strategic imperative of diversification away from exploration drilling waste
services, towards production-based waste streams which are less impacted by reduced oil prices. The business
generated 42% of its revenue from this activity in the first half of 2016, compared to 64% in the same period in 2015, and
maintained incumbency on an average of 3.3 drilling rigs, compared to 5.0 in the same period in 2015.
As previously announced in February 2016, ANSS was successful in being awarded contracts for production and
onshore waste management with a major oil company, which was accompanied by an investment of £0.5m in a new site
at Great Yarmouth, in order to service that contract. This represents a further diversification of this business, which has
continued to maintain its direct commercial relationships with oil & gas operators and tier-1 customers in this market, and
increases the potential for it to widen its service scope directly with those customers as a result. 91% of total ANSS
revenues were directly generated from our commercial relationships with those customers in the first half of 2016 (H1
2015: 89%).
In response to the sharp reduction in activity, the business has undergone a cost reduction programme, with an
annualised benefit of £0.5m, of which £0.2m will be seen in 2016.

The on-going growth in revenue streams from term contracts relating to activities other than exploration drilling waste
services, combined with the reputation of the business in the market and its commercial pipeline, leads to an expectation
of increased profitability in the second half of 2016, compared to the first half.
However, following the rate of activity reduction in the first half, it is now considered that the ANSS business unit will fall
short of previous management expectations for the 2016 financial year, but the Group is confident in the outlook for the
business in 2017 and beyond.
Acquisition
On 18 May 2016, the Group purchased the entire issued share capital of Colt Holdings Limited for a total initial cash
consideration of £9.2 million. After adjustments for a normalised level of working capital, the net cash outflow in the
period was £8.9 million. A further £0.5 million of associated deal costs have been charged to the income statement in the
period, as an exceptional item.
Legislative environment
In 2016, there have been further proposed changes to the landfill tax regime, the on-going evolution in hazardous waste
classification, developments on the derogations for landfill acceptance criteria and a review of national strategy for the
management of hazardous waste. No material impact on volumes or prices has been seen, as explained above. The
potential impact of the outcome of the UK referendum on EU membership and the key legislative instruments that affect
our markets is also being closely monitored. The current indications are that the mainstay of environmental legislation will
remain significantly unchanged for the foreseeable future.
Planning and permitting
In 2016, the main focus has been on consolidating existing consents and extending Environmental Permits. The
Thornhaugh planning and permitting approval enables Augean to re-engineer part of the landfill site, create new void and
prolong the life of the site to 2034. Planning permission was also granted for the Group to continue operating the Port
Clarence site until it is full, which is currently estimated to be in the latter part of the twenty-first century.
Another key factor in 2016 is the consent for the storage and management of Naturally Occurring Radioactive Material
(NORM). To add to the unique Augean position of being able to dispose of NORM wastes at an elevated exemption level
at Port Clarence, the Group is at various stages of obtaining similar permits at several sites in the UK.
In July 2013, the Secretary of State for Communities and Local Government granted a Development Consent Order
(DCO) for the extension of the landfill site at East Northants Resource Management Facility. To fully exploit the DCO, it
was necessary to vary the permits for low level radioactive waste (LLW) and hazardous wastes. The last of the revised
permits relating to the disposal of LLW was issued in March 2016, securing increased radioactive capacity to the end of
the life of the site, estimated to be 2026.
Financial performance
Group overview and EBITDA
A summary of the Group’s financial performance, excluding exceptional items, along with the change compared to the
same period in 2015 is as follows:
£’m except where stated 2016 2015 Change
Revenue 36.8 31.3 17.6%
Operating profit 3.5 3.5 2.6%
Profit before taxation 3.1 3.1 0.6%
EBITDA (defined below) 6.7 5.8 15.1%
Net operating cash flow 5.3 6.6 (19.2)%
Basic earnings per share 2.42p 2.30p 5.2%
Return on capital employed 11.4% 11.7% (0.3)%

Trading, operating profit and EBITDA
Net revenue for the six months ended 30 June 2016 increased by 18% to £36.8m (H1 2015: £31.3m). Operating profit
before exceptional items increased by 3% to £3.5m (H1 2015: £3.5m) and profit before tax increased by 1% to £3.1m
(H1 2015: £3.1m), on the same basis.
Earnings before interest, taxation, depreciation and amortisation (EBITDA), before exceptional items, is calculated as
follows:
2016 £’m
2015 £’m
Operating profit 3.5 3.5
Depreciation and amortisation 3.2 2.3
EBITDA 6.7 5.8
Exceptional items
Exceptional charges of £1.7m in the period (H1 2015: £0.1m) comprise £0.5m of costs associated with the acquisition of
Colt Holdings Limited, £1.1m of costs related to the settlement of a commercial dispute with a customer and £0.1m of
other charges.
Earnings per share
Basic earnings per share (EPS), excluding exceptional items, increased by 5% to 2.42 pence (H1 2015: 2.30 pence).
The Group made a profit after taxation, excluding exceptional items, of £2.7m (H1 2015: £2.4m), of which £2.7m (H1
2015: £2.3m) was attributable to equity shareholders.
The total number of ordinary shares in issue was unchanged during the period at 102,249,083 with the weighted average
number of shares in issue increasing from 102,029,822 to 102,249,083, for the purposes of basic EPS.
Dividend
The Board’s current policy is to pay a single annual dividend following the Annual General Meeting. A payment of £0.7m,
based on a dividend of 0.65 pence per share was made to shareholders in June 2016 in respect of the year ended 31
December 2015 (2015: £0.5m, 0.50 pence per share). Accordingly, no interim dividend has been recommended.
Cash flow and net debt
The cash flow of the Group is summarised as follows:
2016 £’m
2015 £’m
Net operating cash flows before exceptional items 5.3 6.6
Net operating cash flows from exceptional items (0.9) (0.1)
Total net operating cash flows 4.4 6.5
Maintenance capital expenditure (1.4) (1.1)
Post-maintenance free cash flow 3.0 5.4
Development capital expenditure (2.2) (1.2)
Acquisition of Colt Holdings (8.9) -
Purchase of remaining shares in ANSS - (1.1)
Free cash flow (8.1) 3.1
Dividend payments (0.7) (0.5)
Proceeds from issuance of equity - 0.1
Net cash (consumption) / generation (8.8) 2.7
The post-maintenance free cash flow of the Group, as defined above, excluding exceptional items, decreased by 29% to
£3.9m (H1 2015: £5.5m), after excluding net operating cash outflows from exceptional items of £0.9m (H1 2015: £0.1m).

Net operating underlying cash flows were generated from continuing trading as follows:
2016 £’m
2015 £’m
EBITDA before exceptional items 6.7 5.8
Net working capital movements (0.4) 1.1
Interest and taxation payments (1.0) (0.9)
Other - 0.6
Net operating cash flows before exceptional items 5.3 6.6
Net operating cash flow as a percentage of EBITDA represented 79% in 2016 (H1 2015: 113%).
Capital investment in property, plant and equipment made by the Group totalled £3.6m (H1 2015: £2.3m) and is shown in
the table below, split between maintenance investment, focused on upgrading existing facilities, and development
investment on new activities:
2016 Maintenance
£’m
2016 Development
£’m
2016 TOTAL
£’m
2015 TOTAL
£’m
Energy & Construction 0.2 0.7 0.9 1.0
Radioactive Waste Services - - - -
Industry & Infrastructure 0.1 - 0.1 0.1
Augean Integrated Services 0.7 0.3 1.0 0.5
Augean North Sea Services 0.3 0.9 1.2 0.4
Other/corporate 0.1 0.3 0.4 0.3
Total 1.4 2.2 3.6 2.3
As a result of the above, net debt, defined as total borrowings less cash and cash equivalents, increased to £12.9m at 30
June 2016, from £4.3m at 31 December 2015. This represented gearing, defined as net debt divided by net assets, of
23.4% (31 December 2015: 7.8%, 30 June 2015: 5.5%). The ratio of net debt to EBITDA, before exceptional items, was
1.0 times (31 December 2015: 0.4 times, 30 June 2015: 0.3 times).
Financing
The activities of the Group are substantially funded by a bank facility, comprising a committed revolving credit facility
(RCF) and bank overdraft. The RCF was renewed on improved commercial terms on 21 March 2016 with HSBC Bank
plc at a level of £20m with an uncommitted option of a further £10m exclusively to fund acquisitions. The maturity of the
facility is October 2020 and the overdraft is reviewed annually. This facility, along with the underlying cash generation of
the Group, is expected to provide the required funds to support further growth of the business over that period. As at 30
June 2016, the undrawn committed funds available to the group totalled £4.2m, excluding cash of £2.5m.
Balance sheet and return on capital employed
Consolidated net assets were £55.0m on 30 June 2016 (30 June 2015: £54.9m) and net tangible assets, excluding
goodwill and other intangible assets, were £30.0m (30 June 2015: £35.0m), all of which was attributable to equity
shareholders of the Group.
Return on capital employed, from continuing operations and excluding exceptional items, defined as operating profit
divided by average capital employed, where capital employed is net assets excluding net debt, decreased to 11.4% in
the twelve months ended 30 June 2016 (H1 2015: 11.7%).
Managing risk
The performance of the business is linked to economic activity in the waste markets it serves, including the
manufacturing, construction, nuclear decommissioning, energy-from-waste and oil & gas sectors. Fluctuations in the UK
economy in general and these sectors in particular affect Group performance, along with Governmental regulatory, fiscal
policies, inflation and other cost pressures. Risks are mitigated by diversifying the customer base and by linking gate
fees and other customer charges, wherever possible, to prevailing operating costs and commodity prices, including the
costs of waste disposal outside of the Group. There are also a number of risks specific to the markets served by the
Group which may have a material impact on activities and results. Those risks are set out on pages 40 to 43 of the
Augean plc 2015 Annual Report and Accounts and remain materially unchanged. The Group uses a range of resources
to manage and mitigate its risks, including the adoption of a broad range of internal controls, the use of risk registers and
regular reporting, monitoring and feedback of risks through the business.

Outlook
The Group has performed well in the first half of 2016, with particularly strong performances from its Energy &
Construction and Industry & Infrastructure businesses.
The Group is well-placed to continue to take advantage of growth opportunities and to deliver profit growth for 2016, in
particular due to additional APCR volumes secured in the first half and the integration of the Colt Holdings acquisition.
Accordingly, the Board remains confident of delivering full year financial results in line with market expectations.
Dr Stewart Davies
Chief Executive
19 September 2016
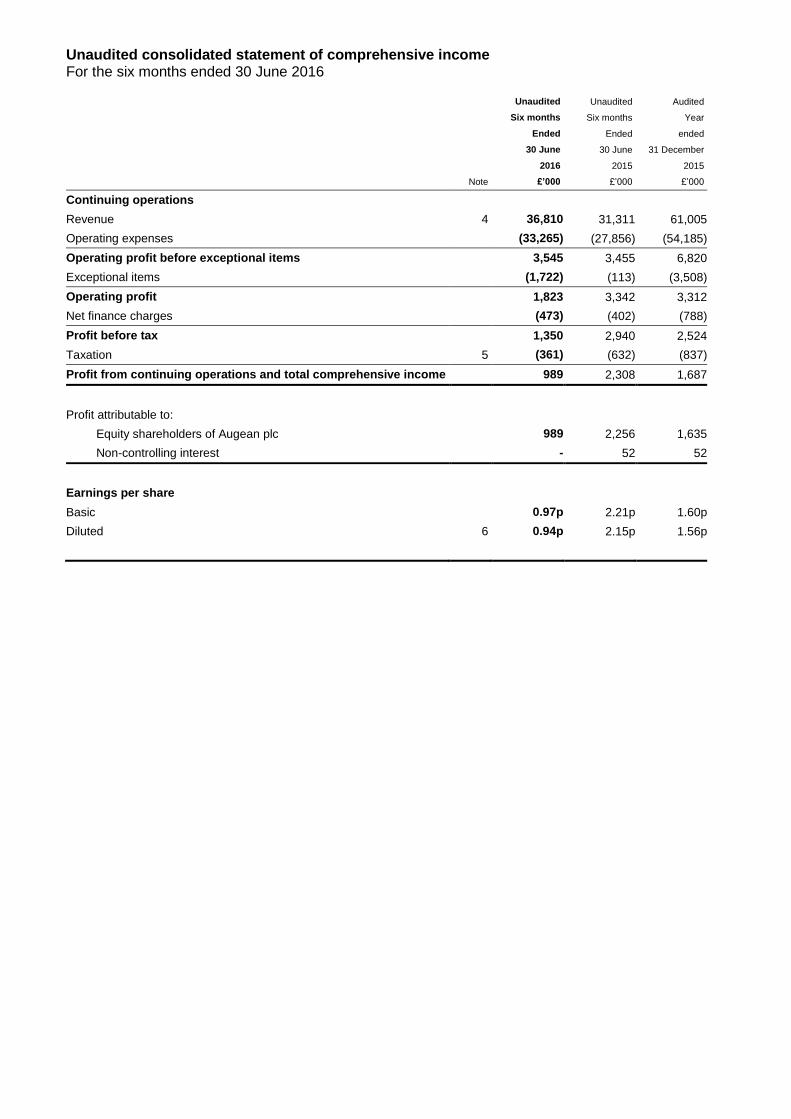
Unaudited consolidated statement of comprehensive income For the six months ended 30 June 2016 Unaudited Unaudited Audited
Six months Six months Year
Ended Ended ended
30 June 30 June 31 December
2016 2015 2015
Note £’000 £’000 £’000
Continuing operations
Revenue 4 36,810 31,311 61,005
Operating expenses (33,265) (27,856) (54,185)
Operating profit before exceptional items 3,545 3,455 6,820
Exceptional items (1,722) (113) (3,508)
Operating profit 1,823 3,342 3,312
Net finance charges (473) (402) (788)
Profit before tax 1,350 2,940 2,524
Taxation 5 (361) (632) (837)
Profit from continuing operations and total comprehensive income 989 2,308 1,687
Profit attributable to:
Equity shareholders of Augean plc 989 2,256 1,635
Non-controlling interest - 52 52
Earnings per share
Basic 0.97p 2.21p 1.60p
Diluted 6 0.94p 2.15p 1.56p
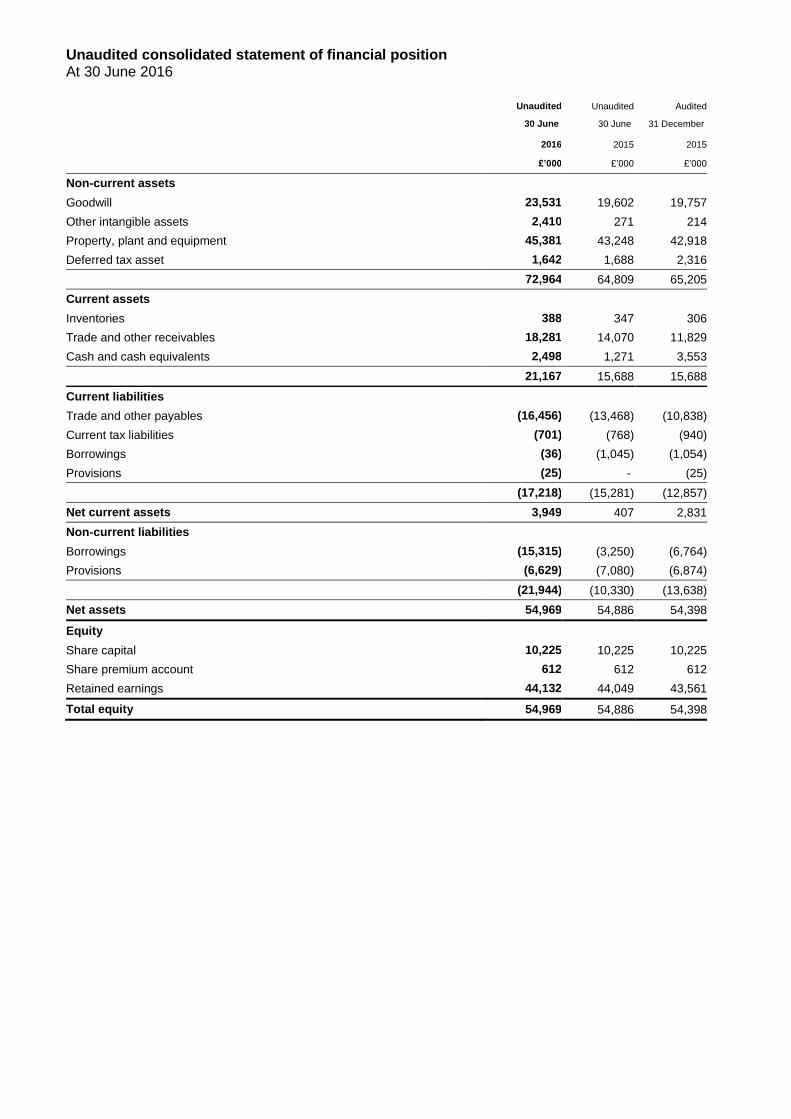
Unaudited consolidated statement of financial position At 30 June 2016 Unaudited Unaudited Audited
30 June 30 June 31 December
2016 2015 2015
£’000 £’000 £’000
Non-current assets
Goodwill 23,531 19,602 19,757
Other intangible assets 2,410 271 214
Property, plant and equipment 45,381 43,248 42,918
Deferred tax asset 1,642 1,688 2,316
72,964 64,809 65,205
Current assets
Inventories 388 347 306
Trade and other receivables 18,281 14,070 11,829
Cash and cash equivalents 2,498 1,271 3,553
21,167 15,688 15,688
Current liabilities
Trade and other payables (16,456) (13,468) (10,838)
Current tax liabilities (701) (768) (940)
Borrowings (36) (1,045) (1,054)
Provisions (25) - (25)
(17,218) (15,281) (12,857)
Net current assets 3,949 407 2,831
Non-current liabilities
Borrowings (15,315) (3,250) (6,764)
Provisions (6,629) (7,080) (6,874)
(21,944) (10,330) (13,638)
Net assets 54,969 54,886 54,398
Equity
Share capital 10,225 10,225 10,225
Share premium account 612 612 612
Retained earnings 44,132 44,049 43,561
Total equity 54,969 54,886 54,398

Unaudited consolidated statement of cash flows For the six months ended 30 June 2016 Unaudited
Six months
Unaudited
Six months
Audited
Year
ended ended ended
30 June 30 June 31 December
2016 2015 2015
Note £’000 £’000 £’000
Operating activities
Cash generated from operations 7 5,385 7,352 12,348
Finance charges paid (438) (441) (715)
Tax paid (599) (443) (1,105)
Net cash generated from operating activities 4,348 6,468 10,528
Investing activities
Purchases of property, plant and equipment (3,563) (2,303) (7,474)
Purchases of intangible assets - (12) (51)
Purchase of business (net of cash acquired) (8,901) - (91)
Net cash used in investing activities (12,464) (2,315) (7,616)
Financing activities
Issue of equity - 96 96
Drawdown / (repayment) of loan facilities 7,750 (2,874) 626
Acquisition of non-controlling interest - (1,050) (1,050)
Repayments of obligations under finance leases (24) (45) (22)
Dividends paid (665) (511) (511)
Net cash generated from / (used in) financing activities 7,061 (4,384) (861)
Net (decrease) / increase in cash and cash equivalents (1,055) (231) 2,051
Cash and cash equivalents at beginning of period 3,553 1,502 1,502
Cash and cash equivalents at end of period 2,498 1,271 3,553

Unaudited consolidated statement of changes in equity For the six months ended 30 June 2016
Share
capital
Share premium account
Retained earnings
Shareholders’ equity
Non-controlling
interest
Total equity
£’000 £’000 £’000 £’000 £’000 £’000
At 1 January 2015 10,199 542 42,059 52,800 955 53,755
Total comprehensive income for the period
Retained profit - - 2,256 2,256 52 2,308
Total comprehensive income for the period - - 2,256 2,256 52 2,308
Transactions with owners of the Company
Issue of equity 26 70 - 96 - 96
Acquisition of non-controlling interest - - (43) (43) (1,007) (1,050)
Dividends paid - - (511) (511) - (511)
Share-based payments - - 288 288 - 288
Total transactions with the owners of the Company 26 70 (266) (170) (1,007) (1,177)
At 30 June 2015 10,225 612 44,049 54,886 - 54,886
Total comprehensive income for the period
Retained profit - - (621) (621) - (621)
Total comprehensive income for the period - - (621) (621) - (621)
Transactions with owners of the Company
Share-based payments - - 133 133 - 133
Total transactions with the owners of the Company - - 133 133 - 133
At 31 December 2015 10,225 612 43,561 54,398 - 54,398
Total comprehensive income for the period
Retained profit - - 989 989 - 989
Total comprehensive income for the period - - 989 989 - 989
Transactions with owners of the Company
Dividends paid - - (665) (665) - (665)
Share-based payments - - 247 247 - 247
Total transactions with the owners of the Company - - (418) (418) - (418)
At 30 June 2016 10,225 612 44,132 54,969 - 54,969

1 Statutory information
The financial information in the interim report does not constitute statutory accounts as defined by Section 434 of the Companies Act 2006 and has not been audited or reviewed.
The financial information relating to the year ended 31 December 2015 is an extract from the latest published financial statements on which the auditor gave an unmodified report that did not contain statements under Section 498 (2) or (3) of the Companies Act 2006 and which have been filed with the Registrar of Companies.
The interim financial statements for the six months ended 30 June 2016 are available from the Group’s website at www.augeanplc.com.
2 Accounting policies
The Interim financial statements have been prepared in accordance with the AIM Rules for Companies and on a basis consistent with the accounting policies and methods of computation as published by the Group in its Annual Report for the year ended 31 December 2015, which is available on the Group’s website.
3 Basis of preparation
The Group has chosen not to adopt IAS 34 ‘Interim Financial Statements’ in preparing these interim financial statements and therefore the Interim financial information is not in full compliance with International Financial Reporting Standards.
4 Operating segments
The Group has five reportable segments. The five segments are the Group’s strategic business units. These business units are monitored and strategic decisions are made on the basis of each business unit’s operating performance. The Group’s business units provide different services to their customers and are managed separately as they are subject to different risks and returns. The Group’s internal organisation and management structure and its system of internal financial reporting are based primarily on these operating business units. For each of the business units, the Group’s Chief Executive Officer (CEO) (the chief operating decision-maker) reviews internal management reports on at least a monthly basis. The following summary describes the operations of each of the Group’s reportable segments:
Energy and Construction: Augean operates three modern hazardous and non-hazardous landfill operating sites based at East Northants Resource Management Facility (ENRMF), Thornhaugh in Northamptonshire and Port Clarence on Teesside, providing waste remediation, treatment and disposal services to its customers. The business unit includes a site at Cooks Hole in Northamptonshire where minerals are extracted and also generates energy as electricity from closed landfill cells.
Radioactive Waste Services: Augean provides waste disposal services of low level radioactive wastes and naturally occurring radioactive material produced in the UK.
Augean Integrated Services: Augean operates a High Temperature Incinerator at Sandwich, East Kent and a site in Cannock focused on Total Waste Management solutions.
Augean North Sea Services: Augean provides waste management and waste processing services to offshore oil and gas operators in the North Sea.
Industry and Infrastructure: Augean operates three waste processing sites across the UK, with activities focused on the management of oil-contaminated waste. The business unit also provides specialist industrial cleaning services. The Colt Industrial Services business, acquired in May 2016, is included within this business unit.
Information regarding the results of each reportable segment is included below. Performance is measured based on the segment operating profit, as included in the internal management reports that are reviewed by the Group’s CEO. This profit measure for each business unit is used to measure performance as management believes that such information is the most relevant in evaluating the results of each of the business units relative to other entities that operate within these sectors.
All activities arise solely within the United Kingdom. Inter-segment trading is undertaken on normal commercial terms.

The segmental results for the six months ended 30 June 2016 were as follows:
Energy and Construction
Radioactive Waste
Services
Augean Integrated
Services Industry and
Infrastructure
Augean North Sea
Services Group
£’000 £’000 £’000 £’000 £’000 £’000
Revenue
Hazardous landfill activities 6,886 - - - - 6,886
Non-hazardous landfill activities 1,730 - - - - 1,730
Waste treatment activities - - 1,566 7,595 - 9,161
Total Waste Management activities
- - 2,416 - - 2,416
Energy generation 38 - - - - 38
APCR(*)
management 4,573 - - - - 4,573
Radioactive waste management - 571 - - - 571
Processing of offshore waste - - - - 2,579 2,579
Rental of offshore equipment and personnel
- - - - 1,840 1,840
Industrial Services activities - - - 2,008 1,578 3,586
Total revenue net of landfill tax
13,227 571 3,982 9,603 5,997 33,380
Landfill tax 4,826 - - - - 4,826
Total revenue including inter-segment sales
18,053 571 3,982 9,603 5,997 38,206
Inter-segment sales (569) - (287) (538) (2) (1,396)
Revenue 17,484 571 3,695 9,065 5,995 36,810
Result Operating profit/(loss) before exceptional items 4,262 (70) (211) 173 (242) 3,912
Exceptional items (11) (8) (8) (555) (1,140) (1,722)
Operating profit/(loss) 4,251 (78) (219) (382) (1,382) 2,190
Finance charges (473)
Central costs (367)
Profit before tax 1,350
Taxation (361)
Profit after tax 989
Exceptional items comprise £1,111,000 relating to a commercial dispute (Note 10), £547,000 relating to acquisition costs and £64,000 of other costs.
* APCR means Air Pollution Control Residues
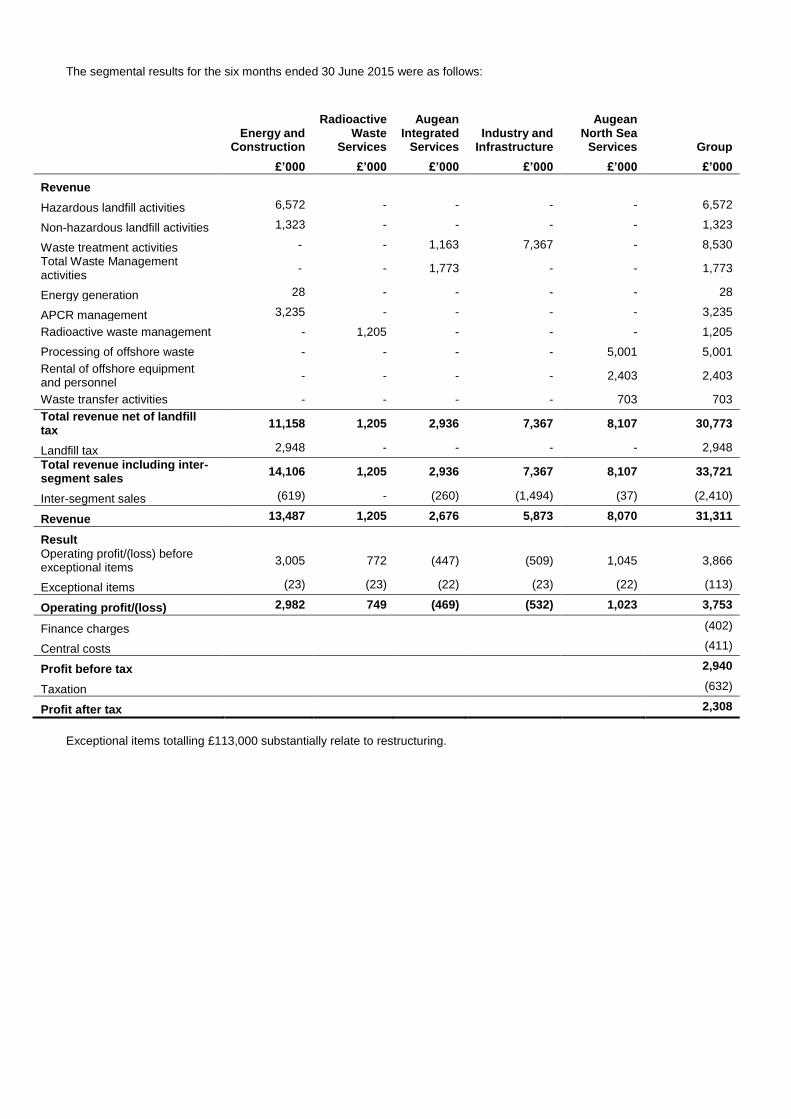
The segmental results for the six months ended 30 June 2015 were as follows:
Energy and Construction
Radioactive Waste
Services
Augean Integrated
Services Industry and
Infrastructure
Augean North Sea
Services Group
£’000 £’000 £’000 £’000 £’000 £’000
Revenue
Hazardous landfill activities 6,572 - - - - 6,572
Non-hazardous landfill activities 1,323 - - - - 1,323
Waste treatment activities - - 1,163 7,367 - 8,530
Total Waste Management activities
- - 1,773 - - 1,773
Energy generation 28 - - - - 28
APCR management 3,235 - - - - 3,235
Radioactive waste management - 1,205 - - - 1,205
Processing of offshore waste - - - - 5,001 5,001
Rental of offshore equipment and personnel
- - - - 2,403 2,403
Waste transfer activities - - - - 703 703
Total revenue net of landfill tax
11,158 1,205 2,936 7,367 8,107 30,773
Landfill tax 2,948 - - - - 2,948
Total revenue including inter-segment sales
14,106 1,205 2,936 7,367 8,107 33,721
Inter-segment sales (619) - (260) (1,494) (37) (2,410)
Revenue 13,487 1,205 2,676 5,873 8,070 31,311
Result Operating profit/(loss) before exceptional items
3,005 772 (447) (509) 1,045 3,866
Exceptional items (23) (23) (22) (23) (22) (113)
Operating profit/(loss) 2,982 749 (469) (532) 1,023 3,753
Finance charges (402)
Central costs (411)
Profit before tax 2,940
Taxation (632)
Profit after tax 2,308
Exceptional items totalling £113,000 substantially relate to restructuring.

5 Taxation
The taxation charge for the six month period ended 30 June 2016 has been based on the anticipated full year effective tax rate of 20.0% (six months ended 30 June 2015: 21.5%).
All deferred tax liabilities and assets have arisen on the temporary timing differences between the tax base of relevant assets and their carrying value in the statement of financial position. With the exception of a deferred tax liability arising on the recognition of an intangible asset associated with the acquisition of the Colt Industrial Services business, no change in deferred tax compared to the position at 31 December 2015 has been reflected in these statements. The taxation charge for the six month period to 30 June 2016 is all reflected within current tax, consistent with the 30 June 2015 position. 6 Earnings per share
The calculation of basic earnings per share (EPS) is based on the profit attributable to ordinary shareholders of £989,000 (six months ended 30 June 2015: £2,256,000, year ended 31 December 2015: £1,635,000) and a weighted average number of ordinary shares outstanding of 102,249,083 (six months ended 30 June 2015: 102,029,822, year ended 31 December 2015: 102,139,647), calculated as follows:
Unaudited Unaudited Audited
Six months Six months Year
ended ended ended
30 June 30 June 31 December
2016 2015 2015
£’000 £’000 £’000
Earnings for the purposes of basic and diluted EPS 989 2,256 1,635
Exceptional items (net of associated taxation) 1,486 90 3,118
Earnings for the purposes of adjusted basic and diluted EPS 2,475 2,346 4,753
Number of shares Number Number Number
Weighted average number of shares for basic earnings per share 102,249,083 102,029,822 102,139,647
Effect of dilutive potential ordinary shares from share options 2,826,458 3,000,779 2,795,165
Weighted average number of shares for diluted earnings per share 105,075,541 105,030,601 104,934,812
Earnings per share
Basic 0.97p 2.21p 1.60p
Diluted 0.94p 2.15p 1.56p
Adjusted earnings per share
Basic 2.42p 2.30p 4.65p
Diluted 2.36p 2.23p 4.53p
The exceptional items have been adjusted, in the adjusted EPS, to better reflect the underlying performance of the business, when presenting basic and diluted EPS.

7 Reconciliation of operating profit to cash generated from operations
Unaudited Unaudited Audited
Six months Six months Year
ended ended ended
30 June 30 June 31 December
2016 2015 2015
£’000 £’000 £’000
Operating profit 1,823 3,342 3,312
Amortisation of intangible assets 85 36 133
Depreciation 3,067 2,326 5,103
Impairment charge - - 2,888
Earnings before interest, tax, depreciation and amortisation (EBITDA) 4,975 5,704 11,436
Share-based payments 247 288 421
(Increase) / decrease in inventories (144) 62 105
(Increase) / decrease in trade and other receivables (3,099) (1,034) 956
Increase / (decrease) in trade and other payables 3,676 2,090 (312)
(Decrease) / increase in provisions (270) 242 (264)
Loss on disposal of property, plant and equipment - - 6
Cash generated from operations 5,385 7,352 12,348
The above EBITDA and cash flow generated from operations both include a net cash outflow of £970,000 relating to exceptional items (H1 2015: outflow of £113,000).
8 Analysis of changes in net debt
Audited
Unaudited
31 December
Acquisitions Cash Other 30 June
2015
flow movement 2016
£’000 £’000 £’000 £’000 £’000
Cash and cash equivalents 3,553 4,888 (5,943) - 2,498
Bank loans (7,750) - (7,750) 193 (15,307)
Finance leases (68) - 24 - (44)
Net debt (4,265) 4,888 (13,669) 193 (12,853)

9 Acquisition of subsidiary
On 18 May 2016, the Group acquired 100 percent of the issued share capital of Colt Holdings Limited, the holding company of Colt Industrial Services Limited, an industrial services business. The amounts recognised in respect of the identifiable assets acquired and liabilities assumed are as set out in the table below:
2016 2016 2016
Book Value Provisional
Fair Value adjustments
Fair Value
£’000 £’000 £’000
Intangible assets - 2,262 2,262
Property, plant and equipment 2,524 - 2,524
Inventories 82 (32) 50
Trade and other receivables 2,665 (43) 2,622
Cash and cash equivalents 4,888 - 4,888
Deferred tax liabilities (198) (438) (636)
Trade and other payables (1,674) (21) (1,695)
Total identifiable assets 8,287 1,728 10,015
Goodwill 3,774
Total consideration 13,789
Net cash outflow arising on acquisition:
Cash consideration 13,789
Less: cash balances acquired (4,888)
Total cash outflow 8,901
The intangible asset of £2,262,000 arising from the acquisition relates to the customer frameworks and contracts held by the acquired business. In addition to the initial consideration, a deferred consideration falls due dependent on the business obtaining certain commercial contracts in a defined time period. The fair value of the contingent consideration, which has a maximum potential value of £4,750,000, is estimated as £nil and was estimated by applying likelihood estimates against each element of the deferred consideration.
10 Contingent liability
In the 2015 Annual Report & Accounts, approved in March 2016, the Group indicated that it was involved in a commercial dispute with a customer, which had arisen in the normal course of business and that the customer had indicated its intention to bring a legal claim against the Group in relation to that matter. In July 2016, the Group settled the dispute with the customer, without a legal claim being made. The terms of the settlement are confidential and the total non-recurring cost of the settlement, including amounts paid to the customer, along with advisor fees and other related costs, is approximately £1.1m, which has been reflected as an exceptional item in the consolidated income statement of the Group in the six months ended 30 June 2016 (Note 4).


