1ª línea continuum of care:
maximizando la SG en CCRm RAS wt (Cetuximab)
Ramon Salazar
Institut Català d´Oncologia

Sequence of treatment • Chemotherapy sequence (folfiri/folfox) 1
• Detrimental effect when
Panitumumab (PACCE) 2 or Cetuximab (CAIRO-2) 3
were added to CT+Bevacizumab
• Biological sequence (EGFR versus VEGF targeted) – Before Sideness – Left versus Right sideness – New Molecular Subtypes – New treatment avenues
• Molecular Dx & Liquid Biopsies
– EGFR emergent resistant clones 1.- Tournigand ,et al. JCO 2004
2.- Hecht, et al. JCO 2009
3.- Tol et al, NEJM 2009

Meta-analysis PEAK / FIRE-3 / CALGB (before sideness)
Heinemann V, Rivera F et al. EJC, 2016
1.096 pts RAS wt: 170 p + 400 p + 526 p Study level data 1º end point: OS

Meta-analysis PEAK / FIRE-3 / CALGB (before sideness)
Heinemann V, Rivera F, et al. EJC, 2016
1.096 pts RAS wt: 170 p + 400 p + 526 p Study level data PFS

Meta-analysis PEAK / FIRE-3 / CALGB (before sideness)
Heinemann V, Rivera F, et al. EJC, 2016
1.096 pts RAS wt: 170 p + 400 p + 526 p Study level data
RR

Biological sequencing Considerations for sequencing anti-EGFR and anti-VEGF therapy in mCRC
Tumour shrinkage Anti-EGFR mAbs may be more effective at rapidly debulking tumours than anti-VEGF mAbs
Sensitivity to second-line therapy Anti-EGFR-resistant cells may remain sensitive to anti-VEGF mAb therapy whereas anti-VEGF-resistant cells may become simultaneously resistant to anti-EGFR therapy*
Tumour and stromal cell genetics/epigenetics Tumour cells are less (epi)genetically stable than stromal cells so it may be preferable to use tumour cell-targeted drugs (e.g. an anti-EGFR mAb) early
Invasion and metastasis In preclinical models, VEGF inhibition has been reported to promote invasion and metastasis; therefore, it may be preferable to reserve VEGF mAb therapy for later lines†
• Wainberg ZA, Drakaki A. Expert Opin Biol Ther 2015;15:1205–20.
• *Via hypoxia-dependent resistance mechanisms; †controversial model; contrary data exist.
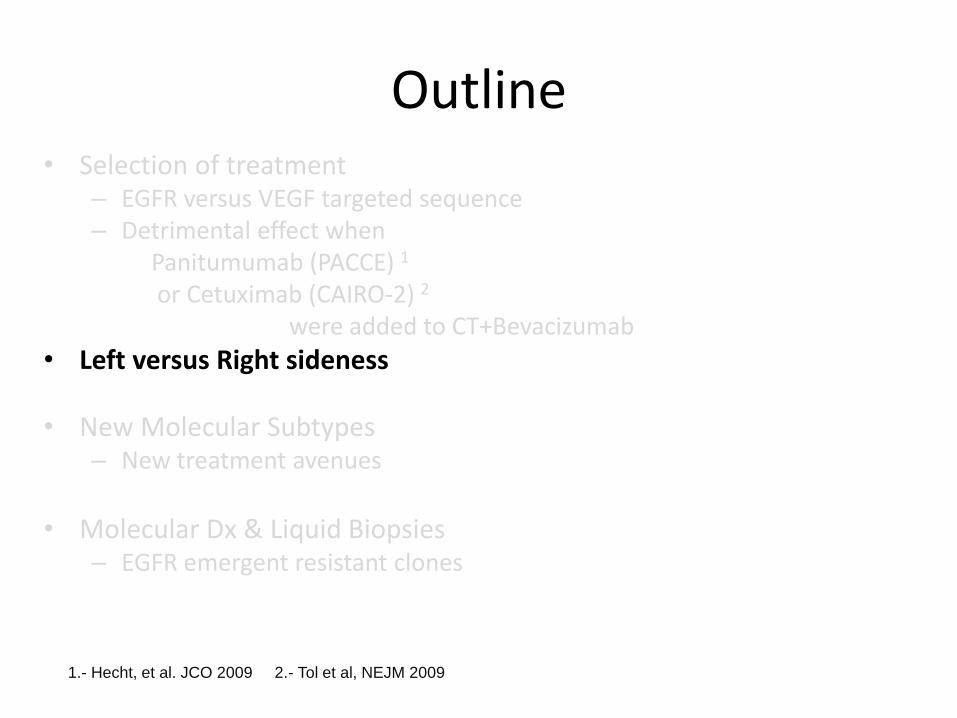
Outline • Selection of treatment
– EGFR versus VEGF targeted sequence – Detrimental effect when Panitumumab (PACCE) 1 or Cetuximab (CAIRO-2) 2
were added to CT+Bevacizumab
• Left versus Right sideness
• New Molecular Subtypes – New treatment avenues
• Molecular Dx & Liquid Biopsies
– EGFR emergent resistant clones
1.- Hecht, et al. JCO 2009 2.- Tol et al, NEJM 2009

9
There are multiple differences between the right and left colon and
their associated tumors Embryologic origin1
Midgut Hindgut
Function2
Almost inactive metabolically
Waste reservoir
Metabolism Fermentation Proteolysis
Degradation Processing
Microbiome3
Biofilm negative
Biofilm positive
Epigenetic2,4,5 Genetic4,6
Methylation MSI-High BRAF mt
See slide notes for references.

Right colon
• +++ MSI-high1,2
• +++ CIMP-high1,2
• +++ CMS13
• +++ Serrated pathway2†
CIMP-high, MSI-high and CMS
distribution varies between colorectal locations
1. Yamauchi M, et al. Gut 2012;61:847–54;
2. Missiaglia E, et al. Ann Oncol 2014;25:1995‒2001;
3. Guinney J, et al. Nat Med 2015;21:1350‒6 (and Supplementary Figure 10).
+++ denotes that a molecular or morphological subtype is
more prevalent compared with other colorectal segments.
†CIN expression and serrated pathway data are not available for rectal tumours.
CIMP, CpG island methylator phenotype; CIN, chromosomal instability;
CMS, Consensus Molecular Subtypes; MSI, microsatellite instability.
Left colorectum
Colon
• +++ CIN+2†
• +++ CMS23
• +++ EREG expression2‡
• MT KRAS1
• EGFR expression1
• HER2 amplification
• Molecular heterogeneity may be captured by the anatomical location of the tumour
Right colon
• +++ MT BRAF1,2
• MT KRAS1
• EGFR expression1

11
CRYSTAL (FOLFIRI vs FOLFIRI + Cetuximab)
Tumor location analysis – RAS WT
RAS wt
Left-sided Right-sided
Erb + CT (n=142)
CT alone (n=138)
Erb + CT (n=33)
CT alone (n=51)
ORR
% 72.5 40.6 42.4 33.3
OR (95% CI) 3.99 (2.40–6.62) 1.45 (0.58–3.64)
p-value <0.001 0.43
PFS
Median, months 12.0 8.9 8.1 7.1
HR (95% CI) 0.50 (0.34–0.72) 0.87 (0.47–1.62)
p-value <0.001 0.66
OS
Median, months 28.7 21.7 18.5 15.0
HR (95% CI) 0.65 (0.50–0.86) 1.08 (0.65–1.81)
p-value 0.002 0.76
CT = FOLFIRI; Erb, cetuximab
Clear poor prognostic effect of right-sided tumor location in both arms
PFS & OS benefit in left-sided mCRC with cetuximab + CT vs CT alone
Tejpar S, et al. JAMA Oncol 2016; epub 10 Oct 2016; Van Cutsem E, et al. Oral presentation at ESMO 2016
No difference in outcomes between arms in right-sided tumors, but conclusions are limited by small
sample size

12
RR in CRYSTAL in Left and Right Tumors
RAS wt
Left-sided Right-sided
CET + CT (n=142)
CT alone (n=138)
CET + CT (n=33)
CT alone (n=51)
ORR
% 72.5 40.6 42.4 33.3
OR (95% CI) 3.99 (2.40–6.62) 1.45 (0.58–3.64)
p-value <0.001 0.43
CT = FOLFIRI; CET =cetuximab
1. Tejpar S, et al. JAMA Oncol 2016; epub 10 Oct 2016; 2. Van Cutsem E, et al. Oral presentation at ESMO 2016

15
Unprecedented OS benefit with cetuximab + CT vs bevacizumab + CT in left-sided
RAS/BRAF wt mCRC1
FIRE-3 (FOLFIRI + cetuximab vs FOLFIRI + bevacizumab)
Tumor location analysis – RAS/BRAF WT
1. Heinemann V, et al. Oral presentation at ESMO 2016
RAS/BRAF wt
Left-sided Right-sided
Erb + CT (n=143)
Bev + CT (n=139)
Erb + CT (n=28)
Bev + CT (n=37)
ORR
% 67.8 62.6 47.4 42.0
OR 1.26 1.37
p-value 0.38 0.61
PFS
Median, months 11.1 11.1 8.0 10.5
HR 0.89 1.70
p-value 0.37 0.046
OS
Median, months 38.7 28.6 18.9 23.6
HR 0.62 1.31
p-value 0.002 0.34
CT = FOLFIRI; Erb, cetuximab; bev, bevacizumab
Data consistent w RAS wt subgroup analysis
Borderline-significant increase in PFS with bevacizumab, but no significant
difference in OS or ORR. However, conclusions are limited by small
sample size

Cetuximab + QT como elección de 1ªlínea para CCRm RAS wt1 de lado izquierdo
16
FIRE-3: análisis de 2ª línea según la localización tumoral
RAS wt
Localización Tumoral Lado Izquierdo Lado Derecho
1ª línea tratamiento
Cetux + FOLFIRI
(n=170*)
Bev + FOLFIRI
(n=139*)
Cetux + FOLFIRI (n=40*)
Bev + FOLFIRI (n=62*)
PFS2
Mediana, meses 6.7 5.3 5.3 3.2
HR (95% CI) 0.65 (0.50–0.85) 1.02 (0.65–1.61)
p-value 0.001 0.98
OS2
Mediana, meses 17.6 14.1 11.0 12.4
HR (95% CI) 0.65 (0.49–0.85) 1.02 (0.64–1.61)
p-value 0.002 0.94
Diferencia significativa en PFS2 y OS2 tras 1ª línea Cetuximab + FOLFIRI vs 1ª línea bevacizumab + FOLFIRI en CCRm RAS wt de
lado izquierdo
No hubo diferencias en los resultados de 2ª línea en CCRm de
lado derecho; no obstante, las conclusiones son limitadas por el
pequeño tamaño muestral
Los datos confirman el impacto pronóstico de la localización
tumoral en las líneas de tratamiento
*Patients with known primary tumor location who received 2nd line therapy. FIRE-3 did not meet its primary endpoint of significantly improving ORR in patients with KRAS (exon 2) wt mCRC based on investigators’ read6; The OS benefit of cetuximab plus chemotherapy vs bevacizumab plus chemotherapy demonstrated for RAS wt mCRC patients in the FIRE-3 study7 could not be confirmed in the CALGB/SWOG 80405 study8
1. Modest DP, et al. ASCO 2017 (Abstract No. 3525);

Tumor location analysis – RAS WT
17 Venook AP, et al. Oral presentation at ESMO 2016
CT = Investigator’s choice of FOLFIRI or mFOLFOX6 *Adjusted for biologic, protocol CT, prior adjuvant therapy, prior RT, age, sex, synchronous disease, in place primary, liver metastases
CALGB/SWOG 80405 (CT + cetuximab vs CT + bevacizumab)
RAS wt
Left-sided Right-sided
CET + CT (n=173)
Bev + CT (n=152)
CET + CT (n=71)
Bev + CT (n=78)
PFS
HR (95% CI) 0.84 (0.66–1.06) 1.64 (1.15–2.36)
p-value 0.15 0.006
Treatment × tumor location interaction (p-value)*
0.001
OS
Median, months 39.3 32.6 13.7 29.2
HR (95% CI) 0.77 (0.59–0.99) 1.36 (0.93–1.99)
p-value 0.04 0.10
Treatment × tumor location interaction (p-value)*
0.009
Longer PFS with bevacizumab vs cetuximab, and non sig
difference in OS between arms, in right-sided tumors;
conclusions are limited by small sample size
Significant OS benefit with cetuximab + CT vs bevacizumab + CT in left-sided RAS wt mCRC
Significant treatment × tumor location interaction for PFS and OS
Clear poor prognostic effect of right-sided tumor location on
OS in both arms

19
Meta-analyses support the preferential use of anti-EGFR + CT over bevacizumab + CT for LS tumors
1. Holch JW, et al. Eur J Cancer 2017;70:87–98; 2. Arnold D, et al. Ann Oncol 2017; epub Apr 12. doi: 10.1093/annonc/mdx175;
3. Heinemann V, et al. Lancet Oncol 2014;15:1065–1075; 4. Stintzing S, et al. Lancet Oncol 2016;17:1426–1434;
5. Venook A, et al. JAMA. 2017;317:2392-2401.
Arnold meta-analysis of OS2 Holch meta-analysis of OS1
1st line CT + anti-EGFR vs CT + bevacizumab in patients with LS tumors*
1st/2nd line CT + anti-EGFR vs CT ± bevacizumab in patients with LS tumors*
FE, fixed-effects model; RE, random-effects model *FIRE-3 did not meet its primary endpoint of significantly improving ORR in patients with KRAS (exon 2) wt mCRC based on investigators’ read;3 the OS benefit of cetuximab plus chemotherapy vs bevacizumab plus chemotherapy demonstrated for patients with RAS wt mCRC in the FIRE-3 study4 could not be confirmed in the CALGB/SWOG 80405 study5
86% of LS anti-EGFR + CT-treated patients in the head-to-head trials vs bevacizumab + CT received cetuximab + CT
LEFT Meta-analysis OS

20
Meta-analyses support the preferential use of anti-EGFR + CT over bevacizumab + CT for LS tumors
Arnold meta-analysis of ORR2 Holch meta-analysis of ORR1
1. Holch JW, et al. Eur J Cancer 2017;70:87–98; 2. Arnold D, et al. Ann Oncol 2017; epub Apr 12. doi: 10.1093/annonc/mdx175;
3. Heinemann V, et al. Lancet Oncol 2014;15:1065–1075; 4. Stintzing S, et al. Lancet Oncol 2016;17:1426–1434;
5. Venook A, et al. JAMA. 2017;317:2392-2401.
1st line CT + anti-EGFR vs CT + bevacizumab in patients with LS tumors*
1st/2nd line CT + anti-EGFR vs CT ± bevacizumab in patients with LS tumors*
FE, fixed-effects model; RE, random-effects model *FIRE-3 did not meet its primary endpoint of significantly improving ORR in patients with KRAS (exon 2) wt mCRC based on investigators’ read;3 the OS benefit of cetuximab plus chemotherapy vs bevacizumab plus chemotherapy demonstrated for patients with RAS wt mCRC in the FIRE-3 study4 could not be confirmed in the CALGB/SWOG 80405 study5
LEFT Meta-analysis ORR

21
No PFS benefit for CT + anti-EGFR vs CT ± bevacizumab for RS tumors
Arnold meta-analysis of PFS2 Holch meta-analysis of PFS1
1. Holch JW, et al. Eur J Cancer 2017;70:87–98; 2. Arnold D, et al. Ann Oncol 2017; epub Apr 12. doi: 10.1093/annonc/mdx175;
3. Heinemann V, et al. Lancet Oncol 2014;15:1065–1075; 4. Stintzing S, et al. Lancet Oncol 2016;17:1426–1434;
5. Venook A, et al. JAMA. 2017;317:2392-2401.
1st line CT + anti-EGFR vs CT + bevacizumab in patients with RS tumors*
1st/2nd line CT + anti-EGFR vs CT ± bevacizumab in patients with RS tumors*
FE, fixed-effects model; RE, random-effects model *FIRE-3 did not meet its primary endpoint of significantly improving ORR in patients with KRAS (exon 2) wt mCRC based on investigators’ read;3 the OS benefit of cetuximab plus chemotherapy vs bevacizumab plus chemotherapy demonstrated for patients with RAS wt mCRC in the FIRE-3 study4 could not be confirmed in the CALGB/SWOG 80405 study5
RIGHT Meta-analysis PFS

22
No significant difference in OS for CT + anti-EGFR vs CT ± bevacizumab for RS tumors
Arnold meta-analysis of OS2 Holch meta-analysis of OS1
1. Holch JW, et al. Eur J Cancer 2017;70:87–98; 2. Arnold D, et al. Ann Oncol 2017; epub Apr 12. doi: 10.1093/annonc/mdx175;
3. Heinemann V, et al. Lancet Oncol 2014;15:1065–1075; 4. Stintzing S, et al. Lancet Oncol 2016;17:1426–1434;
5. Venook A, et al. JAMA. 2017;317:2392-2401.
1st line CT + anti-EGFR vs CT + bevacizumab in patients with RS tumors*
1st/2nd line CT + anti-EGFR vs CT ± bevacizumab in patients with RS tumors*
FE, fixed-effects model; RE, random-effects model *FIRE-3 did not meet its primary endpoint of significantly improving ORR in patients with KRAS (exon 2) wt mCRC based on investigators’ read;3 the OS benefit of cetuximab plus chemotherapy vs bevacizumab plus chemotherapy demonstrated for patients with RAS wt mCRC in the FIRE-3 study4 could not be confirmed in the CALGB/SWOG 80405 study5
RIGHT Meta-analysis OS

23
RIGHT Meta-analysis ORR
Cetuximab + CT is effective in patients with RS tumors: ORR numerically favors anti-EGFR + CT over bevacizumab +
CT
1. Holch JW, et al. Eur J Cancer 2017;70:87–98; 2. Arnold D, et al. Ann Oncol 2017; epub Apr 12. doi: 10.1093/annonc/mdx175;
3. Heinemann V, et al. Lancet Oncol 2014;15:1065–1075; 4. Stintzing S, et al. Lancet Oncol 2016;17:1426–1434;
5. Venook A, et al. JAMA. 2017;317:2392-2401.
Arnold meta-analysis of ORR2 Holch meta-analysis of ORR1
1st line CT + anti-EGFR vs CT + bevacizumab in patients with RS tumors*
1st/2nd line CT + anti-EGFR vs CT ± bevacizumab in patients with RS tumors*
FE, fixed-effects model; RE, random-effects model *FIRE-3 did not meet its primary endpoint of significantly improving ORR in patients with KRAS (exon 2) wt mCRC based on investigators’ read;3 the OS benefit of cetuximab plus chemotherapy vs bevacizumab plus chemotherapy demonstrated for patients with RAS wt mCRC in the FIRE-3 study4 could not be confirmed in the CALGB/SWOG 80405 study5
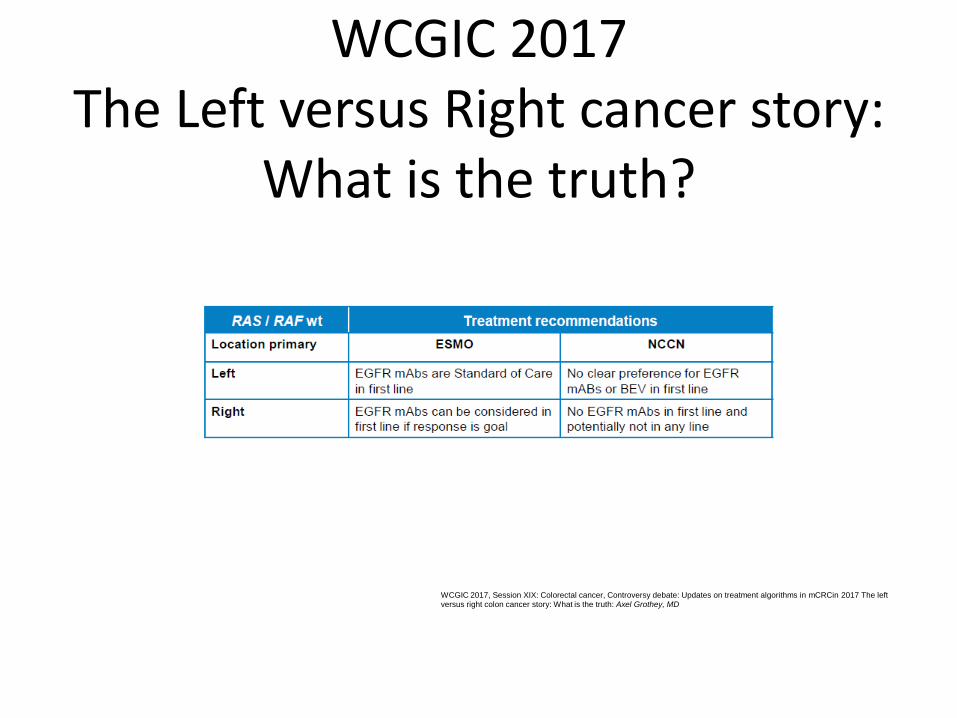
WCGIC 2017 The Left versus Right cancer story:
What is the truth?
WCGIC 2017, Session XIX: Colorectal cancer, Controversy debate: Updates on treatment algorithms in mCRCin 2017 The left versus right colon cancer story: What is the truth: Axel Grothey, MD

CMS1-4 in CALGB 80405 & Fire-3

Proposed taxonomy of colorectal cancer
Inmune checkpoints
blockade
TGF- inhibition + Inmune
checkpoint blockade
Prognosis
Drug response
prediction
Metabolism &
DNA damage
Oncogene drivers
Amplifications

Slide 18
Presented By Heinz-Josef Lenz at 2017 ASCO Annual Meeting
CALGB 80405

FOLFIRI cetuximab vs. FOLFIRI bevacizumab
Presented By Sebastian Stintzing at 2017 ASCO Annual Meeting
Fire-3

www.iconcologia.net
Institut Català d’Oncologia
ICO l’Hospitalet Hospital Duran i Reynals Gran Via de l’Hospitalet, 199-203 08907 l’Hospitalet de Llobregat
ICO Badalona Hospital Germans Trias i Pujol Ctra. del Canyet s/n 08916 Badalona
ICO Girona Hospital Doctor Trueta Av. França s/n 17007 Girona

BACK up slides….

Sensitivity to 2nd-line therapy Putative mechanisms of decreased anti-EGFR mAb
efficacy after anti-VEGF exposure
Putative effect of VEGF pathway inhibition:
• Hypoxia-induced EGFR-independent RAS signal activation1
• Hypoxia-induced EMT transition2
– sensitivity to EGFR inhibition
– Aggressive/invasive cell characteristics
• VEGF-A VEGF-A-induced resistance to anti-EGFR3 in WT KRAS/NRAS colon cancer cell lines
– VEGFR2/Stat-3-dependent
Adapted from Zaniboni A, Formica V. Cancer Chemother Pharmacol 2016 [Epub ahead of print]. 1. Zang M, et al. PLoS One 2010;5:e10966; 2. Zhou J, et al. Oncotarget 2015;6:44332‒45; 3. Derangère V, et al. Oncotarget 2016;7:9309‒21.
EMT, epithelial-mesenchymal transition;

Vogelstein et al. PNAS 1999; mod. Diehl et al Curr
Opin Oncol. 2007
Digital PCR Conventional PCR
Wild-type DNA
Mutant DNA Partitioning of DNA
into many individual
reactions
Digital signal readout Relative signal readout
Digital PCR allows high sensitivity and quantitative results

RAS mutants: MEK inhibition leads to PI3K/AKT activation by relieving a negative feedback on ERBB receptors
1Turke A et al. Cancer Research 2012