ABSTRACT RESULTS
INTRODUCTION
OBJECTIVE
METHODS
RESULTS
BACKGROUND: Subtype F HIV-‐1 is highly prevalent in Northwestern (NW) Spain, having reached 36% of newly diagnosed HIV-‐infected individuals by the end of 2016. We have shown an impaired response to anIretroviral treatment (ART) in paIents infected with HIV-‐1 subtype F viruses compared to those infected with subtype B. Here, we characterized a series of subtype F and B viruses from NW Spain paIents to beOer understand the mechanism(s) associated with these findings. METHODS: Plasma samples from paIents infected either with subtype F (n=10) or B (n=10) viruses, and clinical/virological data, were obtained from two hospitals in NW Spain. Two sets of recombinant viruses (3’Gag/PR/RT/INT and env) were constructed and used in drug suscepIbility and neutralizaIon assays, respecIvely, and also in viral growth kineIcs (VGK) experiments. A deep sequencing-‐based HIV-‐1 genotyping assay was used to determine drug resistance and coreceptor tropism. Finally, we used deep sequencing to analyze near full-‐length HIV-‐1 genomes and determine intra-‐paIent HIV-‐1 quasispecies diversity. RESULTS: No major differences in demographics/clinical characterisIcs were observed between both groups (F vs. B) with the excepIon of baseline plasma viral load (5.65 vs. 4.91 log c/ml, p = 0.013) and Ime to reach undetectable viremia (<50 log c/ml; 49 vs. 20 weeks, p=0.026). HIV-‐1 phenotypic/genotypic analysis showed that all 20 HIV-‐1 strains were suscepIble to all anIretroviral drugs tested. All viruses were equally neutralized by the bNABs VRC01 and 10E8. Similar VGKs were observed in the 3’Gag/PR/RT/INT-‐recombinant viruses; however, although no significant, subtype F env-‐recombinant viruses showed slightly higher replicaIon rates compared to subtype B viruses (median 0.036 vs. 0.015, p=0.119). IntrapaIent HIV-‐1 quasispecies diversity was also slightly higher in subtype F vs. B viruses (1.08 vs. 0.89, p=0.37). Full HIV-‐1 genome analysis idenIfied 39 polymorphisms present in subtype F but absent in all subtype B viruses, i.e., LTR (2), Gag (5), PR (5), RT (14), INT (3), Vif (3), gp120 (6), and gp41 (1). CONCLUSIONS: The significant delay in iniIal response to ART in paIents infected with subtype F viruses may be associated with higher viral replicaIon capacity. Ongoing growth compeIIon experiments, and further analysis of specific polymorphisms, are needed to corroborate the potenIal increase in replicaIve fitness of subtype F viruses compared to subtype B HIV-‐1 strains.
¢ Prevalence of non-‐B HIV-‐1 subtypes has been on the rise in Spain during the last 15 years, reaching double digits most likely to an increase in immigraIon from Africa and South America 1 ¢ Subtype F HIV-‐1 was introduced in Spain approximately 20 years ago, growing to epidemic proporIons in the last 5 years 2 ¢ InfecIon with subtype F HIV-‐1 strains in NW Spain has been mainly associated with MSM transmission 3 ¢ We have observed significant delay achieving virological suppression among subtype F HIV-‐infected individuals, showing evidence of impaired response to anIretroviral treatment 4,5
¢ To characterize subtype F HIV-‐1 strains circulaIng in NW Spain and its potenIal correlaIon with iniIal poor response to anIretroviral treatment.
¢ Clinical samples. Twenty plasma samples from individuals infected with subtype F (n=10) or B (n=10) were obtained from two hospitals in Galicia (Spain) and sent to Cleveland, OH for further analysis. Clinical, virological, and demographics data, including HIV-‐1 drug resistance results based on standard Sanger sequencing, were obtained from paIent care databases at the respecIve hospitals. ¢ HIV-‐1 genotyping. HIV-‐1 drug resistance and tropism was analyzed using a deep sequencing-‐based HIV-‐1 genotyping assay (DEEPGEN™) as described 6 ¢ ConstrucHon of recombinant viruses. Two sets of viruses were constructed using paIent-‐derived PCR products: p2-‐INT-‐recombinant viruses carrying gag-‐p2/NCp7/p1/p6/pol-‐PR/RT/IN fragments and env-‐recombinant viruses harboring gp160 fragments. These viruses were used in all phenotypic tests described below. ¢ HIV-‐1 phenotyping. SuscepIbility of the p2-‐INT-‐recombinant viruses to 22 anIretroviral drugs (PI, NRTI, NNRTI, and INSTI) was determined using our HIV-‐1 phenotypic assay (VIRALARTS™) as described 7 ¢ HIV-‐1 neutralizaHon assay. SuscepIbility of the env-‐recombinant viruses to 2 broadly neutralizing anIbodies (VRC01 and 10E8) was determined using the TZM-‐bl assay as described 8 ¢ HIV-‐1 replicaHve fitness assay. The ability of the p2-‐INT or env-‐recombinant viruses to replicate in vitro in the absence of drug pressure or host immune response pressure was determined using viral growth kineIcs assays as described 9 ¢ Near full-‐length HIV-‐1 genome sequencing. Six overlapping fragments covering almost the enIre HIV-‐1 genome were amplified and deep sequenced using a variaIon of the DEEPGEN™ assay as described 10 ¢ PhylogeneHc and viral diversity analysis. Read mapping, alignment and phylogeny reconstrucIon was performed as described 10. Variant calling (i.e., single nucleoIde and amino acid polymorphisms, including indels) and their frequencies in the virus populaIon were quanIfied using a proprietary pipeline (Alouani & Quiñones-‐Mateu). Intra-‐paIent HIV-‐1 quasispecies diversity was determined based on the p-‐distance model as described for deep sequencing 11
Table 1. Clinical and virological parameters of HIV-‐infected individuals Total
(n=20)SubtypeB(n=10)
SubtypeF(n=10)
p
Sex(male) 18(90%) 8(80%) 10(100%) 0.474Age(years)a 34±10 36±12 33±8 0.596RouteofTransmission
MSMHeterosexual
16(88.9%)2(11.1%)
6(75%)2(25%)
10(100%)0(0%)
0.183
Spanishoriginb 18(90%) 9(90%) 9(90%) 0.999HCVantibodiesc 1(5%) 1(10%) 0(0%) 0.999LateDiagnosisd 7(35%) 3(30%) 4(40%) 0.999CD4+cellcountatdiagnosise 520±355 647±406 393±256 0.112PlasmaHIV-1RNA(logcopies/ml)atdiagnosisf 5.26±0.84 4.89±0.78 5.64±0.76 0.013ARTg 19(95%) 9(90%) 10(100%) 0.999TimetoARTinitiation(months) 14.1±16.2 16.2±13.5 12.2±18.8 0.252CD4+cellcountatARTinitiation 407±279 486±325 337±224 0.327ARTRegimenh
PINRTI
NNRTIINSTI
5(26.3%)20(100%)8(42.1%)6(31.6%)
2(22.2%)10(100%)3(33.3%)4(44.4%)
3(30%)10(100%)5(50%)2(20%)
n/an/an/an/a
TimetoplasmaHIV-1RNA<50copies/ml(weeks)<20copies/ml(weeks)
36±3143±28
20±831±11
49±3653±35
0.0260.135
Polymorphismsi
PRL10IL10VG16EK20RM36ID60EI62VL63PA71TV77IL89MI93L
RTV106I
1(5%)10(50%)8(40%)1(5%)9(45%)7(35%)2(10%)5(25%)1(5%)4(20%)8(40%)4(20%)10(50%)
0(0%)1(10%)1(10%)0(0%)2(20%)0(0%)1(10%)5(50%)1(10%)4(40%)1(10%)4(40%)0(0%)
1(10%)9(90%)7(70%)1(10%)7(70%)7(70%)1(10%)0(0%)0(0%)0(0%)7(70%)0(0%)
10(100%)
0.999<0.0010.0200.9990.0700.0030.9990.0330.9990.0870.0200.087<0.001
PlasmaHIV-1RNA(logcopies/ml)atsamplingj 5.28+0.83 4.91+0.77 5.65+0.76 0.013
HIVdb Score - Subtype F vs B
PI-F
PI-B
NRTI-F
NRTI-B
NNRTI-F
NNRT
I-B
INST
I-F
INST
I-B-50
050
100150200250300350
HIV
db
Sc
ore
Figure 1. PhylogeneHc and HIV-‐1 subtyping analysis Figure 2. HIV-‐1 genotyping based on deep sequencing (DEEPGEN™)
a Median age at the Ime of sampling ± standard deviaIon (SD). b Individuals of Spanish ethniciIes, non-‐African. c PaIents seroposiIve to HepaIIs C virus. d Late diagnosis defined as CD4+ T cell counts <350 cells/mm3 and/or presence of AIDS-‐defining disease at HIV diagnosis. e Median CD4+ T-‐cell count (cells/mm3) ± SD at the Ime of diagnosis. f Median HIV-‐1 RNA plasma load ± SD at the Ime of diagnosis. g PaIents starIng anIretroviral treatment at the Ime of blood sample collecIon. h First-‐line anIretroviral regimen. i Polymorphisms in the protease (PR) or reverse transcriptase RT) coding regions associated with drug resistance, iniIally idenIfied using Sanger sequencing-‐based HIV-‐1 genotyping. j Median HIV-‐1 RNA plasma load ± SD at the Ime the blood sample was obtained. MSM, men who have sex with men; PI, protease inhibitors; NRTI, nucleoside reverse transcriptase inhibitors; NNRTI, non-‐nucleoside reverse transcriptase inhibitors; INSTI, integrase strand transfer inhibitors.
CONCLUSIONS REFERENCES
✓ HIV-‐1 phenotypic (VIRALARTS™) and genotypic (DEEPGEN™) analysis showed that subtype F and B HIV-‐1 strains were suscepIble to all anIretroviral drugs tested. ✓ All subtype F and B env-‐recombinant viruses were equally neutralized by the bNABs VRC01 (gp120-‐CD4) and 10E8 (gp41-‐MPER). ✓ Although not significant, a slightly higher replicaIon capacity was observed in subtype F env-‐recombinant viruses compared to subtype B viruses. ✓ Deep sequencing analysis of the near full-‐length HIV-‐1 genomes idenIfied 37 polymorphisms in subtype F that were absent in all subtype B viruses analyzed. ✓ Ongoing growth compeIIon experiments, as well as further characterizaIon of the idenIfied polymorphisms, will allow us to verify the potenIally higher replicaIve fitness of subtype F HIV-‐1 strains, which could potenIally be responsible for the delay in virological suppression in paIents infected with these viruses in NW Spain.
1. Monge et al 2012. Clin Microbiol Infect. 18:E485 2. Paraskevis et al 2015. Infect Genet Evol. 30:96 3. Pernas et al 2015. J Med Virol. 87:1319 4. Pernas et al 2014. AIDS. 28:1837 5. Cid-‐Silva et al 2017. AIDS. 32:121 6. Gibson et al 2014. An;microb Agents Chemother. 58:2167 7. Weber et al 2011. An;microb Agents Chemother. 55:3729 8. Sarzoq-‐Kelsoe et al 2014. J Immunol Methods. 409:131 9. Quiñones-‐Mateu et al 2000. J Virol. 74:9222 10. Weber et al 2017. AIDS Res Ther. 14:15 11. Shao et al 2014. J Virol Methods. 203:73
n Deep sequencing of the full HIV-‐1 genomes idenIfied 37 polymorphisms (relaIve to the HIV-‐1HXB2 reference strain) present in subtype F but absent in all subtype B viruses, i.e., LTR (2), Gag (3), PR (5), RT (14), INT (3), Vif (3), gp120 (6), and gp41 (1). While a couple of them have been associated with decreased suscepIbility to PI (L89M) or NNRTI (V106I), we are evaluaIng the rest of the polymorphisms for their potenIal associaIon with the interesIng response to ART in paIents infected with subtype F HIV-‐1 strains in Spain.
Table 2. Polymorphisms idenHfied by deep sequencing of near full-‐length HIV-‐1 genomes
Full-length (minus LTRs)
0.0
0.5
1.0
1.5
2.0
2.5
p-dist
ance
Subtype FSubtype B
n PhylogeneIc analysis, based on the enIre gag, pol, or env genes obtained by deep sequencing, verified the original subtyping obta ined us ing PR/RT sequences obtained as part of a Sanger sequencing-‐based HIV-‐1 genotyping. InteresIngly, three gag sequences (14-‐750, 14-‐751, and 14-‐755) and one env sequence (14-‐755) clustered with subtype HIV-‐1 strains rather than subtype F v i r u se s , s ugge sIng po tenIa l recombinaIon.
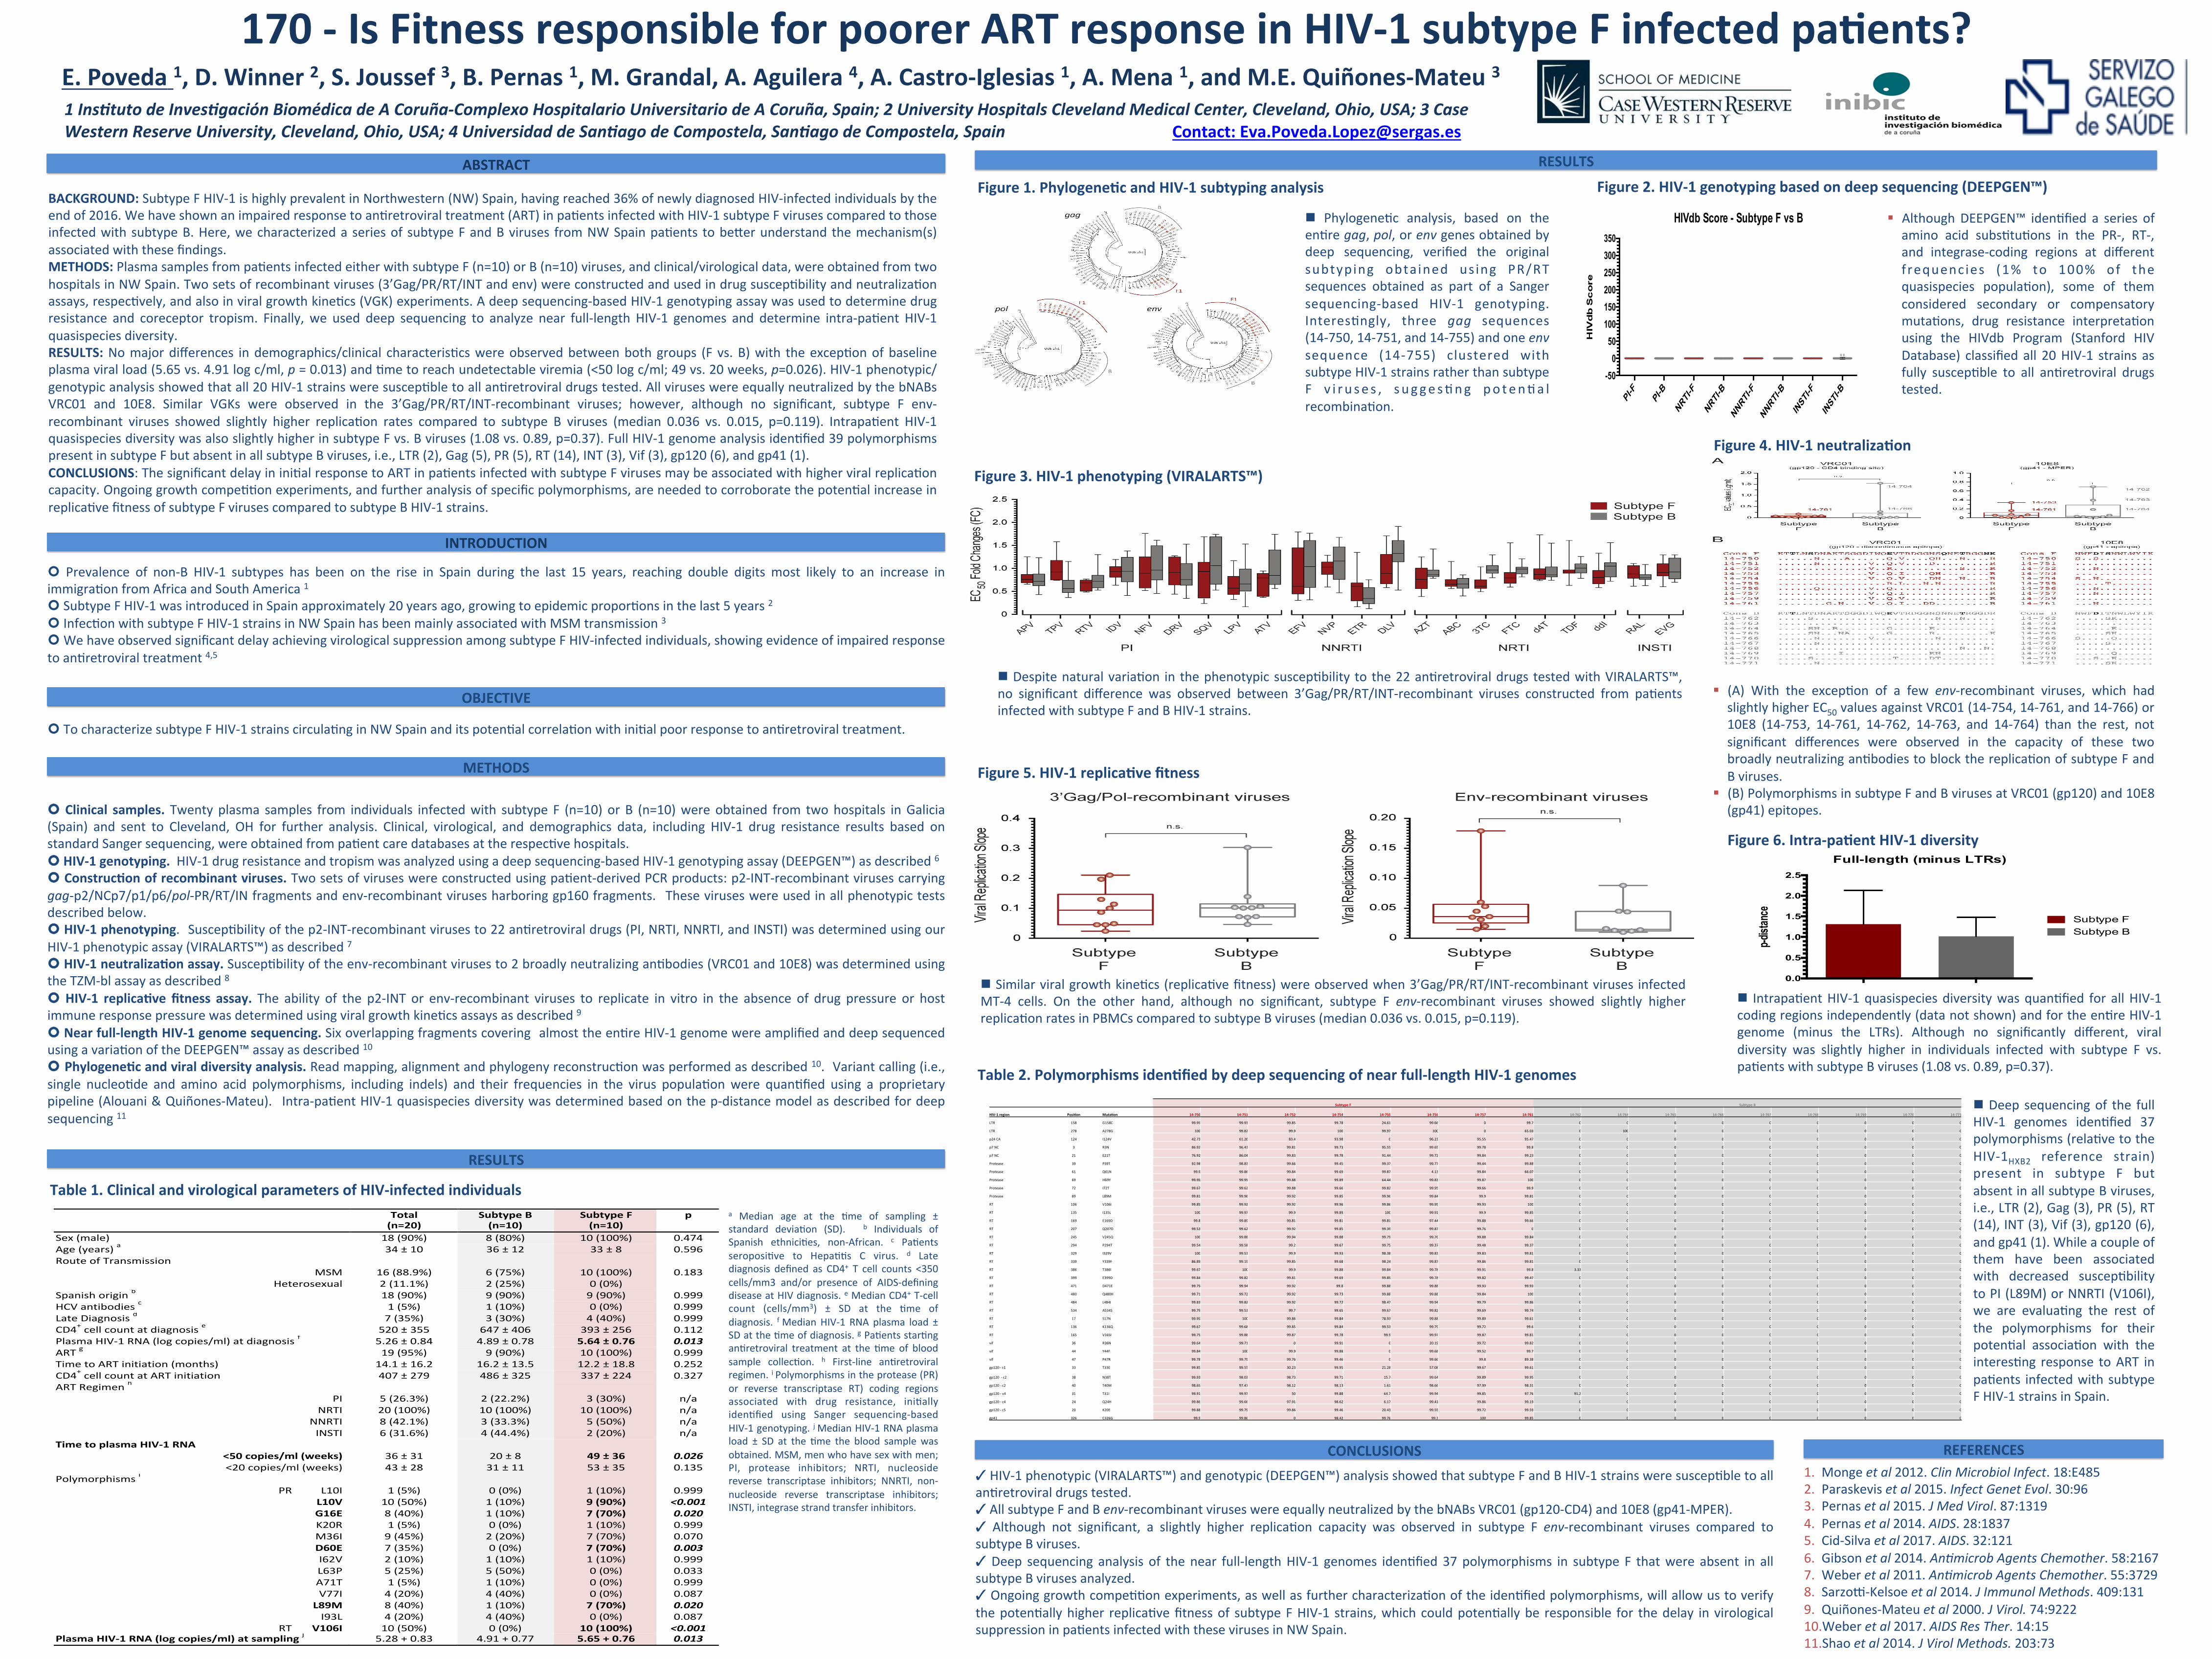
§ Although DEEPGEN™ idenIfied a series of amino acid subsItuIons in the PR-‐, RT-‐, and integrase-‐coding regions at different f requencies (1% to 100% of the quasispecies populaIon), some of them considered secondary or compensatory mutaIons, drug resistance interpretaIon using the HIVdb Program (Stanford HIV Database) classified all 20 HIV-‐1 strains as fully suscepIble to all anIretroviral drugs tested.
Figure 3. HIV-‐1 phenotyping (VIRALARTS™)
Figure 4. HIV-‐1 neutralizaHon
n Despite natural variaIon in the phenotypic suscepIbility to the 22 anIretroviral drugs tested with VIRALARTS™, no significant difference was observed between 3’Gag/PR/RT/INT-‐recombinant viruses constructed from paIents infected with subtype F and B HIV-‐1 strains.
§ (A) With the excepIon of a few env-‐recombinant viruses, which had slightly higher EC50 values against VRC01 (14-‐754, 14-‐761, and 14-‐766) or 10E8 (14-‐753, 14-‐761, 14-‐762, 14-‐763, and 14-‐764) than the rest, not significant differences were observed in the capacity of these two broadly neutralizing anIbodies to block the replicaIon of subtype F and B viruses.
§ (B) Polymorphisms in subtype F and B viruses at VRC01 (gp120) and 10E8 (gp41) epitopes.
n Similar viral growth kineIcs (replicaIve fitness) were observed when 3’Gag/PR/RT/INT-‐recombinant viruses infected MT-‐4 cells. On the other hand, although no significant, subtype F env-‐recombinant viruses showed slightly higher replicaIon rates in PBMCs compared to subtype B viruses (median 0.036 vs. 0.015, p=0.119).
Figure 5. HIV-‐1 replicaHve fitness
n IntrapaIent HIV-‐1 quasispecies diversity was quanIfied for all HIV-‐1 coding regions independently (data not shown) and for the enIre HIV-‐1 genome (minus the LTRs). Although no significantly different, viral diversity was slightly higher in individuals infected with subtype F vs. paIents with subtype B viruses (1.08 vs. 0.89, p=0.37).
Figure 6. Intra-‐paHent HIV-‐1 diversity
Subtype F Subtype B
HIV-‐1 region PosiHon MutaHon 14-‐750 14-‐751 14-‐752 14-‐754 14-‐755 14-‐756 14-‐757 14-‐761 14-‐762 14-‐764 14-‐765 14-‐766 14-‐767 14-‐768 14-‐769 14-‐770 14-‐771
LTR 158 G158C 99.95 99.93 99.85 99.78 24.61 99.66 0 99.7 0 0 0 0 0 0 0 0 0
LTR 278 A278G 100 99.82 99.9 100 99.97 100 0 65.03 0 100 0 0 0 0 0 0 0
p24 CA 124 I124V 42.73 61.26 83.4 93.98 0 96.23 95.55 95.47 0 0 0 0 0 0 0 0 0
p7 NC 3 R3N 86.92 96.43 99.81 99.73 95.55 99.65 99.78 99.8 0 0 0 0 0 0 0 0 0
p7 NC 21 E21T 76.92 86.04 99.83 99.78 91.44 99.72 99.84 99.23 0 0 0 0 0 0 0 0 0
Protease 39 P39T 92.98 98.83 99.66 99.45 99.37 99.77 99.44 99.88 0 0 0 0 0 0 0 0 0
Protease 61 Q61N 99.9 99.86 99.84 99.69 99.87 4.13 99.84 66.07 0 0 0 0 0 0 0 0 0
Protease 69 H69Y 99.95 99.95 99.88 99.89 64.44 99.83 99.87 100 0 0 0 0 0 0 0 0 0
Protease 72 I72T 99.67 99.62 99.88 99.66 99.82 99.95 99.66 99.9 0 0 0 0 0 0 0 0 0
Protease 89 L89M 99.81 99.96 99.92 99.85 99.96 99.84 99.9 99.81 0 0 0 0 0 0 0 0 0
RT 106 V106I 99.85 99.92 99.92 99.96 99.86 99.95 99.93 100 0 0 0 0 0 0 0 0 0
RT 135 I135L 100 99.97 99.9 99.89 100 99.91 99.9 99.85 0 0 0 0 0 0 0 0 0
RT 169 E169D 99.8 99.89 99.81 99.81 99.81 97.44 99.88 99.66 0 0 0 0 0 0 0 0 0
RT 207 Q207D 99.53 99.62 99.92 99.85 99.39 99.87 99.76 0 0 0 0 0 0 0 0 0 0
RT 245 V245Q 100 99.88 99.94 99.88 99.79 99.76 99.88 99.84 0 0 0 0 0 0 0 0 0
RT 294 P294T 99.54 99.58 99.2 99.67 99.75 99.37 99.48 99.37 0 0 0 0 0 0 0 0 0
RT 329 I329V 100 99.53 99.9 99.93 98.38 99.83 99.83 99.81 0 0 0 0 0 0 0 0 0
RT 339 Y339F 86.89 99.19 99.85 99.68 98.24 99.87 99.86 99.81 0 0 0 0 0 0 0 0 0
RT 386 T386I 99.67 100 99.9 99.88 99.84 99.78 99.91 99.8 3.33 0 0 0 0 0 0 0 0
RT 399 E399D 99.84 99.82 99.81 99.69 99.85 99.78 99.82 99.47 0 0 0 0 0 0 0 0 0
RT 471 D471E 99.79 99.94 99.92 99.8 99.88 99.88 99.93 99.93 0 0 0 0 0 0 0 0 0
RT 480 Q480H 99.71 99.72 99.92 99.73 99.88 99.88 99.84 100 0 0 0 0 0 0 0 0 0
RT 484 L484I 99.83 99.82 99.92 99.72 98.47 99.94 99.79 99.86 0 0 0 0 0 0 0 0 0
RT 534 A534S 99.79 99.53 99.7 99.65 99.67 99.82 99.69 99.74 0 0 0 0 0 0 0 0 0
RT 17 S17N 99.95 100 99.86 99.84 78.93 99.88 99.89 99.61 0 0 0 0 0 0 0 0 0
RT 136 K136Q 99.67 99.68 99.85 99.84 99.53 99.79 99.72 99.6 0 0 0 0 0 0 0 0 0
RT 165 V165I 99.75 99.88 99.87 99.78 99.9 99.97 99.87 99.81 0 0 0 0 0 0 0 0 0
vif 36 R36N 99.64 99.71 0 99.91 0 20.19 99.72 99.82 0 0 0 0 0 0 0 0 0
vif 44 Y44F 99.84 100 99.9 99.88 0 99.68 99.52 99.7 0 0 0 0 0 0 0 0 0
vif 47 P47R 99.78 99.79 99.76 99.46 0 99.66 99.8 89.38 0 0 0 0 0 0 0 0 0
gp120 -‐ c1 33 T33E 99.85 99.55 30.23 99.95 21.28 57.08 99.67 99.61 0 0 0 0 0 0 0 0 0
gp120 -‐ c2 38 N38T 99.93 98.03 98.73 99.71 15.7 99.64 99.89 99.95 0 0 0 0 0 0 0 0 0
gp120 -‐ c2 40 T40M 98.65 97.47 98.12 98.13 1.61 98.66 97.99 98.31 0 0 0 0 0 0 0 0 0
gp120 -‐ v4 31 T31I 99.91 99.97 50 99.88 64.7 99.94 99.85 97.76 91.2 0 0 0 0 0 0 0 0
gp120 -‐ c4 24 Q24H 99.86 99.66 97.91 98.62 6.17 99.41 99.86 99.19 0 0 0 0 0 0 0 0 0
gp120 -‐ c5 20 K20E 99.88 99.79 99.86 99.46 20.43 99.55 99.72 99.59 0 0 0 0 0 0 0 0 0
gp41 326 C326G 99.9 99.86 0 98.42 99.76 99.3 100 99.85 0 0 0 0 0 0 0 0 0
1 Ins&tuto de Inves&gación Biomédica de A Coruña-‐Complexo Hospitalario Universitario de A Coruña, Spain; 2 University Hospitals Cleveland Medical Center, Cleveland, Ohio, USA; 3 Case Western Reserve University, Cleveland, Ohio, USA; 4 Universidad de San&ago de Compostela, San&ago de Compostela, Spain
E. Poveda 1, D. Winner 2, S. Joussef 3, B. Pernas 1, M. Grandal, A. Aguilera 4, A. Castro-‐Iglesias 1, A. Mena 1, and M.E. Quiñones-‐Mateu 3
170 -‐ Is Fitness responsible for poorer ART response in HIV-‐1 subtype F infected paHents?
Contact: [email protected]


