Download - 1 Lynn R. Talford Marsh Risk Consulting Benchmarking Show Me the Metrics Money! July 2005

1
Lynn R. TalfordMarsh Risk Consulting
BenchmarkingShow Me the Metrics Money!
July 2005

2
BenchmarkingCharacteristics of Companies:
Those That Benchmark Not Afraid to Admit They
can Improve Competitive Proactive Fear of Being “Second” Leader - Search for “Best
Practices” Continuous Improvement
Philosophy Performance Based
Compensation
And Those That Don’t Lead by perception Fear of change Perceive lack of
competition Lack of clear goals,
expectations Reactive Complacent, comfortable
with status quo
Change the thought process:Not better or worse …..but rather
Is there money to save?

3
Levels of Benchmarking
Best PracticesV Process AnalysisA Competitor AnalysisL Trend AnalysisUE Informational Analysis
C O M P L E X I T Y
4
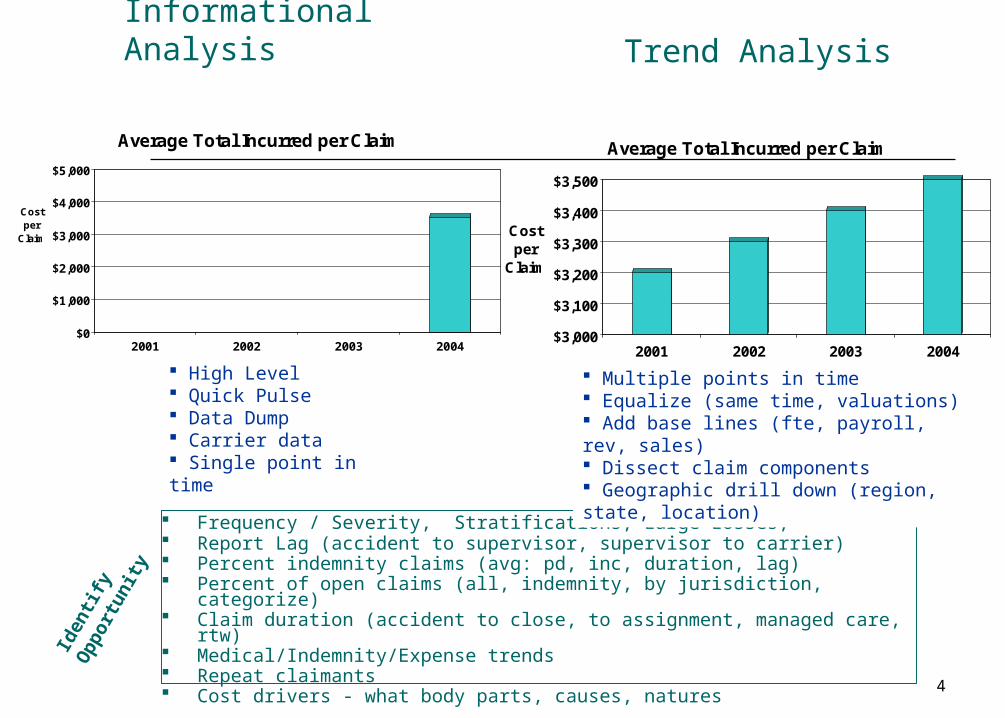
Informational Analysis
$0
$1,000
$2,000
$3,000
$4,000
$5,000
Costper
Claim
2001 2002 2003 2004
Average Total Incurred per Claim
Company High Level Quick Pulse Data Dump Carrier data Single point in time
Frequency / Severity, Stratifications, Large Losses, Report Lag (accident to supervisor, supervisor to carrier) Percent indemnity claims (avg: pd, inc, duration, lag) Percent of open claims (all, indemnity, by jurisdiction, categorize) Claim duration (accident to close, to assignment, managed care, rtw) Medical/Indemnity/Expense trends Repeat claimants Cost drivers - what body parts, causes, natures
$3,000
$3,100
$3,200
$3,300
$3,400
$3,500
Costper
Claim
2001 2002 2003 2004
Average Total Incurred per Claim
Company
Trend Analysis
Multiple points in time Equalize (same time, valuations) Add base lines (fte, payroll, rev, sales) Dissect claim components Geographic drill down (region, state, location)
Iden
tify
Opp
ortu
nity

5
Competitive Analysis
$0
$1,000
$2,000
$3,000
$4,000
$5,000
Costper
Claim
2001 2002 2003 2004
Average Total Incurred per Claim
Company Peer Group
Add new perspective Is it us or an industry trend? Jurisdictional issue? Is there money to save? Where? How?
Avoid Inappropriate Peers / Correlations : Compare like industries / processes Similar activities Consistent Time periods Related Jurisdictions
$0
$1,000
$2,000
$3,000
$4,000
$5,000
Costper
Claim
2001 2002 2003 2004
Average Total Incurred per Claim
Company Other
How Do You Report Claims? How Do You Rehabilitate Workers? How Do You Implement Integrated
Disability Management? How Do You Park Your Car?
Process Analysis
After ChangeBeforeChange

6
$0
$1,000
$2,000
$3,000
$4,000
$5,000
Costper
Claim
2001 2002 2003 2004
Average Total Incurred per Claim
Company Peer Group Best Practice
What goes into Safety Manuals/Training Programs?
When does 1-800 Claim Reporting work? How do you implement a Return-To-Work
Program? What reports provide a basis for measuring
effectiveness? What is the safest way to leave a parking lot?
Best Practices
Industry Avg
Client Avg
Measuring Best Practices
Expected Outcome Distribution
0
2000
4000
6000
8000
10000
10% 20% 30% 40% 50% 60% 70% 80% 90%
Claim Cost Distribution
Com
pany A
vera
ge P
aid
Your cost per claim is $8,000. How does that compare to average? Compare to Best of class? What is your savings potential? Is it worth pursuing? Break down by job, state – find ROI potential

7
Benchmarking Pitfalls
Provide Clarity (definitions (indemnity) venti, grande?, subjects, etc)Minority Business Owners Recently Complained that They Received Only 6% of the contracts for the $600 million Stadium Project. [6% of All Contracts? 6% of What They Bid? Or 6% of $600 million?What percent of contractors were minority?, What is a minority contractor?]
Insufficient sample sizes One-time comparisons Irrelevant comparisons Forcing results
About 6 Billion People Live on the EarthWorld Population Growth is Under Control, at Only 1% per YearWe Must Do Something! Each Year the World Has 60,000,000 More People on it
Keep a constant ground floor (baseline, time moves to right) Unknown data / unreliable data Numbers are only one “dimension”

8
CONSULTATIVE Benchmarking
RANK - WC Program to Industry Peers How are my WC costs compared to Industry Peers?
QUANTIFY: Place Dollar Value to Rank: Industry Position = Financial Advantage / Disadvantage
IDENTIFY RETURN ON INVESTMENT: Savings Potential Where? Identify location and/or job classes
IDENTIFY STRENGTHS & WEAKNESSES How do I compare to my peers? What programs should be better? Where can I make improvements? What are my loss causes?
STRATEGY – CONTINUOUS IMPROVEMENT Develop cost savings strategy and next steps for improvement
Putting it together… tell a story.

9
QUESTIONS ?/ COMMENTS

10
Wellness Programs A Critical Step in Managing Workplace Health
Marie Potty RNMarsh Risk Consulting

11
Wellness Objectives, Impact and Value*
Major Employer Wellness Objectives: Attempt to control rising healthcare costs Assist senior management in addressing employee health
issues
Employer / Employee Wellness Impact: Improve overall employee health and productivity Reduce incidence of injury / illness and fatalities Reduce sick days and unscheduled absences
Wellness Priorities and Value Proposition: Employers offering employee incentives to participate in
wellness programs for sustained, positive outcomes Employee health is crucial to the overall business success
ROI: Employer uncertainty of continued employee success
*American Association of Occupational Health Nurses AAOHN News (Vol., 25 – June 2005)
12
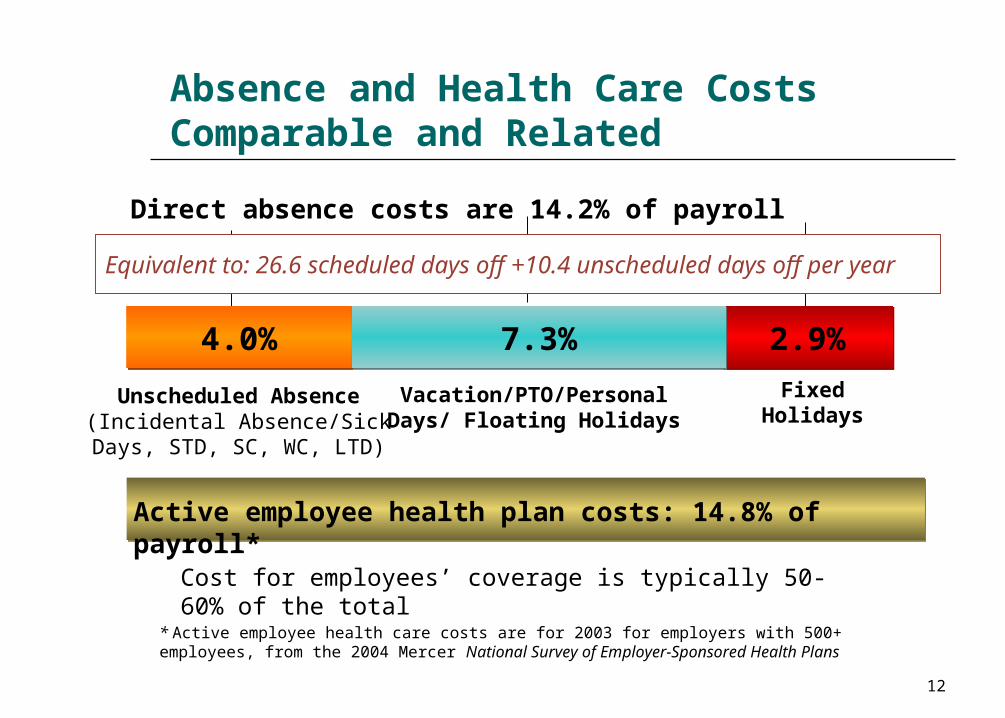
Absence and Health Care CostsComparable and Related
Direct absence costs are 14.2% of payroll
2.9%2.9%4.0%4.0% 7.3%7.3%
Unscheduled Absence (Incidental Absence/Sick Days,
STD, SC, WC, LTD)
Fixed HolidaysVacation/PTO/Personal Days/ Floating Holidays
Cost for employees’ coverage is typically 50-60% of the total
Active employee health plan costs: 14.8% of payroll*
* Active employee health care costs are for 2003 for employers with 500+ employees, from the 2004 Mercer National Survey of Employer-Sponsored Health Plans
Equivalent to: 26.6 scheduled days off +10.4 unscheduled days off per year

13
Employer Structured Lifestyle Risk Modification Program Options
0% 10% 20% 30% 40% 50%
Exercise Classes
Smoking Cessation Program
Nutritional Counseling
Stress Reduction Classes
25% 16%
29% 9%
21% 18%
9%16%
Currently offer to all/most employees Piloting

14
Periodic Employee Medical Screening
Percent of Participants
Currently Have at Some or Most Locations Considering
0% 10% 20% 30% 40% 50% 60%
Blood Pressure
Cholesterol
General Health Risk Appraisal
Diabetes
50% 18%
44% 21%
34% 24%
25%29%
70%

15
Employee Disease Management
Percent of Participants
Currently offer to all/most employees Piloting
0% 10% 20% 30% 40% 50%
Diabetes
Cardiovascular Disease
Hypertension
Low Back Pain
28% 6%
21% 27%
18% 4%
4%13%
Assess employee health risk
demographics
Employee validation of risk / Wellness Programs
Pilot targeted Wellness Program
Measure ROI

16
85% members = 15% cost
15% members = 85% cost
Disability ManagementDisability Management
Prevention Screenings Plan
Incentives
Examples: Ergonomics Exercise
classes Smoking
cessation Stress
reduction
Prevention Screenings Plan
Incentives
Examples: Ergonomics Exercise
classes Smoking
cessation Stress
reduction
WellLife Style
Modification
WellLife Style
Modification
Health risk
assessment Targeted risk
reduction
programs Risk modeling
Examples: Blood Pressure Cholesterol Diabetes
Health risk
assessment Targeted risk
reduction
programs Risk modeling
Examples: Blood Pressure Cholesterol Diabetes
At RiskPeriodic Screening
At RiskPeriodic Screening
Nurse advice line Web tools Consumer driven
health plans
Examples: Out-patient visits Benefit Plan Site /
Web MD Health Savings
Accounts
Nurse advice line Web tools Consumer driven
health plans
Examples: Out-patient visits Benefit Plan Site /
Web MD Health Savings
Accounts
Acute Illness/Discretionary Care
Doctor VisitsEmergency Visits
Acute Illness/Discretionary Care
Doctor VisitsEmergency Visits
Incentive design Self management
training
Examples: Diabetes Cardiovascular
disease
Incentive design Self management
training
Examples: Diabetes Cardiovascular
disease
Chronic IllnessDisease Management
Chronic IllnessDisease Management
Case
management Decision
support Predictive
modeling
Example: ABI – Acquired
Brain Injury
Case
management Decision
support Predictive
modeling
Example: ABI – Acquired
Brain Injury
CatastrophicLife Care Planning
CatastrophicLife Care Planning
2005 Total Health ContinuumAn Employers Guide

17
QUESTIONS ?/ COMMENTS
18
POST INJURY MANAGEMENT
What You Need To Know About Modified / Transitional Work Programs
Rick Poirier, M. A.R.C Knox & CompanyRisk Management Services Division
19
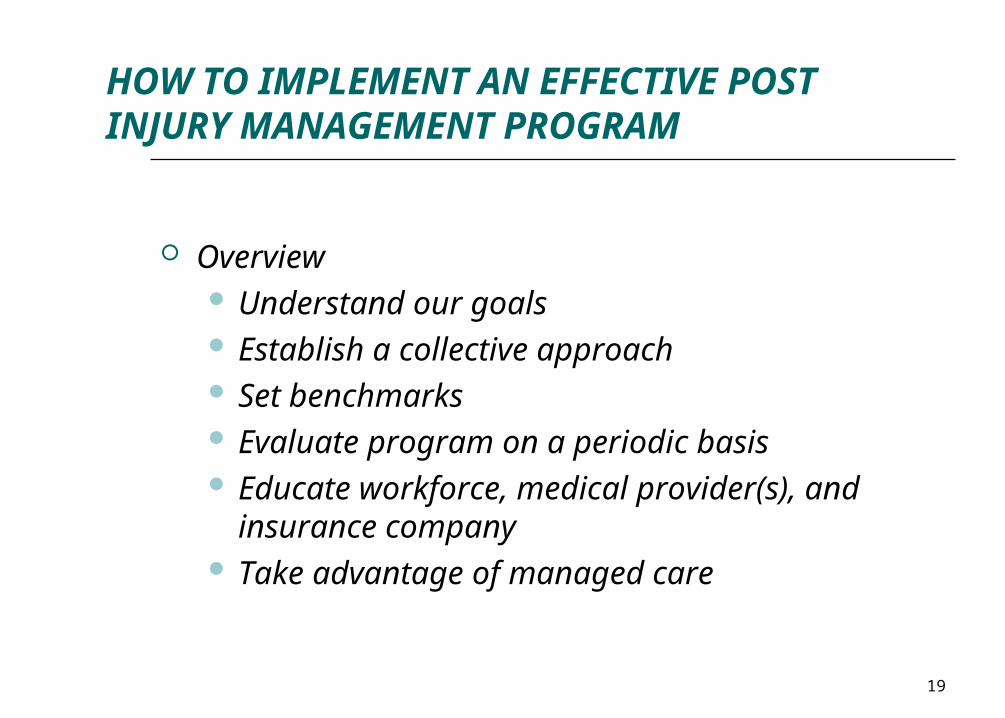
HOW TO IMPLEMENT AN EFFECTIVE POST INJURY MANAGEMENT PROGRAM
Overview Understand our goals Establish a collective approach Set benchmarks Evaluate program on a periodic basis Educate workforce, medical provider(s),
and insurance company Take advantage of managed care

20
HOW TO IMPLEMENT AN EFFECTIVE POST INJURY MANAGEMENT PROGRAM
Benefits Gives the employee an opportunity to
return as soon as medically possible Provides the best medical care in a timely
fashion Emphasis is on abilities not disabilities The injured worker benefits and so does
the employer

21
MORE BENEFITS
Contributions to the Workforce Reduces Impact of Claims Reserves Reduces Fraud Contributes to Controlling Rising Insurance Costs Other Benefits
22
HOW TO IMPLEMENT AN EFFECTIVE POST INJURY MANAGEMENT PROGRAM
Preliminary Steps Educate the workforce Establish good communications with medical
provider Strengthen job descriptions Develop job bank Try it

23
HOW TO IMPLEMENT AN EFFECTIVE POST INJURY MANAGEMENT PROGRAM
Employee in a temporary position Communications with “Gatekeeper” Follow up with medical provider Monitor performance / evaluate medical
progress & abilities Communications with insurance company
claim / rehab representative Return to normal job

24
HOW TO IMPLEMENT AN EFFECTIVE POST INJURY MANAGEMENT PROGRAM
Manager’s Responsibilities Investigate the incident / notify HR, Payroll,
Ins. Co., etc. Fax job description to medical provider Ensure that medical treatment was
provided in a timely fashion Determine ability level Initiate Temporary Modified Duty Program

25
HOW TO IMPLEMENT AN EFFECTIVE POST INJURY MANAGEMENT PROGRAM
Manager’s Responsibilities Notify claim representative of employee’s
temporary assignment Ensure that employee works within their
medical restrictions Determine if program should be extended Return employee to their original position,
if possible

26
HOW TO IMPLEMENT AN EFFECTIVE POST INJURY MANAGEMENT PROGRAM
Gatekeeper’s Responsibilities Educate management / workforce Develop bank of temporary positions Ensure job descriptions are task oriented
and meet ADA guidelines When informed of an injury requiring lost
time, send appropriate letters to medical provider / employee
Meet with employee on first day

27
HOW TO IMPLEMENT AN EFFECTIVE POST INJURY MANAGEMENT PROGRAM
Gatekeeper’s Responsibilities (cont.) Meet with employee on a weekly basis Monitor performance and medical progress If no temporary position available,
determine if they can be placed in a non-profit organization

28
HOW TO IMPLEMENT AN EFFECTIVE POST INJURY MANAGEMENT PROGRAM
Employee’s Responsibilities Report all on the job accidents to their
manager at the time of injury Obtain medical assistance when necessary Respond to letters or calls from employer Return to work based on temporary
assignment and medical abilities

29
HOW TO IMPLEMENT AN EFFECTIVE POST INJURY MANAGEMENT PROGRAM
Employee’s Responsibilities Stay within level of medical restrictions Meet with “Gate Keeper” when requested Get well

30
SOME SUGGESTIONS Have a written policy Make sure everyone understands Invite medical providers to your company What the employee can do Make sure everyone knows that modified duty is
temporary Monitor performance / medical progress Be creative

31
QUESTIONS ?/ COMMENTS


