
1
Impact of the Global Financial Crisis on Mining & Energy Companies
Cindy Gray, MBA
Senior Manager, Global Energy
Toronto Stock Exchange & TSX Venture Exchange
June 18, 2009

2
This document is for information purposes only and is not an invitation to purchase securities listed
on Toronto Stock Exchange and/or TSX Venture Exchange or Natural Gas Exchange. TMX Group
Inc. and its affiliates do not endorse or recommend any securities referenced in this document.
Please seek professional advice to evaluate specific securities.
While the information herein is collected and compiled with care, neither TMX Group Inc. nor any of its
affiliated companies represents, warrants or guarantees the accuracy or the completeness of the
information. You agree not to rely on the information contained herein for any trading, business or
financial purpose.
This information is provided with the express condition, to which by making use thereof you expressly
consent, that no liability shall be incurred by TMX Group Inc. and/or any of its affiliates as a result of
any errors or inaccuracies herein or any use or reliance upon this information.
All data used herein as at December 31, 2008 unless otherwise noted
© 2009 TMX Group Inc.
Disclaimer

3
Outline
1. Toronto Stock Exchange & TSX Venture Exchange Overview
2. Impact of Global Financial Situation on Mining & Energy Companies
3. Accessing Capital in the Current Economic Environment

4
TMX Group: A Multi-Asset Class Market Leader
(53% Ownership)
(47% Ownership)
(19.9% Ownership)
Data
Energy
Derivatives
Fixed Income
Equities

5
45 graduates in 200872 graduates in 2007
Unique Structure Facilitates ‘Graduation’ from Junior to Senior Market
2,262 companies
• Earlier stage, smaller companies
• Average company size = C$7.5MM market cap
• Stepping stone for international companies interested in a North American listing
• Potential for “graduation” to senior market as company grows
• Senior market for more established businesses
• Average company size = C$815MM market cap
• Access to large, international institutional investors
• Strong analyst coverage
1,570 companies

6
7th largest exchange groupBy equity capital raised (WFE, Dec 2008)
1st in North America
2nd
globally Based on number of listed issuers on TSX and TSXV (WFE, Dec 2008)
6
8th largest exchange group
Based on domestic market cap of listed issuers on TSX and TSXV (WFE, Dec 2008)
Toronto Stock Exchange & TSX Venture Exchange

7
World Leaders in Resource Equities
1st in Energy
Home to 43% of the world’s public
energy companies
1st in Mining
Home to 55% of the world’s public
mining companies

8 Source: Exchange Websites *Includes RTOs and QTs on TSXV
228
145113
53
409
TSX/ TSXV ASX LSE-AI M NYSE NYSEAMEX
OIL & GAS ISSUERS
18
64
41
TSX/ TSXV* LSE-AIM NYSE AMEX NYSE ASX
N/A
World’s Largest Oil & Gas Public Market
NEW OIL & GAS LISTINGS IN 2008

9Source: Exchange Websites *Includes RTOs and QTs on TSXV
684
21684 68 55 48
1427
TSXTSXV
ASX LSE-AIM
HKEx NYSEAmex
J SE NYSE
29
9 5 3 3 2
138
TSXTSXV*
ASX LSE-AIM NYSEAmex
NYSE HKEx JSE
MINING ISSUERS NEW MINING LISTINGS IN 2008
World’s Largest Mining Public Market

10
Our Oil & Gas Issuers Have Global Operations
11
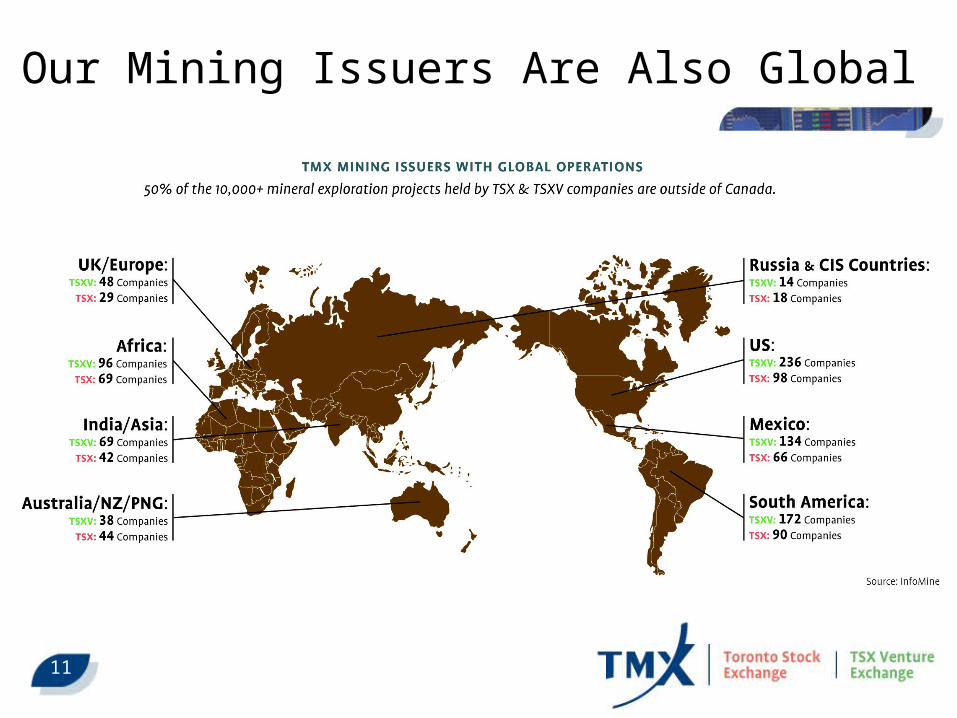
Our Mining Issuers Are Also Global

12
$4.1B
$10.5B
$5.3B
$11.7B
$2.6B
$10.4B$9.2B
0
2000
4000
6000
8000
10000
12000
14000
2002 2003 2004 2005 2006 2007 2008
Secondary Offerings Private Placements IPOs
Oil & Gas Companies Raise Equity Capital to Help Fund Their Business
Oil & Gas Equity Capital Raised on Toronto Stock Exchange and TSX Venture Exchange (C$B)
Oil & Gas Financings Have Raised C$46 B over last 5 years

13
Mining Equity Capital Raised Has Risen Dramatically
Source: Gamah International, 1999-2008, compiled by Toronto Stock Exchange
$2.9 $3.1 $3.5
$8.4 $9.6 $10.8 $9.7
$26.5
$50.3$47.8
1999 2000 2001 2002 2003 2004 2005 2006 2007 2008
Global Mining Equity Financing Trend 1999-2008 ($ Billions)

14
Outline
1. Toronto Stock Exchange & TSX Venture Exchange Overview
2. Impact of Global Financial Situation on Energy & Mining Companies
3. Accessing Capital in the Current Economic Environment

15
General Impacts*
• Massive de-leveraging in financial markets• Lack of liquidity in credit markets plus dramatic withdrawal of capital from
public markets
• Scaled-back production and capital spending deferral
• Unprecedented loss of wealth and rapidly weakening labor markets caused sharp pull back in consumer spending
• Global GDP expected to contract by 1.7% in 2009• GDP among developing economies expected to ease to 2.1% from 2008 level
of 5.8%
• Demand has slowed, especially in emerging markets
• Natural gas prices remain weak; oil has rebounded but remains volatile
• From July 2008 to December 2008, crude oil prices dropped nearly 70% while non-energy prices fell nearly 40%
*Data Source: World Bank, March 30, 2009

16
Impact on Resource Companies
• Earlier staged resource companies rely on external sources of financing to grow and move projects to the next phase
• As a result of the broader economic situation, companies face greater challenges accessing capital from traditional sources
• Drop in commodity prices impacts reserves-based lending
• Venture capitalists / angel investors retreated
• Private equity firms facing difficulties raising new funds
• IPO market very tight since Q3, 2008
• Companies scaled-back capital investments to preserve balance sheet strength – impacts production & cash flow
• Acquisition, consolidation or winding up also occurring

17
-20-10
0102030405060708090
100110120130140150160170180190200210220
May-0
4
Aug-0
4
Nov-0
4
Feb-0
5
May-0
5
Aug-0
5
Nov-0
5
Feb-0
6
May-0
6
Aug-0
6
Nov-0
6
Feb-0
7
May-0
7
Aug-0
7
Nov-0
7
Feb-0
8
May-0
8
Aug-0
8
Nov-0
8
Feb-0
9
S&P/TSX Composite Index S&P/TSX Capped Energy IndexAmex Oil & Gas Index Dow J ones U.S. Oil & Gas Index
Performance of Energy Indices
Source: TSXconnect
Total Return Performance Total Return Performance
Steep declines in 2H 2008
ranging from 50% to 80%+

18
-20-10
0102030405060708090
100110120130140150160170180190200210220
May-0
4
Aug-0
4
Nov-0
4
Feb-0
5
May-0
5
Aug-0
5
Nov-0
5
Feb-0
6
May-0
6
Aug-0
6
Nov-0
6
Feb-0
7
May-0
7
Aug-0
7
Nov-0
7
Feb-0
8
May-0
8
Aug-0
8
Nov-0
8
Feb-0
9
S&P/TSX Composite Index S&P/TSX Capped Energy IndexAmex Oil & Gas Index Dow J ones U.S. Oil & Gas Index
However…..Energy Indices Showing Signs of Recovery in 2009
Source: TSXconnect
Total Return Performance Total Return Performance
Energy indices showing signs of recovery in 2009

19
0
50
100
150
200
250
01
/02
/20
09
01
/09
/20
09
01
/16
/20
09
01
/23
/20
09
01
/30
/20
09
02
/06
/20
09
02
/13
/20
09
02
/20
/20
09
02
/27
/20
09
03
/06
/20
09
03
/13
/20
09
03
/20
/20
09
03
/27
/20
09
04
/03
/20
09
04
/10
/20
09
04
/17
/20
09
04
/24
/20
09
05
/01
/20
09
05
/08
/20
09
05
/15
/20
09
05
/22
/20
09
S&P/TSX COMPOSITE INDEX: 9.8% S&P 500 INDEX: -4.2% S&P/TSX DIVFD METALS&MNG: 92.6%
S&P/TSX GLOBAL GOLD: 6.2% S&P/TSX GLOBAL MINING: 13.9% AMEX GOLD BUGS: 23.7%
Diversified Mining & Metals Index Up YTD
Source: TSXconnect
92.6%Index ReturnsInitial Investment: $100
(January 1 2009 to May 27 2009)
Index ReturnsInitial Investment: $100
(January 1 2009 to May 27 2009)

20
Sources of Financing for Resource Companies
• Exploration, development, extraction and production of resources is capital intensive
• Landscape for financing has changed
• Well capitalized companies with cleaner balance sheets remain well positioned
• Industry accustomed to volatility but companies need to be more creative to identify viable financing alternatives
• Consolidation / M&A activity
• Private placements
• Public markets

21
Outline
1. Toronto Stock Exchange & TSX Venture Exchange Overview
2. Impact of Global Financial Situation on Energy & Mining Companies
3. Accessing Capital in the Current Economic Environment

22
Canada and the Canadian Economy
Solid
Stable
Significant

23
• Majority of financings YTD 2009 are for gold producers, and those companies in production - generating positive cash flow
Metals & Mining Continue to Access Capital
2009 YTD Mining Financings - Metal
Gold
51%
Silver
12%
Nickel
0%
Copper
20%
Zinc
1%
Iron Ore
2%
Lithium
0%
Uranium
14%
Source: CanaccordAdams, FP Infomart, common equity financings greater than Cdn$ 1.5 million
2009 YTD Mining Financings - Stage
Production
70%
Exploration
4%
Development
26%
Gold – 51%

24
• Canadian energy financings have been represented by large cap oil & gas issuers (80%)
• Demand for large issuers with oil sands exposure
Investor Appetite for Energy in the Canadian Capital Markets
Source: CanaccordAdams, FP Infomart, common equity financings greater than Cdn$ 1.5 million.
2009 YTD Energy Financings – Market Cap
Small cap
(<$100M)
1%
Large cap
(>$1,000M)
79%
Mid cap
(>$100M<
$1,000M)
20%
Oil & Gas -
Canada
80%
Energy
Services
5%
Electricity -
International
4%
Oil & Gas -
International
11%
2009 YTD Energy Financings - Material

25
Methods for Going Public on Toronto Stock Exchange or TSX Venture Exchange
26
Other Considerations
• Tailored listing requirements for mining, oil & gas and other industrial sectors
• Mining and energy companies required to report their reserves / resources in compliance with NI 43-101 for mining and NI 51-101 – both of which are globally recognized standards in technical disclosure• JORC, SAMREC, etc. resource and reserve standards are recognized for
purposes of reporting under NI 43-101
• IFRS Accounting/Audit Standards and U.S. GAAP accepted without reconciliation
• No requirement for Canadian officers / directors but senior market public company experience is required
• Timelines for listing vary significantly depending on company’s readiness

27
Excellent access to capital for smaller exploration and early development staged companies
Listing criteria and transaction policies specific to resources Balanced corporate governance approach & flexible structure
facilitates fast equity raisings
First in mining and energy by number of listed companies TMX Group mining companies have 10,000 projects around the
world; 50% are outside of Canada Able to finance international projects even in high risk places Large analyst community that covers juniors & seniors
Access to Capital
Global Visibility
Benefits for Resource Companies
Strong trading liquidity for mining & energy Graduation potential up to senior market as company grows Vibrant investor base that understands resources
Strong Trading Liquidity

28
Cindy GraySenior Manager, Global [email protected]
Toronto Stock Exchange / TSX Venture Exchange10th Floor, 300 – 5th Ave SW Calgary, AB T2P 3C4 CANADA


