1
Data and Analytic Approaches for Studies
of Health and Health Care Disparities
Alan M. ZaslavskyJohn Z. Ayanian
Harvard Medical School
2
Motivation• Much evidence of disparities
– Health– Health care
• Distinct issues and process• One of many sources of health disparities
• What data are needed to detect disparities?• What data to understand and correct processes leading to
disparities?• Conceptual approach to disparities• Analytic approaches for disparities
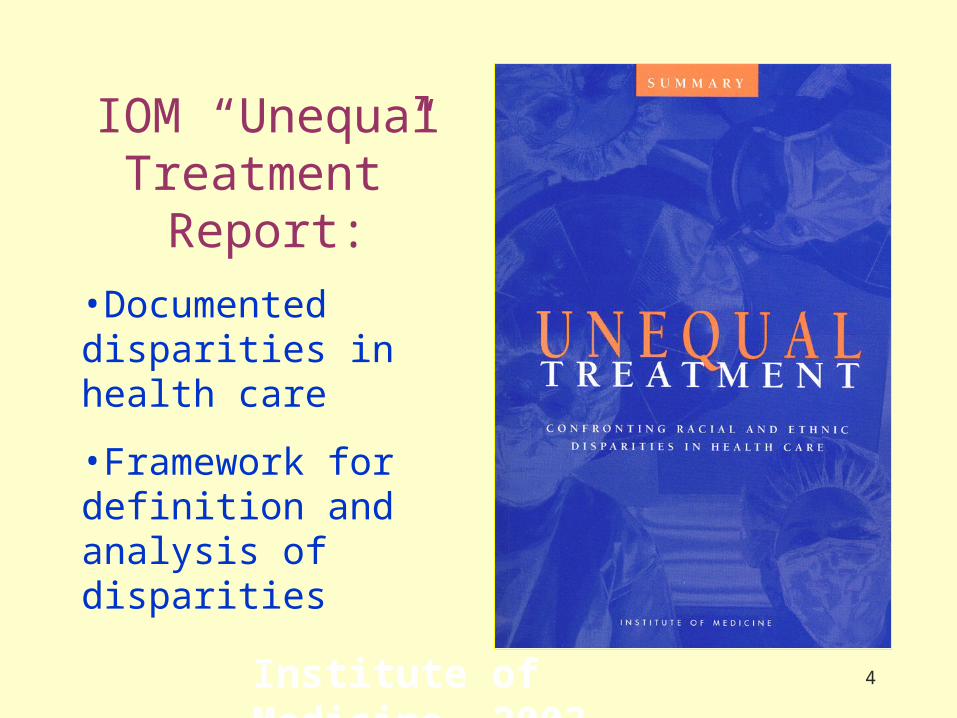
4Institute of Medicine, 2003
IOM “Unequal Treatment”
Report:
•Documented disparities in health care
•Framework for definition and analysis of disparities
5
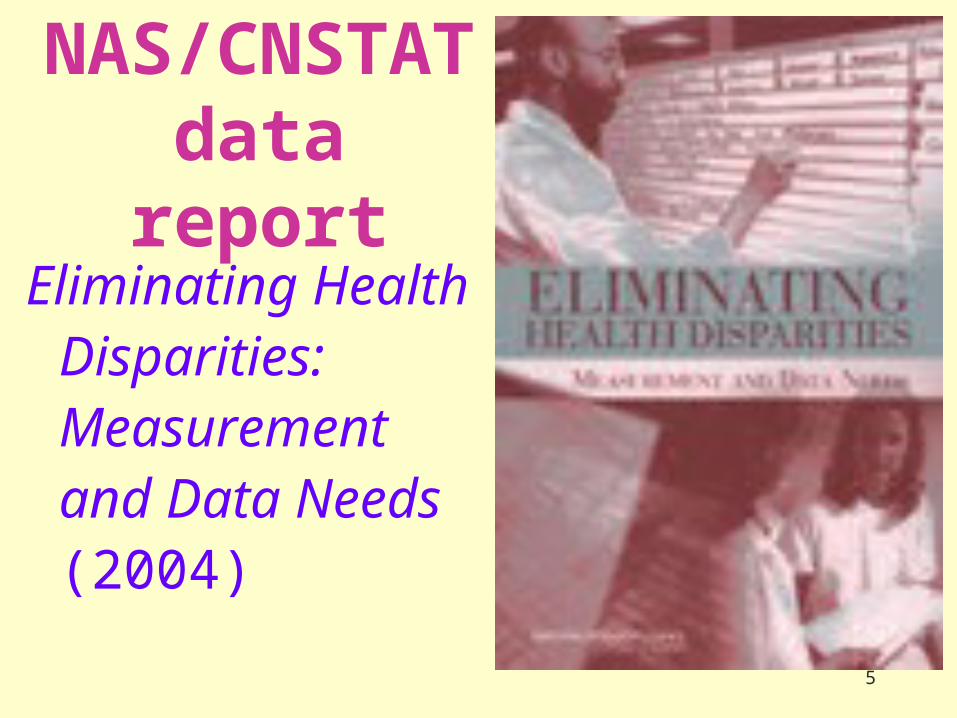
NAS/CNSTAT data report
Eliminating Health Disparities: Measurement and Data Needs (2004)
6
NAS/CNSTAT data report• Focus on collecting personal characteristics
relevant to disparities research– Race/ethnicity
– Socioeconomic position
– Acculturation
7
Meaning of race/ethnicity• Socially-constructed groupings
• Ethnicity: common culture, origin, history
• Race: defined by putative genetic relationship, broad areas of origin
• Many possible levels of detail– E.g. Hispanic vs. Salvadorean ethnicity
– “Asian” race?
– “Inside” vs. “outside” self-identification
– Growing non-European immigration since 1965
8
Measuring race/ethnicity• Self-report as gold standard
• OMB 1997 categories:– 5 racial categories: white, African-American,
Asian-American, Native America/Alaskan Native, Hawaiian/Pacific Islander
– “Check all that apply” format (~2% multiracial in Census)
– Hispanic/Latino ethnicity as separate question
9
Changes in categories• Before 1997: “select one” race
• Standard allows for more detailed reporting– Must be collapsible to basic categories
– More specific desired for state/local programs
10
Medicare race data• Primarily based on self-identification at
Social Security enrollment
• Little detail for older cohorts• [See Arday et al. (HCFR 2000)]
11
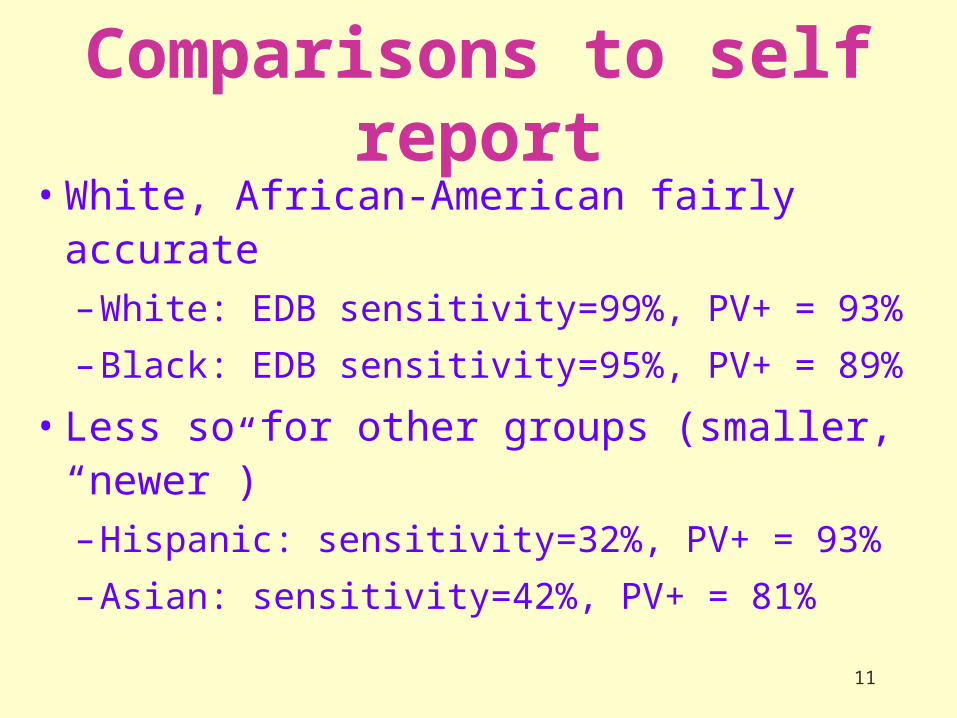
Comparisons to self report• White, African-American fairly accurate
– White: EDB sensitivity=99%, PV+ = 93%
– Black: EDB sensitivity=95%, PV+ = 89%
• Less so for other groups (smaller, “newer”)– Hispanic: sensitivity=32%, PV+ = 93%
– Asian: sensitivity=42%, PV+ = 81%
12
Collecting race/ethnicity at point of service
• Self report versus staff report
• Level of detail– Tailor to local populations
• Avoiding duplication of effort
• Sensitivity– Research and experience suggests: acceptable
if properly motivated
13
Socioeconomic Position (SEP)
Critical to disparities research– Mediator of disparities:
Race → Lower SEP → Poorer health care
– Control variable to distinguish mechanisms
– Source of disparities in itself
– Complex interactions• E.g. SEP gradients for some outcomes are different
across racial/ethnic groups
14
Dimensions of SEP
• Current resources– Current income
– Wealth/Assets (especially for elderly)
• “Permanent” income: ability to gain income– Education is an important & measurable component
• Occupation: prestige, stress (UK research)
• Life-course experience of deprivation/plenty
15
Collection of SEP data• Education
– Relatively nonsensitive, simple to ask
• Income– Highly sensitive in surveys, may be complex
• Occupation– Less sensitive, complicated to code
• Assets– Scales ask about key assets: home, car
16
Acculturation/language• Complex concept characterizing meeting of
cultures – especially among immigrants– Ability to use health care systems– Discrimination based on “foreignness”– Protective and detrimental effects of culturally-
specific practices– Changing expectations and needs
• English language proficiency a key component– Barriers to communication and recognition
17
Acculturation measures• Place of birth, age at immigration
• Generations since immigration
• Language– Proficiency
– Preference: English or other language
– Might be useful to providers/plans for communication, targeted outreach
• Cultural identity scales
18
General issues• Broad range of data systems have different
strengths and weaknesses– Coverage, sample size
• Less for surveys
– Level of detail and control over data collection• Less for administrative data
• Many levels of detail possible– Different for research, federal and state
programs
19
Linkages• Linkages across systems can bring together
characteristics and outcomes– Linkages based on names or other keys
– Geocoded census linkages: contextual variables or approximate individual characteristics
• Due regard to confidentiality concerns– Separate research and administrative uses
20
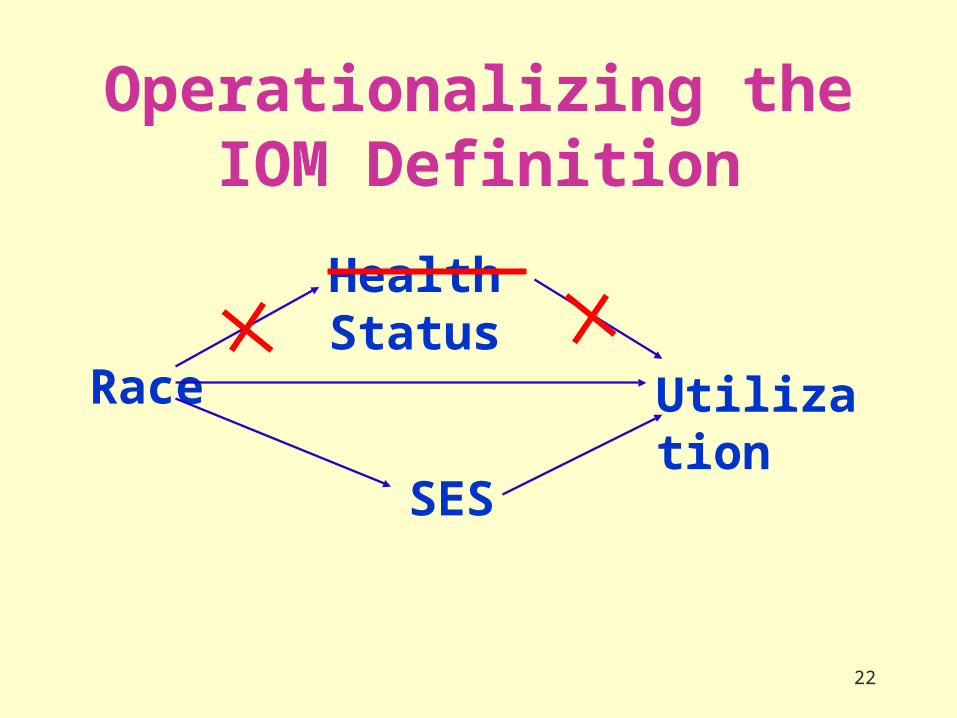
(Analytically) defining healthcare disparities
• IOM Definition (Unequal Treatment)
• Break race/ethnic differences into three parts– Due to health status-related variables
• NOT part of disparity
– Due to socioeconomic variables• Part of disparity
– Remaining race/ethnic effects• Part of disparity
21
3 components• Health status-related variables
– Age, sex, conditions, preferences, congenital susceptibilities
• Socioeconomic variables– Income, education, employment/insurance
• Remaining race/ethnic effects– Discrimination, “statistical discrimination”, poor
communication
22
Operationalizing the IOM Definition
Race
Health
Status
SES
Utilization
23
SEP & Disparities• Analytic approach suggested by IOM
Unequal Treatment report:– Include SEP variables in models
– Disparity = Differences mediated through SEP+ “Residual race effect”
– Differs from race coefficient in regression model
24
Respect for Preferences: A Value or an Excuse?
• Preferences may reflect:– Personal and cultural values
– Effects of past and present discrimination, patients’s awareness of limited resources & access, etc.
• Ideal of “informed preferences”– Only attainable with adequate information,
communication, access to care
25
Geographic Variation: Alternative Treatments
• Allow to mediate (like SES)– Geographical differences may be the result of
historical patterns of oppression and discrimination. – Allows us to make comparisons across areas
• Adjust (like health status)– Consider geography to be immutable if we are
looking for improvements within an area– Consider geography as a preference: an individual
makes a decision to live in a given area
26
Multilevel analysis• Distinguish effects arise at various levels of
healthcare system– Geography
– Health plans
– Providers (hospitals, doctors, clinics)
– Patients
• Effects of service patterns versus differential quality within units
27
Discussion questions (1)• Preferences:
– How would you distinguish between informed preferences and effects of past/current inequities?
– What factors might contribute to apparent “noncompliance”?
• Discrimination– Is it always conscious?
– How would you prove discrimination?
28
Discussion questions (2)• Responsibility
– Who is responsible for closing disparities: entire system, or units that serve the most members of underserved groups?
– Should we penalize or bolster underperforming providers who serve many minority patients?
– How much responsibility does the health care system have for remedying the effects of social inequalities?


