[email protected] http://ehib.org http://catracking.com
Dynamic Map Service Integration
Business Case for Implementation
Craig Wolff, M.S. Eng
CA Environmental Health Tracking Program
Environmental Health Investigations Branch
CA Department of Health Services
Impact Assessment, Inc.

[email protected] http://ehib.org http://catracking.com
CA Environmental Health Tracking Program (CEHTP)
• Enhance, exchange, integrate, analyze, disseminate, and visualize environmental hazard and health outcome data
• Facilitate transformation of data to “information” that is more usable/actionable by researchers/stakeholders
• Identified 40+ databases/systems of interest
• CEHTP is a service organization

[email protected] http://ehib.org http://catracking.com
Some CEHTP Principles, not all
• Environmental health tracking data should be infused into as many relevant mediums as possible– Local, State, Federal, non-governmental– Analog (e.g. paper) and digital (e.g. websites)
• CEHTP does not disseminate confidential data
• Partners produce/consume data and services with ease

[email protected] http://ehib.org http://catracking.com
Map Visualization Principles
• CEHTP and/or system owners provide easy, systematic, and standards-based access to GIS data for dynamic interactive mapping
• CEHTP and/or system owners maintain maximal control over look-and-feel of GIS data
• CEHTP and/or system owners focus resources on data within their jurisdiction
[email protected] http://ehib.org http://catracking.com
How a Typical Interactive Map Works
• Browser-based client has controls that take zoom, pan, layer visibility, etc. parameters and process into request to map server
• Map server receives request for map
• Map server processes request into an image file
• Browser-based client displays image file

[email protected] http://ehib.org http://catracking.com
Typical Map Server Paradigm
• Procure hardware, software, staff resources,
• Acquire (often buying) all GIS data to be used in map service, import into platform, configure rendering specifications for every GIS dataset/layer
• Develop a customized browser-based client to consume map service
[email protected] http://ehib.org http://catracking.com
Evolving Map Service Paradigm
• Provide Uniform Resource Locator (URL) access to commonly used GIS layers and, perhaps, give a limited set of choices for visual rendering
• Interface specifications (URL parameters) for requesting map image follow a consensus-based standard
• OpenGIS Web Map Service (WMS): TerraServer, USGS
[email protected] http://ehib.org http://catracking.com
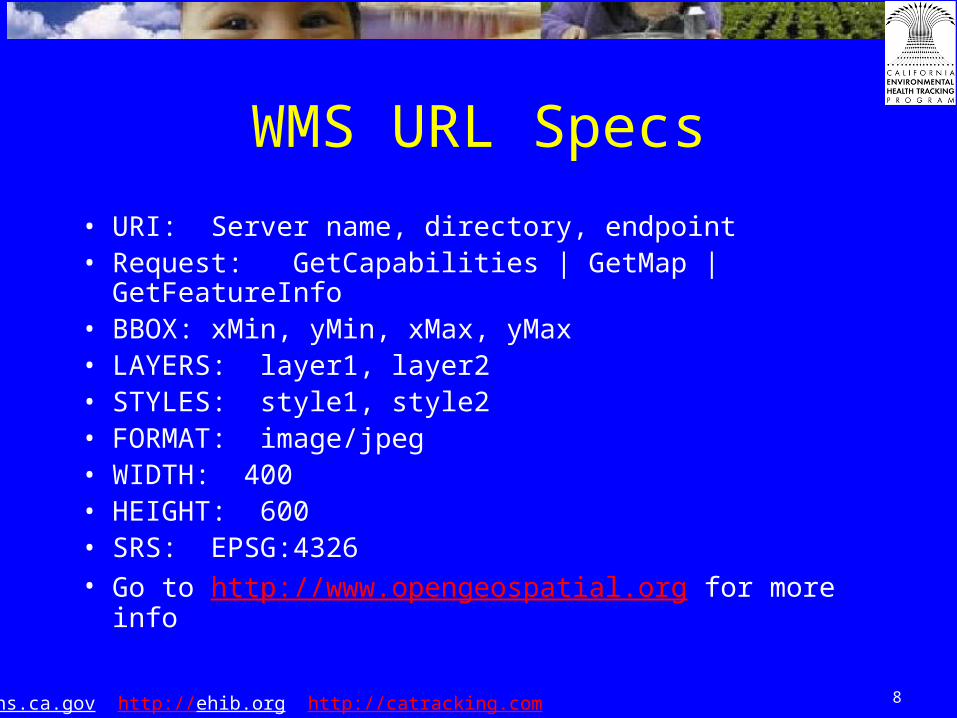
WMS URL Specs
• URI: Server name, directory, endpoint• Request: GetCapabilities | GetMap | GetFeatureInfo• BBOX: xMin, yMin, xMax, yMax• LAYERS: layer1, layer2• STYLES: style1, style2• FORMAT: image/jpeg• WIDTH: 400• HEIGHT: 600• SRS: EPSG:4326• Go to http://www.opengeospatial.org for more info

[email protected] http://ehib.org http://catracking.com
TerraServer WMS Example
URL:http://terraserver.microsoft.com/ogcmap6.ashx?version=1.1.1&request=GetMap&Layers=DOQ&Styles=&SRS=EPSG:26910&BBOX=547200,4182400,553600,4186400&width=800&height=500&format=image/jpeg&Exceptions=se_xml
[email protected] http://ehib.org http://catracking.com
Google/NASA Tip the Scale
• Google Earth and NASA Worldwind display image tiles of basemap and satelite/aerial imagery of the whole earth
• Physical air travel by humans decreases• Google Local provides easy to use browser-
based clients that incorporate emerging WWW technologies (AJAX) and map image tiles

[email protected] http://ehib.org http://catracking.com
Google/Hackers Redefine Browser-Based Interactive Mapping
• Google Maps API makes it tremendously easy to put dynamic maps with basemap and high-res satelite imagery on any* website with no non-standard plug-ins– See http://www.google.com/apis/maps/
• Hackers figure out how to integrate WMS content in Google Maps API– See http://blog.kylemulka.com/?p=287
*Commercial sites must pay

[email protected] http://ehib.org http://catracking.com
Tracking Trials/Tribulations
• Two partners to visualize CEHTP pilot project data through custom interactive map server/client implementations
• Stumbled through GIS data exchange, metadata, and appropriate layer rendering
• Loss of control, miscommunication, map server/client platforms too “closed”
• Need enterprise solution that makes integration and standards a top priority
[email protected] http://ehib.org http://catracking.com
Google API Drawbacks
• Map client can only display 2 overlapping image tiles simultaneously (“Hybrid)
• Even if one of those tiles was non-Google data (ie. your own tile data), image opacity is not consistently or elegantly supported across browsers
• Multiple tiles must be overlaid on server-side

[email protected] http://ehib.org http://catracking.com
CEHTP Custom WMS Layering
• Develop server-side utility that overlays multiple map server image tiles
• Support for consuming most popular map server output (ie. ArcIMS, WMS, UMN MapServer, ArcWeb services)
• Support for individual layer transparency and opacity
• Support for server-side caching (~Google speed)• Invocation interface is WMS (ie. standard URL
access)

[email protected] http://ehib.org http://catracking.com
Recursion on the WMS LAYERS parameter
• Recursion: “A programming technique in which a function may call itself.”
• WMS LAYERS parameter is another WMS request (or an ArcIMS request or a MapServer request)
• HTTP encode each LAYERS parameter• Opacity specified through STYLES
parameter
[email protected] http://ehib.org http://catracking.com
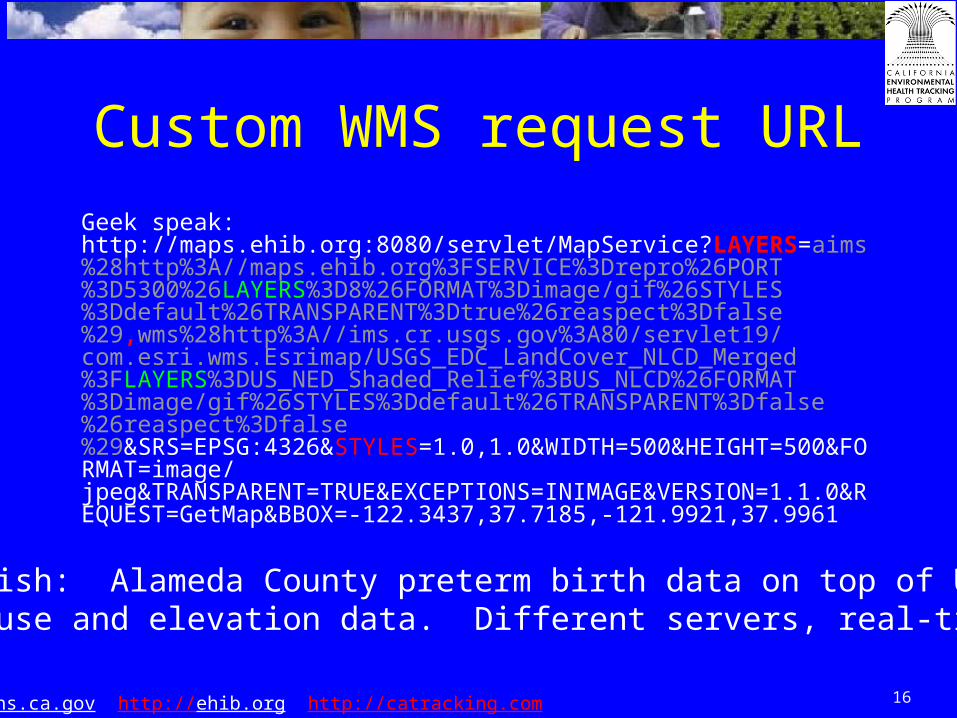
Custom WMS request URL
Geek speak: http://maps.ehib.org:8080/servlet/MapService?LAYERS=aims%28http%3A//maps.ehib.org%3FSERVICE%3Drepro%26PORT%3D5300%26LAYERS%3D8%26FORMAT%3Dimage/gif%26STYLES%3Ddefault%26TRANSPARENT%3Dtrue%26reaspect%3Dfalse%29,wms%28http%3A//ims.cr.usgs.gov%3A80/servlet19/com.esri.wms.Esrimap/USGS_EDC_LandCover_NLCD_Merged%3FLAYERS%3DUS_NED_Shaded_Relief%3BUS_NLCD%26FORMAT%3Dimage/gif%26STYLES%3Ddefault%26TRANSPARENT%3Dfalse%26reaspect%3Dfalse%29&SRS=EPSG:4326&STYLES=1.0,1.0&WIDTH=500&HEIGHT=500&FORMAT=image/jpeg&TRANSPARENT=TRUE&EXCEPTIONS=INIMAGE&VERSION=1.1.0&REQUEST=GetMap&BBOX=-122.3437,37.7185,-121.9921,37.9961
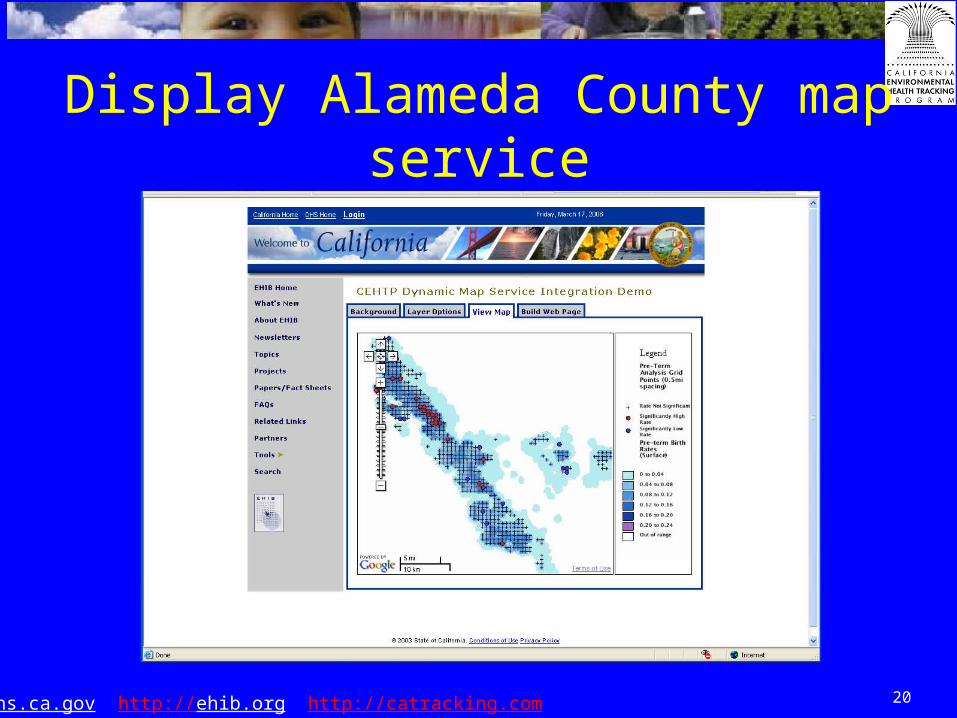
English: Alameda County preterm birth data on top of USGSlanduse and elevation data. Different servers, real-time

[email protected] http://ehib.org http://catracking.com
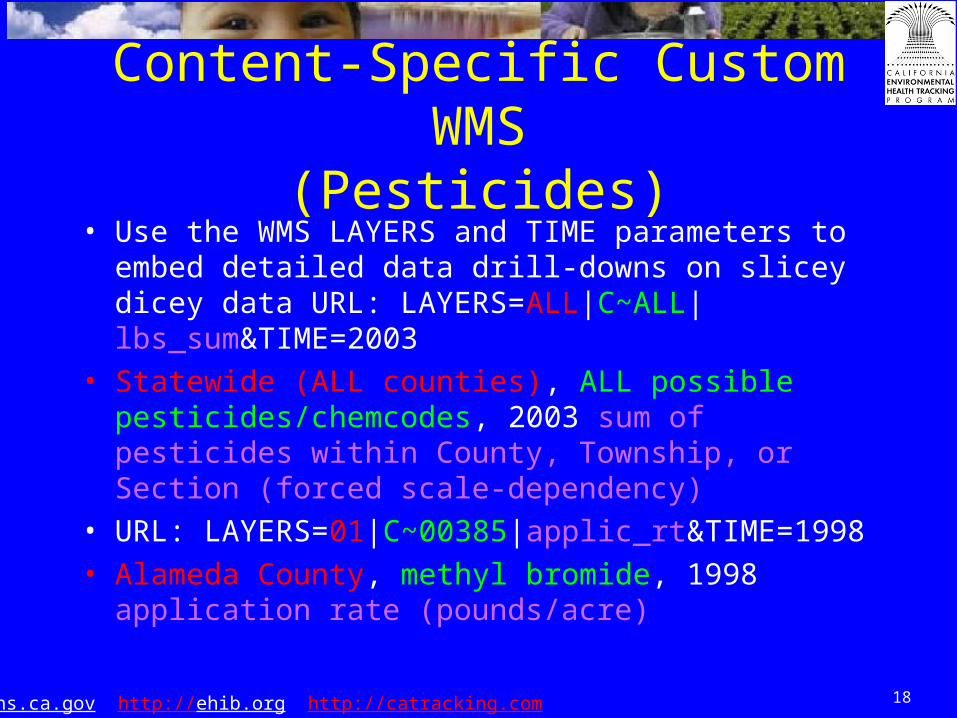
Content-Specific Custom WMS(Pesticides)
• Use the WMS LAYERS and TIME parameters to embed detailed data drill-downs on slicey dicey data URL: LAYERS=ALL|C~ALL|lbs_sum&TIME=2003
• Statewide (ALL counties), ALL possible pesticides/chemcodes, 2003 sum of pesticides within County, Township, or Section (forced scale-dependency)
• URL: LAYERS=01|C~00385|applic_rt&TIME=1998
• Alameda County, methyl bromide, 1998 application rate (pounds/acre)

[email protected] http://ehib.org http://catracking.com
Bringing it Together
• Dynamic Map Service Integration Demo
• Special thanks to CADPR, CA West Nile Virus Surveillance Program, and Center for Vectorborne Diseases (CVEC) for providing data (map services)

[email protected] http://ehib.org http://catracking.com
Add in West Nile Virus bird death siting UC Davis service as layer

[email protected] http://ehib.org http://catracking.com
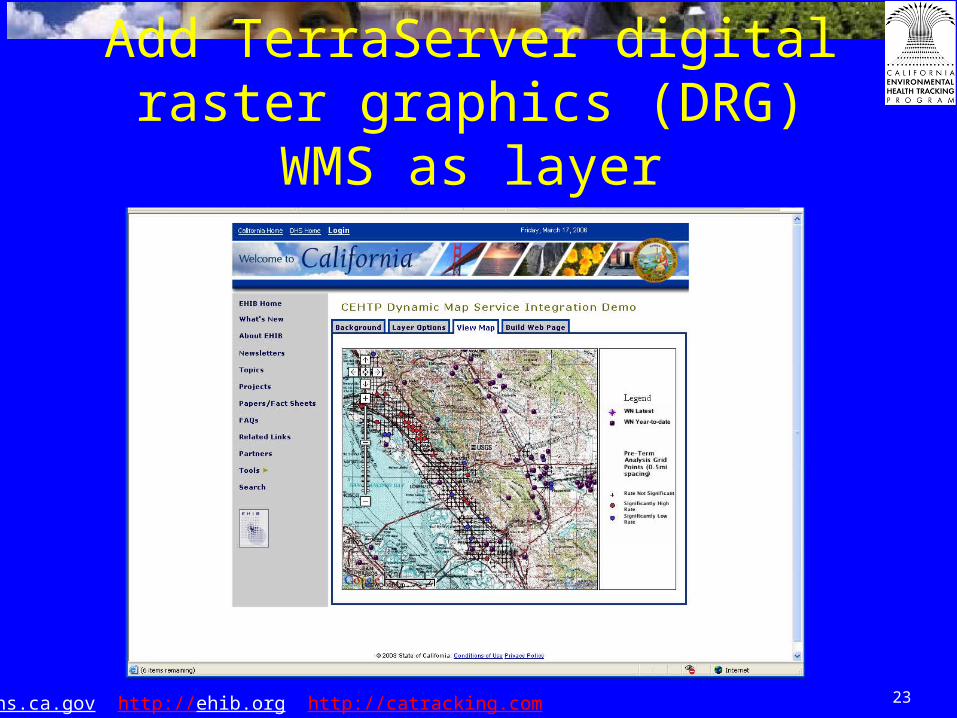
Add TerraServer digital raster graphics (DRG) WMS as layer
[email protected] http://ehib.org http://catracking.com
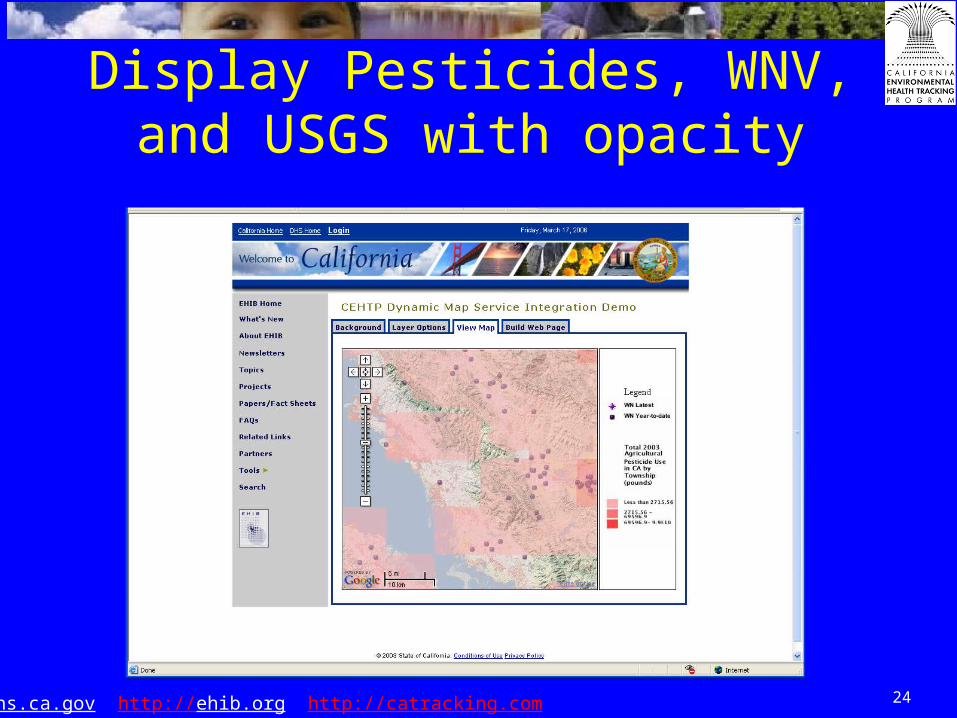
Display Pesticides, WNV, and USGS with opacity


