1
AstroParticleCosmology
OAR Roma
Soft X-ray emission in Large Scale Structures: thermal or non-thermal ?
Soft X-ray emission in Large Scale Structures: thermal or non-thermal ?
WHIM 2006WHIM 2006 Jan. 18, 2006
Sergio ColafrancescoSergio Colafrancesco INAF - Osservatorio Astronomico di RomaINAF - Osservatorio Astronomico di Roma INFN – Roma INFN – Roma Tor VergataTor Vergata EmailEmail: [email protected]

2
Formation of DM halos

3
Extended picture: DM+Hydro
Two-dimensional slice of (25h−1Mpc)2 around a complex including a cluster ofX-ray emission weighted temperature Tx ≈ 3.3 at z = 0. [Kang et al. 2003]
Mach number surface
4
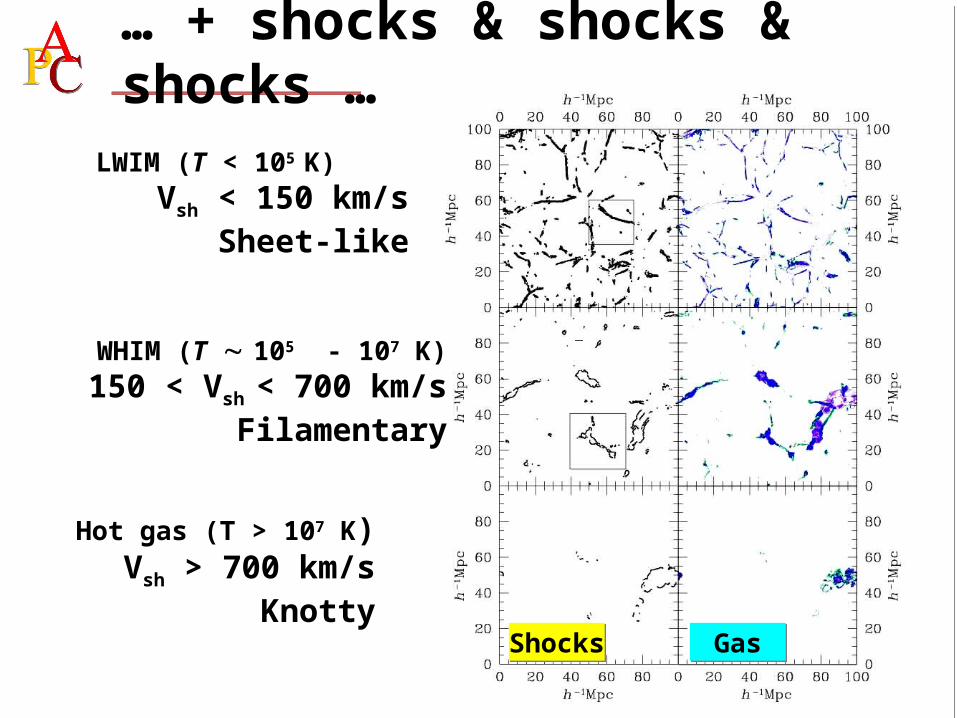
… + shocks & shocks & shocks …
LWIM (T < 105 K)Vsh < 150 km/s
Sheet-like
WHIM (T 105 - 107 K)150 < Vsh < 700 km/s
Filamentary
Hot gas (T > 107 K)Vsh > 700 km/s
KnottyShocksShocks GasGas

5
… + B field
Magnetic field
Baryon density
[Sigl et al. 2004]
6
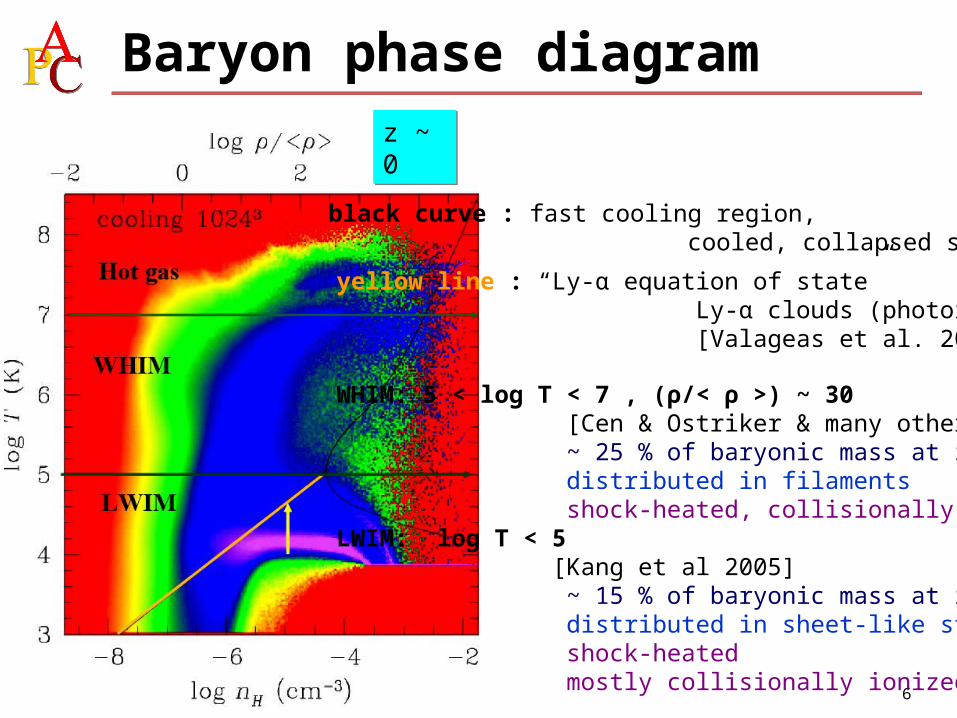
Baryon phase diagramz ~ 0z ~ 0
black curve : fast cooling region, cooled, collapsed structures
yellow line : “Ly-α equation of state” Ly-α clouds (photoionized) [Valageas et al. 2002]
WHIM: 5 < log T < 7 , (ρ/< ρ >) ~ 30 [Cen & Ostriker & many others] ~ 25 % of baryonic mass at z = 0 distributed in filaments shock-heated, collisionally ionizedLWIM: log T < 5 [Kang et al 2005] ~ 15 % of baryonic mass at z = 0 distributed in sheet-like structures shock-heated mostly collisionally ionized
7
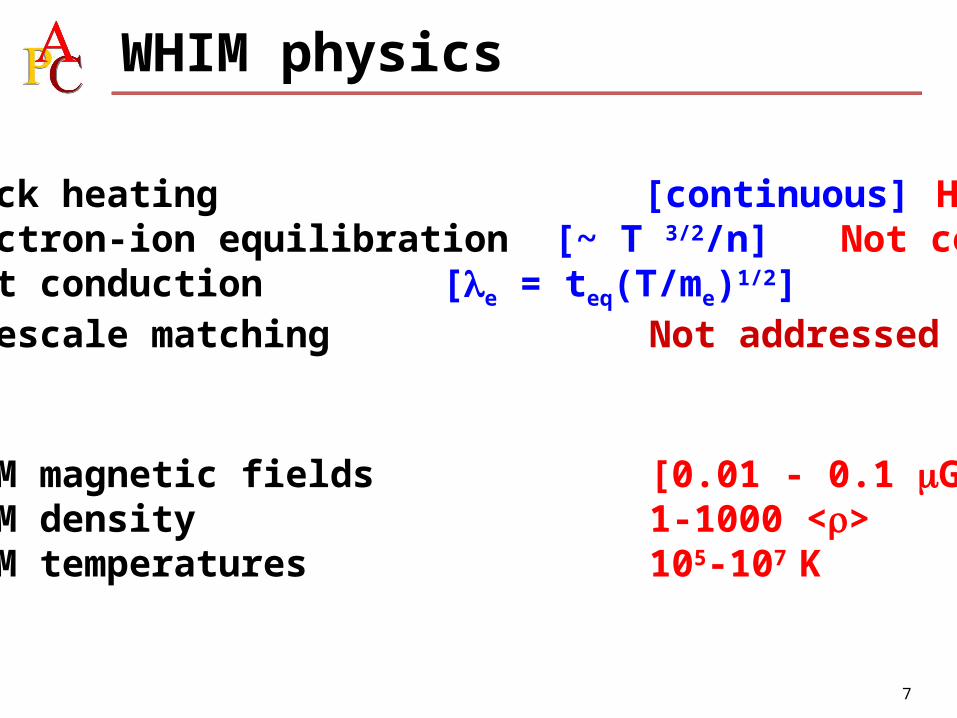
WHIM physics
• Shock heating [continuous] Heat WHIM• Electron-ion equilibration [~ T 3/2/n] Not complete• Heat conduction [e = teq(T/me)1/2]• Timescale matching Not addressed
• WHIM magnetic fields [0.01 - 0.1 G]• WHIM density 1-1000 <>• WHIM temperatures 105-107 K
8
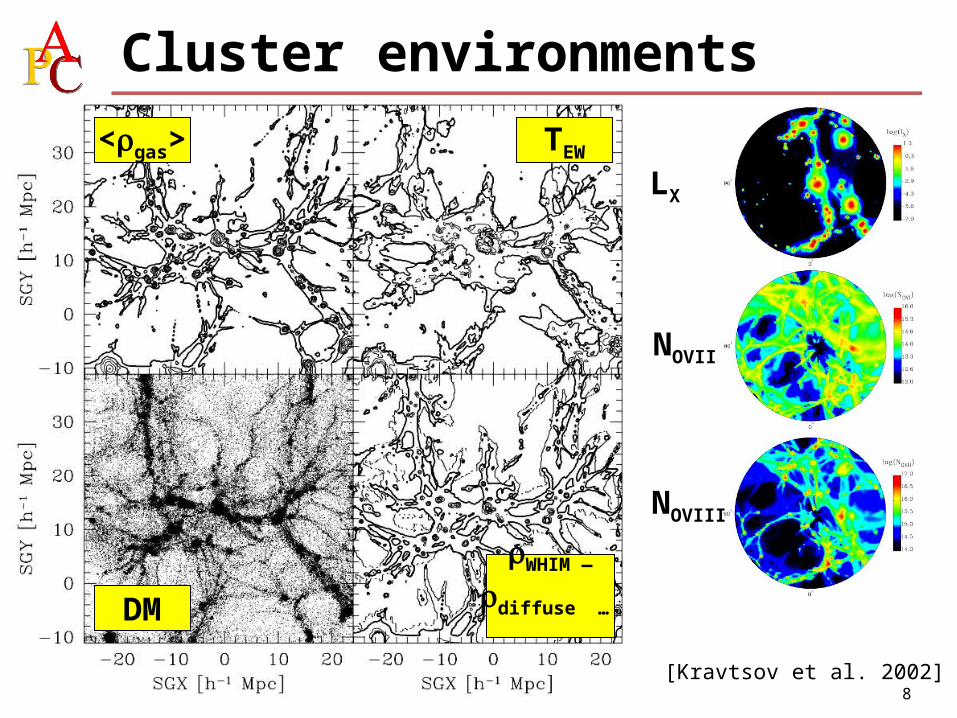
Cluster environments
DM
<gas> TEW
WHIM —
diffuse …
[Kravtsov et al. 2002]
LX
NOVII
NOVIII
9
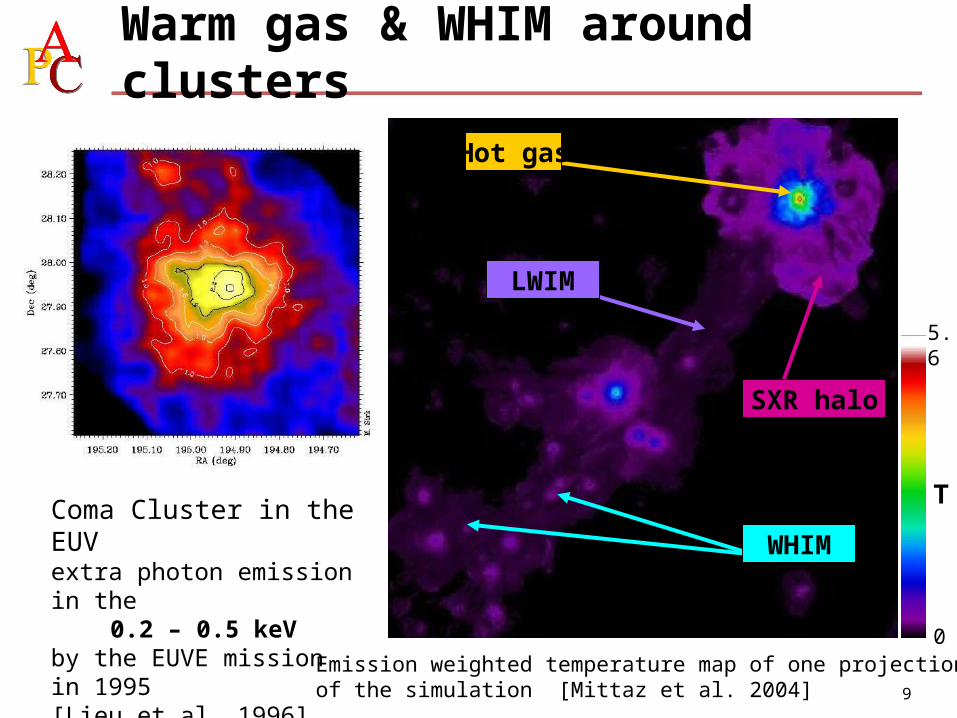
Warm gas & WHIM around clusters
Emission weighted temperature map of one projection of the simulation [Mittaz et al. 2004]
Coma Cluster in the EUVextra photon emission in the
0.2 – 0.5 keVby the EUVE mission in 1995[Lieu et al. 1996]
Hot gas
SXR halo
LWIM
WHIM
0
5.6
T

10
6’ – 9’ ROSAT and EUVE DS
Solid lines are the expected emission spectra of the hot ICM at:kT = 8.7 +/- 0.4 keV A = 0.3 solar
kT = 9.6 keVA = 0.22 solar
ROSAT PSPCEUVE
Coma: EUVE+ROSAT+XMMXMM-Newton 0’ - 5’
[Nevalainen et al., 2003, ApJ, 584, 716]
EPIC PN Spectrum
EPIC MOS1+MOS2 Spectra
11
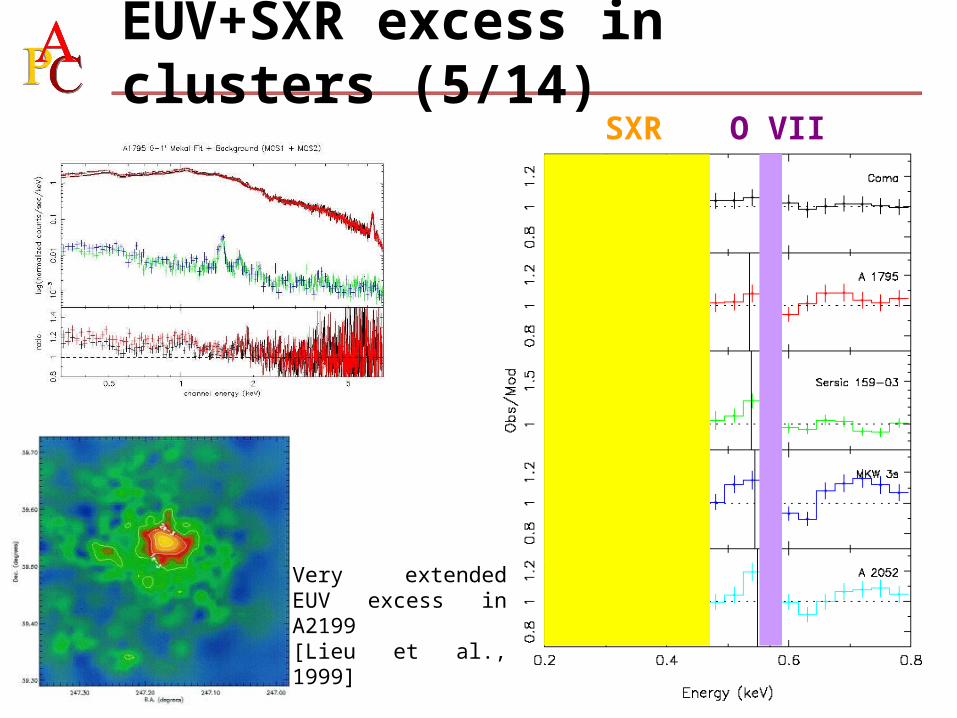
EUV+SXR excess in clusters (5/14)
Very extended EUV excess in A2199 [Lieu et al., 1999]
SXR O VII
12
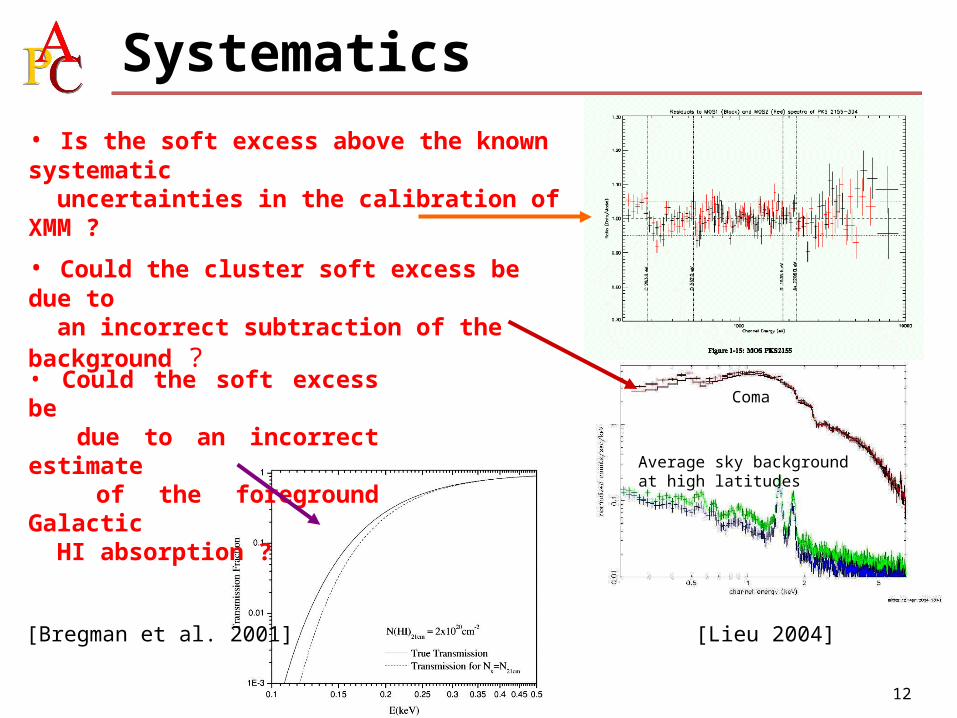
Average sky backgroundat high latitudes
Coma
Systematics
• Is the soft excess above the known systematic uncertainties in the calibration of XMM ?
• Could the soft excess be due to an incorrect estimate of the foreground Galactic HI absorption ?
• Could the cluster soft excess be due to an incorrect subtraction of the background ?
[Lieu 2004][Bregman et al. 2001]

13
• SXR spatially extended (out to 1-2 deg: XMM + PSPC)
• Increasing strength at larger radii (… except Coma)
• Extended SXR emission @ < 0.4 keV
• Weak or absent line emission
• OVII triplet at 0.56 keV (Cluster ref. frame ?)
Properties of the SXR emission
[Kaastra et al 2003]

14
AS1101 (2’-5’) with ICM model (fitted from 2-7 keV) and bkgs.
Intrinsic background
sky average background [Kaastra]
SXR EXCESS REMAINS ROBUST(after subtracting the higher background)
Isothermal modelkT = 3.08 keVA = 0.194 solar
Isothermal modelkT = 3.08 keVA = 0.194 solar
Fit to the OVII+OVIII complex with no constraint on the line energy
Redshifted OVII lines ?
Line consistent with zero redshift i.e. Galactic origin
[Lieu et al. 2004]
15
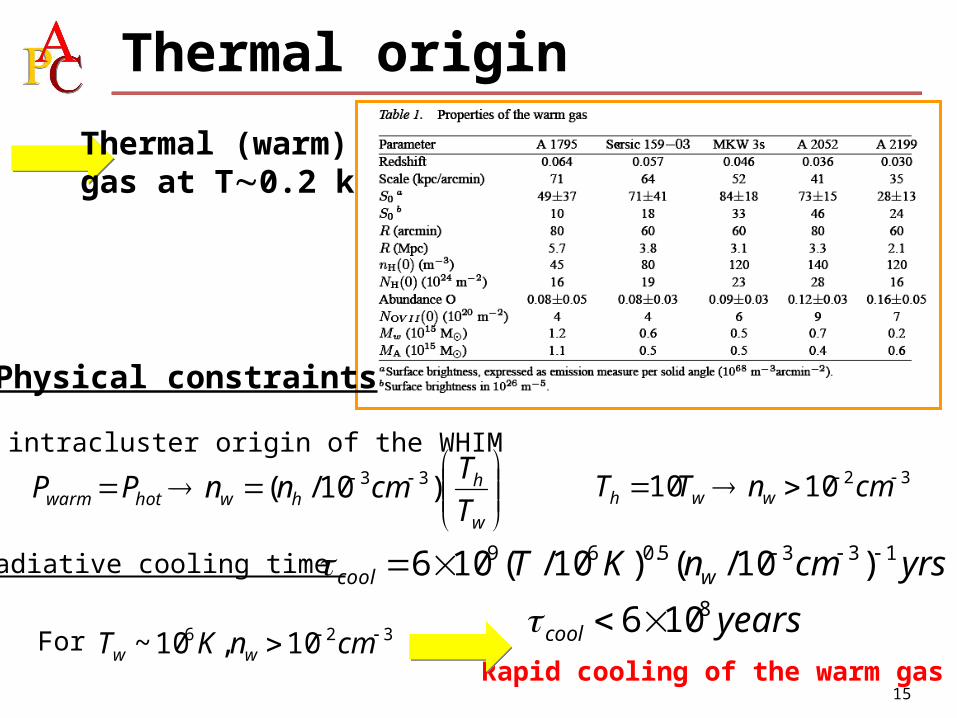
Thermal origin
Thermal (warm) gas at T0.2 keV
Physical constraints
For intracluster origin of the WHIM
w
hhwhotwarm T
TcmnnPP )10/( 33 321010 cmnTT wwh
Radiative cooling time yrscmnKT wcool1335.069 )10/()10/(106
For 326 10,10~ cmnKT ww
yearscool8106
Rapid cooling of the warm gas !

16
Supercluster mediumGiant ¼ keV Halo centered at Coma (as detailed by the ROSAT sky survey)
The warm gas here may be part of the WHIM, not in physical contact with the hot ICM (B confinement ?)
SXR halo around A1795Bootes Supercluster
[Kaastra et al. (2003)]

17
WHIM solves some problems with thermal soft excess model.
Cluster SXR shows characteristics of the WHIM near the nodes• Thermal emission with T ~ few 106 K • Increases in importance on the outskirts of clusters
SXR & cluster environment
18
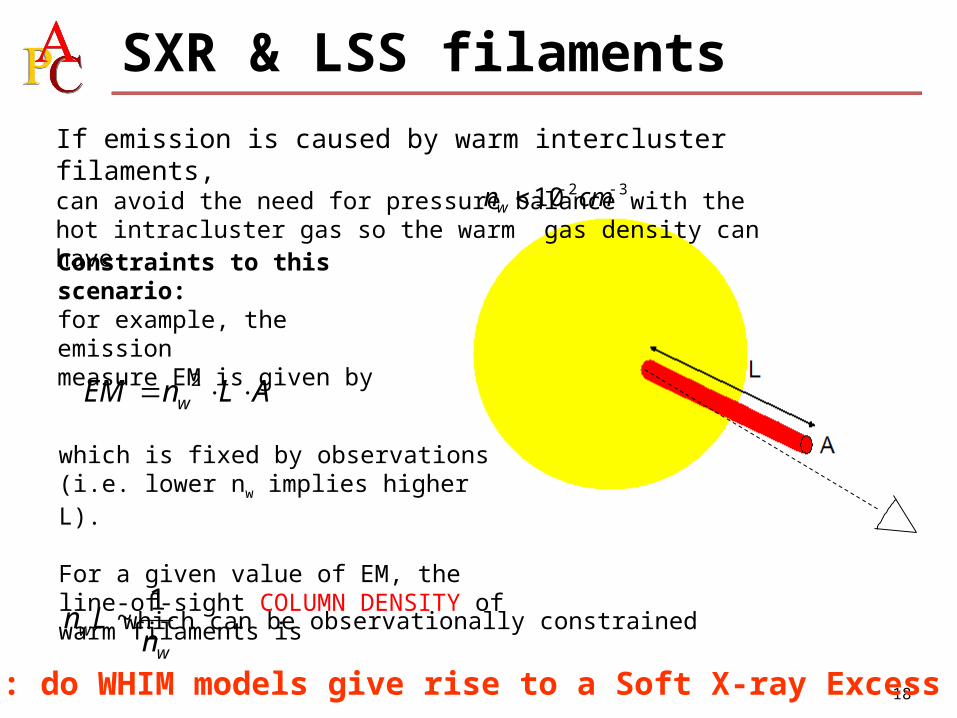
If emission is caused by warm intercluster filaments,can avoid the need for pressure balance with the hot intracluster gas so the warm gas density can have 3210 cmnw
ALnEM w 2
which is fixed by observations (i.e. lower nw implies higher L). For a given value of EM, the line-of-sight COLUMN DENSITY of warm filaments is
ww nLn
1~ which can be observationally constrained
Constraints to this scenario: for example, the emission measure EM is given by
…but: do WHIM models give rise to a Soft X-ray Excess ?
SXR & LSS filaments

19
Low-T IGM component is predicted to be very weak
[Mittaz et al. 2004]
Emission from cells < 1 keV
Factor of ~ 104
Maximum possible emission
SXR & WHIM models
Simulated
Observed
Hot component 8 x 1044 2 x 1044
Warm component
3 x 1040 3 x 1043
Luminosity comparison
20
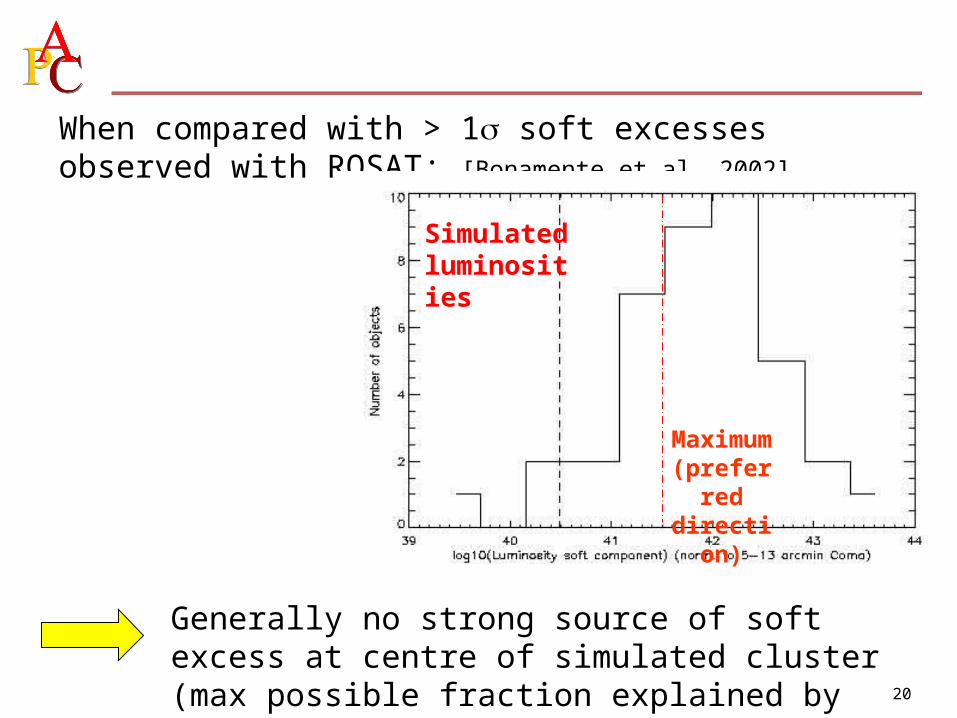
When compared with > 1 soft excesses observed with ROSAT: [Bonamente et al. 2002]
Simulated luminosities
Generally no strong source of soft excess at centre of simulated cluster (max possible fraction explained by model ~ 30%)
Maximum (preferred direction)
21
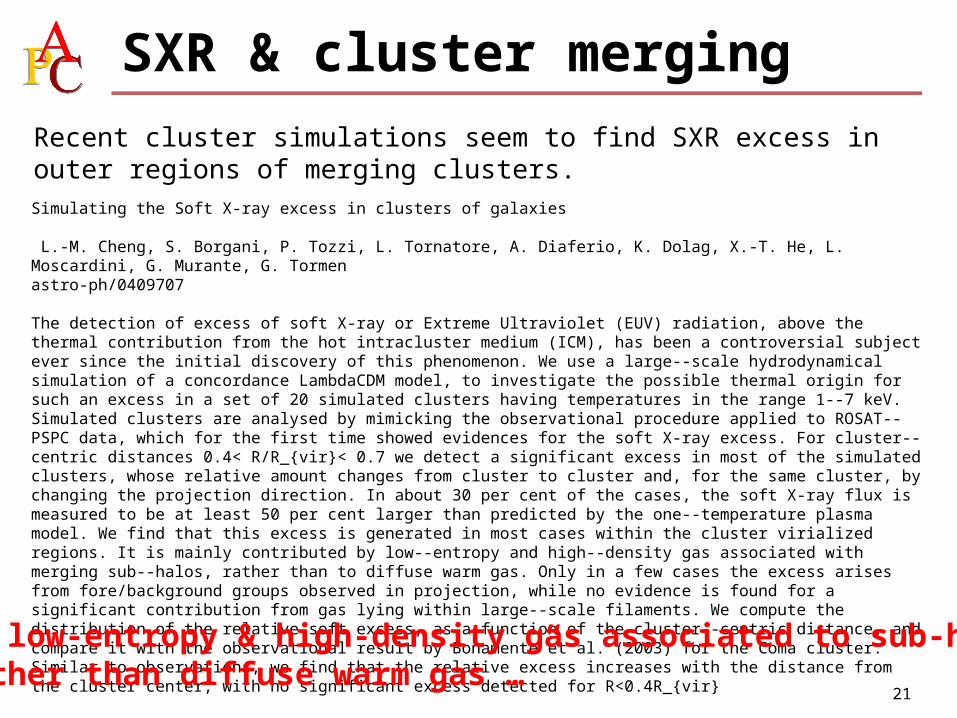
Simulating the Soft X-ray excess in clusters of galaxies
L.-M. Cheng, S. Borgani, P. Tozzi, L. Tornatore, A. Diaferio, K. Dolag, X.-T. He, L. Moscardini, G. Murante, G. Tormenastro-ph/0409707
The detection of excess of soft X-ray or Extreme Ultraviolet (EUV) radiation, above the thermal contribution from the hot intracluster medium (ICM), has been a controversial subject ever since the initial discovery of this phenomenon. We use a large--scale hydrodynamical simulation of a concordance LambdaCDM model, to investigate the possible thermal origin for such an excess in a set of 20 simulated clusters having temperatures in the range 1--7 keV. Simulated clusters are analysed by mimicking the observational procedure applied to ROSAT--PSPC data, which for the first time showed evidences for the soft X-ray excess. For cluster--centric distances 0.4< R/R_{vir}< 0.7 we detect a significant excess in most of the simulated clusters, whose relative amount changes from cluster to cluster and, for the same cluster, by changing the projection direction. In about 30 per cent of the cases, the soft X-ray flux is measured to be at least 50 per cent larger than predicted by the one--temperature plasma model. We find that this excess is generated in most cases within the cluster virialized regions. It is mainly contributed by low--entropy and high--density gas associated with merging sub--halos, rather than to diffuse warm gas. Only in a few cases the excess arises from fore/background groups observed in projection, while no evidence is found for a significant contribution from gas lying within large--scale filaments. We compute the distribution of the relative soft excess, as a function of the cluster--centric distance, and compare it with the observational result by Bonamente et al. (2003) for the Coma cluster. Similar to observations, we find that the relative excess increases with the distance from the cluster center, with no significant excess detected for R<0.4R_{vir}
Recent cluster simulations seem to find SXR excess in outer regions of merging clusters.
SXR & cluster merging
“… low-entropy & high-density gas associated to sub-halosrather than diffuse warm gas …”

• Minimum required warm gas column density is contradicted by absorption line measurements of quasar spectra
• OVII emission lines found on top of the soft excess spectra at the outskirts of some clusters could be NOT real (associated to Galactic emission)
Thermal origin troubles
• Outer soft excess NOT associated with the WHIM
• if the origin is outlying filaments seen in projection required column density will be enormous• if intracluster warm gas problem with cooling time
Outside a cluster’s coreOutside a cluster’s core
Inside a cluster’s coreInside a cluster’s core

23
Non-thermal originComa XMM-Newton MOS1+2 and PN fits to 0’-5’ region
Single temperature Single temperature + Power-law
Assuming a power-law soft excess in Coma dramatically improves the fit !
Coma MKW3s A2052 A2199 A1795 Sersic 159-03
A3112
SXR Strong Weak Weak Weak Strong Strong Strong
Lines No ? ? ? ? ? ?
HXR Yes No No Yes Yes No No

24
SXR vs HXR in clusters
ICS of CMB photons by intracluster cosmic rays (relativistic e± with E 100-300 MeV)
Radio EUV HXR
Coma
Require cosmic rays (with E > 300 MeV)in clusters atmospheres

25
Indications
SXR HXR Cooling flow
Coma Yes Yes No
A1795 Yes Yes Quenched
Sersic 159-03
Yes ? Quenched
A3112 Yes ? Quenched
[Feretti 2003]
[Fusco-Femiano et al. 2004]
[Colafrancesco et al. 2004]

26
CRs in clusters
p
p
Primary e±
• Direct acceleration (shocks)• Injection (AGNs)• Re-acceleration
Primary e±
• Direct acceleration (shocks)• Injection (AGNs)• Re-acceleration
Secondary e±
• Hadronic collisions• DM annihilation
Secondary e±
• Hadronic collisions• DM annihilation
27
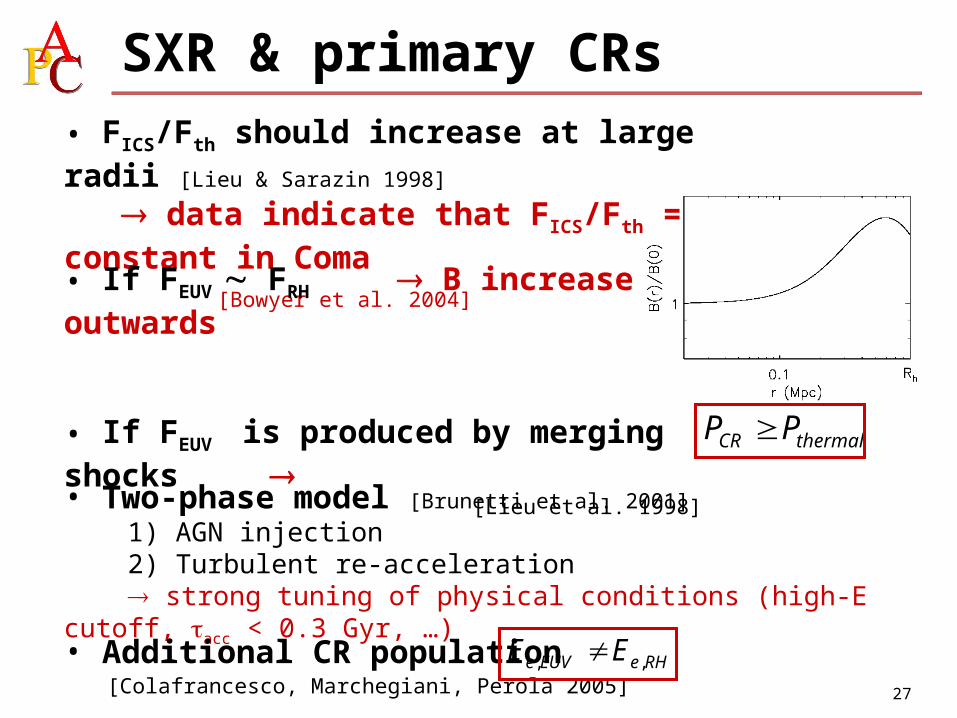
SXR & primary CRs• FICS/Fth should increase at large radii [Lieu & Sarazin 1998] data indicate that FICS/Fth = constant in Coma [Bowyer et al. 2004]
• If FEUV FRH B increase outwards
• If FEUV is produced by merging shocks [Lieu et al. 1998]
thermalCR PP
• Two-phase model [Brunetti et al. 2001]
1) AGN injection 2) Turbulent re-acceleration strong tuning of physical conditions (high-E cutoff, acc < 0.3 Gyr, …)
• Additional CR population [Colafrancesco, Marchegiani, Perola 2005]
RHeEUVe EE ,,

28
SXR & Hadronic collisions
• FEUV-SXR due to secondary electrons produced in hadronic (pp) collisions [Bowyer et al. 2004]
thermalCR PP 19
EGRETGeV FscmF
127101.0 103.5
[Marchegiani, Perola, Colafrancesco 2006][Marchegiani 2005, PhD Thesis]
Fit EUV brightness
eXXpp
0Xpp

29
SXR & Dark Matter
eXX 0X
• FEUV-SXR due to secondary electrons produced in DM annihilation [Colafrancesco et al. 2005]

30
SXR & Dark Matter
eXX 0X
• FEUV-SXR due to secondary electrons produced in DM annihilation [Colafrancesco et al. 2005]

31
XMM-Newton observations of Clusters in the 0.4-7 keV range confirm ‘beyond reasonable doubt’ [Lieu 2004] the existence of a soft excess first noticed by the EUVE and ROSAT teams.
• is strong and in XMM extends to E=1-2 keV, at a level beyond the uncertainties of the detector responses• is seen in regions where the cluster low energy flux is 10-100 times above background• cannot be explained as a Galactic absorption anomaly
•The thermal interpretation in terms of missing warm baryonic filaments of the IGM suffers from a large discrepancy in col.dens.• Recent cosmological simulation reproduced the SXR by high-density, low-S gas clumps associated to merging process.• At the outskirts of clusters, the OVII detection claimed by Kaastra, Lieu et al. (2003) is a questionable result (at least for now).
• Non-thermal models require very high cosmic ray pressure/density .
Cluster SXR: the status
32
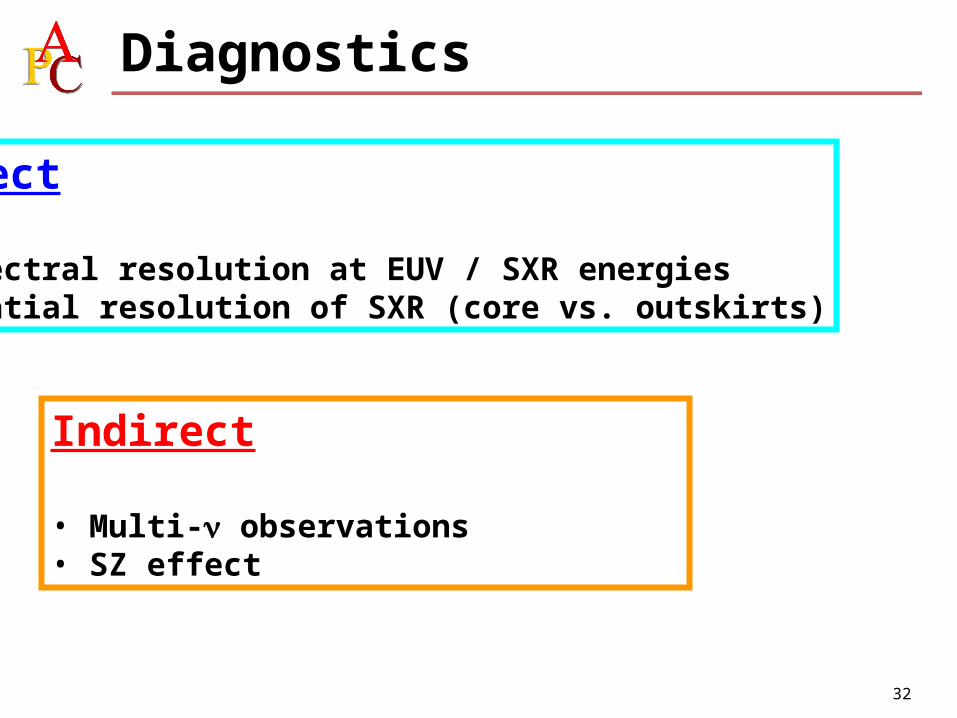
Diagnostics
Direct
• Spectral resolution at EUV / SXR energies• Spatial resolution of SXR (core vs. outskirts)
Indirect
• Multi- observations• SZ effect
33
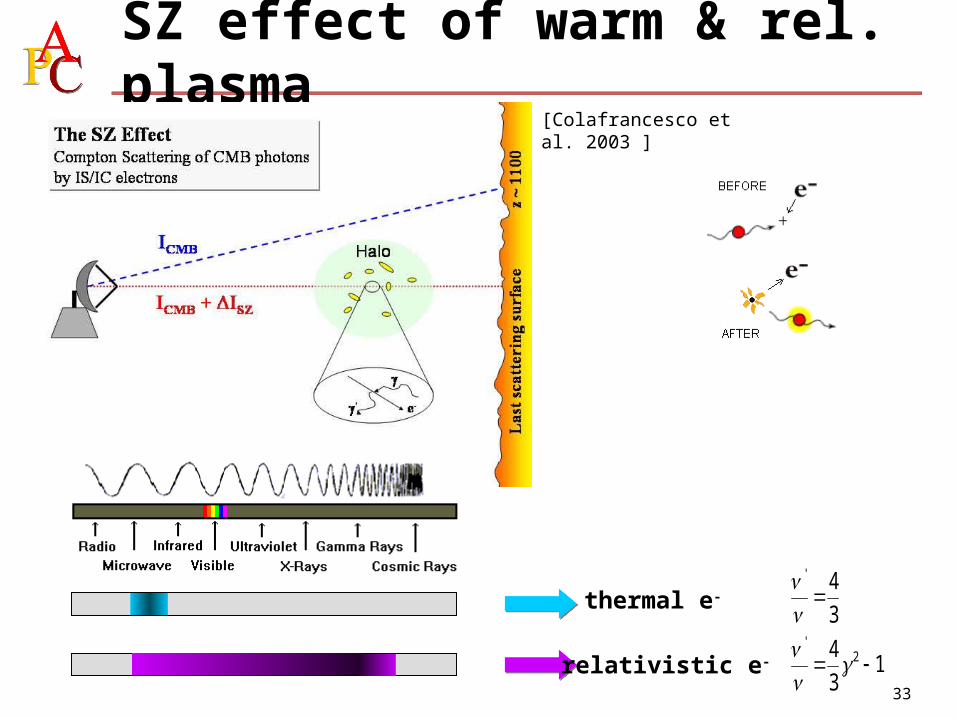
SZ effect of warm & rel. plasma
thermal e-
relativistic e- 13
4 2'
3
4'
[Colafrancesco et al. 2003 ]

34
Intensity changeIntensity change
Spectral shapeSpectral shape
Thermal
Relativistic
SZE: general derivation
0
);()()( psPpdpfsP seRedistribution functionRedistribution function
PressurePressure
[Colafrancesco & al. 2003, A&A, 397, 27]

35
The e- distributions in Coma
50 GeV = M
100 GeV200 GeV500 GeV
T=0.1 keVT=0.1 keVT=8.2 keVT=8.2 keV
Radio-halo electronsRadio-halo electrons
36
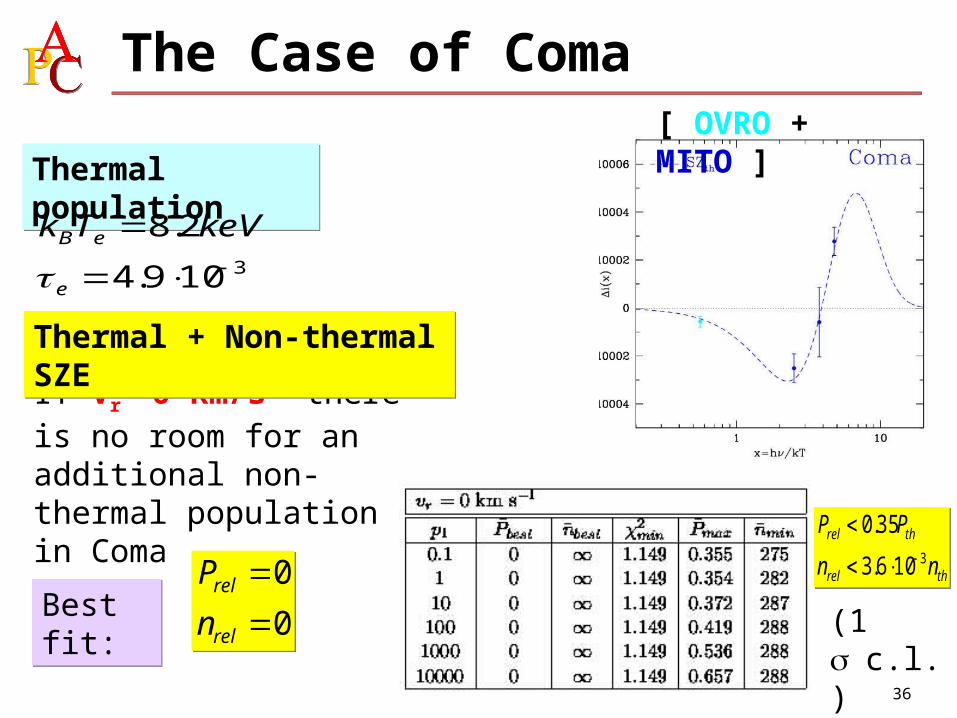
If Vr =0 km/s there is no room for an additional non-thermal population in Coma
(1 c.l.)
threl
threl
nn
PP3106.3
35.0
threl
threl
nn
PP3106.3
35.0
Best fit:Best fit:0
0
rel
rel
n
P
0
0
rel
rel
n
P
Plot 0
Thermal + Non-thermal SZEThermal + Non-thermal SZE
[ OVRO + MITO ]
Thermal populationThermal population
3109.4
2.8
e
eB keVTk
The Case of Coma
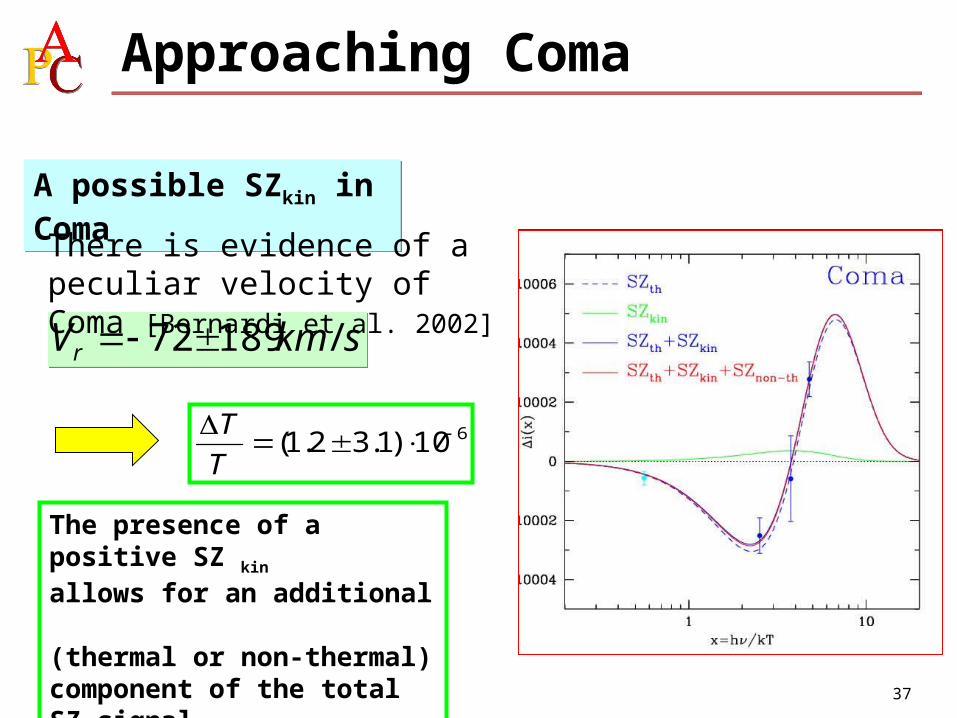
37
A possible SZkin in ComaA possible SZkin in Coma
skmVr /18972 skmVr /18972
610)1.32.1( T
T
There is evidence of a peculiar velocity of Coma [Bernardi et al. 2002]
The presence of a positive SZ kin
allows for an additional (thermal or non-thermal) component of the total SZ signal
Approaching Coma

38
Best fit:Best fit:
threlthrel nnPP 4105.707.0 threlthrel nnPP 4105.707.0
b.f.
Including a non-thermal population in Coma improves the fitIncluding a non-thermal population in Coma improves the fit
Thermal + non-thermal SZE

39
b.f.
Hot (T ~ 8.2 keV)+
Warm (T ~ 0.1 keV)Thermal SZE improves the fit
Hot (T ~ 8.2 keV)+
Warm (T ~ 0.1 keV)Thermal SZE improves the fit
A warm component in Coma
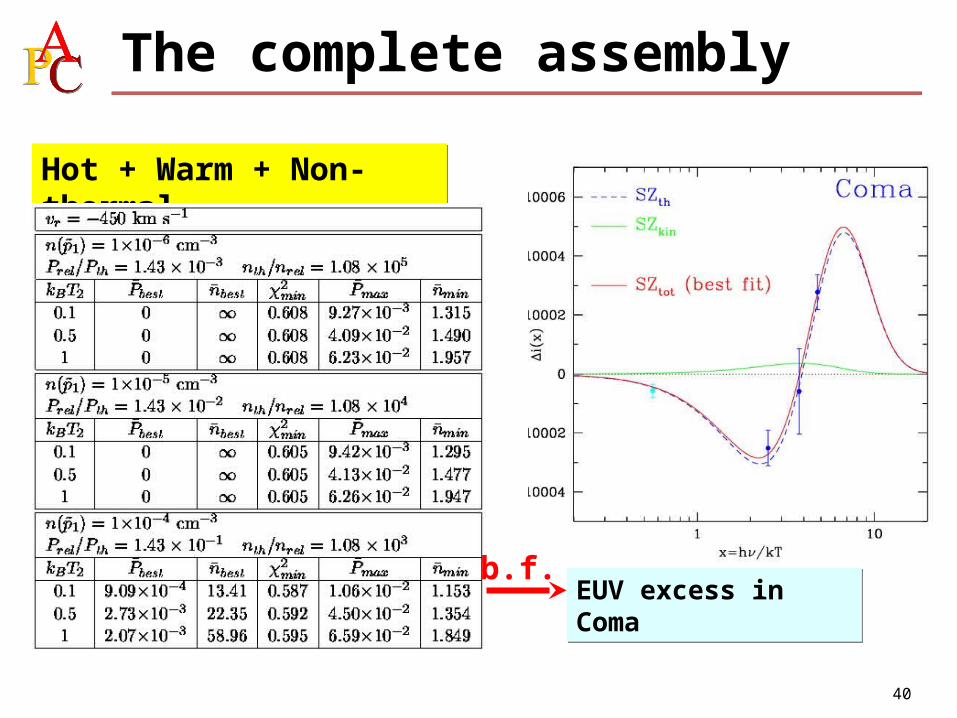
40
Hot + Warm + Non-thermal Hot + Warm + Non-thermal
EUV excess in ComaEUV excess in Comab.f.
The complete assembly
41
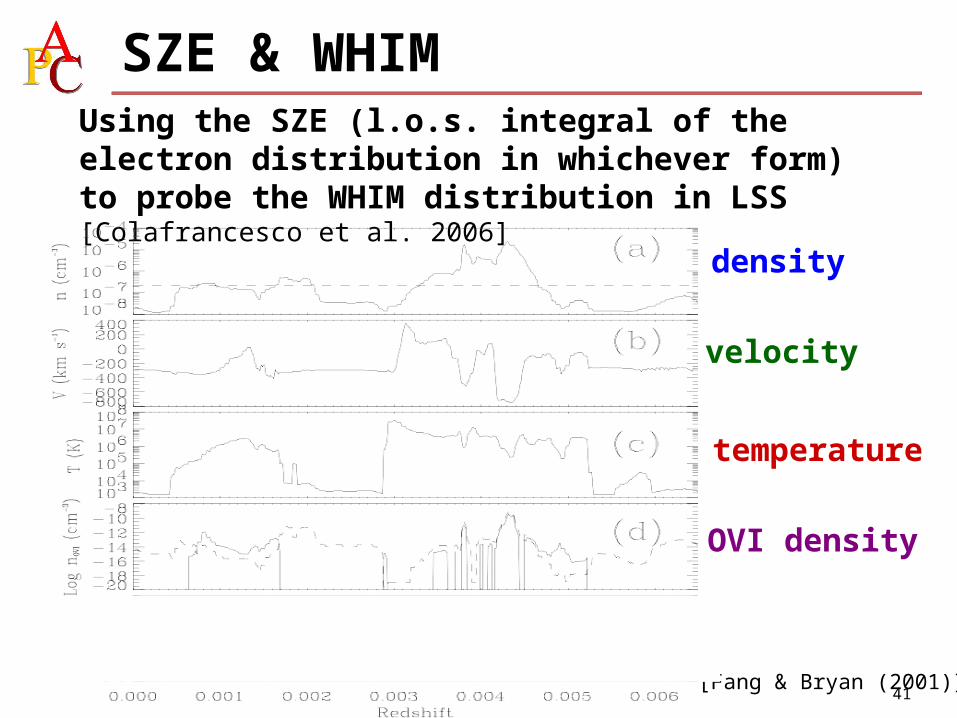
SZE & WHIMUsing the SZE (l.o.s. integral of the electron distribution in whichever form) to probe the WHIM distribution in LSS [Colafrancesco et al. 2006]
density
velocity
temperature
OVI density
[Fang & Bryan (2001)]

42
THANKS
for your attention !

43
Simulation of WHIM material. Weak signal in 105 seconds

44
Just not enough low temperature material:
Total column density Column density < 1keVColumn density of low temperature components is much less than that of the hot component at the cluster
1 Mpc
45
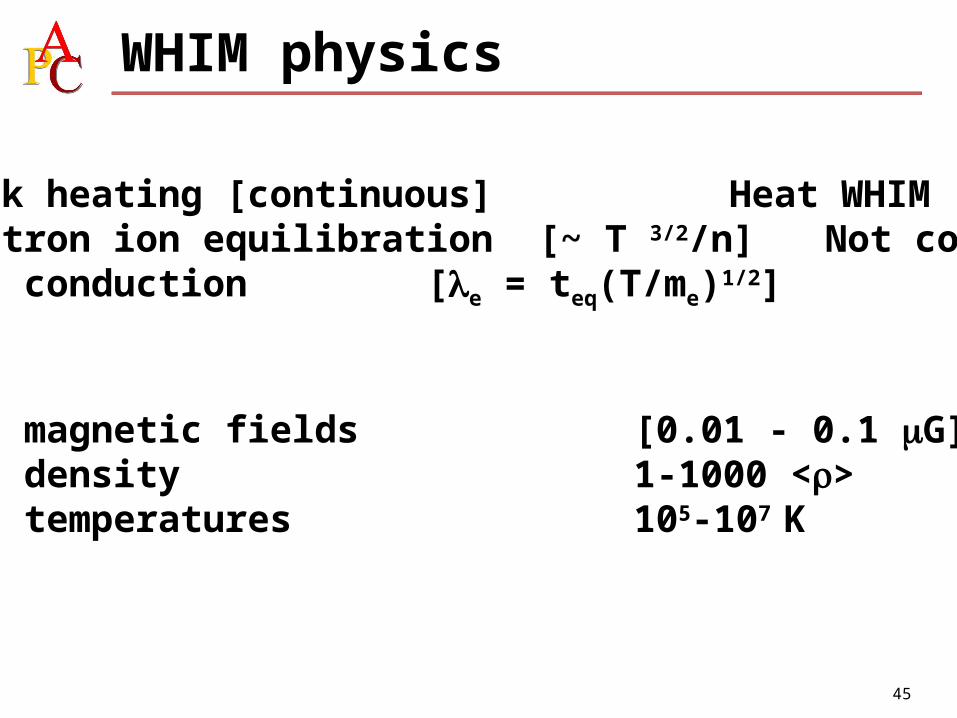
WHIM physics
• Shock heating [continuous] Heat WHIM• Electron ion equilibration [~ T 3/2/n] Not complete• Heat conduction [e = teq(T/me)1/2]
• WHIM magnetic fields [0.01 - 0.1 G]• WHIM density 1-1000 <>• WHIM temperatures 105-107 K

46
Shock heating

47
Equilibration
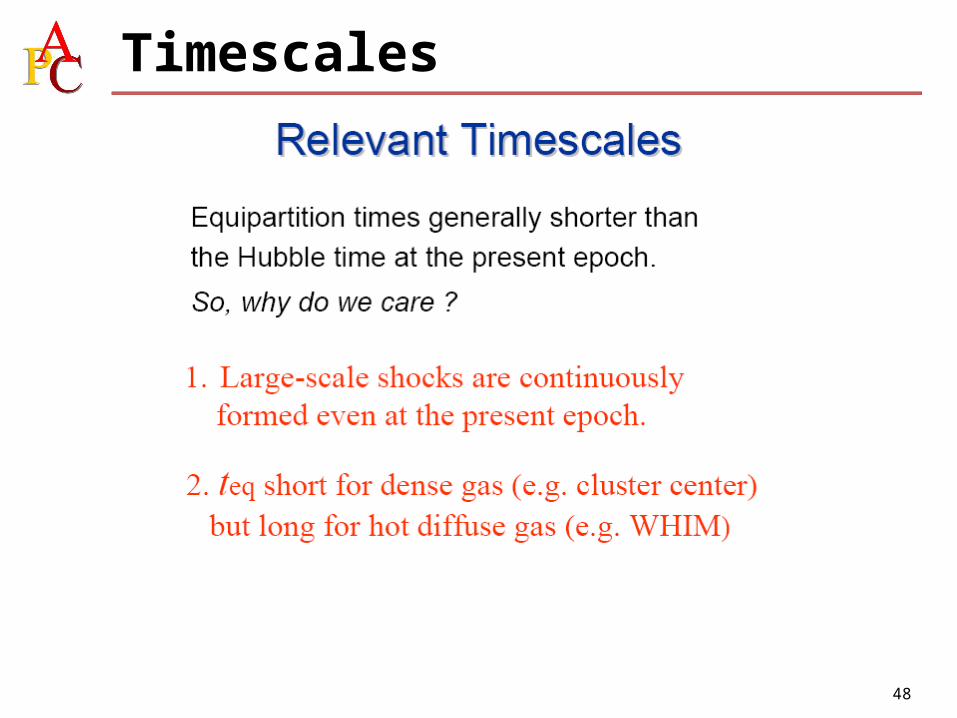
48
Timescales
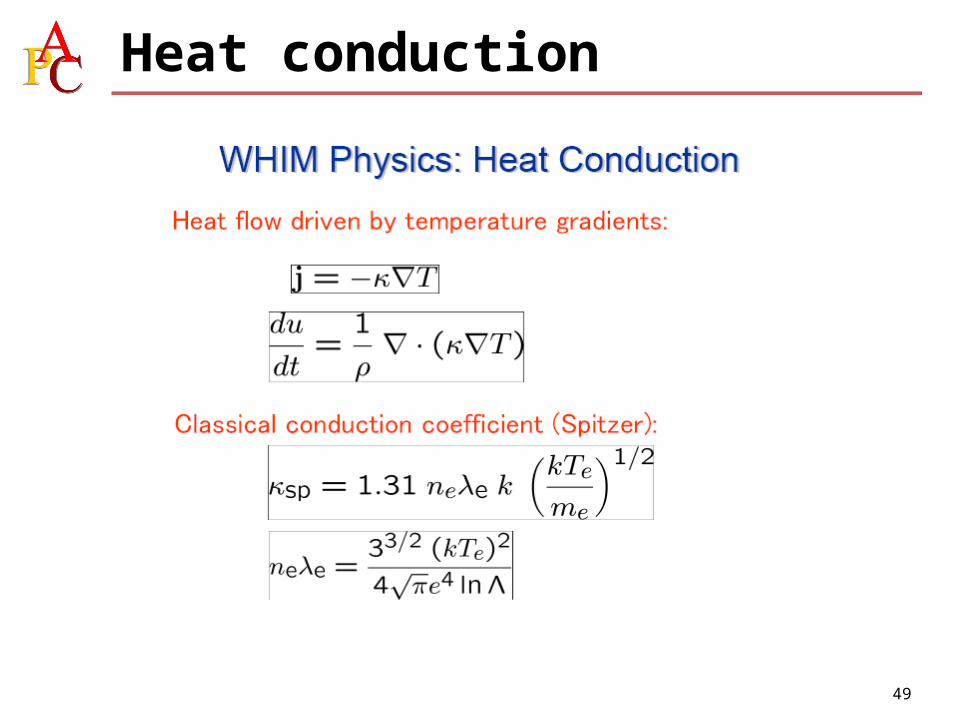
49
Heat conduction
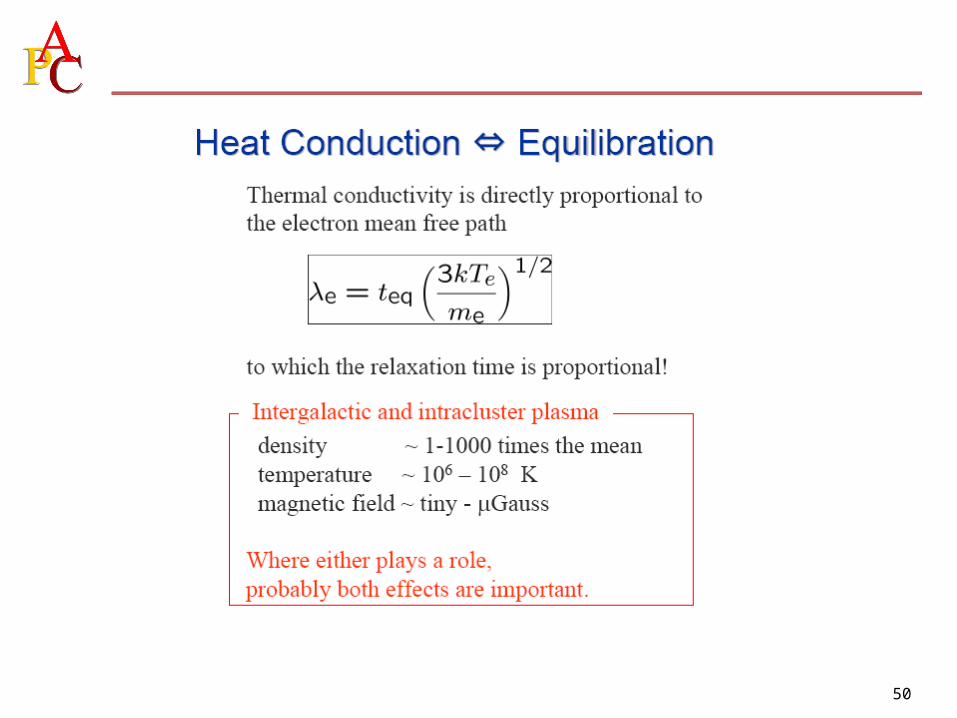
50

51
Magnetic field role


![X-ray emission from very high energy gamma-ray sources [Horns]](https://cdn.vdocuments.us/doc/165x107/55986aa61a28ab2e0b8b468a/x-ray-emission-from-very-high-energy-gamma-ray-sources-horns.jpg)


