1-1
Corporate Valuation: A Guide for Brokers, Managers and
Investors
Dr. Mounther Barakat Al Omari
Securities and Commodities AuthorityAbu Dhabi - UAE
December - 2006
1-2
تحليل الشركات وتسعير االسهمدليل للوسطاء والمدراء
والمستثمرين
د. منذر بركات العمري
هيئة االوراق المالية والسلع – ابو ظبيدولة االمارات العربية المتحدة
2006

1-3
Introductionمقدمة
The following is an important introduction for stock analysts and
evaluators.This introduction is intended to provide stock analysts with the tools they need
to carryout their analysis.فيما يلي مقدمة هامة للمحللين الماليين ولمسعري
الشركاتتحوي هذه المقدمة على ادوات هامة ال يستطيع
المحلل المالي ان يقوم بوظيفته بدونها
1-4
Financial Goals of the Corporationالشركة هدف
The primary financial goal is shareholder wealth maximization, which translates to maximizing stock price. Do firms have any responsibilities to
society at large? Is stock price maximization good or
bad for society? Should firms behave ethically?

1-5
Is stock price maximization the same as profit maximization?االرباح؟ تعظيم هو المساهمين ثروة تعظيم يعتبر هل
No, despite a generally high correlation amongst stock price, EPS, and cash flow.
Current stock price relies upon current earnings, as well as future earnings and cash flow.
Some actions may cause an increase in earnings, yet cause the stock price to decrease (and vice versa).
1-6
Factors that affect stock priceالسهم بسعر تؤثر التي العوامل
Projected cash flows to shareholders
Timing of the cash flow stream
Riskiness of the cash flows
1-7
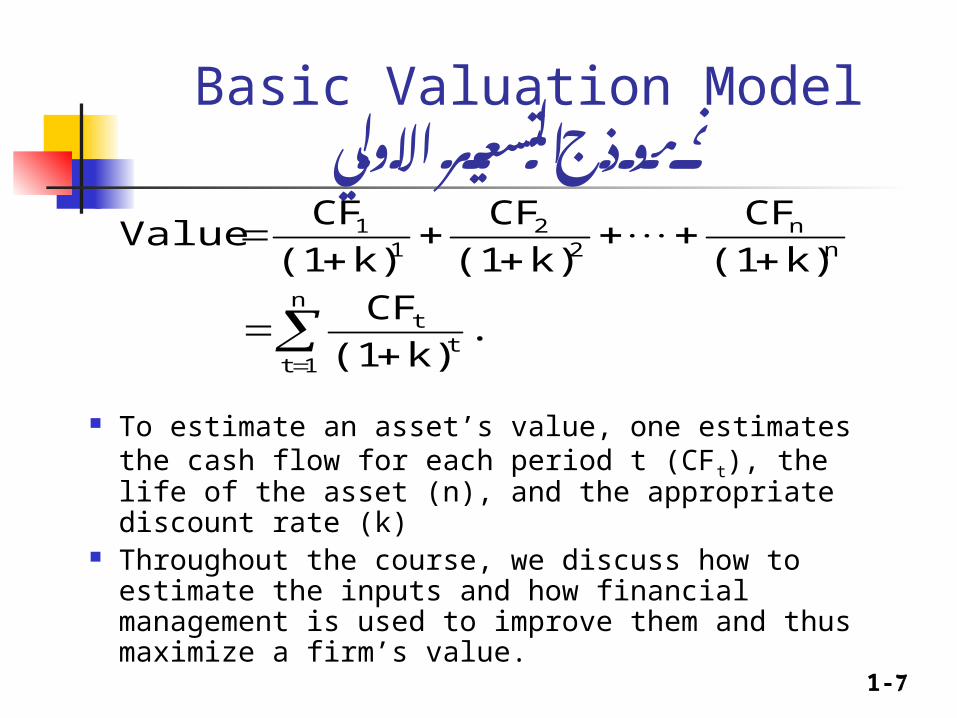
Basic Valuation Modelاالولي التسعير نموذج
To estimate an asset’s value, one estimates the cash flow for each period t (CFt), the life of the asset (n), and the appropriate discount rate (k)
Throughout the course, we discuss how to estimate the inputs and how financial management is used to improve them and thus maximize a firm’s value.
n
1tt
t
nn
22
11
.k)(1
CF
k)(1CF
k)(1CF
k)(1CF
Value
1-8
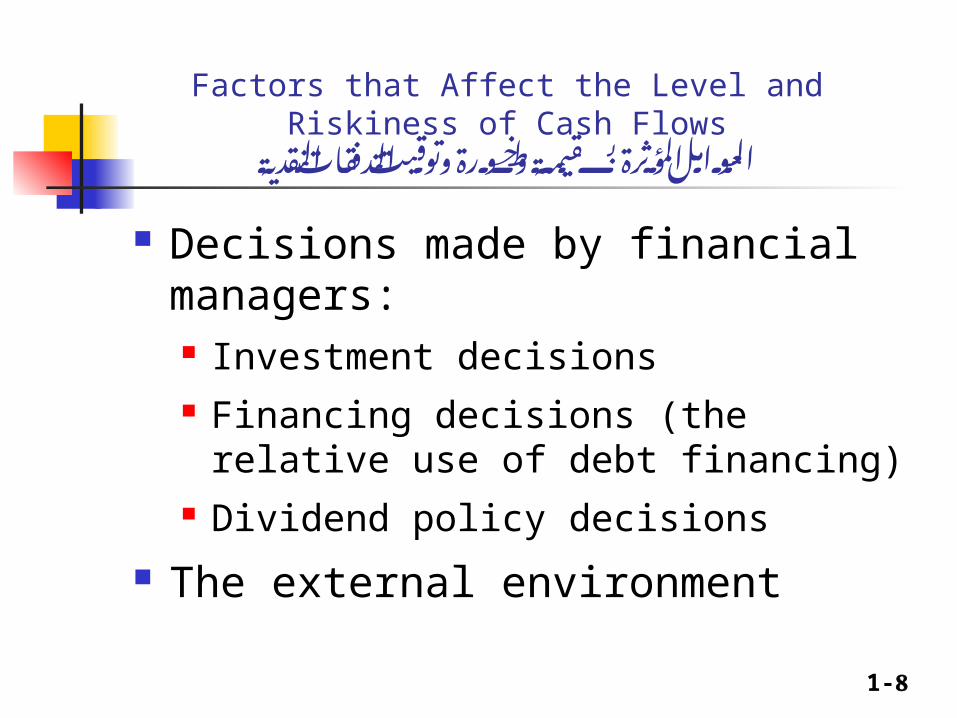
Factors that Affect the Level and Riskiness of Cash Flowsالنقدية التدفقات وتوقيت وخطورة بقيمة المؤثرة العوامل
Decisions made by financial managers: Investment decisions Financing decisions (the relative use of debt
financing) Dividend policy decisions
The external environment
1-9
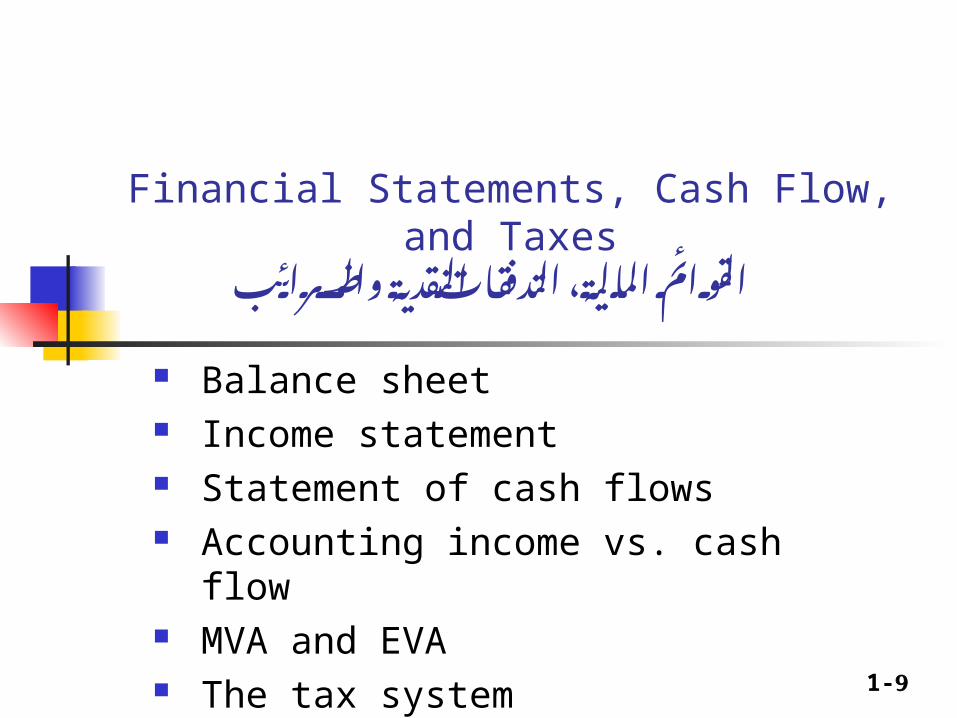
Financial Statements, Cash Flow, and Taxesوالضرائب النقدية التدفقات المالية، القوائم
Balance sheet Income statement Statement of cash flows Accounting income vs. cash flow MVA and EVA The tax system
1-10
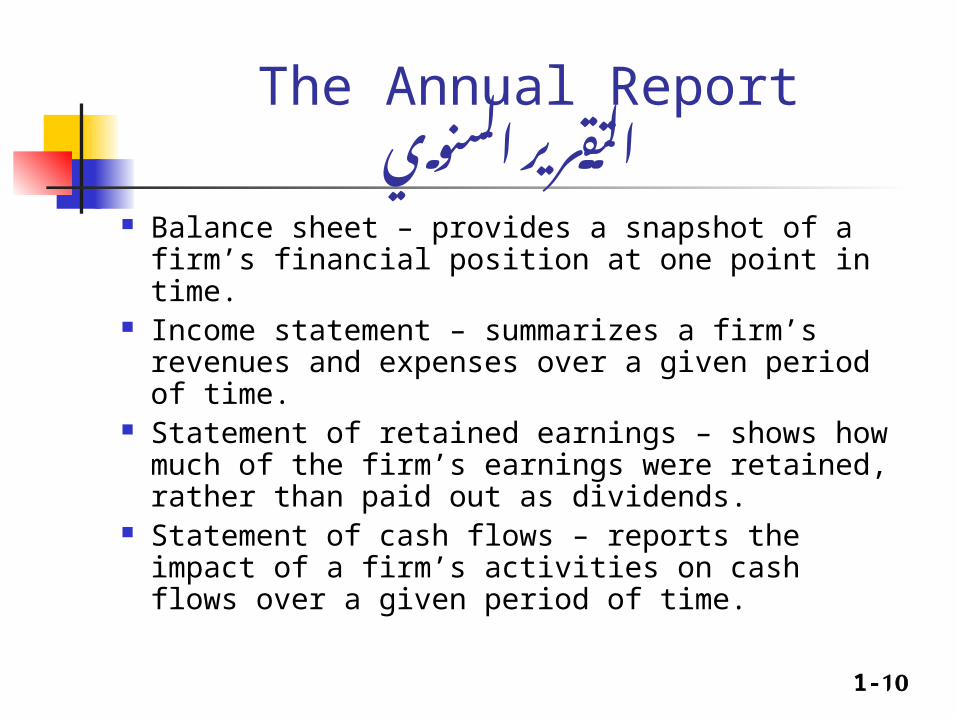
The Annual Reportالسنوي التقرير
Balance sheet – provides a snapshot of a firm’s financial position at one point in time.
Income statement – summarizes a firm’s revenues and expenses over a given period of time.
Statement of retained earnings – shows how much of the firm’s earnings were retained, rather than paid out as dividends.
Statement of cash flows – reports the impact of a firm’s activities on cash flows over a given period of time.
1-11
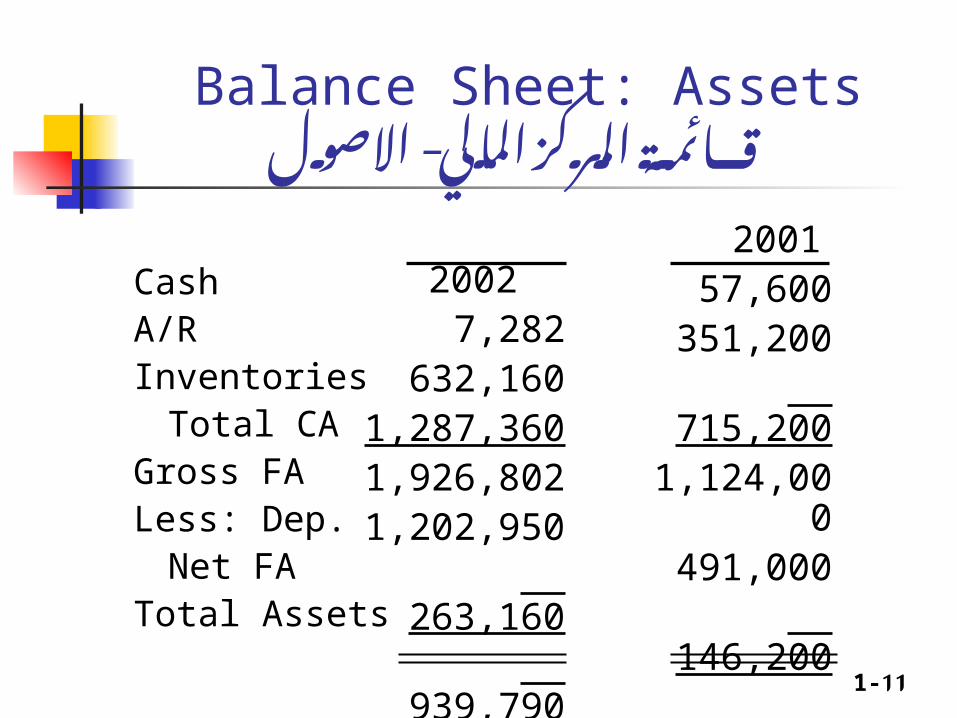
Balance Sheet: Assetsاالصول - المالي المركز قائمة
CashA/RInventories
Total CAGross FALess: Dep.
Net FATotal Assets
20027,282
632,1601,287,3601,926,8021,202,950 263,160 939,7902,866,592
200157,600
351,200 715,2001,124,000
491,000 146,200 344,8001,468,800

1-12
Balance sheet: Liabilities and Equityالملكية – وحقوق الخصوم المالي المركز قائمة
Accts payableNotes payableAccruals
Total CLLong-term debtCommon stockRetained earnings
Total EquityTotal L & E
2002524,160
636,808 489,6001,650,568
723,432460,000
32,592 492,5922,866,592
2001145,600200,000
136,000481,600323,432460,000
203,768 663,7681,468,800

1-13
Income statementالدخل قائمة
SalesCOGSOther expenses
EBITDADepr. & Amort.
EBITInterest Exp.EBTTaxesNet income
20026,034,000
5,528,000 519,988
(13,988) 116,960(130,948) 136,012(266,960) (106,784) (160,176)
20013,432,0002,864,000 358,672
209,328 18,900
190,428 43,828
146,600 58,640
87,960

1-14
Other dataأخرى معلومات
No. of sharesEPSDPSStock price
2002100,000-$1.602
$0.11$2.25
2001100,000
$0.88$0.22$8.50
1-15
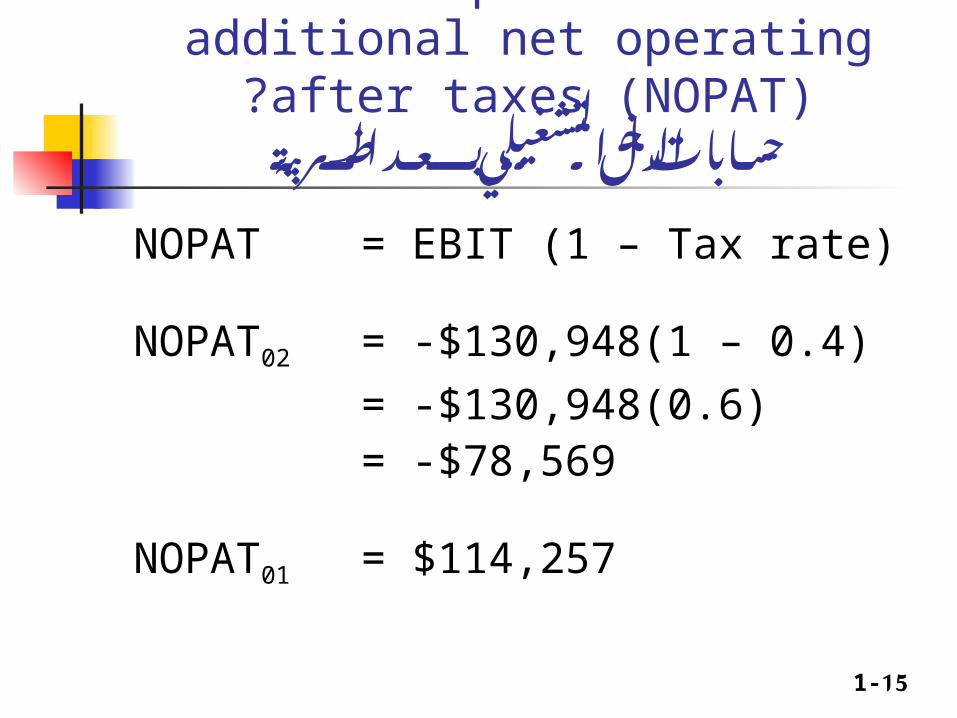
Did the expansion create additional net operating after taxes (NOPAT)?
الضريبة بعد التشغيلي الدخل حسابات
NOPAT = EBIT (1 – Tax rate)
NOPAT02 = -$130,948(1 – 0.4)
= -$130,948(0.6)= -$78,569
NOPAT01 = $114,257

1-16
What effect did the expansion have on net operating working capital?
العمل المال رأس صافي حسابات
NOWC = Current - Non-interest
assets bearing CL
NOWC02 = ($7,282 + $632,160 + $1,287,360) – ( $524,160 + $489,600)
= $913,042
NOWC01 = $842,400
1-17
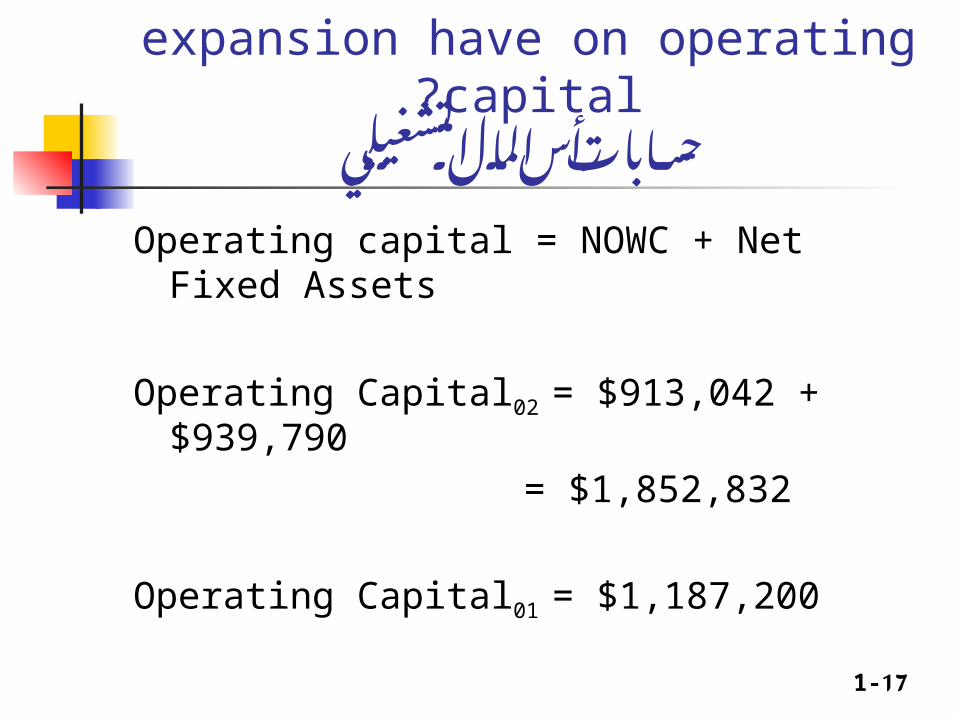
What effect did the expansion have on operating capital?
التشغيلي المال رأس حسابات
Operating capital = NOWC + Net Fixed Assets
Operating Capital02 = $913,042 + $939,790
= $1,852,832
Operating Capital01 = $1,187,200

1-18
What is your assessment of the expansion’s effect on operations?
التشغيل حسابات من مالحظات
Sales
NOPAT
NOWC
Operating capital
Net Income
2002 $6,034,000
-$78,569$913,042
$1,852,832-$160,176
2001 $3,432,00
0$114,257$842,400$1,187,20
0$87,960
1-19
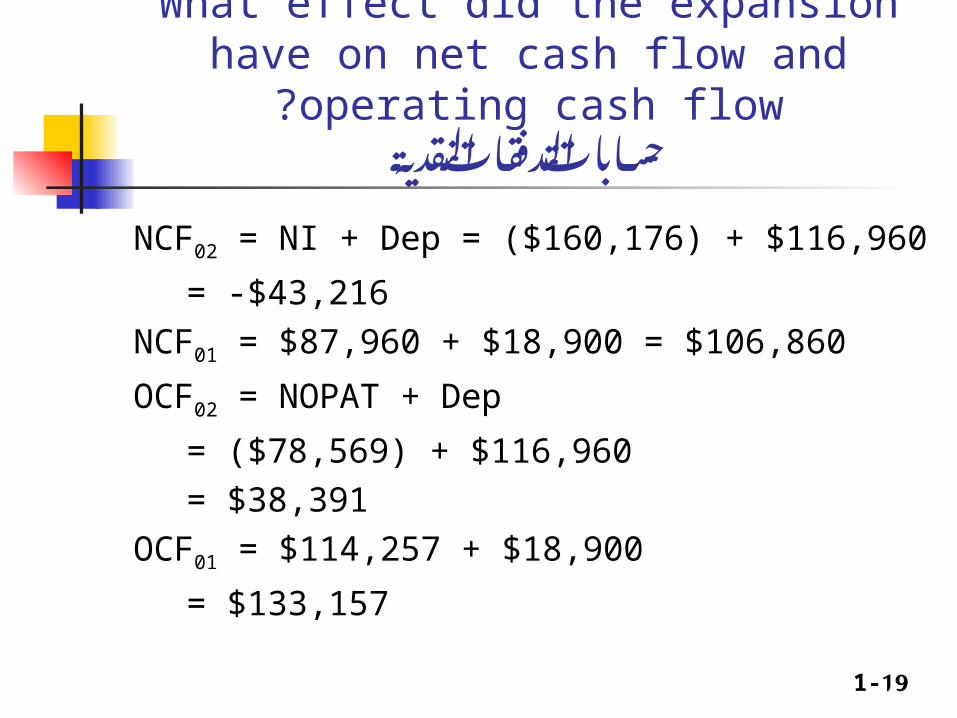
What effect did the expansion have on net cash flow and operating cash flow?
النقدية التدفقات حسابات
NCF02 = NI + Dep = ($160,176) + $116,960
= -$43,216
NCF01 = $87,960 + $18,900 = $106,860
OCF02 = NOPAT + Dep
= ($78,569) + $116,960
= $38,391
OCF01 = $114,257 + $18,900
= $133,157
1-20
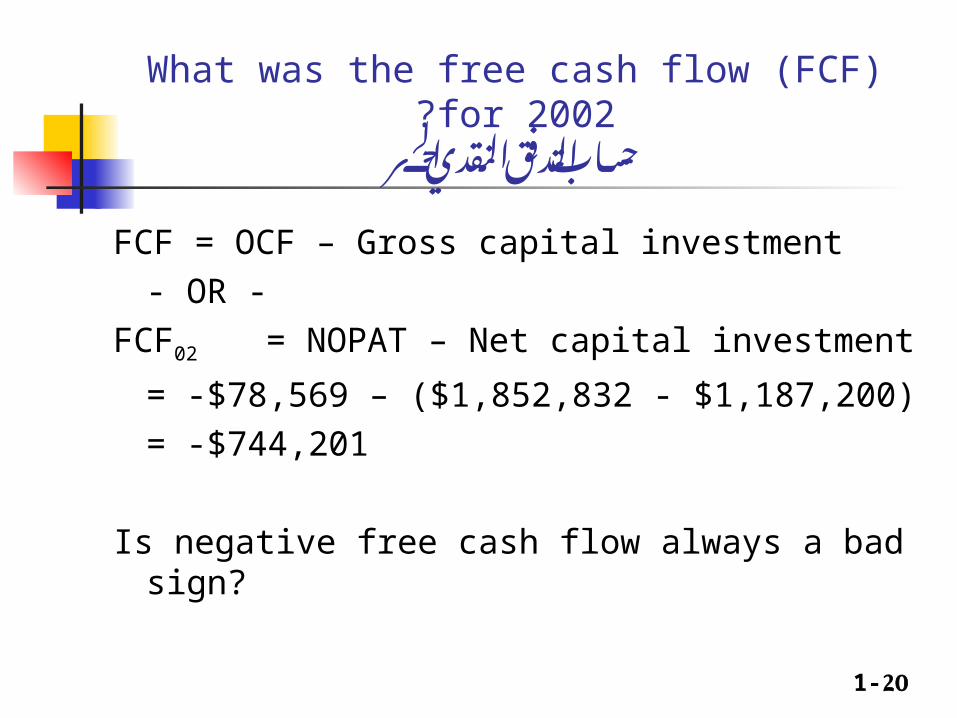
What was the free cash flow (FCF) for 2002?الحر النقدي التدفق حساب
FCF = OCF – Gross capital investment
- OR -
FCF02 = NOPAT – Net capital investment
= -$78,569 – ($1,852,832 - $1,187,200)
= -$744,201
Is negative free cash flow always a bad sign?
1-21
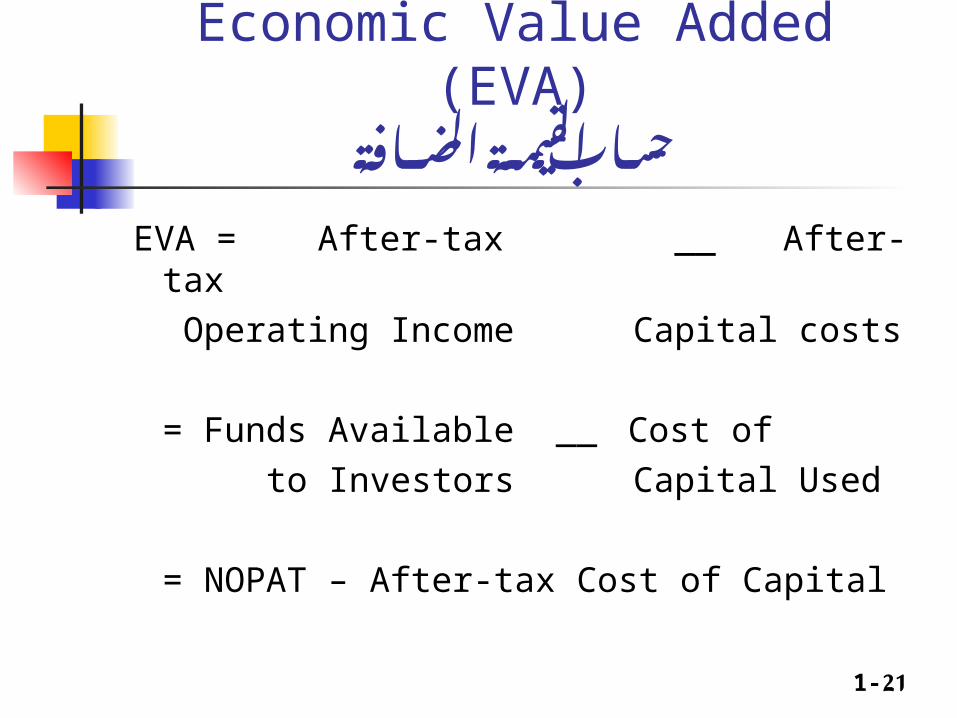
Economic Value Added (EVA)المضافة القيمة حساب
EVA = After-tax __ After-tax
Operating Income Capital costs
= Funds Available __Cost of
to Investors Capital Used
= NOPAT – After-tax Cost of Capital

1-22
EVA Conceptsالمضافة االقتصادية القيمة مفهوم
In order to generate positive EVA, a firm has to more than just cover operating costs. It must also provide a return to those who have provided the firm with capital.
EVA takes into account the total cost of capital, which includes the cost of equity.
1-23
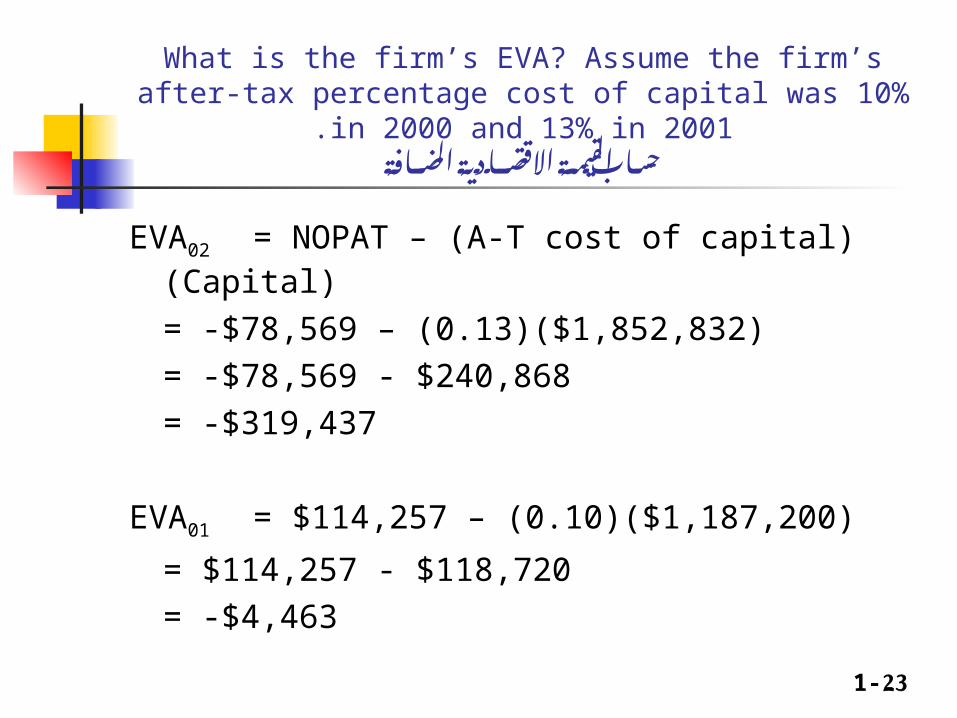
What is the firm’s EVA? Assume the firm’s after-tax percentage cost of capital was 10% in 2000 and 13% in 2001.
المضافة االقتصادية القيمة حساب
EVA02 = NOPAT – (A-T cost of capital) (Capital)
= -$78,569 – (0.13)($1,852,832)
= -$78,569 - $240,868
= -$319,437
EVA01 = $114,257 – (0.10)($1,187,200)
= $114,257 - $118,720
= -$4,463
1-24
Did the expansion increase or decrease MVA?المضافة السوقية القيمة حساب
MVA = Market value __ Equity capital of equity supplied
During the last year, the stock price has decreased 73%. As a consequence, the market value of equity has declined, and therefore MVA has declined, as well.
1-25
Corporate and Personal Taxesقيمة على وأثرها واالفراد الشركات ضرائب
وأسهمها الشركة
Have a progressive structure (the higher the income, the higher the marginal tax rate).
Corporations Rates are at 0% unless there are special provisions for
certain companies like Oil and foreign ones. Individuals
Rates 0% for individuals, again unless there are special provisions.
Inexistence of taxes does not change the mechanics of our work, it will change the results.
1-26
Tax treatment of various uses and sources of fundsوالخارجة الداخلة النقدية التدفقات على الضرائب أثر
Interest paid – tax deductible for corporations (paid out of pre-tax income), but usually not for individuals.
Interest earned - taxable Dividends paid – paid out of after-tax income. Dividends received – not taxed individuals (“double
taxation”). Capital gains not taxable
1-27
Calculating Key Multipliersالمضاعفات مثال - حساب
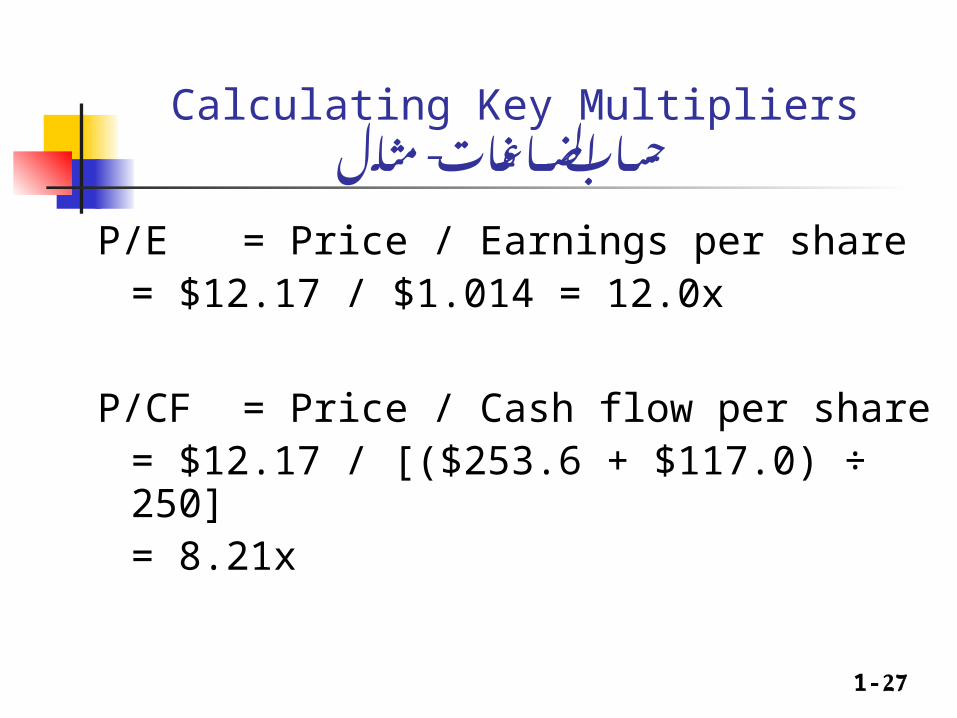
P/E = Price / Earnings per share= $12.17 / $1.014 = 12.0x
P/CF = Price / Cash flow per share= $12.17 / [($253.6 + $117.0) ÷ 250]= 8.21x

1-28
Calculating Key Multipliersمثال - المضاعفات حساب
M/B = Mkt price per share / Book value per share= $12.17 / ($1,952 / 250) = 1.56x
2003 2002 2001 Ind.
P/E 12.0x -1.4x 9.7x 14.2x
P/CF 8.21x -5.2x 8.0x 11.0x
M/B 1.56x 0.5x 1.3x 2.4x

1-29
Analyzing the multipliersالمضاعفات تحليل
P/E: How much investors are willing to pay for $1 of earnings.
P/CF: How much investors are willing to pay for $1 of cash flow.
M/B: How much investors are willing to pay for $1 of book value equity.
For each ratio, the higher the number, the better. P/E and M/B are high if ROE is high and risk is
low.
1-30
Trend analysisالنمطية تحليل
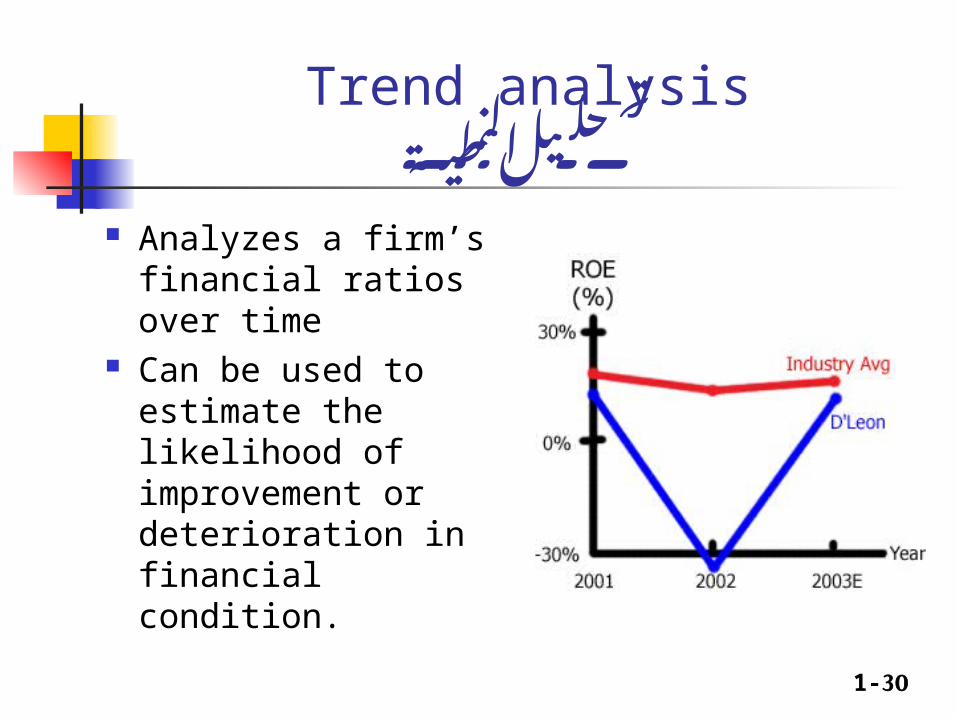
Analyzes a firm’s financial ratios over time
Can be used to estimate the likelihood of improvement or deterioration in financial condition.

1-31
Potential uses of freed up cashالحر النقدي التدفق استخدامات
Repurchase stock Expand business Reduce debt All these actions would likely improve the
stock price.

1-32
The Financial Environment:المراد للشركة المالية البيئة
وتقييمها تحليلها
Financial markets Types of financial institutions Determinants of interest rates Yield curves

1-33
What is a market?السوق هو ما
A market is a venue where goods and services are exchanged.
A financial market is a place where individuals and organizations wanting to borrow funds are brought together with those having a surplus of funds.
1-34
Types of financial marketsالمالية االسواق أنواع
Physical assets vs. Financial assets Money vs. Capital Primary vs. Secondary Spot vs. Futures Public vs. Private

1-35
How is capital transferred between savers and borrowers?
الى الفائض وحدات من االموال تحويلالعجز وحدات
Direct transfers Investment banking house Financial intermediaries
1-36
Types of financial intermediariesالماليين الوسطاء أنواع
Commercial banks Savings and loan associations Mutual savings banks Credit unions Pension funds Life insurance companies Mutual funds
1-37
Physical location stock exchanges vs. Electronic dealer-based markets
والغير المنظمة السوق بين الفرقمنظمة
Auction market vs. Dealer market (Exchanges vs. OTC)
Differences are narrowing
1-38
The cost of moneyالمال رأس تكلفة
The price, or cost, of debt capital is the interest rate.
The price, or cost, of equity capital is the required return. The required return investors expect is composed of compensation in the form of dividends and capital gains.
1-39
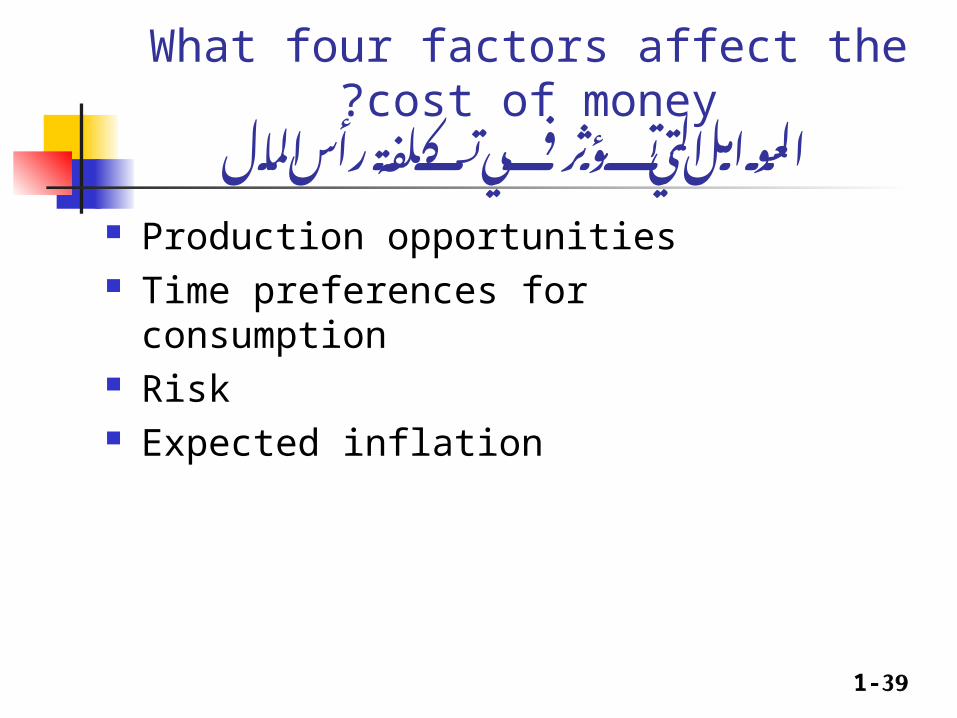
What four factors affect the cost of money?المال رأس تكلفة في تؤثر التي العوامل
Production opportunities Time preferences for consumption Risk Expected inflation
1-40
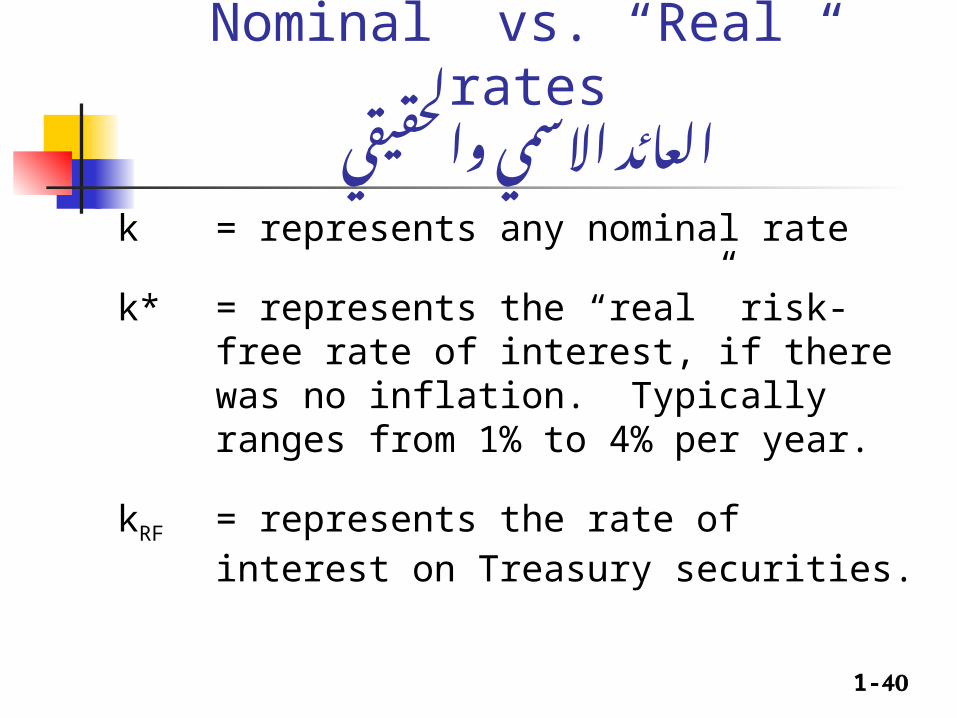
“Nominal” vs. “Real” ratesوالحقيقي االسمي العائد
k = represents any nominal rate
k* = represents the “real” risk-free rate of interest, if there was no inflation. Typically ranges from 1% to 4% per year.
kRF = represents the rate of interest on Treasury securities.
1-41
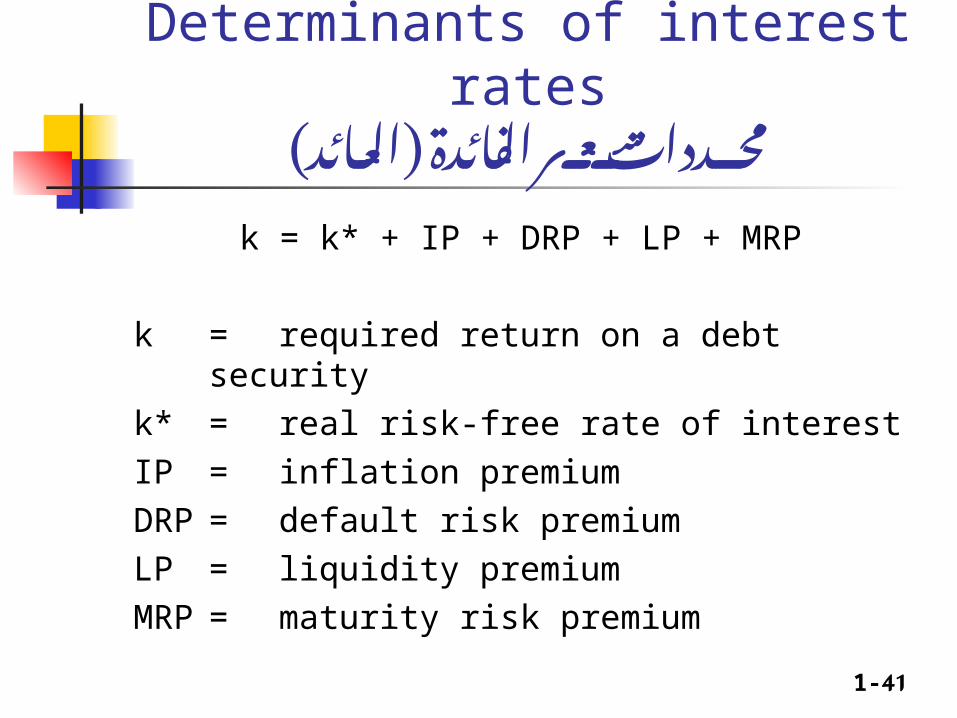
Determinants of interest rates( العائد ( الفائدة سعر محددات
k = k* + IP + DRP + LP + MRP
k = required return on a debt security
k* = real risk-free rate of interest
IP = inflation premium
DRP = default risk premium
LP = liquidity premium
MRP = maturity risk premium
1-42
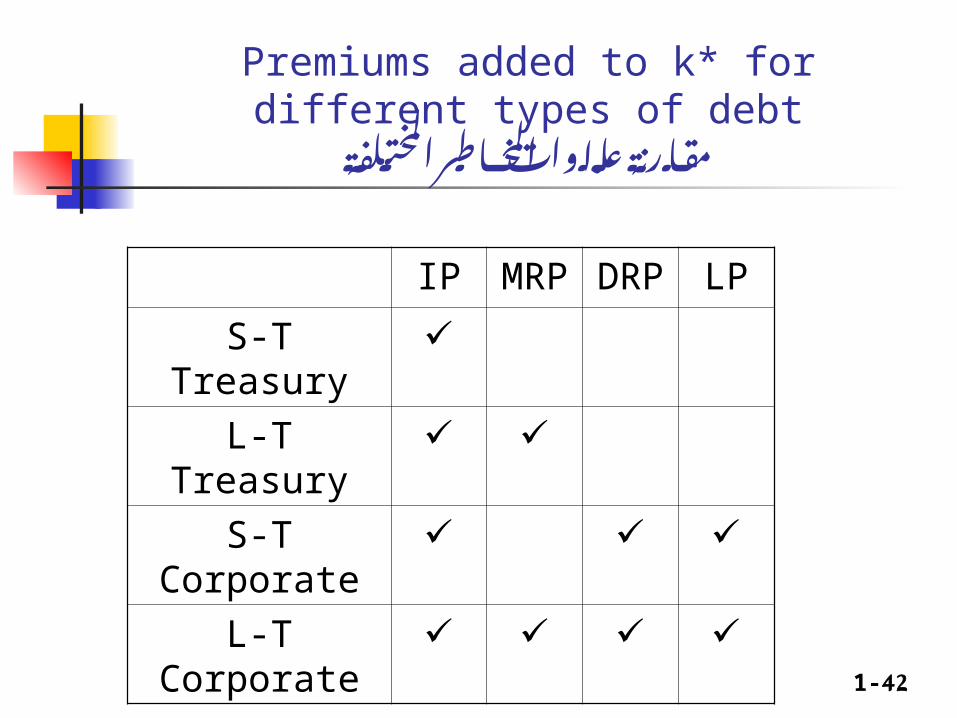
Premiums added to k* for different types of debtالمختلفة المخاطر عالوات مقارنة
IP MRP
DRP LP
S-T Treasury L-T Treasury
S-T Corporate
L-T Corporate
1-43
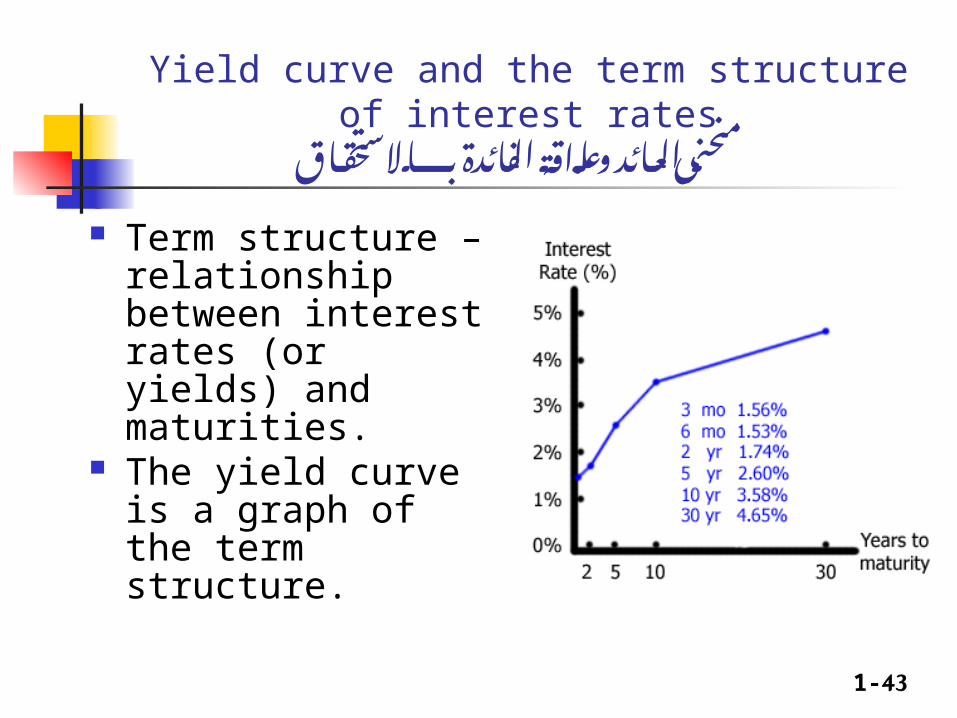
Yield curve and the term structure of interest ratesباالستحقاق الفائدة وعالقة العائد منحنى
Term structure – relationship between interest rates (or yields) and maturities.
The yield curve is a graph of the term structure.
1-44
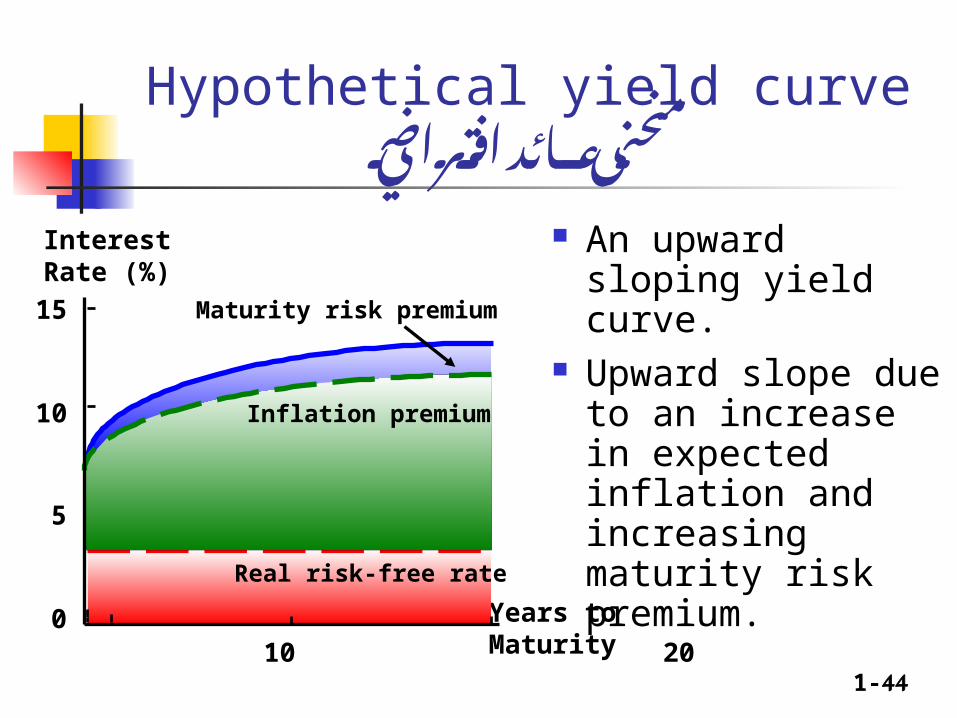
Hypothetical yield curveافتراضي عائد منحنى
An upward sloping yield curve.
Upward slope due to an increase in expected inflation and increasing maturity risk premium.
Years to Maturity
Real risk-free rate
0
5
10
15
1 10 20
InterestRate (%)
Maturity risk premium
Inflation premium

1-45
The Yield Curveالعائد منحنى
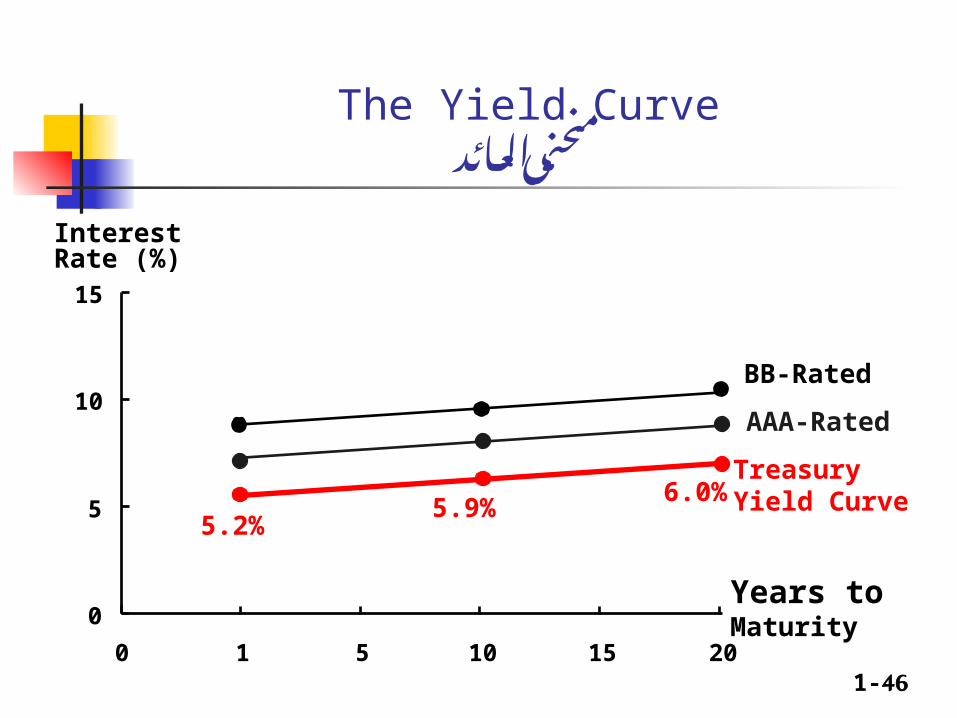
Corporate yield curves are higher than that of Treasury securities, though not necessarily parallel to the Treasury curve.
The spread between corporate and Treasury yield curves widens as the corporate bond rating decreases.
1-46
The Yield Curveالعائد منحنى
0
5
10
15
0 1 5 10 15 20
Years toMaturity
Interest Rate (%)
5.2%5.9%
6.0%TreasuryYield Curve
BB-Rated
AAA-Rated

1-47
Risk and Rates of Returnوالعائد المخاطر
Stand-alone risk Portfolio risk Risk & return: CAPM / SML
1-48
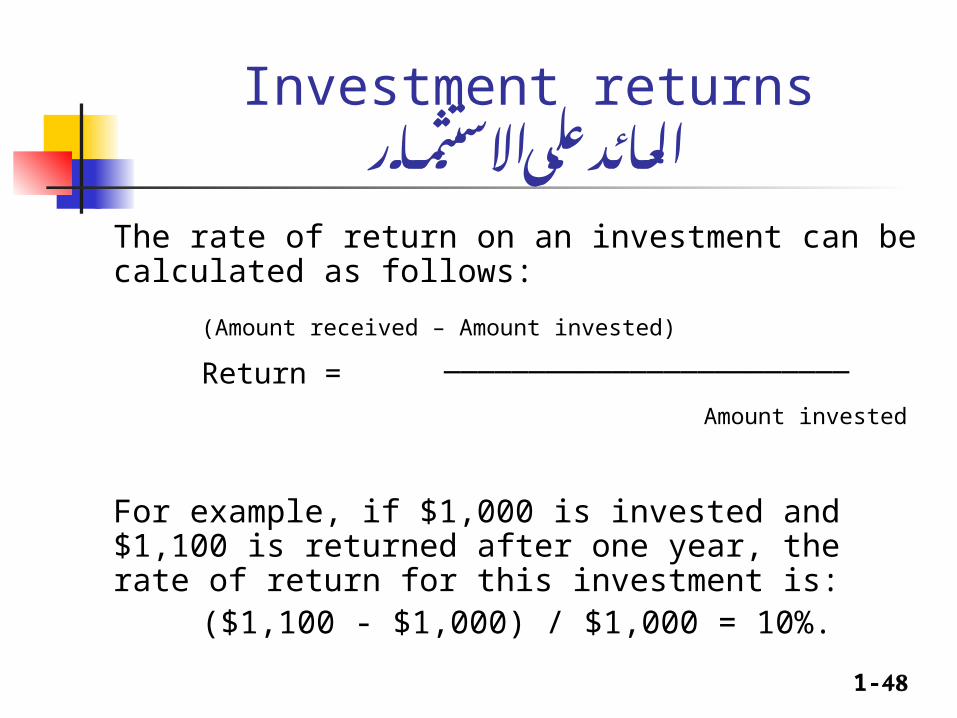
Investment returnsاالستثمار على العائد
The rate of return on an investment can be calculated as follows:
(Amount received – Amount invested)
Return = ________________________
Amount invested
For example, if $1,000 is invested and $1,100 is returned after one year, the rate of return for this investment is:
($1,100 - $1,000) / $1,000 = 10%.

1-49
What is investment risk?االستثمار مخاطر
Two types of investment risk Stand-alone risk Portfolio risk
Investment risk is related to the probability of earning a low or negative actual return.
The greater the chance of lower than expected or negative returns, the riskier the investment.
1-50
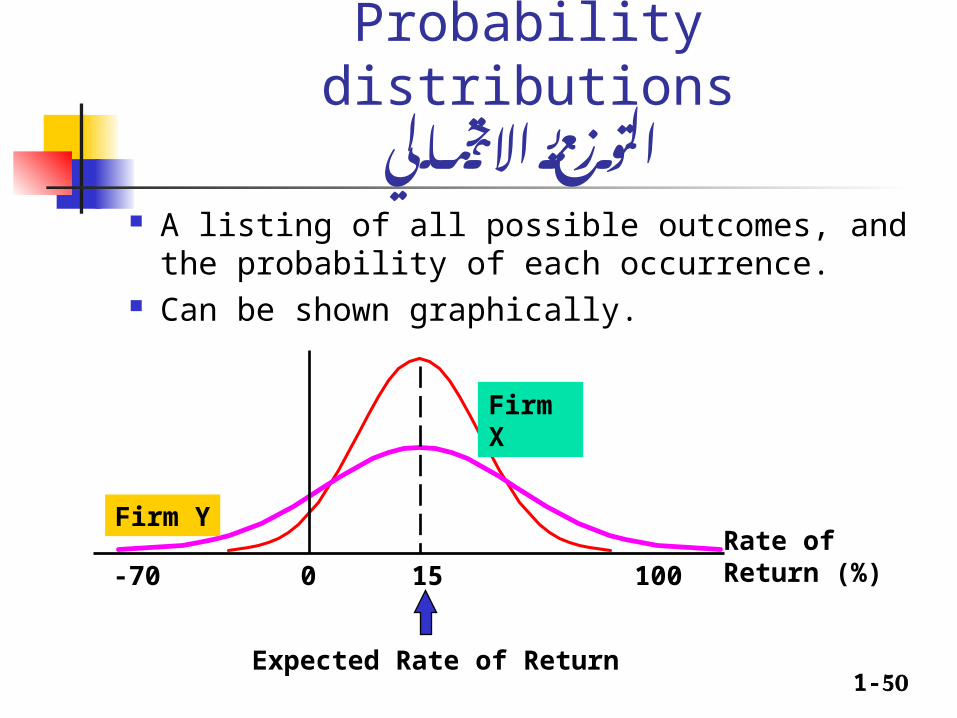
Probability distributionsاالحتمالي التوزيع
A listing of all possible outcomes, and the probability of each occurrence.
Can be shown graphically.
Expected Rate of Return
Rate ofReturn (%)100150-70
Firm X
Firm Y
1-51
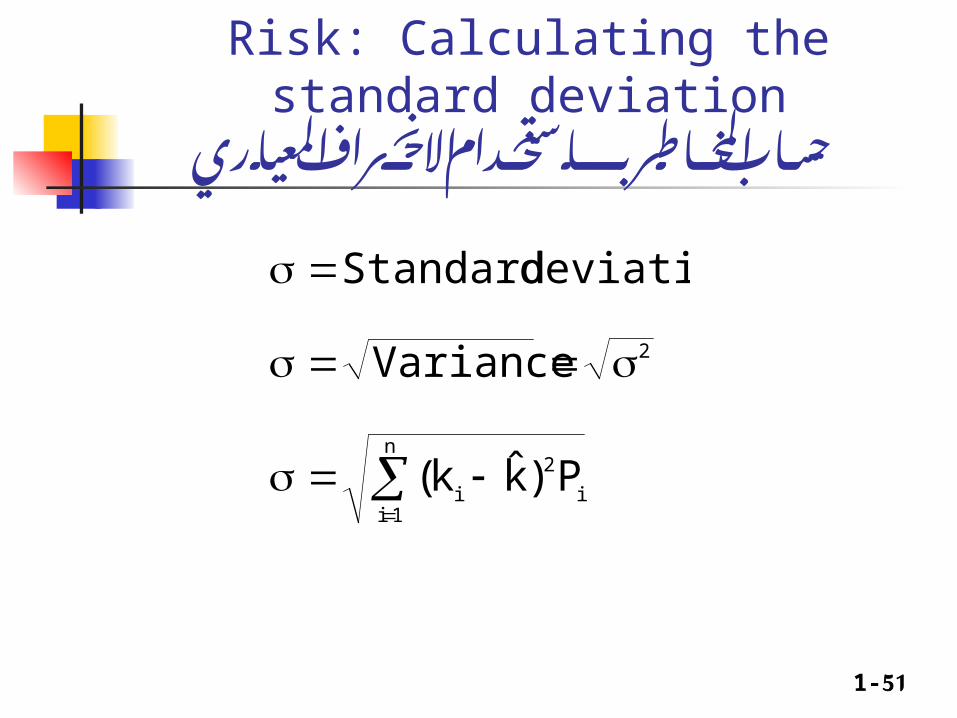
Risk: Calculating the standard deviationاالنحراف باستخدام المخاطر حساب
المعياري
deviation Standard
2Variance
i
2n
1ii P)k̂k(
1-52
Standard deviation as a measure of riskللخطورة كمقياس المعياري االنحراف
Standard deviation (σi) measures total, or stand-alone, risk.
The larger σi is, the lower the probability that actual returns will be closer to expected returns.
Larger σi is associated with a wider probability distribution of returns.
1-53
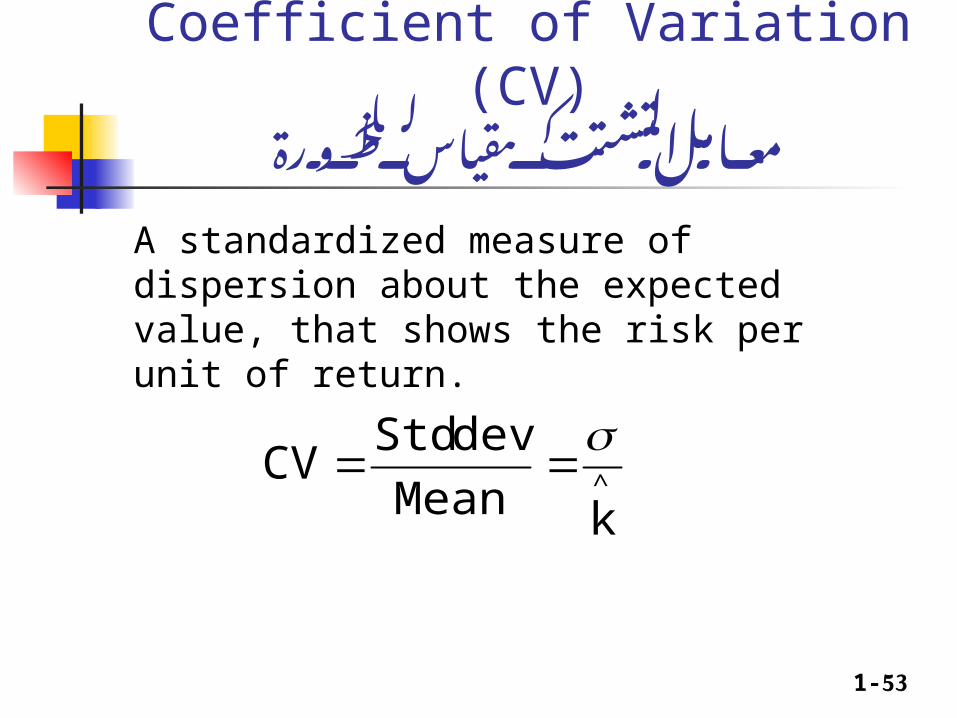
Coefficient of Variation (CV)التشتت للخطورة معامل كمقياس
A standardized measure of dispersion about the expected value, that shows the risk per unit of return.
^
k
Meandev Std
CV
1-54
Investor attitude towards riskللمخاطر المستثمرين تحمل درجة
Risk aversion – assumes investors dislike risk and require higher rates of return to encourage them to hold riskier securities.
Risk premium – the difference between the return on a risky asset and less risky asset, which serves as compensation for investors to hold riskier securities.
1-55
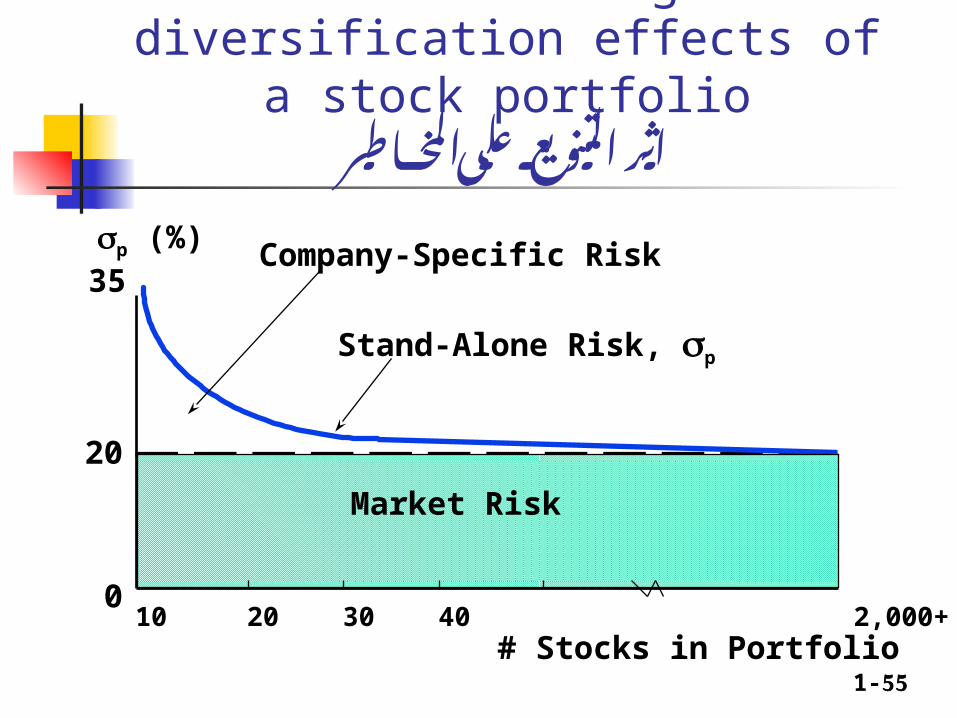
Illustrating diversification effects of a stock portfolio
المخاطر على التنويع اثر
# Stocks in Portfolio10 20 30 40 2,000+
Company-Specific Risk
Market Risk
20
0
Stand-Alone Risk, p
p (%)35
1-56
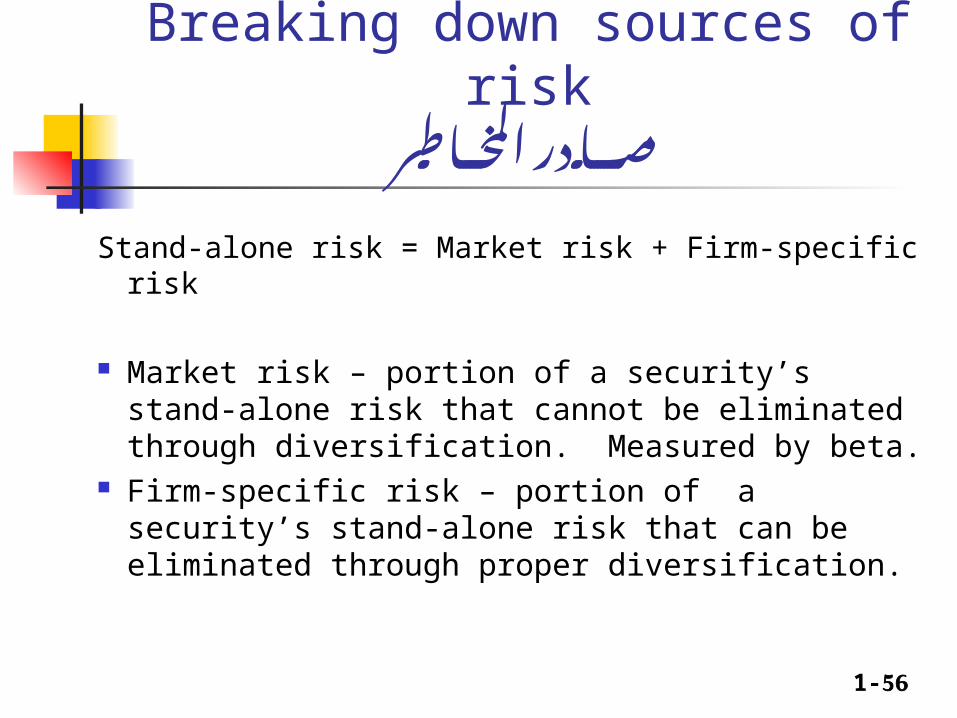
Breaking down sources of riskالمخاطر مصادر
Stand-alone risk = Market risk + Firm-specific risk
Market risk – portion of a security’s stand-alone risk that cannot be eliminated through diversification. Measured by beta.
Firm-specific risk – portion of a security’s stand-alone risk that can be eliminated through proper diversification.

1-57
Capital Asset Pricing Modelالرأسمالية االصول تسعير نموذج
Model based upon concept that a stock’s required rate of return is equal to the risk-free rate of return plus a risk premium that reflects the riskiness of the stock after diversification.
Primary conclusion: The relevant riskiness of a stock is its contribution to the riskiness of a well-diversified portfolio.
1-58
Betaبيتا للخطورة معامل كمقياس
Measures a stock’s market risk, and shows a stock’s volatility relative to the market.
Indicates how risky a stock is if the stock is held in a well-diversified portfolio.

1-59
Calculating betasباستخدام بيتا معامل Excelحساب
Run a regression of past returns of a security against past returns on the market.
The slope of the regression line (sometimes called the security’s characteristic line) is defined as the beta coefficient for the security.
1-60
Illustrating the calculation of betaباستخدام - بيتا معامل حساب مثال
Excel
See PADICO-PALTEL.XLS
1-61
Comments on betaبيتا معامل على مالحظات
If beta = 1.0, the security is just as risky as the average stock.
If beta > 1.0, the security is riskier than average. If beta < 1.0, the security is less risky than
average. Most stocks have betas in the range of 0.5 to 1.5.
1-62
Can the beta of a security be negative?سالبا يكون قد بيتا معامل
Yes, if the correlation between Stock i and the market is negative (i.e., ρi,m < 0).
If the correlation is negative, the regression line would slope downward, and the beta would be negative.
However, a negative beta is highly unlikely.
1-63
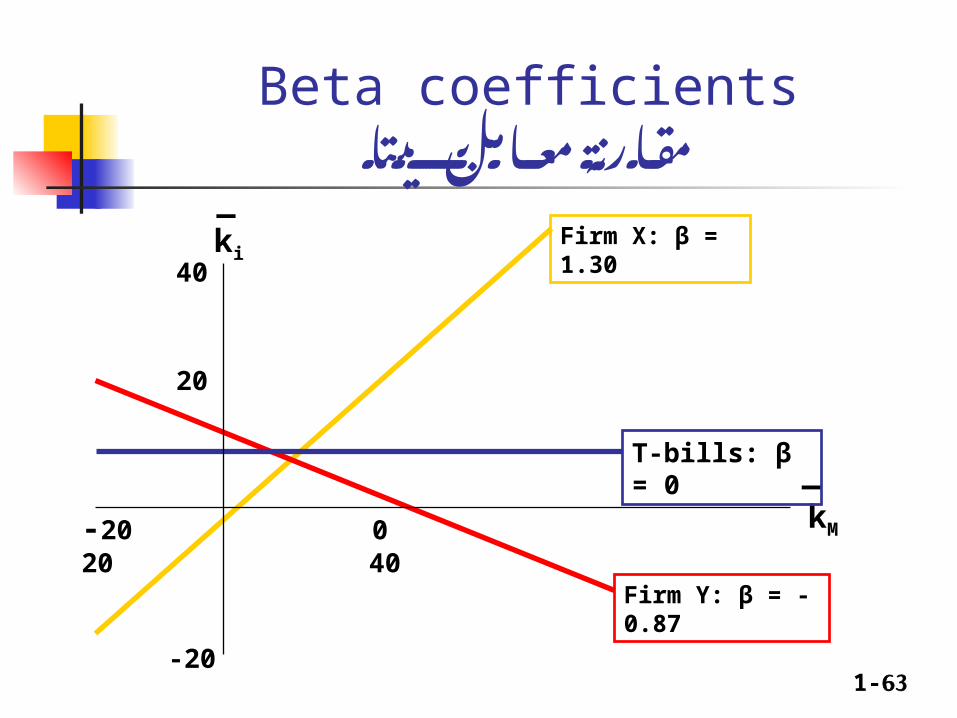
Beta coefficientsبيتا معامل مقارنة
ki
_
kM
_
-20 0 20 40
40
20
-20
Firm X: β = 1.30
T-bills: β = 0
Firm Y: β = -0.87
1-64
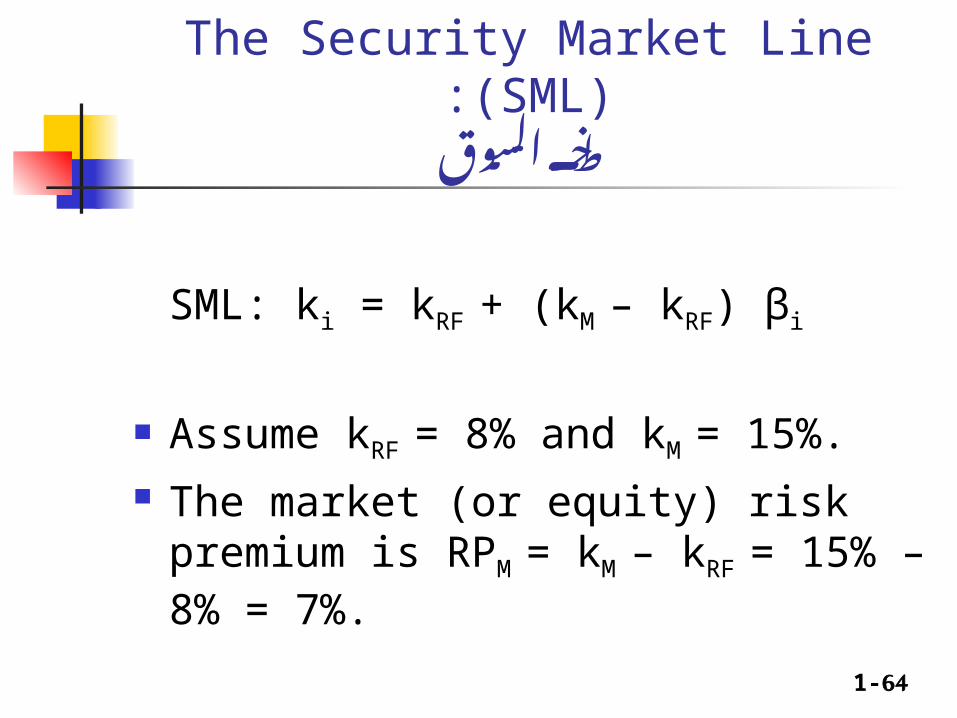
The Security Market Line (SML):السوق خط
SML: ki = kRF + (kM – kRF) βi
Assume kRF = 8% and kM = 15%.
The market (or equity) risk premium is RPM
= kM – kRF = 15% – 8% = 7%.
1-65
What is the market risk premium?السوق مخاطر عالوة هي ما
Additional return over the risk-free rate needed to compensate investors for assuming an average amount of risk.
Its size depends on the perceived risk of the stock market and investors’ degree of risk aversion.
Varies from year to year, but most estimates suggest that it ranges between 4% and 8% per year.
1-66
Time Value of Moneyللنقود الزمنية القيمة
Future value Present value Annuities Rates of return

1-67
Time linesانت؟ – اين الزمن خط
Show the timing of cash flows. Tick marks occur at the end of periods, so Time
0 is today; Time 1 is the end of the first period (year, month, etc.) or the beginning of the second period.
CF0 CF1 CF3CF2
0 1 2 3
i%
1-68
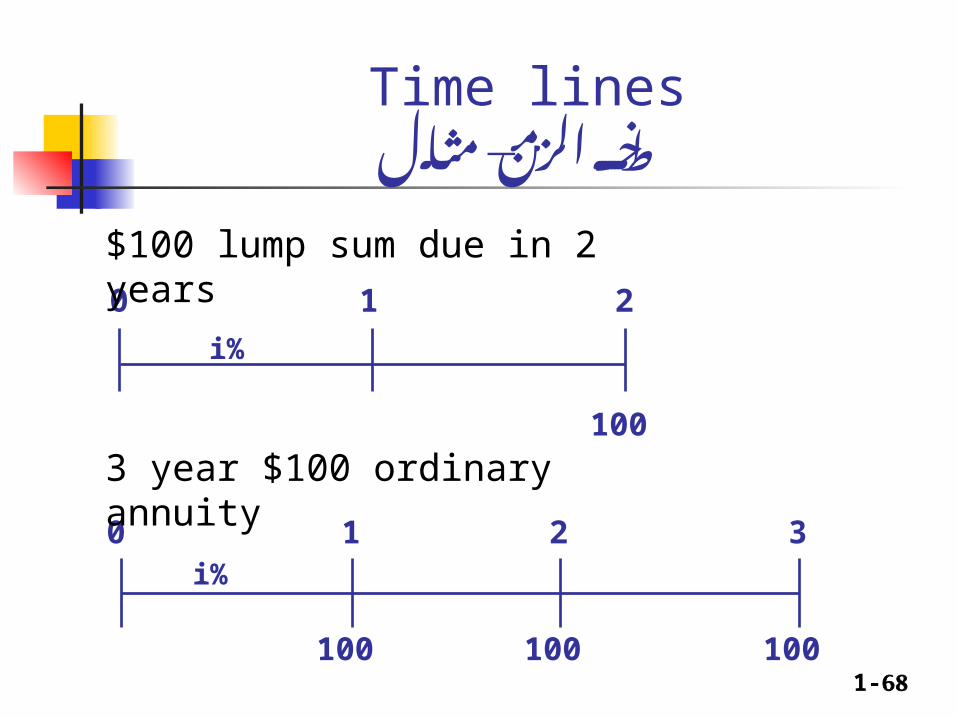
Time linesمثال – الزمن خط
100 100100
0 1 2 3i%
3 year $100 ordinary annuity
100
0 1 2
i%
$100 lump sum due in 2 years
1-69
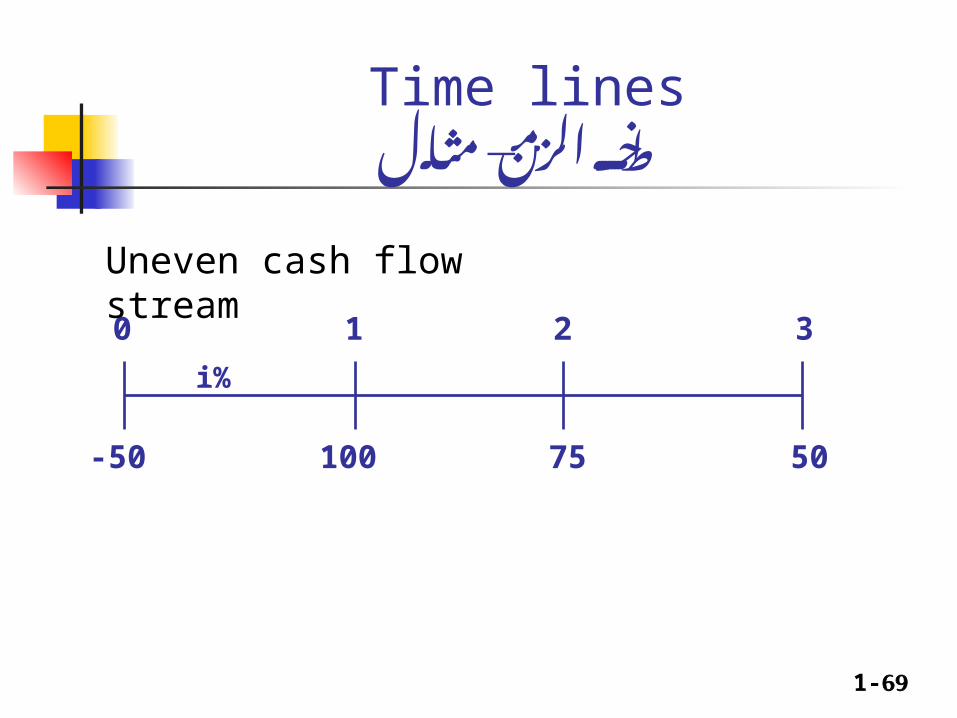
Time linesمثال – الزمن خط
100 50 75
0 1 2 3
i%
-50
Uneven cash flow stream
1-70
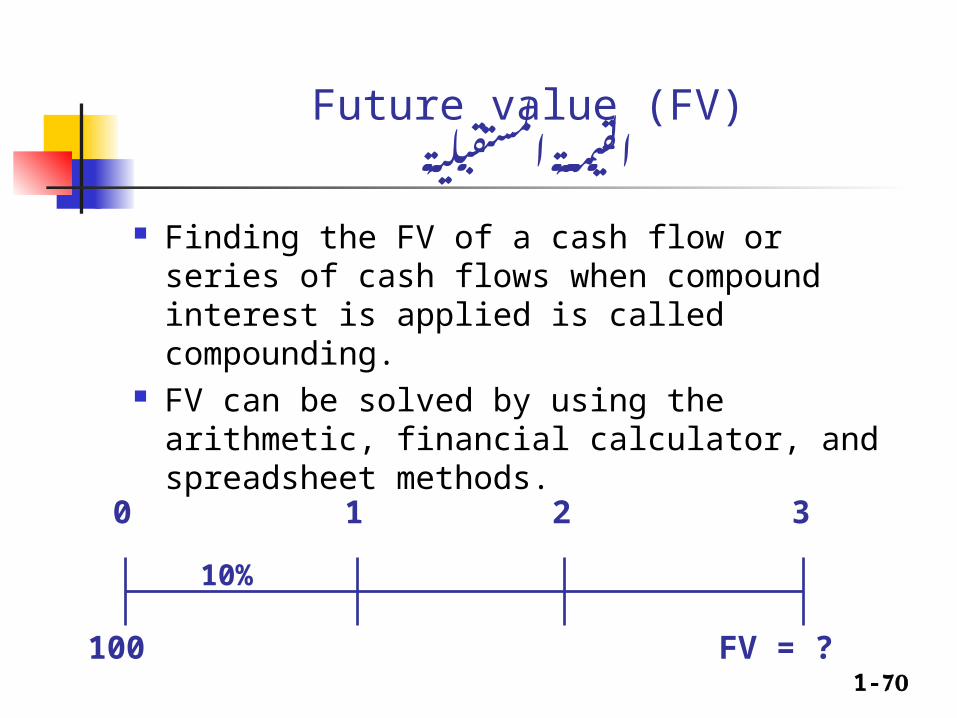
Future value (FV)المستقبلية القيمة
Finding the FV of a cash flow or series of cash flows when compound interest is applied is called compounding.
FV can be solved by using the arithmetic, financial calculator, and spreadsheet methods.
FV = ?
0 1 2 3
10%
100

1-71
Future value (FV)المستقبلية القيمة
After 1 year: FV1 = PV ( 1 + i ) = $100 (1.10)
= $110.00 After 2 years:
FV2 = PV ( 1 + i )2 = $100 (1.10)2
=$121.00 After 3 years:
FV3 = PV ( 1 + i )3 = $100 (1.10)3
=$133.10 After n years (general case):
FVn = PV ( 1 + i )n
1-72PV = ? 100
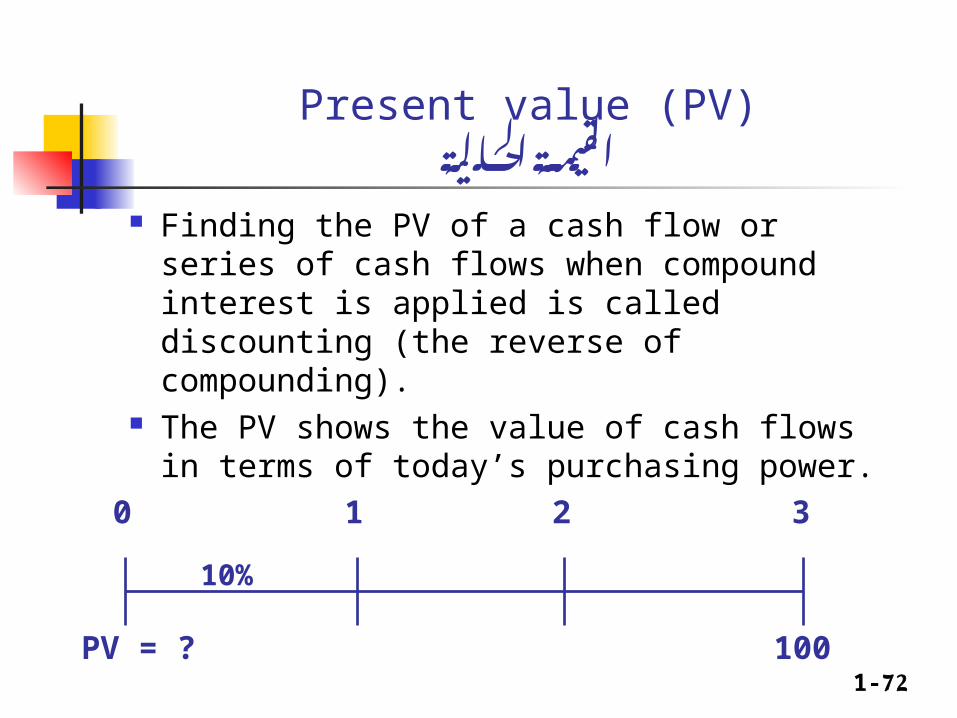
Present value (PV)الحالية القيمة
Finding the PV of a cash flow or series of cash flows when compound interest is applied is called discounting (the reverse of compounding).
The PV shows the value of cash flows in terms of today’s purchasing power.
0 1 2 3
10%
1-73
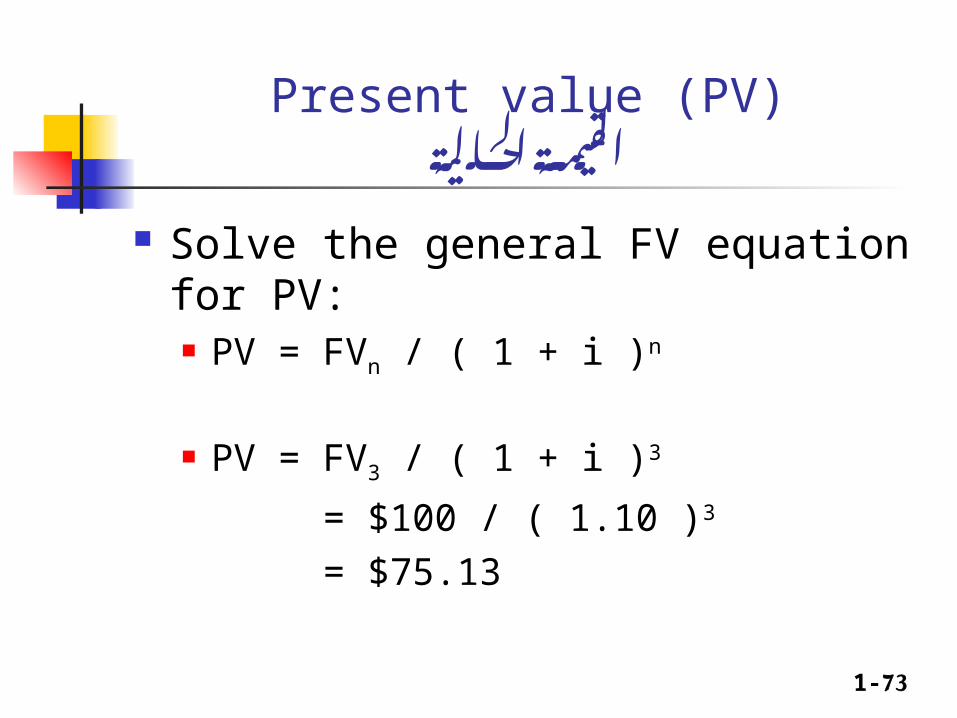
Present value (PV)الحالية القيمة
Solve the general FV equation for PV: PV = FVn / ( 1 + i )n
PV = FV3 / ( 1 + i )3
= $100 / ( 1.10 )3
= $75.13
1-74
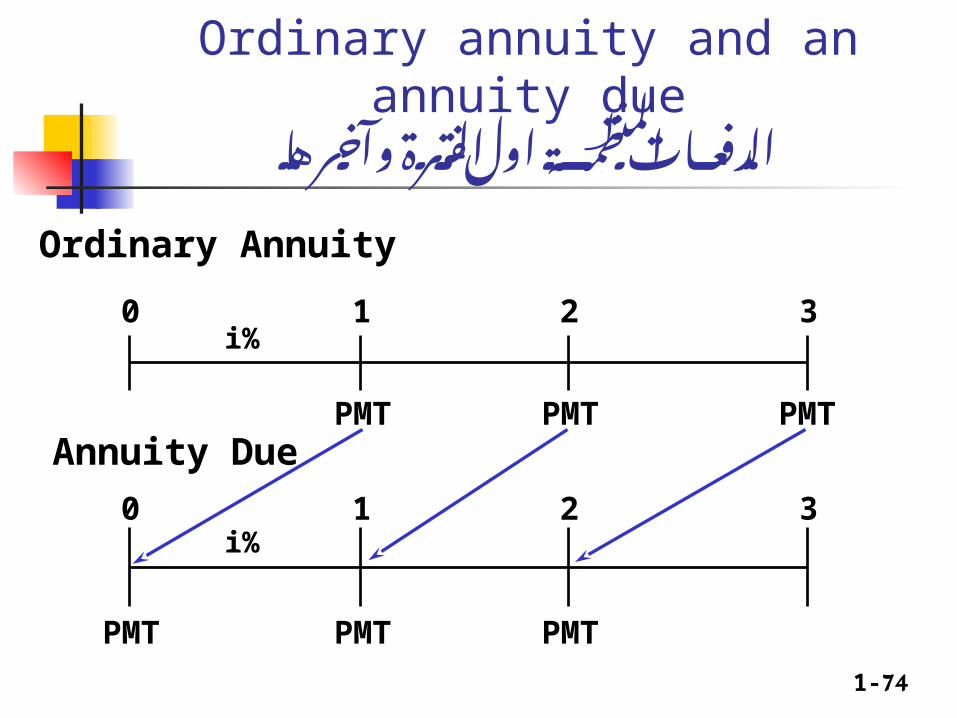
Ordinary annuity and an annuity dueوآخرها الفترة اول المنتظمة الدفعات
Ordinary Annuity
PMT PMTPMT
0 1 2 3i%
PMT PMT
0 1 2 3i%
PMT
Annuity Due
1-75
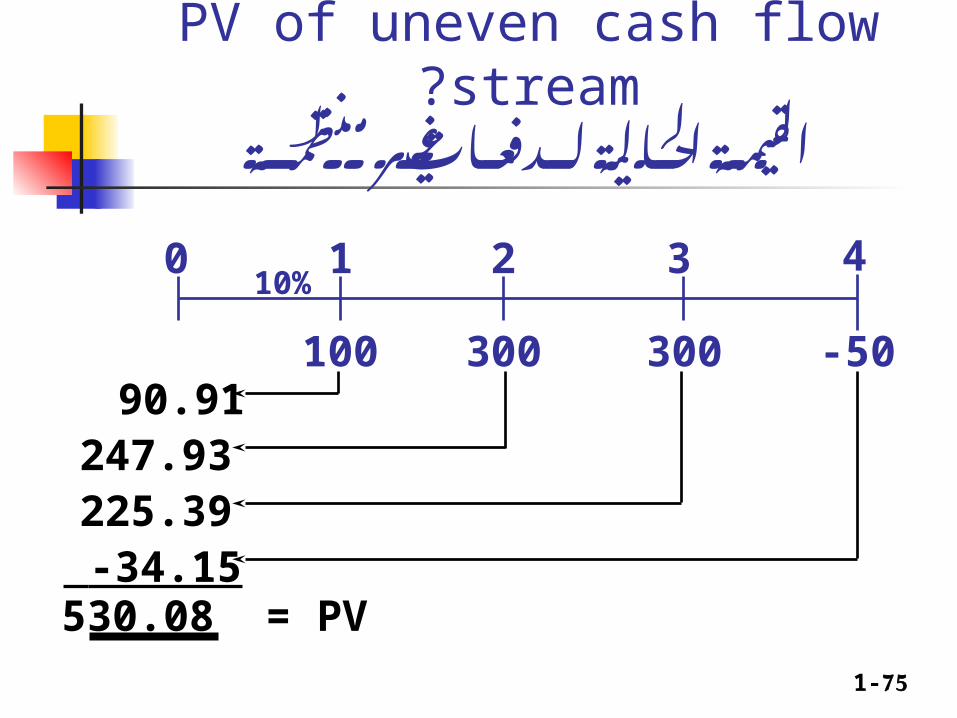
PV of uneven cash flow stream?منتظمة غير لدفعات الحالية القيمة
0
100
1
300
2
300
310%
-50
4
90.91247.93225.39 -34.15530.08 = PV

1-76
Bonds and Their Valuationوتسعيرها السندات
Key features of bonds Bond valuation Measuring yield Assessing risk
1-77
What is a bond?السند؟ هو ما
A long-term debt instrument in which a borrower agrees to make payments of principal and interest, on specific dates, to the holders of the bond.

1-78
What is a bond?السند؟ هو ما
Par value – face amount of the bond, which is paid at maturity (assume $1,000).
Coupon interest rate – stated interest rate (generally fixed) paid by the issuer. Multiply by par to get dollar payment of interest.
Maturity date – years until the bond must be repaid. Issue date – when the bond was issued. Yield to maturity - rate of return earned on
a bond held until maturity (also called the “promised yield”).
1-79
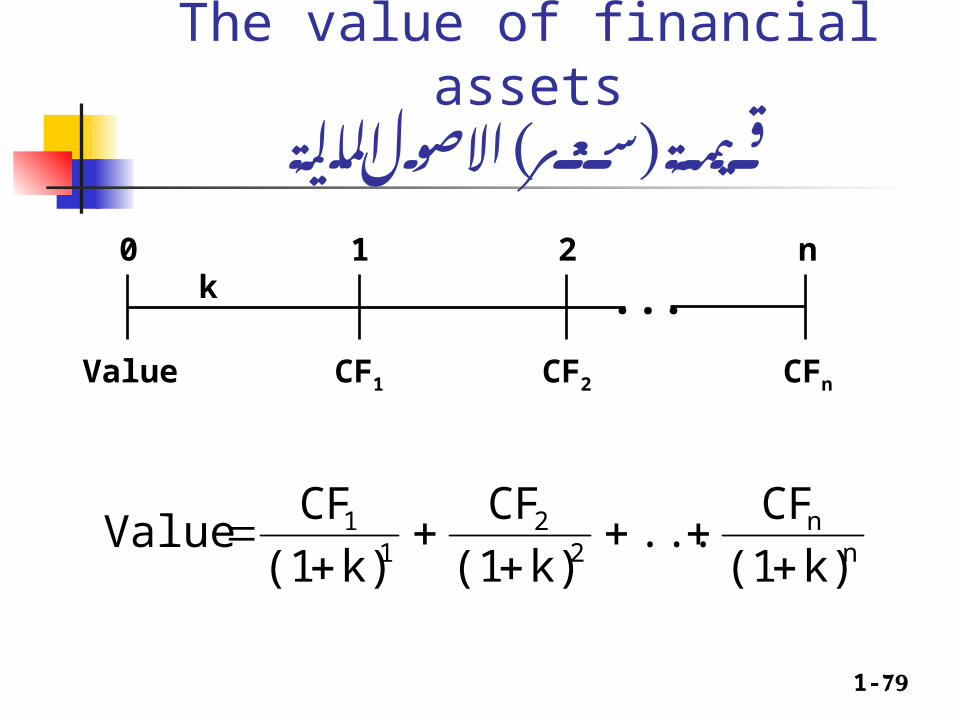
The value of financial assets ( المالية ( االصول سعر قيمة
nn
22
11
k)(1CF
... k)(1
CF
k)(1CF
Value
0 1 2 nk
CF1 CFnCF2Value
...
1-80
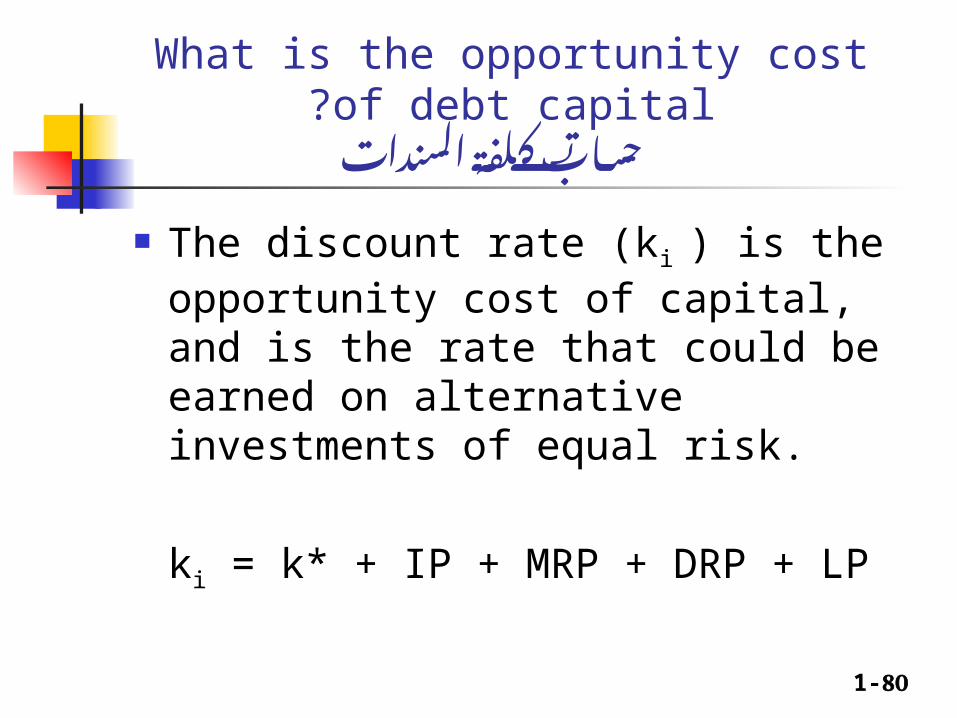
What is the opportunity cost of debt capital?السندات تكلفة حساب
The discount rate (ki ) is the opportunity cost of capital, and is the rate that could be earned on alternative investments of equal risk.
ki = k* + IP + MRP + DRP + LP
1-81
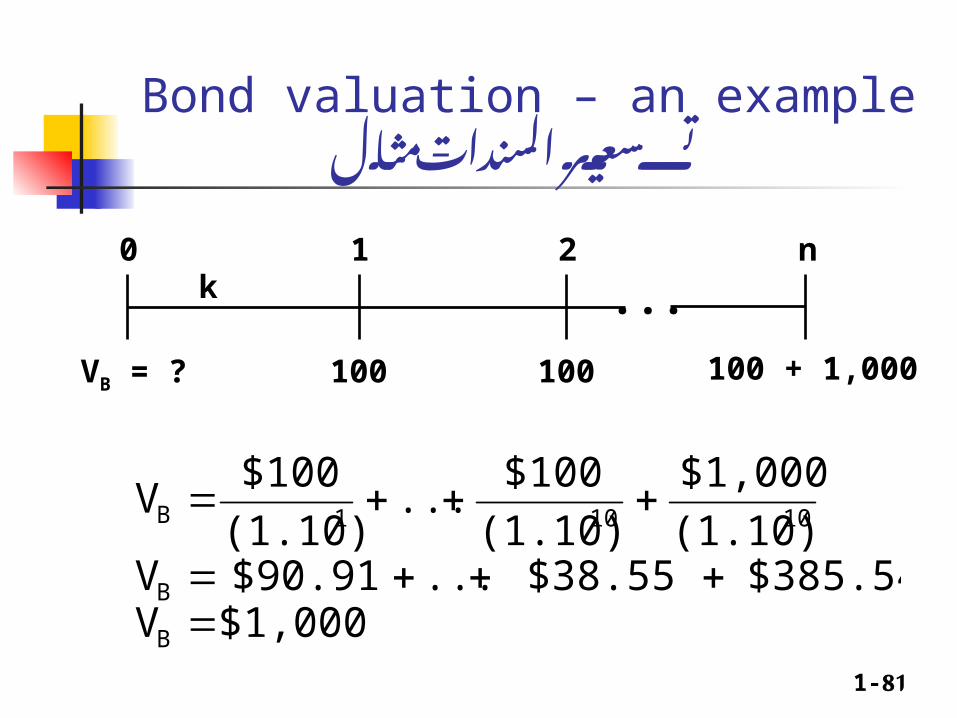
Bond valuation – an exampleمثال - السندات تسعير
$1,000 V$385.54 $38.55 ... $90.91 V
(1.10)$1,000
(1.10)$100
... (1.10)$100
V
B
B
10101B
0 1 2 nk
100 100 + 1,000100VB = ?
...

1-82
What is the YTM on a bond?سند على المطلوب العائد حساب
Must find the kd that solves this model.
10d
10d
1d
Nd
Nd
1d
B
)k(11,000
)k(1
90 ...
)k(190
$887
)k(1M
)k(1
INT ...
)k(1INT
V
1-83
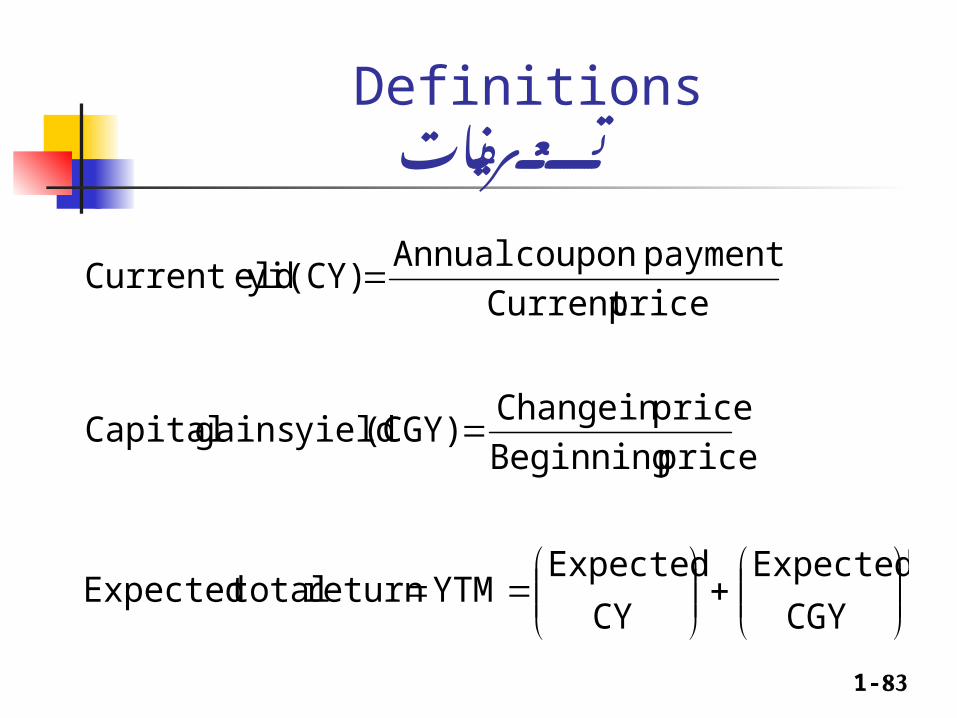
Definitionsتعريفات
CGY
Expected
CY
Expected YTM return total Expected
price Beginningprice in Change
(CGY) yieldgains Capital
priceCurrent payment coupon Annual
(CY) eldCurrent yi

1-84
An example: Current and capital gains yieldمثال - سند على العائد حساب
Find the current yield and the capital gains yield for a 10-year, 9% annual coupon bond that sells for $887, and has a face value of $1,000.
Current yield = $90 / $887
= 0.1015 = 10.15%
1-85
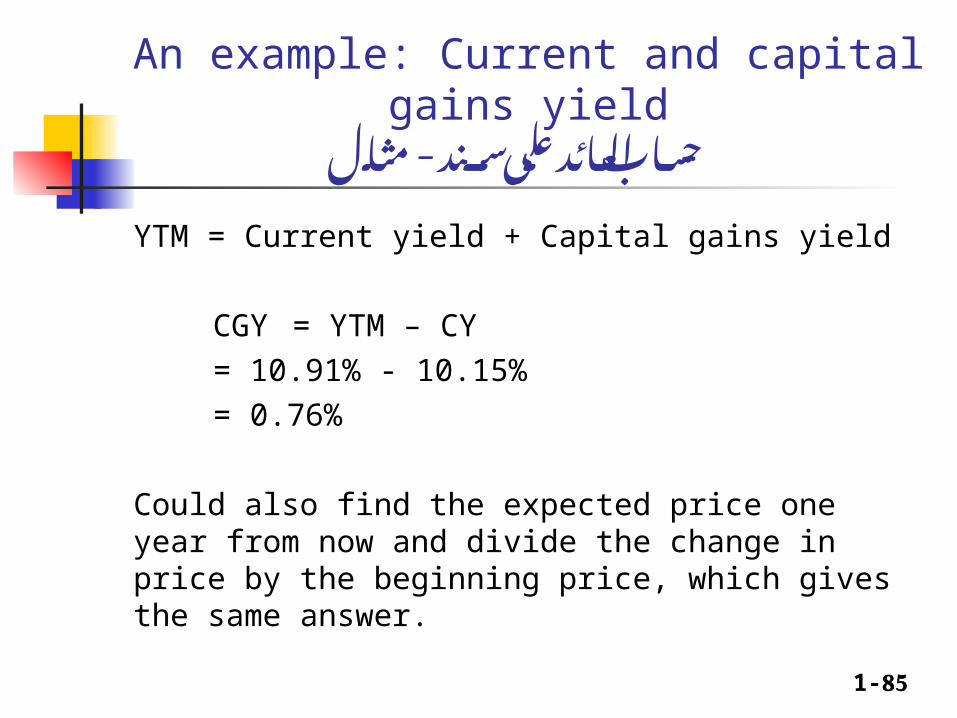
An example: Current and capital gains yieldمثال - سند على العائد حساب
YTM = Current yield + Capital gains yield
CGY = YTM – CY
= 10.91% - 10.15%
= 0.76%
Could also find the expected price one year from now and divide the change in price by the beginning price, which gives the same answer.
1-86
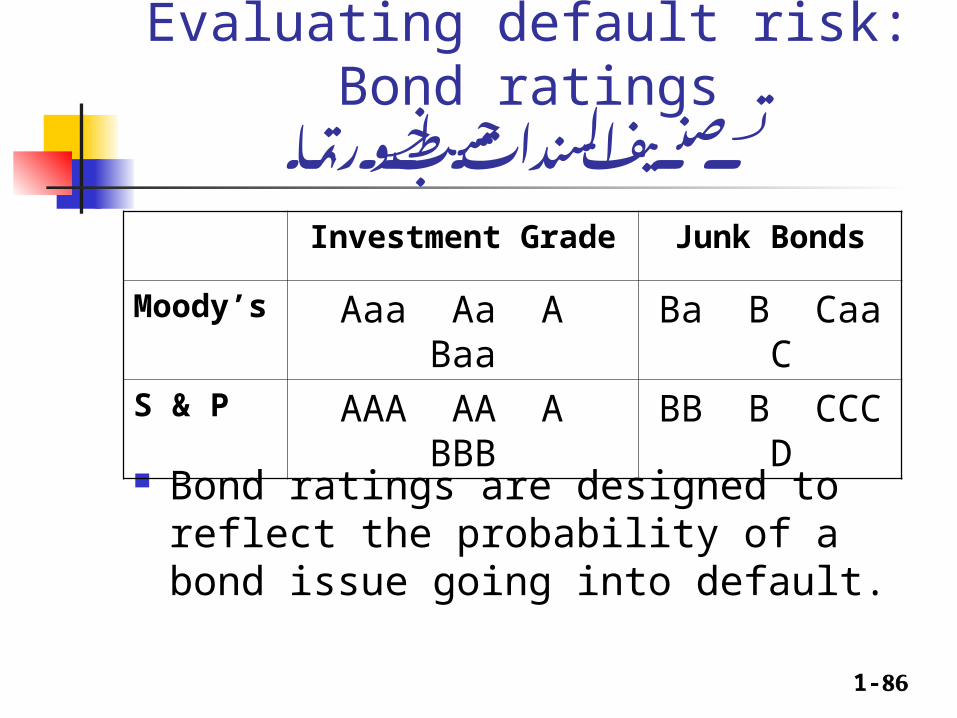
Evaluating default risk: Bond ratingsخطورتها حسب السندات تصنيف
Bond ratings are designed to reflect the probability of a bond issue going into default.
Investment Grade Junk Bonds
Moody’s
Aaa Aa A Baa Ba B Caa C
S & P AAA AA A BBB BB B CCC D
1-87
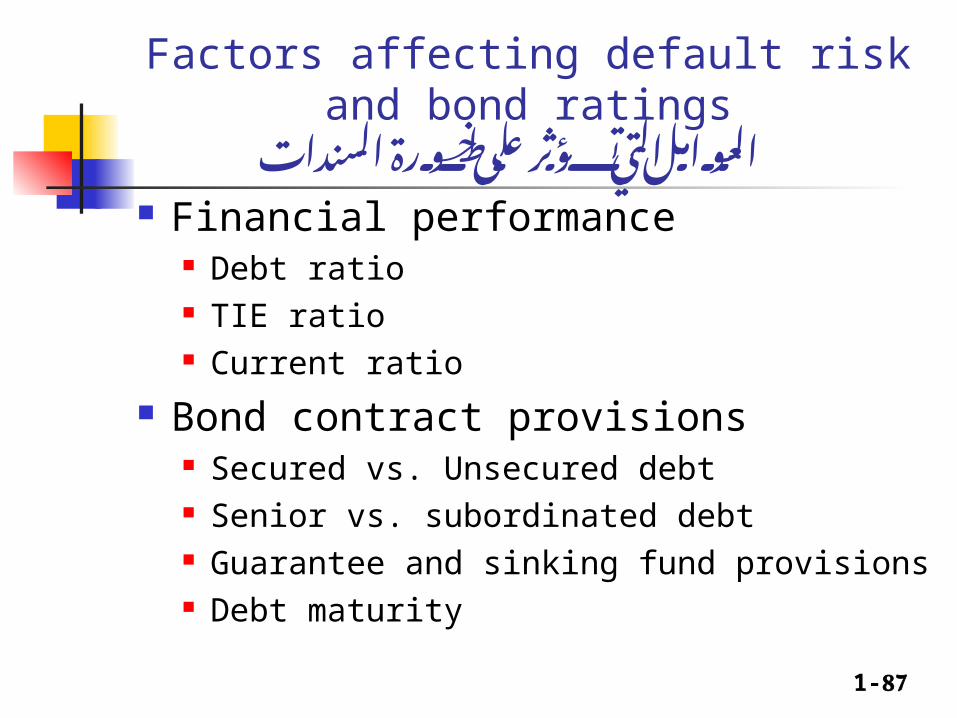
Factors affecting default risk and bond ratingsالسندات خطورة على تؤثر التي العوامل
Financial performance Debt ratio TIE ratio Current ratio
Bond contract provisions Secured vs. Unsecured debt Senior vs. subordinated debt Guarantee and sinking fund provisions Debt maturity
1-88
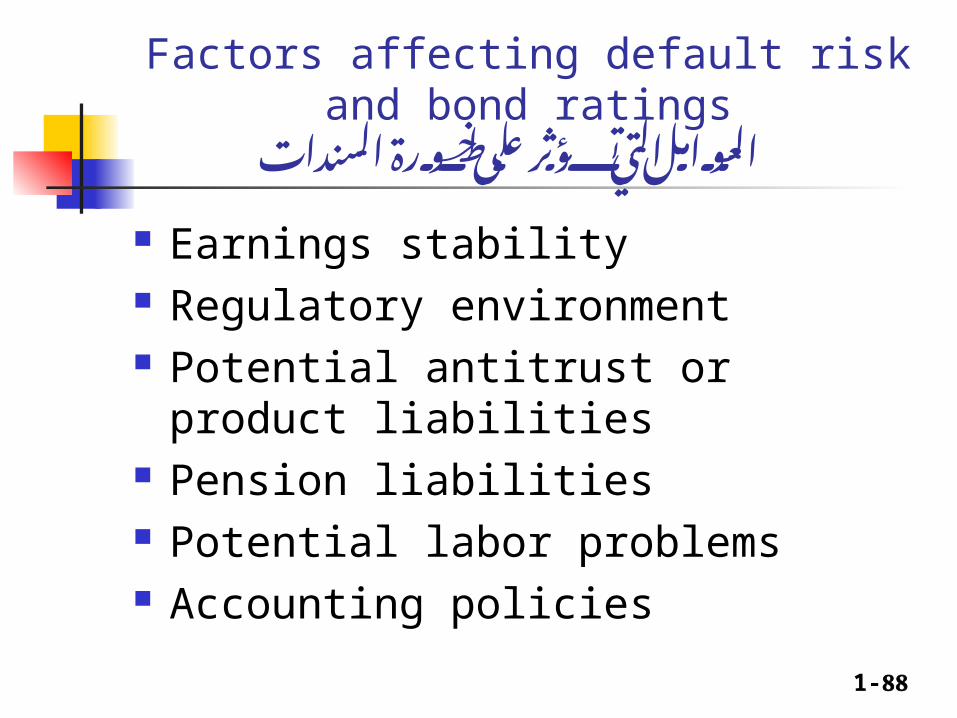
Factors affecting default risk and bond ratingsالسندات خطورة على تؤثر التي العوامل
Earnings stability Regulatory environment Potential antitrust or product liabilities Pension liabilities Potential labor problems Accounting policies

1-89
Priority of claims in liquidationالتصفية عند االولوية له من
1. Secured creditors from sales of secured assets.
2. Trustee’s costs3. Wages, subject to limits4. Taxes5. Unfunded pension liabilities6. Unsecured creditors7. Preferred stock8. Common stock
1-90
The Cost of Capitalالمال رأس تكلفة
Sources of capital Component costs WACC Adjusting for flotation costs Adjusting for risk
1-91
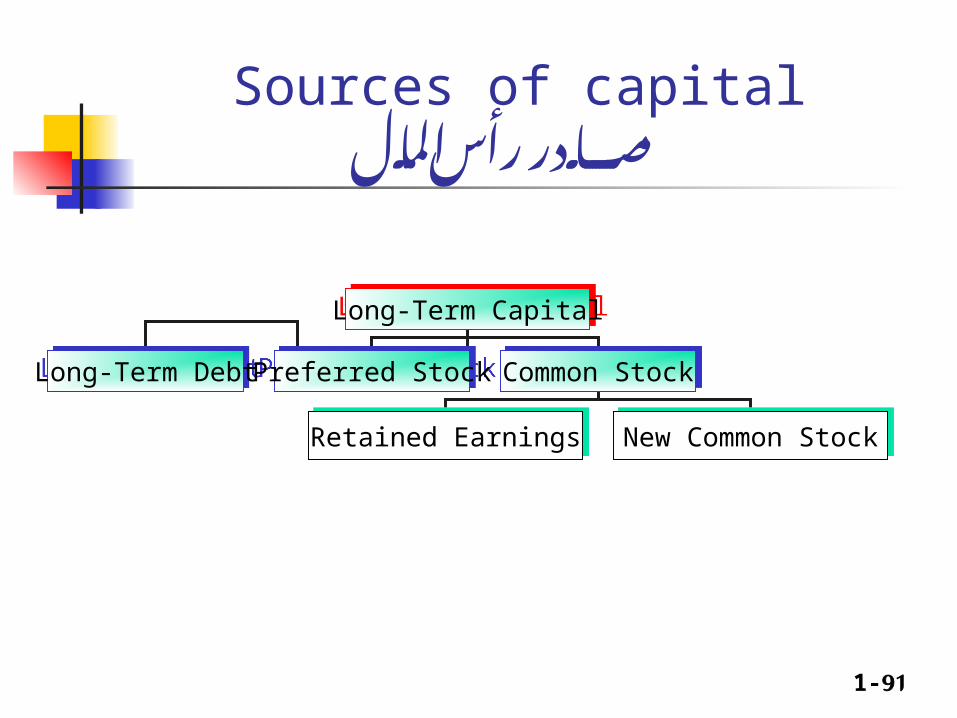
Sources of capitalالمال رأس مصادر
Long-Term CapitalLong-Term Capital
Long-Term DebtLong-Term Debt Preferred StockPreferred Stock Common StockCommon Stock
Retained EarningsRetained Earnings New Common StockNew Common Stock
1-92
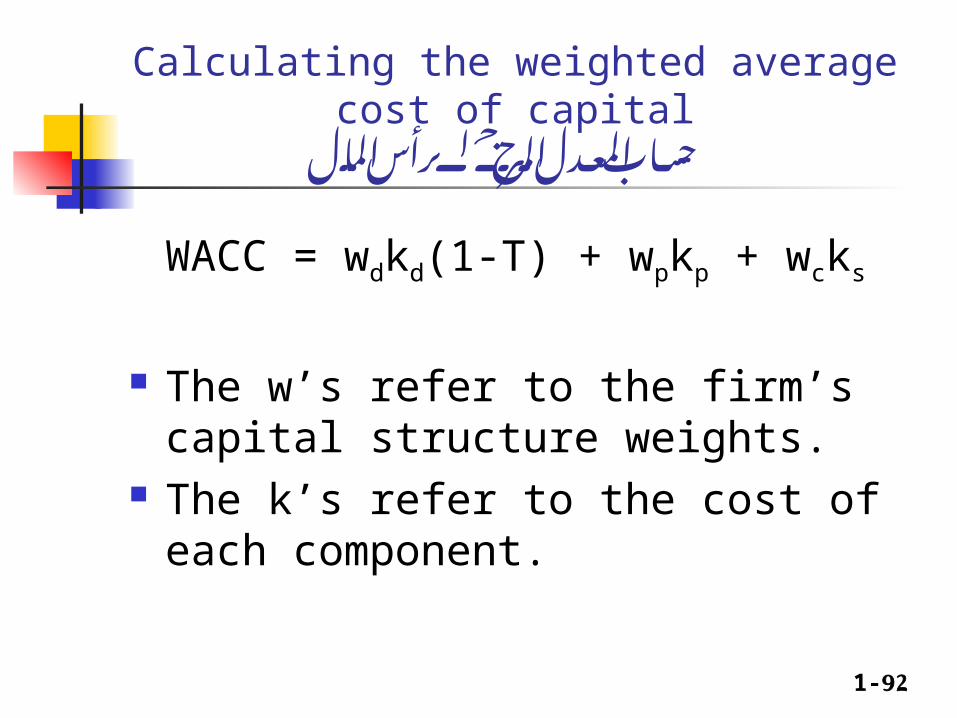
Calculating the weighted average cost of capitalالمال لرأس المرجح المعدل حساب
WACC = wdkd(1-T) + wpkp + wcks
The w’s refer to the firm’s capital structure weights.
The k’s refer to the cost of each component.
1-93
Should our analysis focus on before-tax or after-tax capital costs?
وليس الضريبة بعد المال رأس تكلفة تحسبقبلها
Stockholders focus on A-T CFs. Therefore, we should focus on A-T capital costs, i.e. use A-T costs of capital in WACC. Only kd needs adjustment, because interest is tax deductible.
1-94
Should our analysis focus on historical (embedded) costs or new (marginal) costs?
الجديدة ( االموال على أي حديا المال رأس تكلفة تحسب( القديمة وليس
The cost of capital is used primarily to make decisions that involve raising new capital. So, focus on today’s marginal costs (for WACC).
1-95
How are the weights determined?االوزان حساب
WACC = wdkd(1-T) + wpkp + wcks
Use accounting numbers or market value (book vs. market weights)?
Use actual numbers or target capital structure?
1-96
Component cost of debtالدين تكلفة حساب
WACC = wdkd(1-T) + wpkp + wcks
kd is the marginal cost of debt capital. The yield to maturity on outstanding L-T
debt is often used as a measure of kd.
Why tax-adjust, i.e. why kd(1-T)?
1-97
Component cost of debtالدين تكلفة حساب
Interest is tax deductible, so
A-T kd = B-T kd (1-T)
= 10% (1 - 0.40) = 6% Use nominal rate. Flotation costs are small, so ignore them.
1-98
Component cost of preferred stockالممتازة االسهم تكلفة حساب
WACC = wdkd(1-T) + wpkp + wcks
kp is the marginal cost of preferred stock. The rate of return investors require on the
firm’s preferred stock.

1-99
Component cost of preferred stockالممتازة االسهم تكلفة حساب
The cost of preferred stock can be solved by using this formula:
kp = Dp / Pp
= $10 / $111.10
= 9%
1-100
Component cost of preferred stockالممتازة االسهم تكلفة حساب
Preferred dividends are not tax-deductible, so no tax adjustments necessary. Just use kp.
Nominal kp is used. Our calculation ignores possible flotation
costs.
1-101
Preferred stock riskالممتازة االسهم خطورة
More risky; company not required to pay preferred dividend.
However, firms try to pay preferred dividend. Otherwise, (1) cannot pay common dividend, (2) difficult to raise additional funds, (3) preferred stockholders may gain control of firm.
1-102
Component cost of equityالعادية االسهم تكلفة حساب
WACC = wdkd(1-T) + wpkp + wcks
ks is the marginal cost of common equity using retained earnings.
The rate of return investors require on the firm’s common equity using new equity is ke.
1-103
Why is there a cost for retained earnings?المحجوزة االرباح تكلفة حساب
Earnings can be reinvested or paid out as dividends.
Investors could buy other securities, earn a return. If earnings are retained, there is an opportunity
cost (the return that stockholders could earn on alternative investments of equal risk). Investors could buy similar stocks and earn ks. Firm could repurchase its own stock and earn ks. Therefore, ks is the cost of retained earnings.
1-104
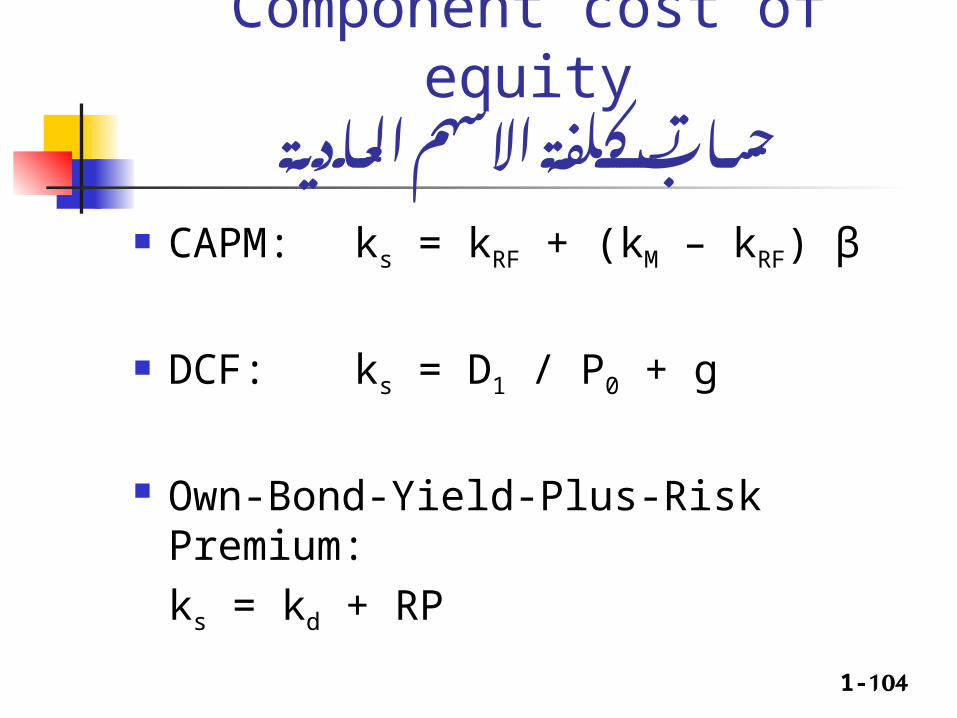
Component cost of equityالعادية االسهم تكلفة حساب
CAPM: ks = kRF + (kM – kRF) β
DCF:ks = D1 / P0 + g
Own-Bond-Yield-Plus-Risk Premium:
ks = kd + RP
1-105
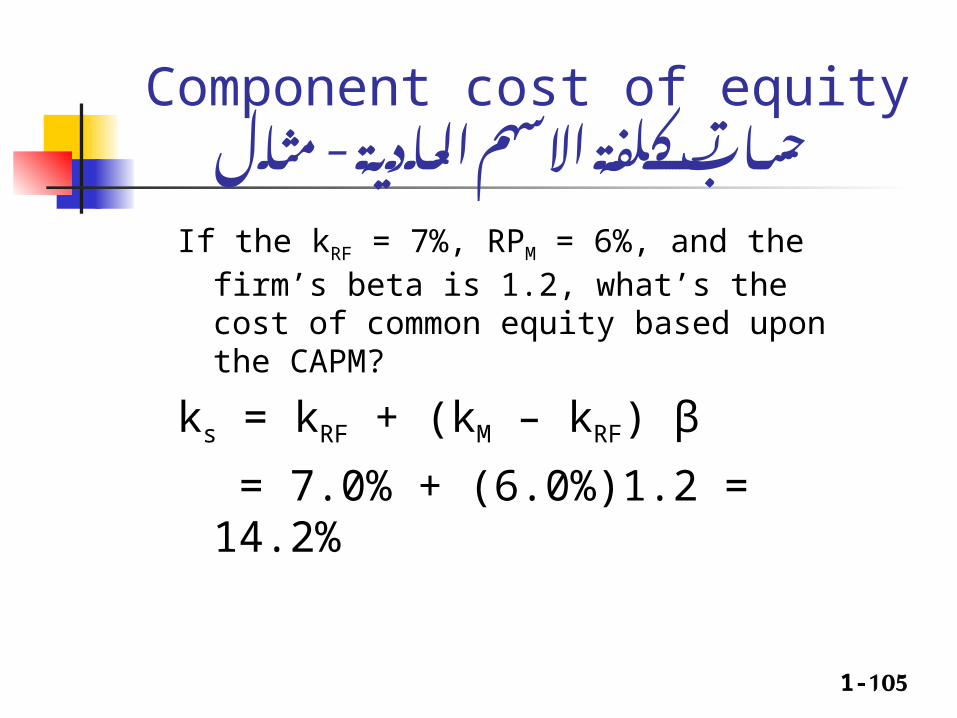
Component cost of equityمثال - العادية االسهم تكلفة حساب
If the kRF = 7%, RPM = 6%, and the firm’s beta is 1.2, what’s the cost of common equity based upon the CAPM?
ks = kRF + (kM – kRF) β
= 7.0% + (6.0%)1.2 = 14.2%
1-106
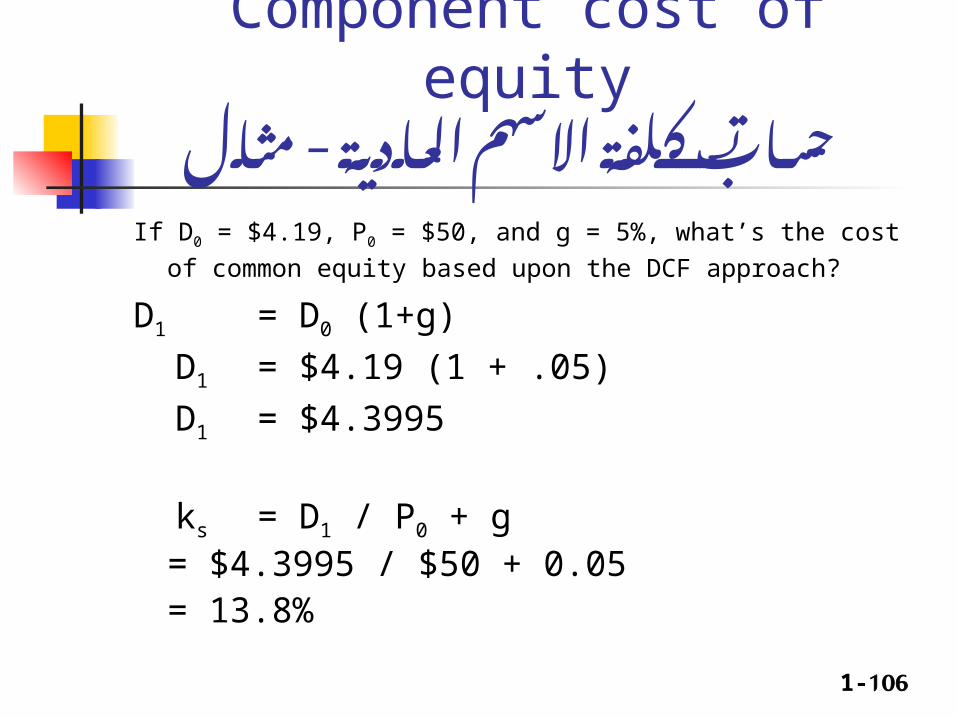
Component cost of equityالعادية - االسهم تكلفة حساب
مثالIf D0 = $4.19, P0 = $50, and g = 5%, what’s the cost of common equity
based upon the DCF approach?
D1 = D0 (1+g)
D1 = $4.19 (1 + .05)
D1 = $4.3995
ks = D1 / P0 + g = $4.3995 / $50 + 0.05= 13.8%
1-107
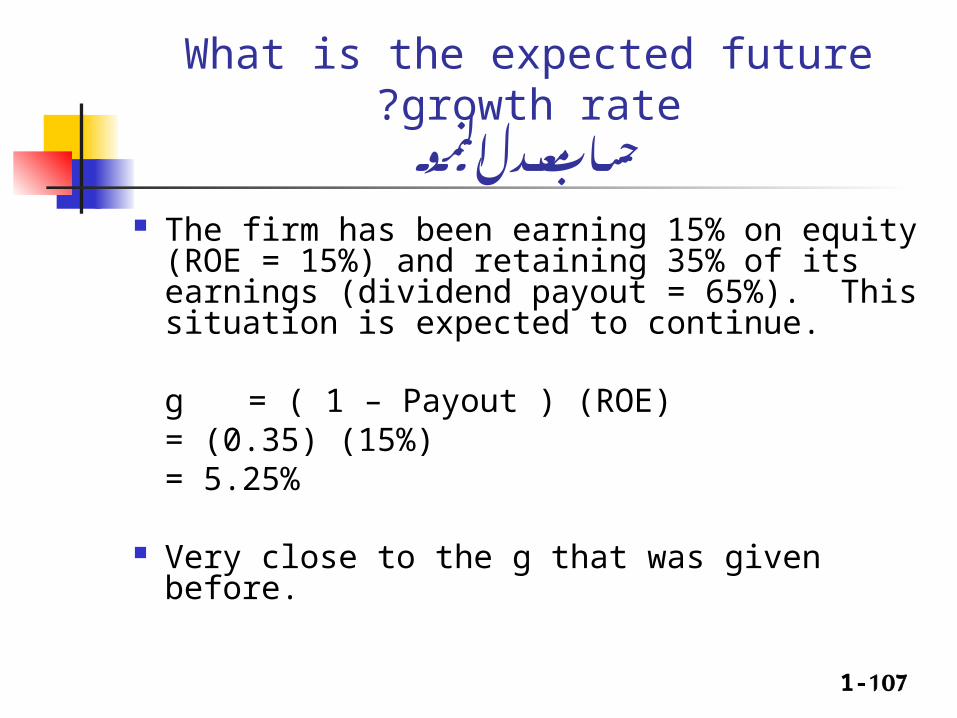
What is the expected future growth rate?النمو معدل حساب
The firm has been earning 15% on equity (ROE = 15%) and retaining 35% of its earnings (dividend payout = 65%). This situation is expected to continue.
g = ( 1 – Payout ) (ROE)= (0.35) (15%)= 5.25%
Very close to the g that was given before.
1-108
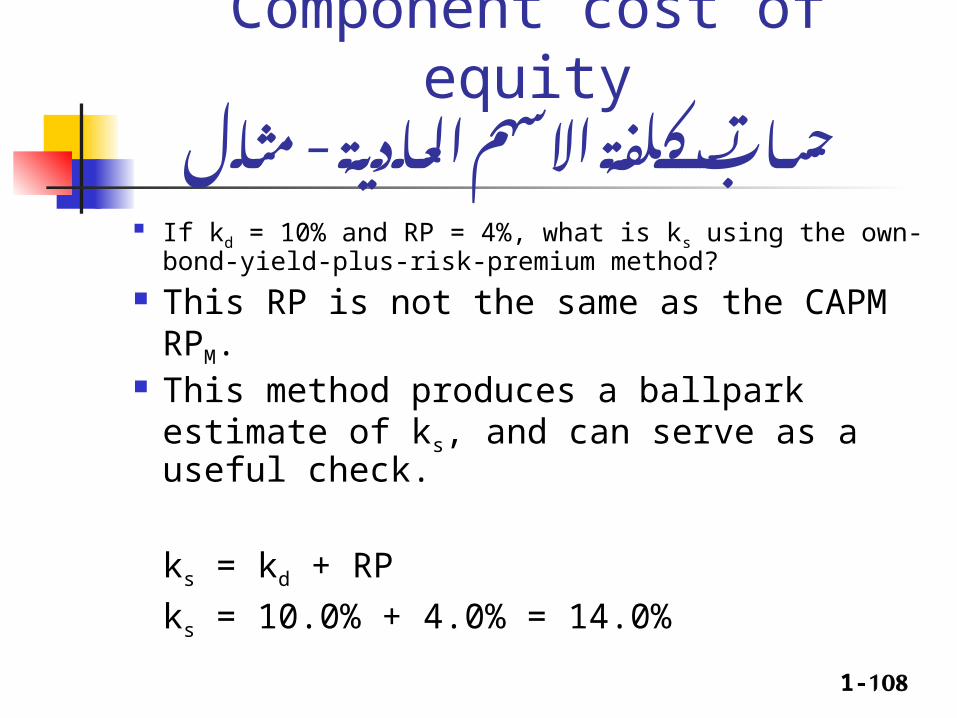
Component cost of equityالعادية - االسهم تكلفة حساب
مثال If kd = 10% and RP = 4%, what is ks using the own-bond-
yield-plus-risk-premium method?
This RP is not the same as the CAPM RPM. This method produces a ballpark estimate
of ks, and can serve as a useful check.
ks = kd + RP
ks = 10.0% + 4.0% = 14.0%

1-109
Component cost of equityالعادية - االسهم تكلفة حساب
مثال
Method Estimate
CAPM 14.2%
DCF 13.8%
kd + RP 14.0%
Average 14.0%
1-110
Component cost of equityالعادية االسهم تكلفة حساب
Why is the cost of retained earnings cheaper than the cost of issuing new common stock?
When a company issues new common stock they also have to pay flotation costs to the underwriter.
Issuing new common stock may send a negative signal to the capital markets, which may depress the stock price.
1-111
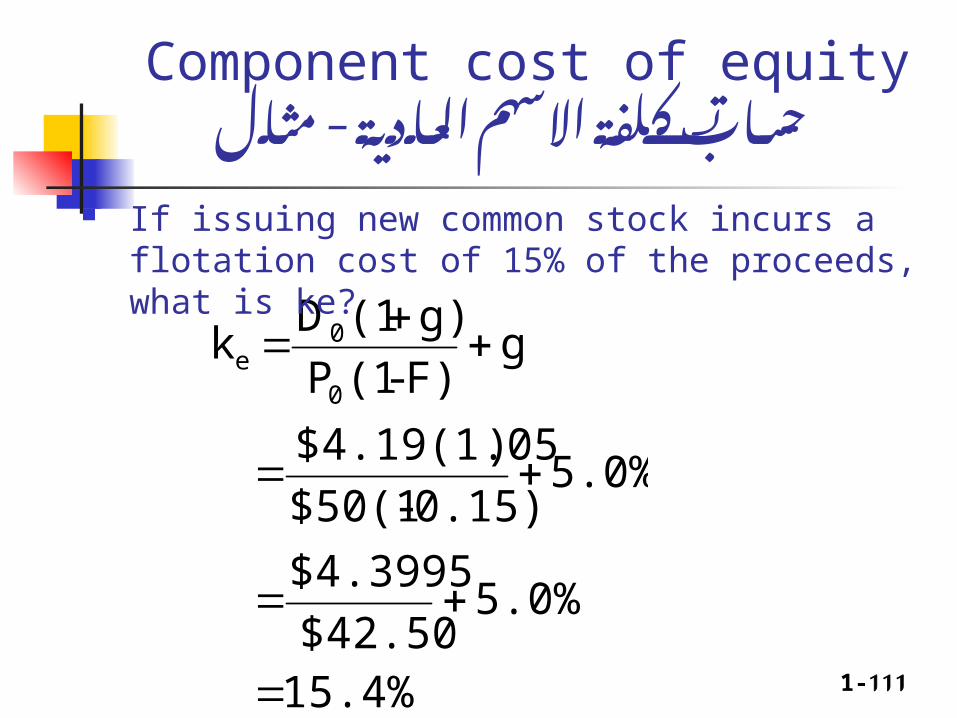
Component cost of equityمثال - العادية االسهم تكلفة حساب
15.4%
5.0% $42.50
$4.3995
5.0% 0.15)-$50(1
)$4.19(1.05
g F)-(1P
g)(1D k
0
0e
If issuing new common stock incurs a flotation cost of 15% of the proceeds, what is ke?
1-112
Flotation costsاالصدار تكاليف
Flotation costs depend on the risk of the firm and the type of capital being raised.
The flotation costs are highest for common equity. However, since most firms issue equity infrequently, the per-project cost is fairly small.
We will frequently ignore flotation costs when calculating the WACC.
1-113
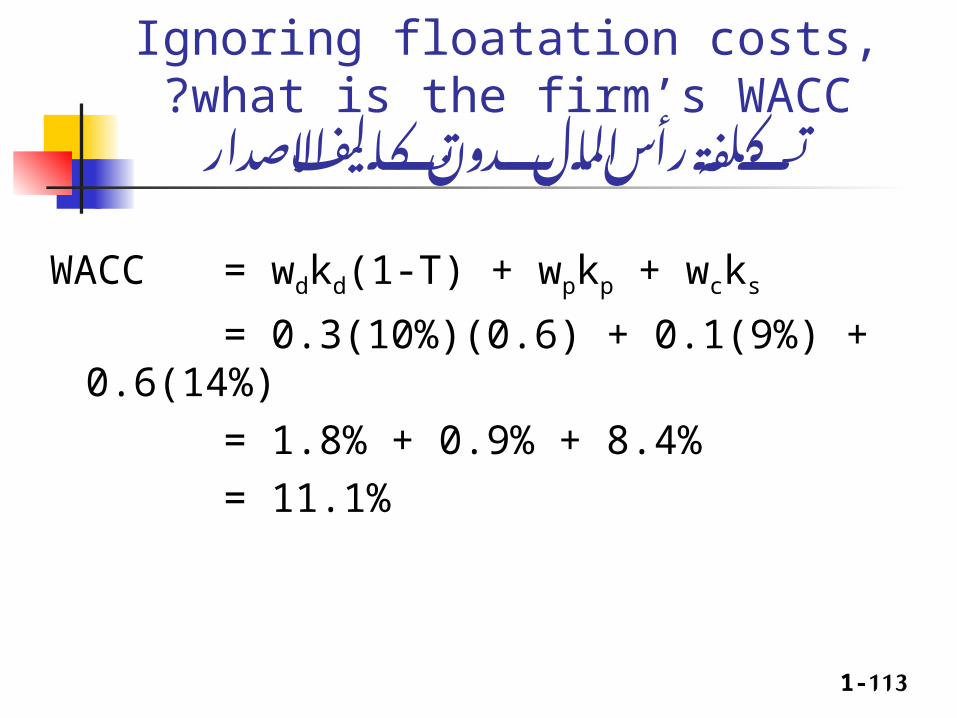
Ignoring floatation costs, what is the firm’s WACC?
االصدار تكاليف بدون المال رأس تكلفة
WACC = wdkd(1-T) + wpkp + wcks
= 0.3(10%)(0.6) + 0.1(9%) + 0.6(14%)
= 1.8% + 0.9% + 8.4%
= 11.1%
1-114
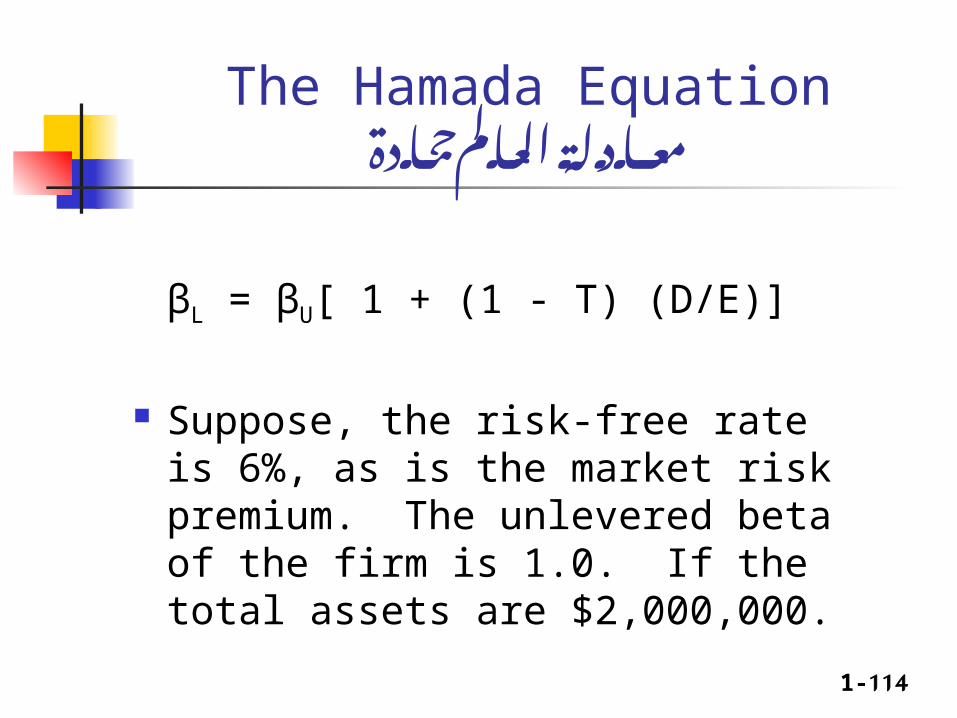
The Hamada Equationحمادة العالم معادلة
βL = βU[ 1 + (1 - T) (D/E)]
Suppose, the risk-free rate is 6%, as is the market risk premium. The unlevered beta of the firm is 1.0. If the total assets are $2,000,000.

1-115
The Hamada Equationمثال - حمادة العالم معادلة
If D = $250,
βL = 1.0 [ 1 + (0.6)($250/$1,750) ]
βL = 1.0857
ks = kRF + (kM – kRF) βL
ks = 6.0% + (6.0%) 1.0857
ks = 12.51%

1-116
Calculating levered betas and costs of equityبيتا معامل على المالي الرفع استخدام عالقة
االسهم وتكلفة
Amount borrowed
$ 0
250
500
750
1,000
D/A ratio
0.00%
12.50
25.00
37.50
50.00
Levered Beta
1.00
1.09
1.20
1.36
1.60
D/E ratio
0.00%
14.29
33.33
60.00
100.00
ks
12.00%
12.51
13.20
14.16
15.60
1-117
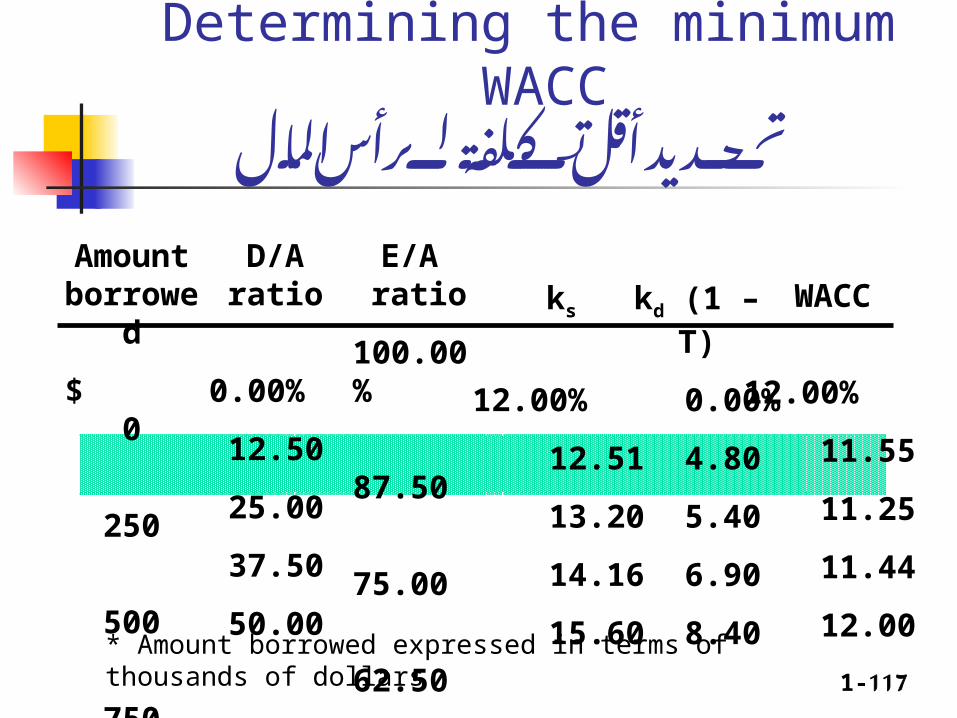
Determining the minimum WACC المال لرأس تكلفة أقل تحديد
D/A ratio
0.00%
12.50
25.00
37.50
50.00
WACC
12.00%
11.55
11.25
11.44
12.00
E/A ratio
100.00%
87.50
75.00
62.50
50.00
ks
12.00%
12.51
13.20
14.16
15.60
kd (1 – T)
0.00%
4.80
5.40
6.90
8.40
Amount borrowed
$ 0
250
500
750
1,000
* Amount borrowed expressed in terms of thousands of dollars

1-118
Determining the stock price maximizing capital structure
اعلى ينتج الذي المال رأس هيكل تحديدللسهم سعر
AmountBorrowed DPS ks P0
$ 0 $3.00 12.00% $25.00
250,000 3.26 12.51
500,000 3.55 13.20
26.03
26.89
750,000 3.77 14.16 26.59
1,000,000 3.90 15.60 25.00
1-119
Financial Planning and Forecastingاساسيات – المالي والتخطيط التنبؤ
التسعير
Forecasting sales Projecting the assets and internally
generated funds Projecting outside funds needed Deciding how to raise funds
1-120
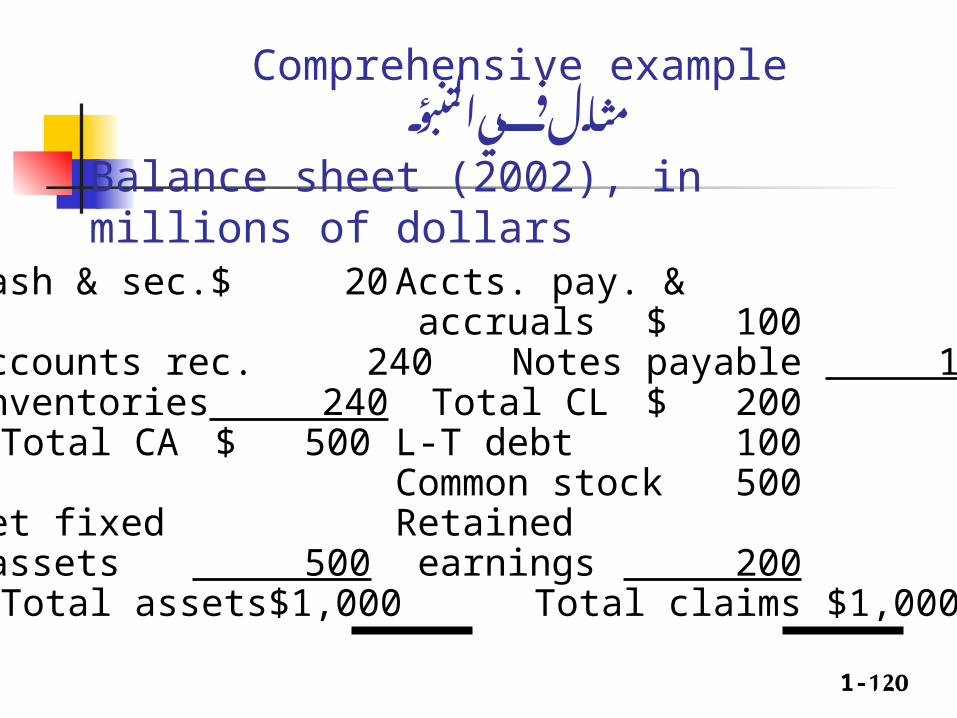
Comprehensive exampleالتنبؤ مثال في
Cash & sec. $ 20 Accts. pay. & accruals $ 100
Accounts rec. 240 Notes payable 100Inventories 240 Total CL $ 200
Total CA $ 500 L-T debt 100Common stock 500
Net fixed Retained assets 500 earnings 200
Total assets $1,000 Total claims $1,000
Balance sheet (2002), in millions of dollars
1-121
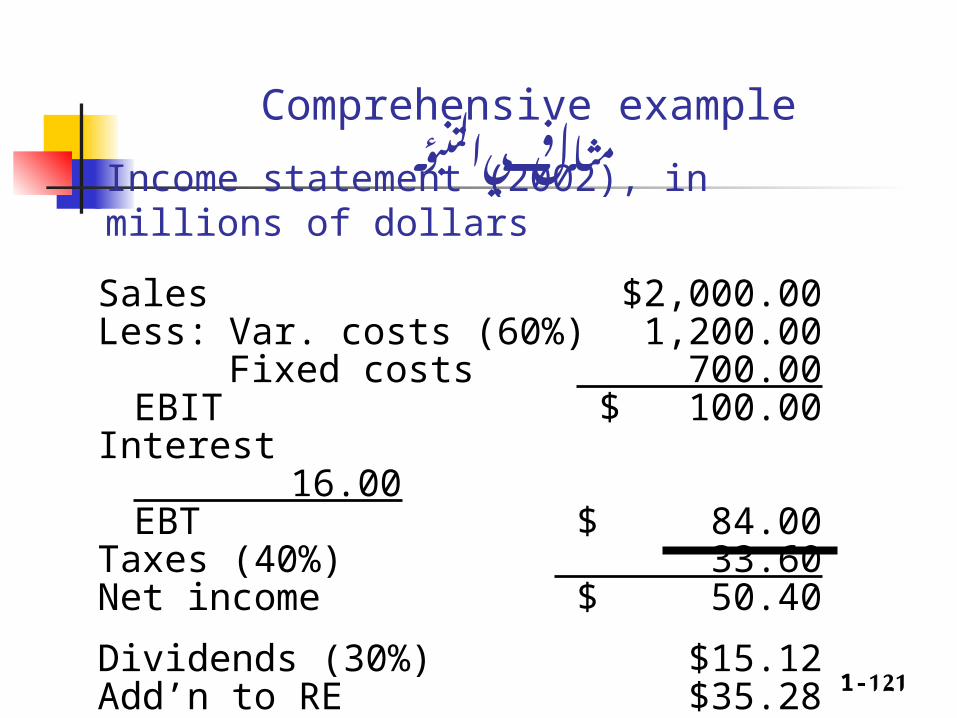
Comprehensive exampleالتنبؤ في مثال
Sales $2,000.00Less: Var. costs (60%) 1,200.00
Fixed costs 700.00EBIT $ 100.00
Interest 16.00EBT $ 84.00
Taxes (40%) 33.60Net income $ 50.40
Dividends (30%) $15.12Add’n to RE $35.28
Income statement (2002), in millions of dollars
1-122
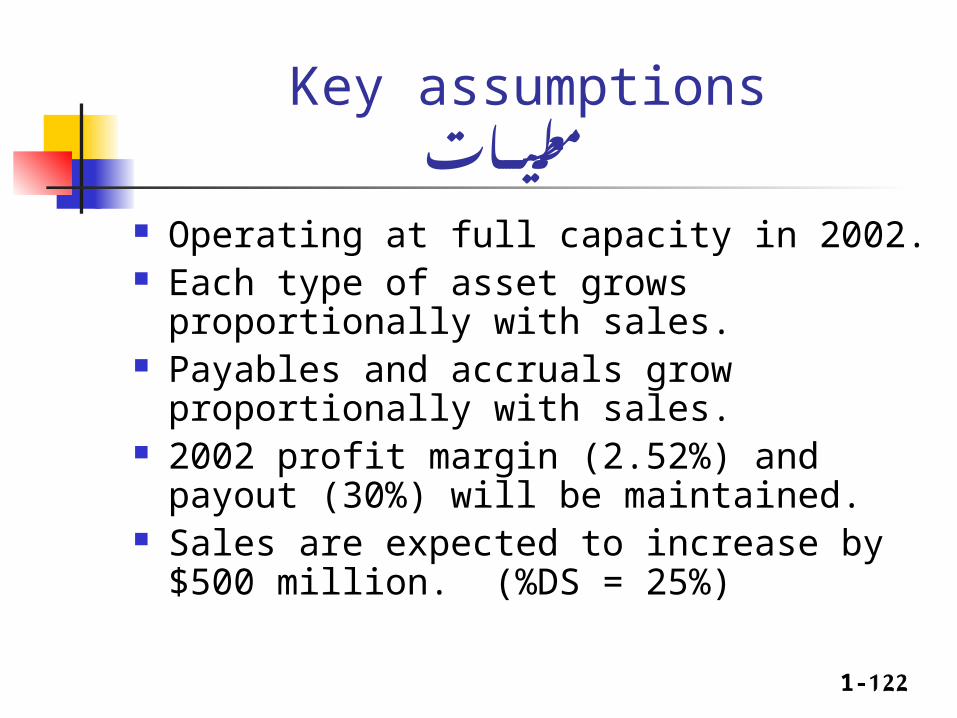
Key assumptionsمعطيات
Operating at full capacity in 2002. Each type of asset grows proportionally with sales. Payables and accruals grow proportionally with
sales. 2002 profit margin (2.52%) and payout (30%) will
be maintained. Sales are expected to increase by $500 million.
(%DS = 25%)

1-123
Determining additional funds needed AFNاضافي تمويل الى الحاجة حساب
AFN = (A*/S0)ΔS – (L*/S0) ΔS – M(S1)(RR)
= ($1,000/$2,000)($500)
– ($100/$2,000)($500)
– 0.0252($2,500)(0.7)
= $180.9 million.

1-124
How shall AFN be raised?االضافية االموال على الحصول كيفية
The payout ratio will remain at 30 percent (d = 30%; RR = 70%).
No new common stock will be issued. Any external funds needed will be raised as
debt, 50% notes payable and 50% L-T debt.
1-125
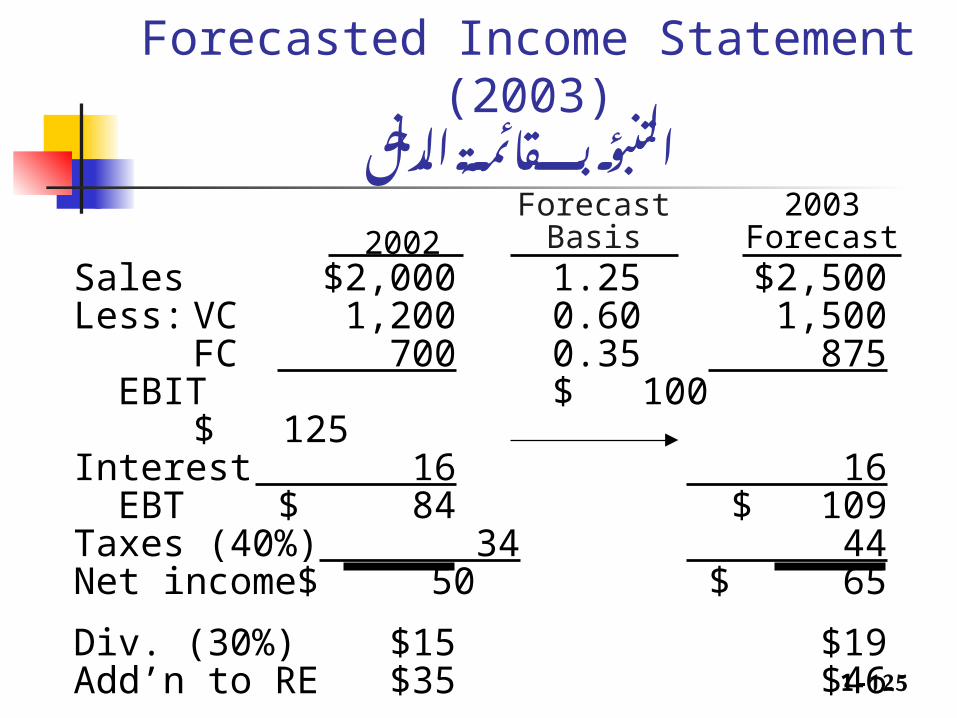
Forecasted Income Statement (2003)الدخل بقائمة التنبؤ
Sales $2,000 1.25 $2,500Less: VC 1,200 0.60 1,500
FC 700 0.35 875 EBIT $ 100 $ 125Interest 16 16 EBT $ 84 $ 109Taxes (40%) 34 44Net income $ 50 $ 65
Div. (30%) $15 $19Add’n to RE $35 $46
ForecastBasis
2003Forecast2002

1-126
20031st Pass
Forecasted Balance Sheet (2003) - Assetsالمالي المركز بقائمة االصول - التنبؤ
2002Forecast
Basis
Cash $ 20 0.01 $ 25Accts. rec. 240 0.12 300Inventories 240 0.12 300 Total CA $ 500 $ 625Net FA 500 0.25 625 Total assets $1,000 $1,250
1-127
20031st Pass2002
ForecastBasis
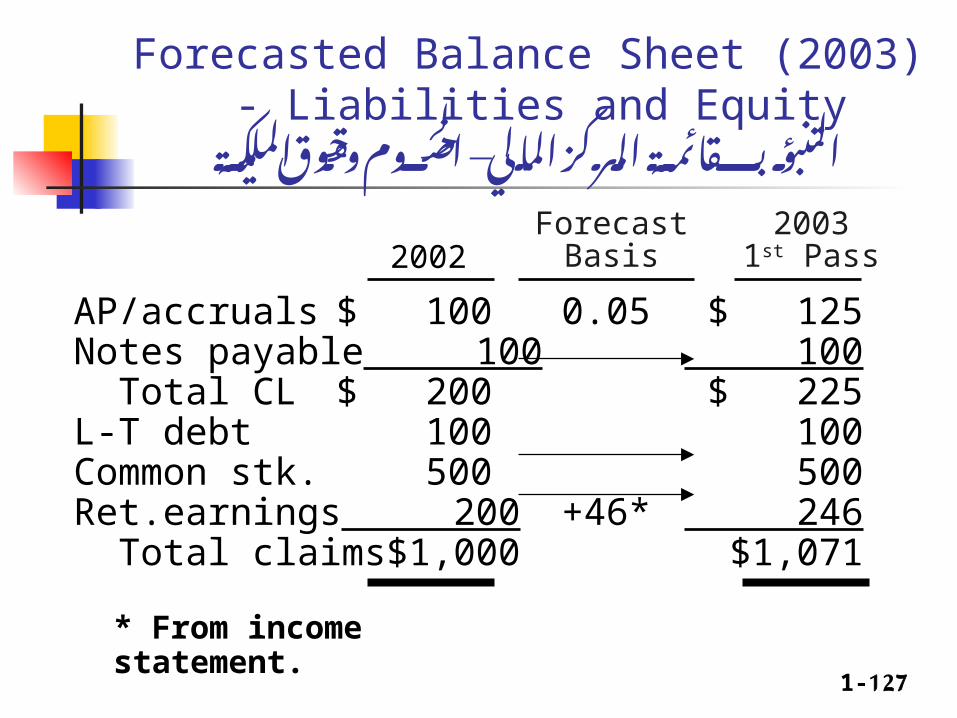
Forecasted Balance Sheet (2003) - Liabilities and Equity
وحقوق – الخصوم المالي المركز بقائمة التنبؤالملكية
AP/accruals $ 100 0.05 $ 125Notes payable 100 100 Total CL $ 200 $ 225L-T debt 100 100Common stk. 500 500Ret.earnings 200 +46* 246 Total claims $1,000 $1,071
* From income statement.
1-128
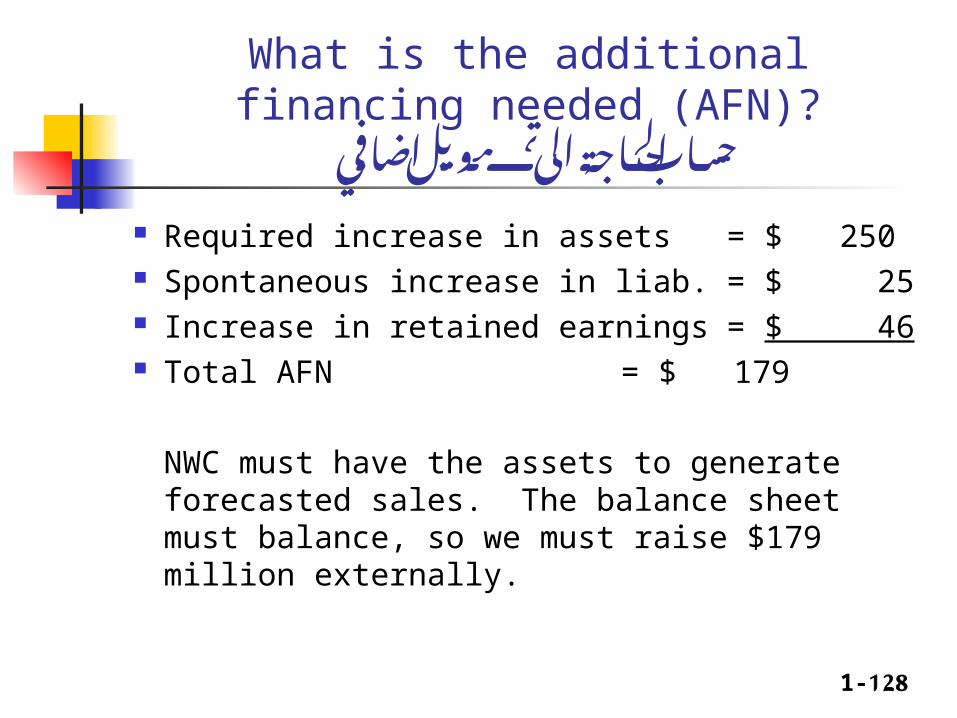
What is the additional financing needed (AFN)?
اضافي تمويل الى الحاجة حساب
Required increase in assets = $ 250 Spontaneous increase in liab. = $ 25 Increase in retained earnings = $ 46 Total AFN = $ 179
NWC must have the assets to generate forecasted sales. The balance sheet must balance, so we must raise $179 million externally.
1-129
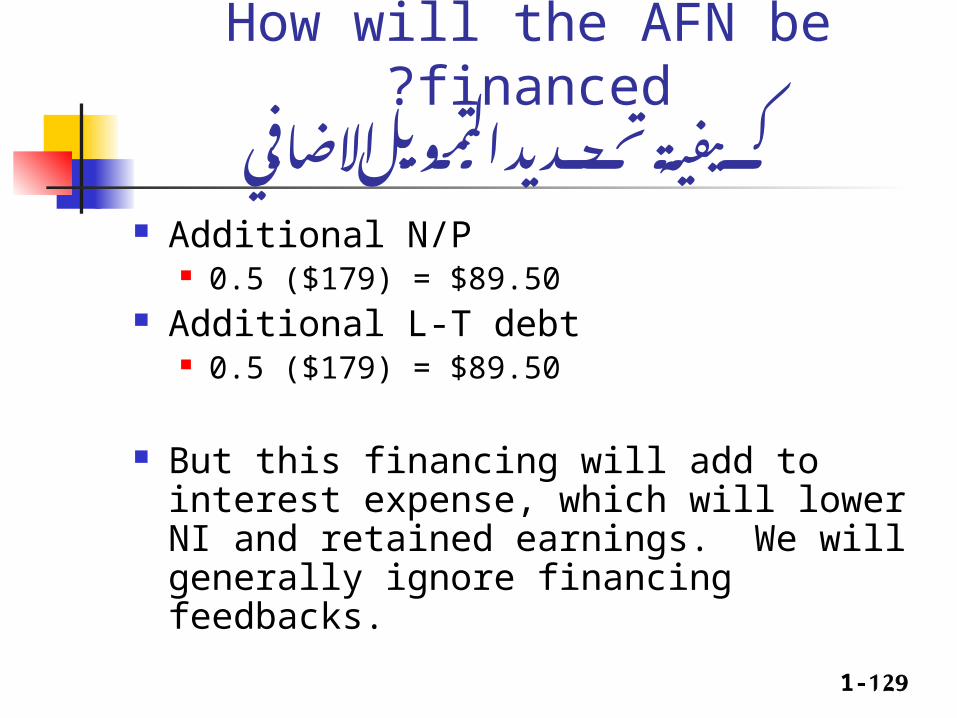
How will the AFN be financed?االضافي التمويل تحديد كيفية
Additional N/P 0.5 ($179) = $89.50
Additional L-T debt 0.5 ($179) = $89.50
But this financing will add to interest expense, which will lower NI and retained earnings. We will generally ignore financing feedbacks.

1-130
20032nd Pass
20031st Pass AFN
Forecasted Balance Sheet (2003) - Assetsالمالي المركز بقائمة حساب - التنبؤ بعد االصول
االضافي التمويل
Cash $ 25 - $ 25Accts. rec. 300 - 300Inventories 300 - 300 Total CA $ 625 $ 625Net FA 625 - 625 Total assets $1,250 $1,250
1-131
20032nd Pass
20031st Pass AFN
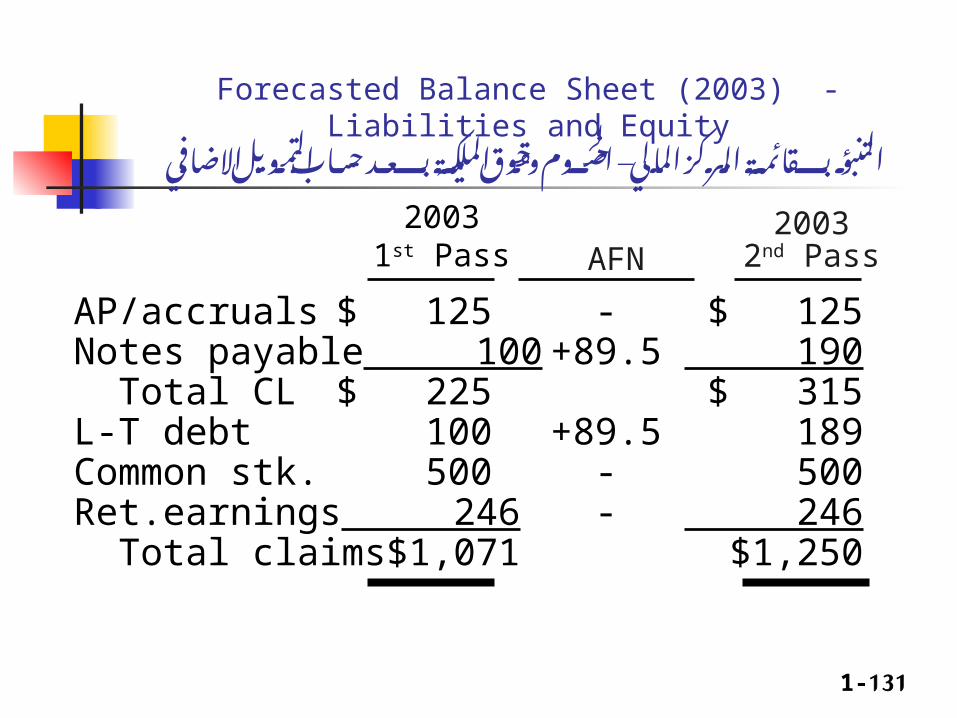
Forecasted Balance Sheet (2003) - Liabilities and Equityحساب – بعد الملكية وحقوق الخصوم المالي المركز بقائمة التنبؤ
االضافي التمويل
AP/accruals $ 125 - $ 125Notes payable 100 +89.5 190 Total CL $ 225 $ 315L-T debt 100 +89.5 189Common stk. 500 - 500Ret.earnings 246 - 246 Total claims $1,071 $1,250
1-132
Why do the AFN equation and financial statement method have different results?
Equation method assumes a constant profit margin, a constant dividend payout, and a constant capital structure.
Financial statement method is more flexible. More important, it allows different items to grow at different rates.


