© Ricardo-AEA Ltd
www.ricardo-aea.com
26.08.2013Summer School 2013
Tracking Progress and MRV for Greenhouse Gas Emission Reductions
Sina Wartmann
MRV systems at different aggregation levels
© Ricardo-AEA LtdRicardo-AEA in Confidence2
• Objectives and principles of a domestic MRV system
• Top-down vs bottom up
• Standardisation and coordination
• Example cases
• Summary
This presentation

© Ricardo-AEA LtdRicardo-AEA in Confidence3
Objectives of a domestic MRV system
• Clear picture of mitigation measures
– To increase transparency
– To inform future decisions on climate change responses
• To provide an assessment of the impacts and effectiveness of climate change response measures
– Emissions impacts
– Non-GHG impacts: co-benefits, negative impact, transformational change
– Costs
• A more efficient, joined-up approach to mitigation MRV
3

© Ricardo-AEA LtdRicardo-AEA in Confidence4
Principles
• Simplification
• Timeliness
• Accuracy
• Transparency and confidentiality
• Relevance
• Influential (on policy development)
• Flexibility (but also certainty)
• Good communication and cooperation
4

© Ricardo-AEA LtdRicardo-AEA in Confidence5
Domestic MRV: Top-down vs bottom -up
5
Top down:Start from the big picture, analyse impacts of measures
Bottom-up:Start from measures, aggregate to form big picture
© Ricardo-AEA LtdRicardo-AEA in Confidence6
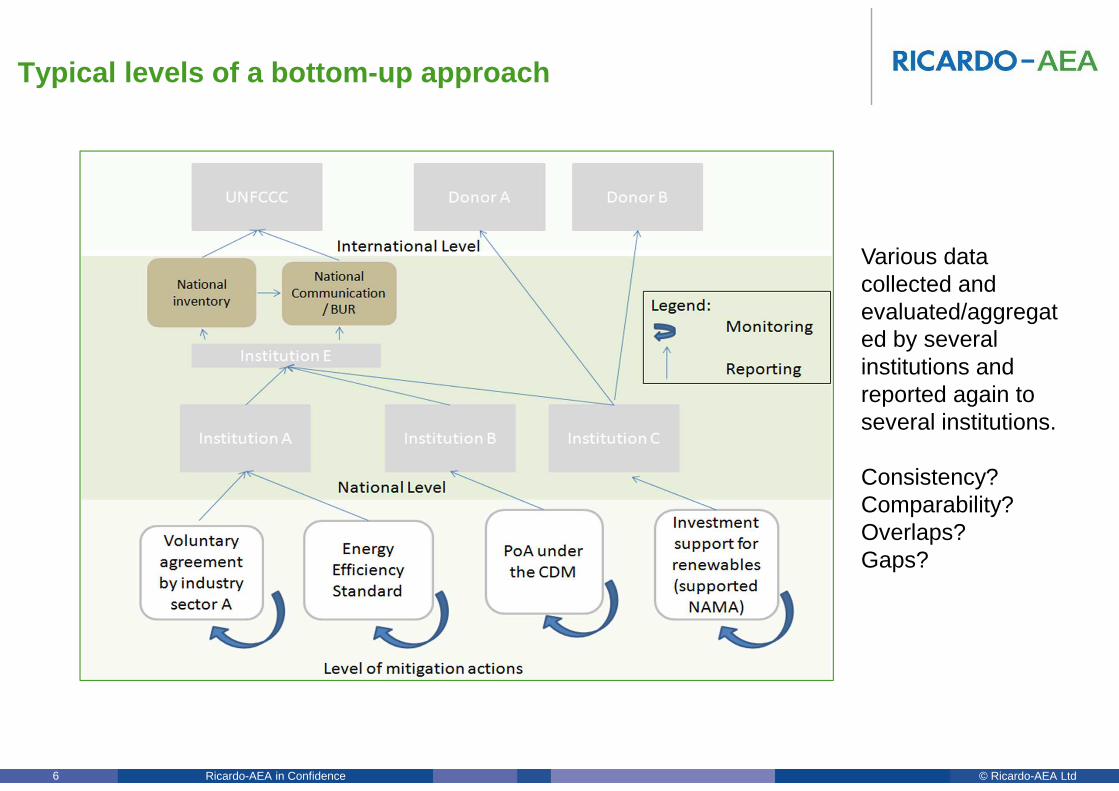
Typical levels of a bottom -up approach
Various data collected and evaluated/aggregated by several institutions and reported again to several institutions.
Consistency?Comparability?Overlaps?Gaps?

© Ricardo-AEA LtdRicardo-AEA in Confidence7
If you want a MEANINGFUL result you should only add up comparable information, meaning information which is
• Of the same type
• Of comparable accuracy
• Using the same units
• Based on the same assumptions (e.g. related to a baseline) and the same approaches (e.g. using the same emission factor)
• Free from overlaps
What can be added up?
© Ricardo-AEA LtdRicardo-AEA in Confidence8
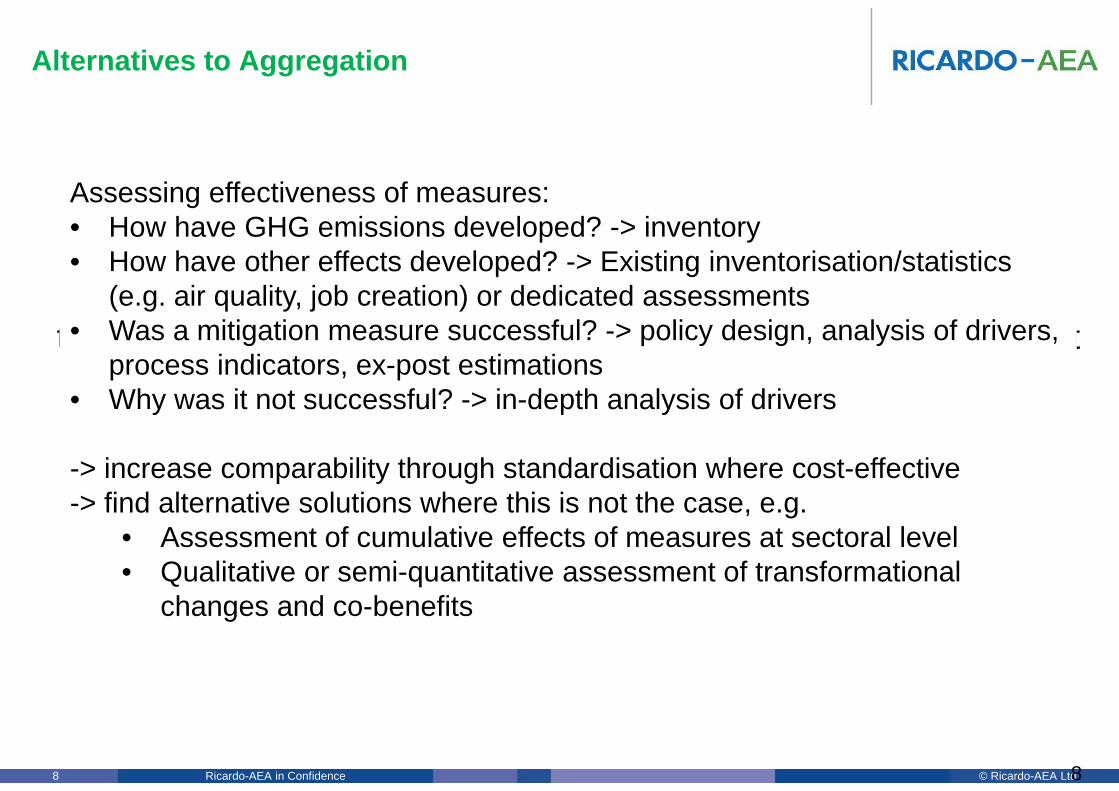
Alternatives to Aggregation
Ideally you would like to add the effects of all mitigation measures to one handy figure. In practice, this is usually not possible. But is it
actually necessary?
8
Assessing effectiveness of measures:• How have GHG emissions developed? -> inventory• How have other effects developed? -> Existing inventorisation/statistics
(e.g. air quality, job creation) or dedicated assessments• Was a mitigation measure successful? -> policy design, analysis of drivers,
process indicators, ex-post estimations• Why was it not successful? -> in-depth analysis of drivers
-> increase comparability through standardisation where cost-effective-> find alternative solutions where this is not the case, e.g.
• Assessment of cumulative effects of measures at sectoral level• Qualitative or semi-quantitative assessment of transformational
changes and co-benefits

© Ricardo-AEA LtdRicardo-AEA in Confidence9
Example Case: Inventories of UK Devolved Administr ations
9
© Ricardo-AEA LtdRicardo-AEA in Confidence10
10
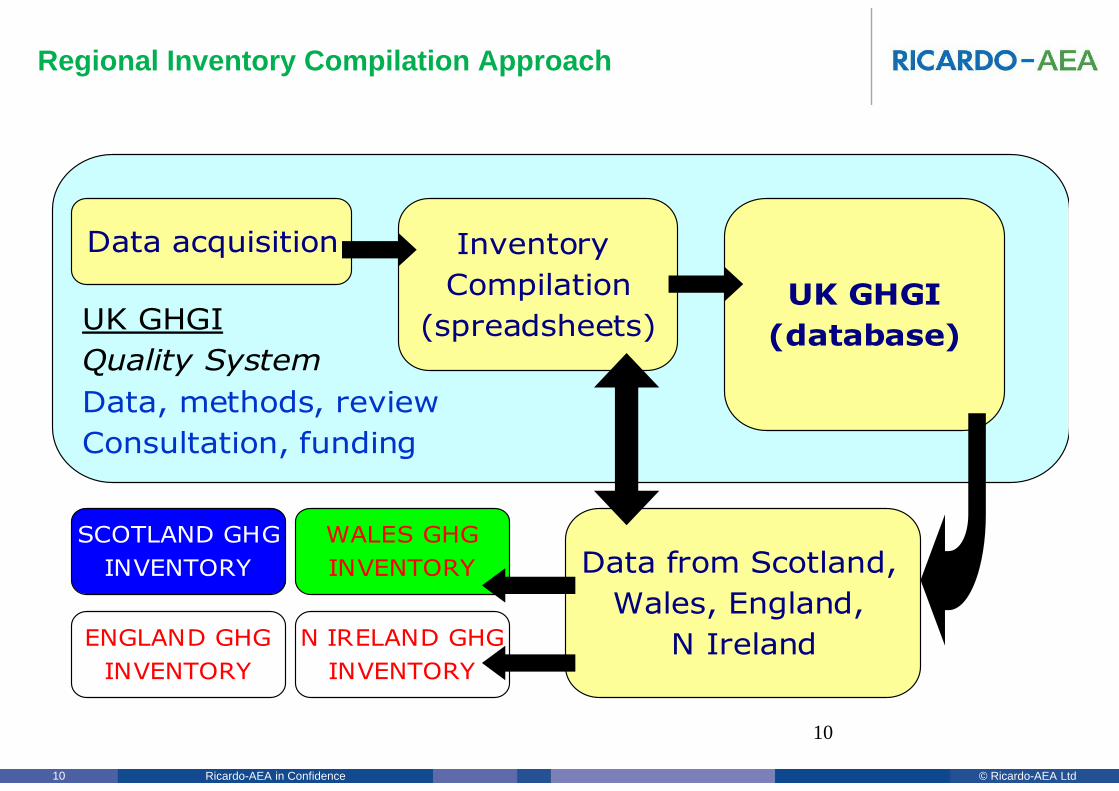
Regional Inventory Compilation Approach
N IRELAND GHG
INVENTORY
WALES GHG
INVENTORY
UK GHGI
Quality System
Data, methods, review
Consultation, funding
Data acquisition Inventory
Compilation
(spreadsheets)UK GHGI
(database)
Data from Scotland,
Wales, England,
N Ireland
SCOTLAND GHG
INVENTORY
ENGLAND GHG
INVENTORY

© Ricardo-AEA LtdRicardo-AEA in Confidence11
Example Case: MRV of UK Climate Change Act
11
© Ricardo-AEA LtdRicardo-AEA in Confidence12
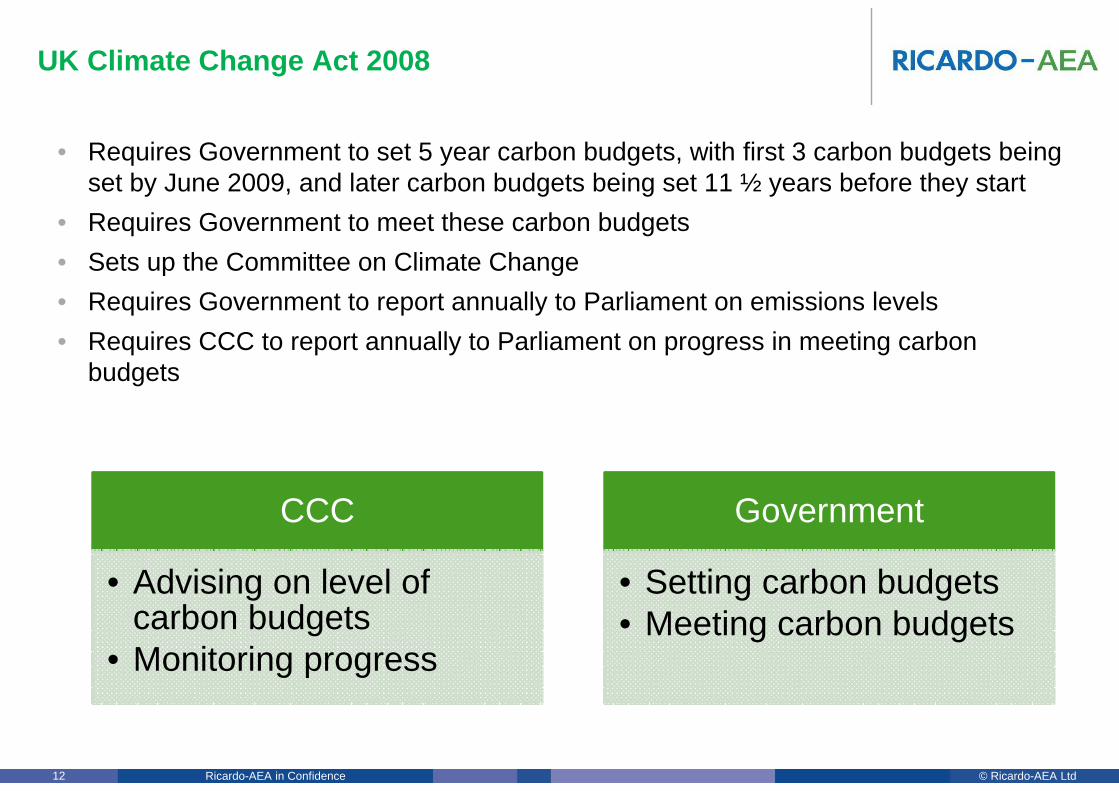
UK Climate Change Act 2008
• Requires Government to set 5 year carbon budgets, with first 3 carbon budgets being set by June 2009, and later carbon budgets being set 11 ½ years before they start
• Requires Government to meet these carbon budgets
• Sets up the Committee on Climate Change
• Requires Government to report annually to Parliament on emissions levels
• Requires CCC to report annually to Parliament on progress in meeting carbon budgets
CCC
• Advising on level of carbon budgets
• Monitoring progress
Government
• Setting carbon budgets• Meeting carbon budgets
© Ricardo-AEA LtdRicardo-AEA in Confidence13
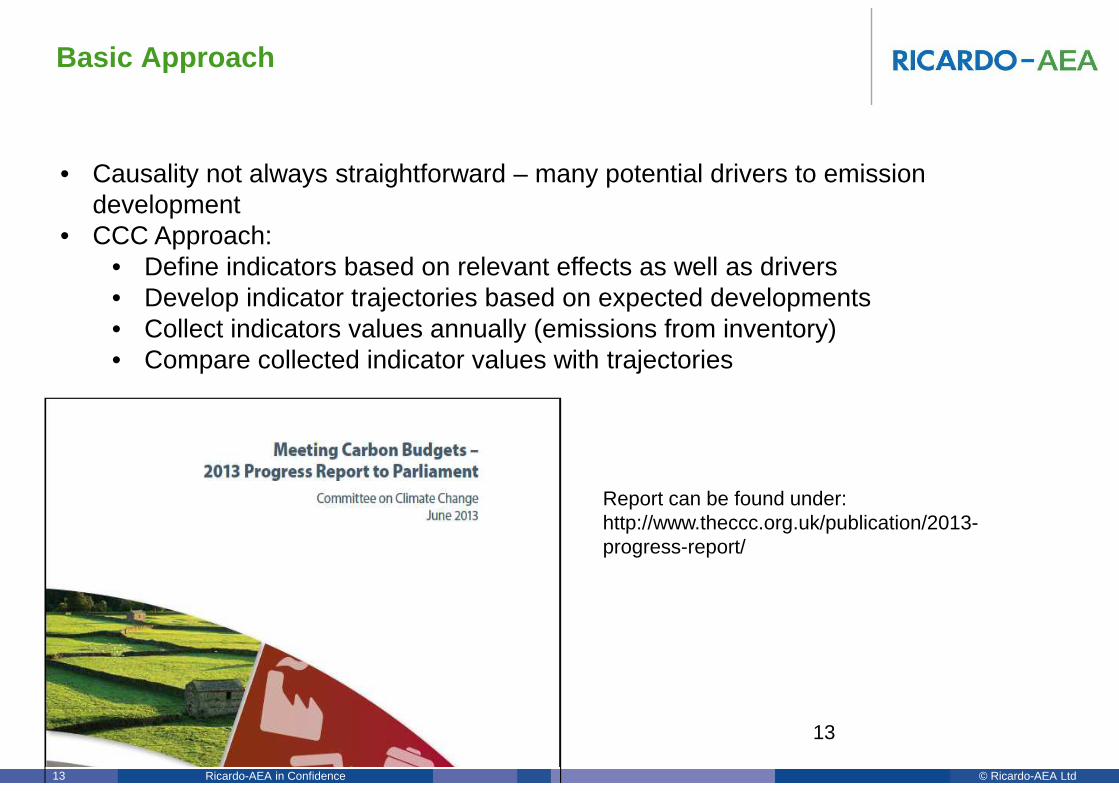
Basic Approach
13
• Causality not always straightforward – many potential drivers to emission development
• CCC Approach: • Define indicators based on relevant effects as well as drivers• Develop indicator trajectories based on expected developments• Collect indicators values annually (emissions from inventory)• Compare collected indicator values with trajectories
Report can be found under:http://www.theccc.org.uk/publication/2013-progress-report/

© Ricardo-AEA LtdRicardo-AEA in Confidence14
Budgets, trajectories and real emissions
14

© Ricardo-AEA LtdRicardo-AEA in Confidence15
Development of the residential sector
15
• Emissions rose by 12% between 2011 and 2012• Direct emissions rose by 10% - which can be fully explained by lower temperatures• Indirect emisions increased by 11% of which 10% stem from an increase in grid emission
intensity (fuel switch from gas to coal) and the rest from the lower temperaturs• Overall downwards tendency, but likely slower than the trajectory requires
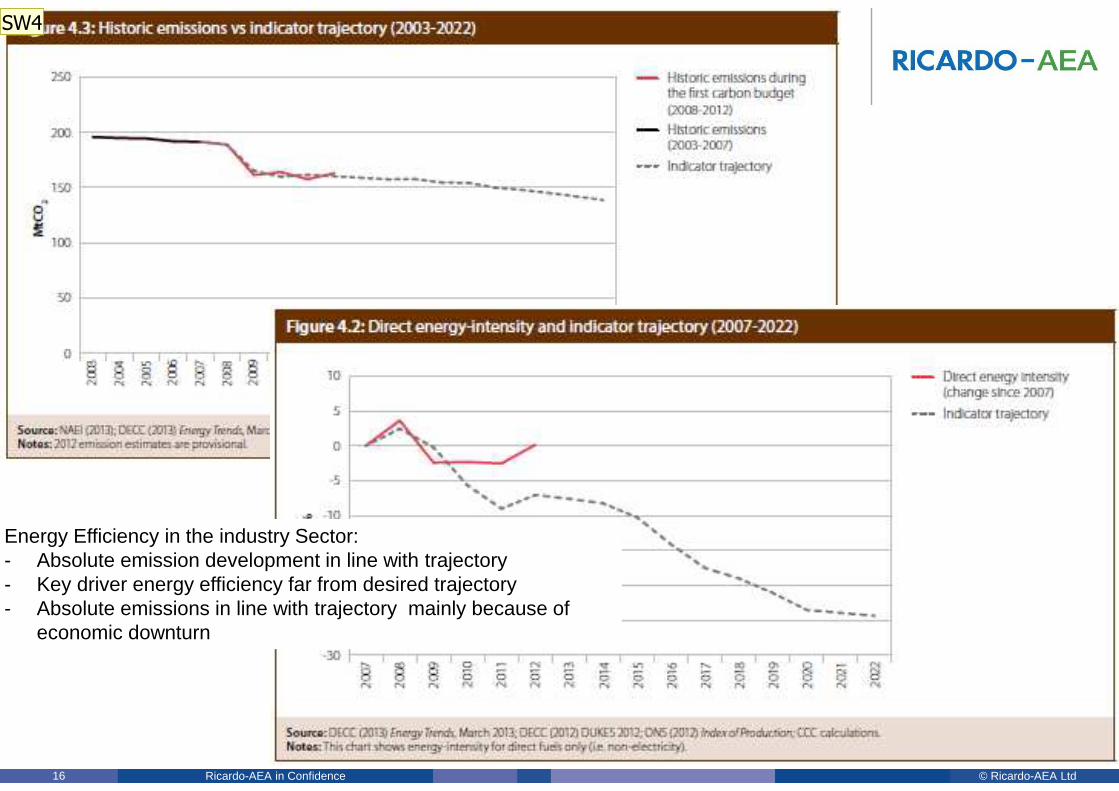
© Ricardo-AEA LtdRicardo-AEA in Confidence16
16
Energy Efficiency in the industry Sector:- Absolute emission development in line with trajectory- Key driver energy efficiency far from desired trajectory- Absolute emissions in line with trajectory mainly because of
economic downturn
SW4

Folie 16
SW4 James, this will be animated.Sina Wartmann; 12.08.2013
© Ricardo-AEA LtdRicardo-AEA in Confidence17
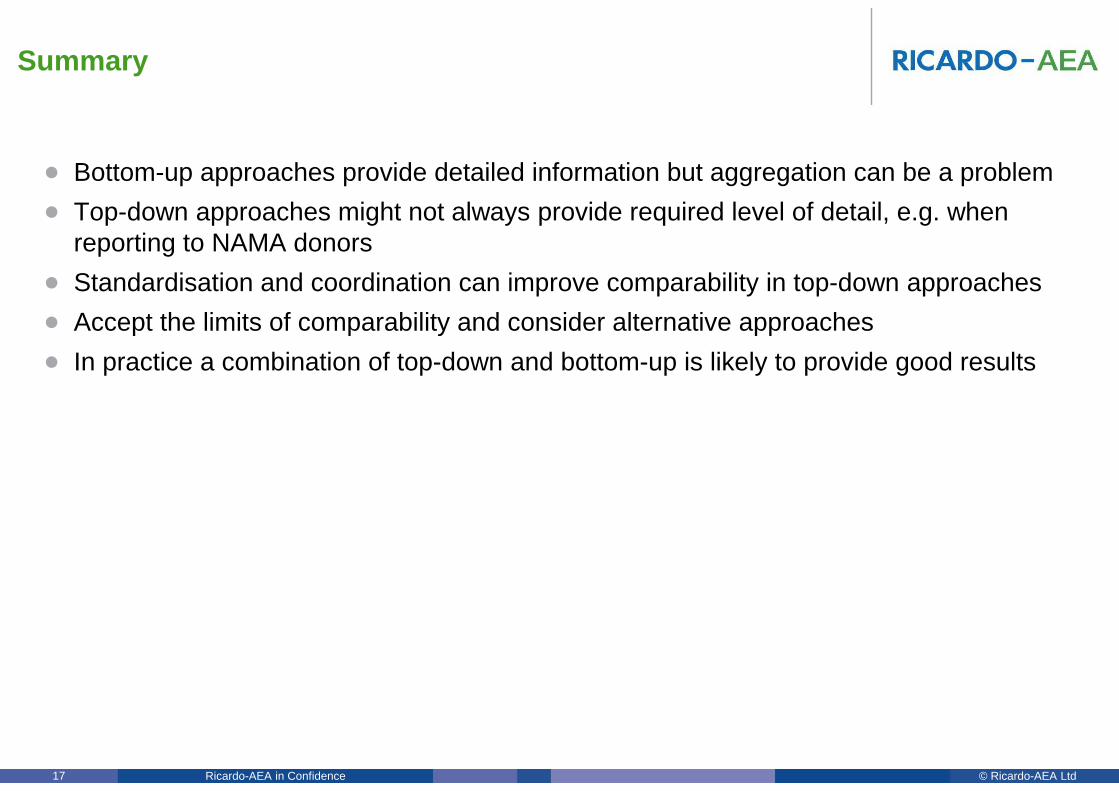
• Bottom-up approaches provide detailed information but aggregation can be a problem
• Top-down approaches might not always provide required level of detail, e.g. when reporting to NAMA donors
• Standardisation and coordination can improve comparability in top-down approaches
• Accept the limits of comparability and consider alternative approaches
• In practice a combination of top-down and bottom-up is likely to provide good results
Summary

© Ricardo-AEA Ltd
www.ricardo-aea.com
T:E: W:
Ricardo-AEA LtdThe Gemini BuildingFermi AvenueHarwell, Didcot, OX11 0QR
Sina Wartmann
+44 1235 75 [email protected]
Sir Harry Ricardo(26 January 1885 – 18 May 1974)
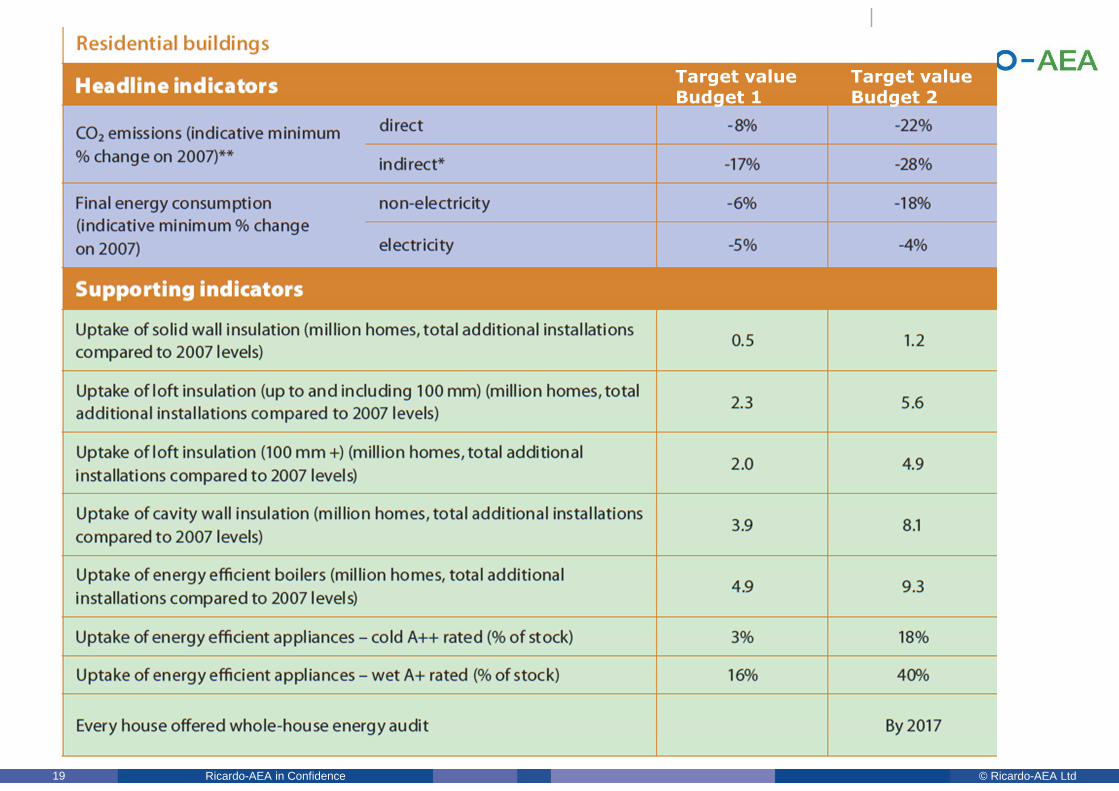
© Ricardo-AEA LtdRicardo-AEA in Confidence19
19
Target value Budget 1
Target value Budget 2

© Ricardo-AEA LtdRicardo-AEA in Confidence20
20
Sub national
GHG inventory scale hierarchy
National
City
$$
Data extent Data quality Methodologies
IPCC
WRILocal
Local
CoherentComplete
High
Extensive Highly variable

© Ricardo-AEA LtdRicardo-AEA in Confidence21
Data and information
21
© Ricardo-AEA LtdRicardo-AEA in Confidence22
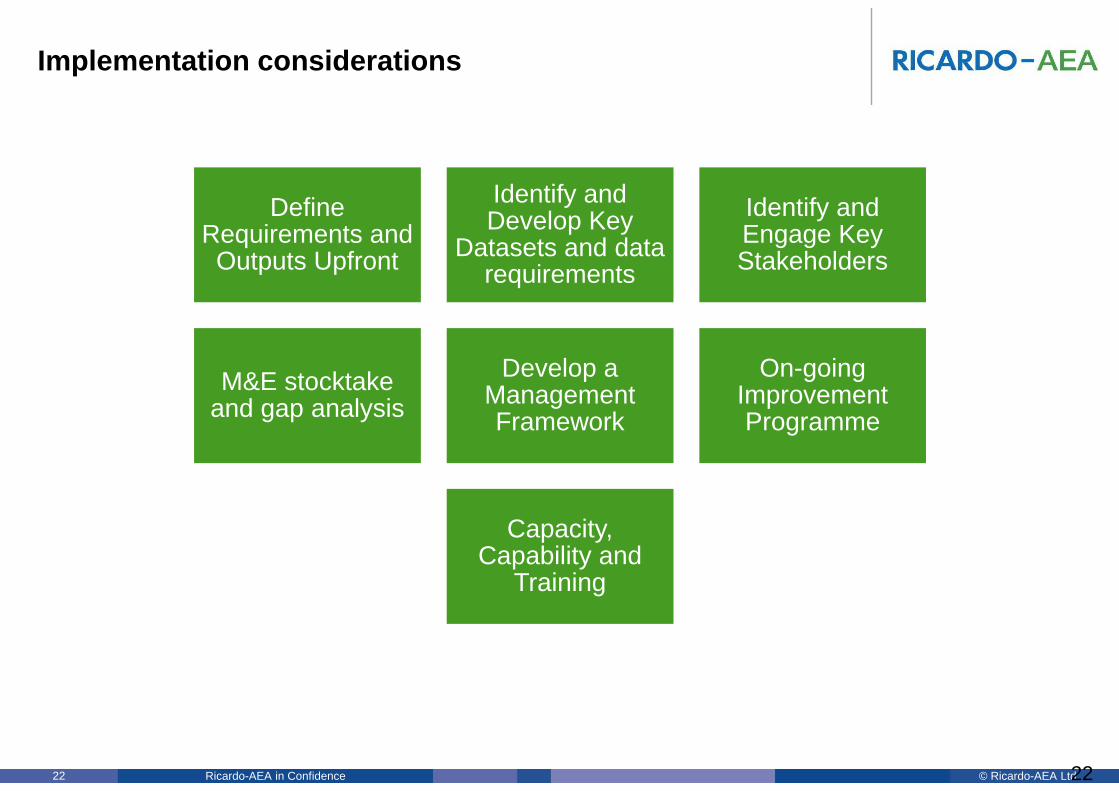
Implementation considerations
22
Define Requirements and Outputs Upfront
Identify and Develop Key
Datasets and data requirements
Identify and Engage Key Stakeholders
M&E stocktake and gap analysis
Develop a Management Framework
On-going Improvement Programme
Capacity, Capability and
Training
© Ricardo-AEA LtdRicardo-AEA in Confidence23
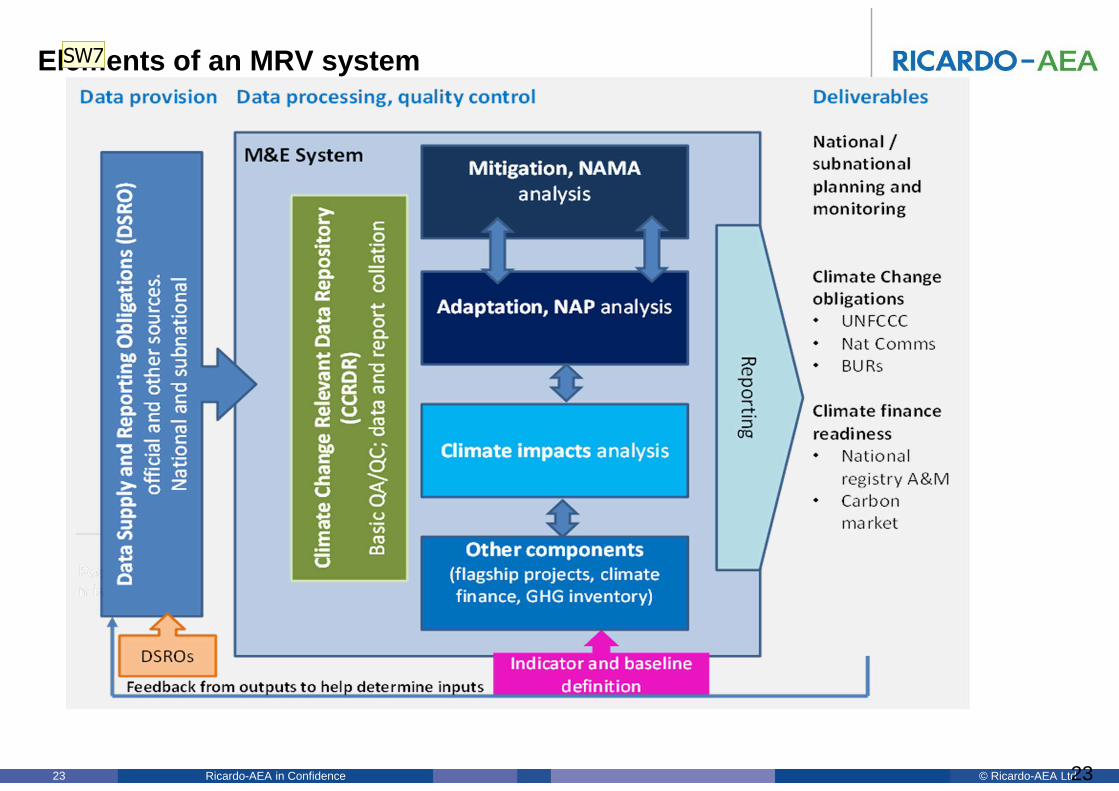
Elements of an MRV system
23
SW7
Folie 23
SW7 James, would you have the original slide where the elements can be changed?Sina Wartmann; 12.08.2013

© Ricardo-AEA LtdRicardo-AEA in Confidence24
• Gaps or overlaps
• Data not comparable due to:
– Differences in scope
– Assumptions/approaches
– Units
• Attribution
• Qualitative nature of data
-> MRV system has to ensure completeness and strive for comparability of data
-> What level of comparability is necessary and realistic in order to achieve overall aim of MRV system?
-> Take a systemic view where attribution is not straightforward
-> Not everything can and must be quantified – depending on targets set
Typical Barriers to Aggregation at national level
© Ricardo-AEA LtdRicardo-AEA in Confidence25
Setting carbon budgets
© Ricardo-AEA LtdRicardo-AEA in Confidence26
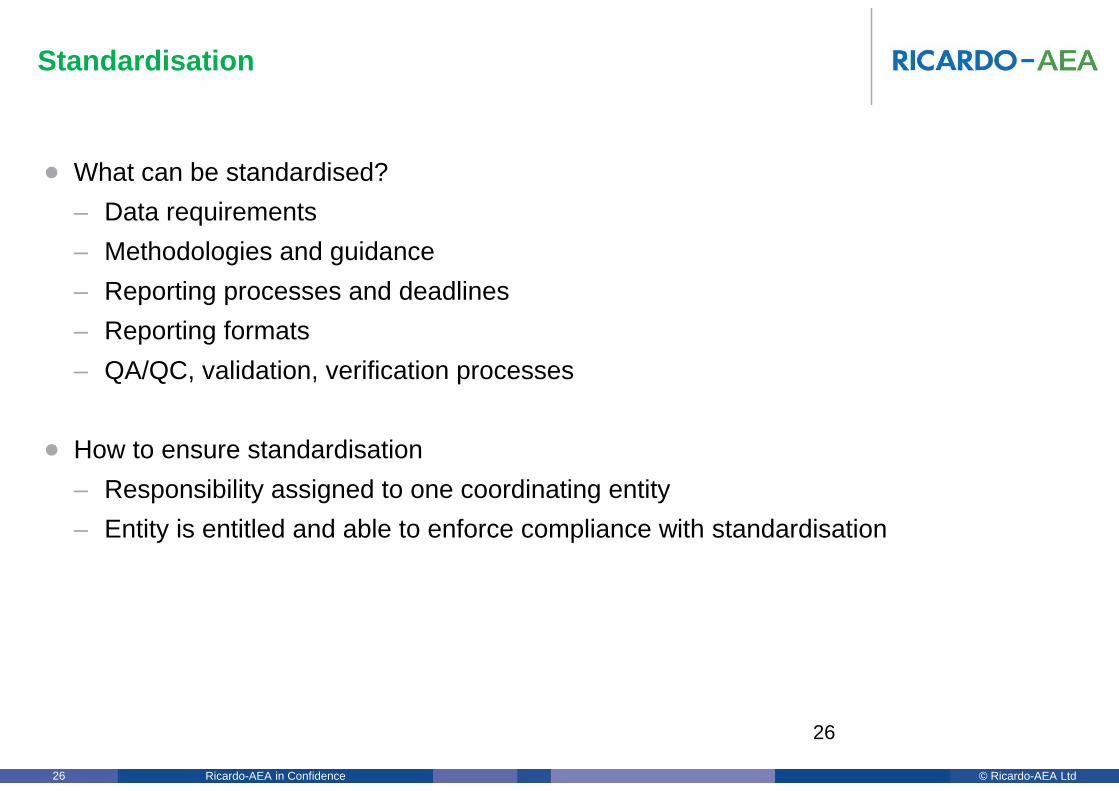
Standardisation
• What can be standardised?
– Data requirements
– Methodologies and guidance
– Reporting processes and deadlines
– Reporting formats
– QA/QC, validation, verification processes
• How to ensure standardisation
– Responsibility assigned to one coordinating entity
– Entity is entitled and able to enforce compliance with standardisation
26
© Ricardo-AEA LtdRicardo-AEA in Confidence27
Example Case Bottom -up: GHG inventory compilation
27
© Ricardo-AEA LtdRicardo-AEA in Confidence28
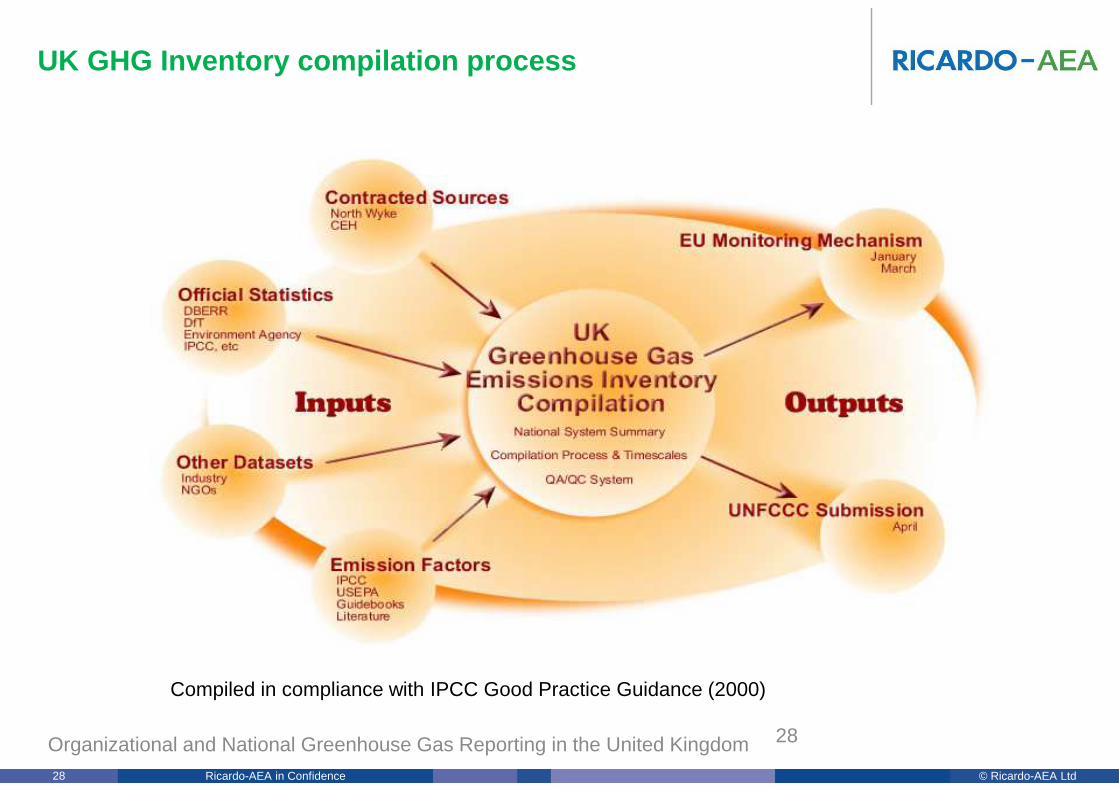
UK GHG Inventory compilation process
28Organizational and National Greenhouse Gas Reporting in the United Kingdom
Compiled in compliance with IPCC Good Practice Guidance (2000)
© Ricardo-AEA LtdRicardo-AEA in Confidence29
29
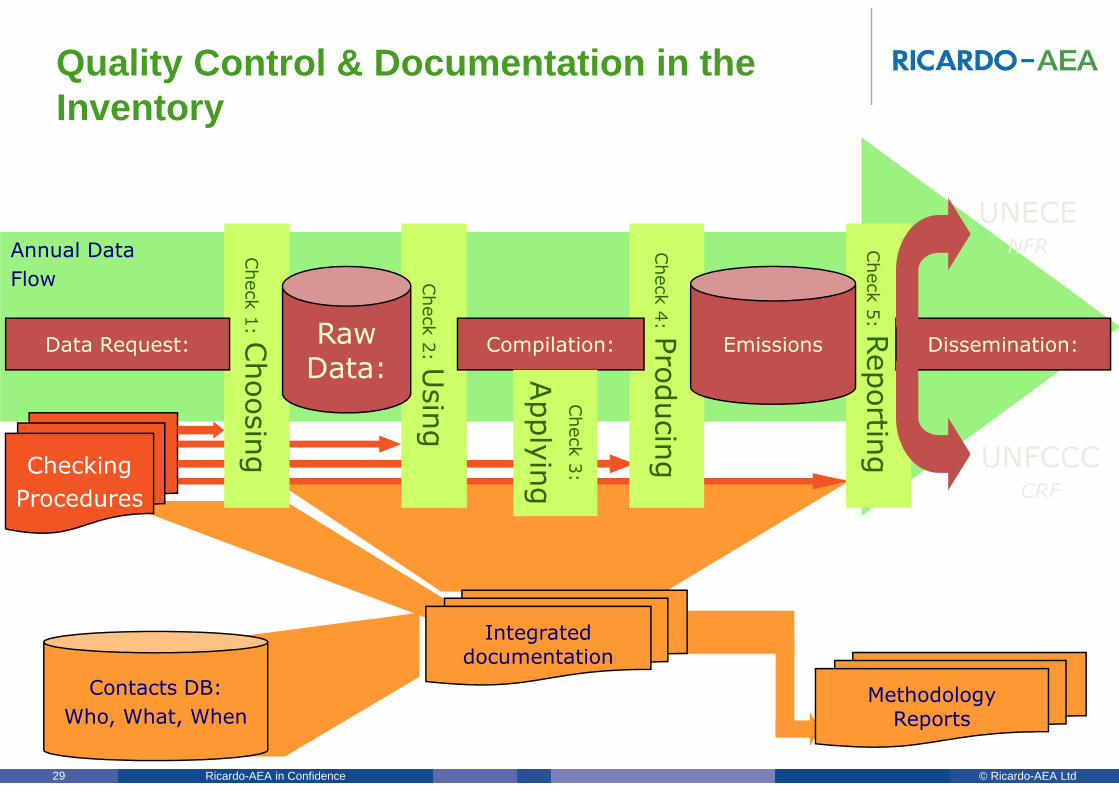
Annual Data
Flow
Checking
Procedures
Check 1
:Choosin
g
Check 2
:U
sin
g
Check 4
:Pro
ducin
g
Check 5
:Reportin
g
Quality Control & Documentation in the Inventory
Data Request: Raw Data:
Compilation: Dissemination:Emissions
Check 3
:
Apply
ing
UNFCCCCRF
UNECENFR
Integrated documentation
Contacts DB:
Who, What, WhenMethodology
Reports
© Ricardo-AEA LtdRicardo-AEA in Confidence30
30
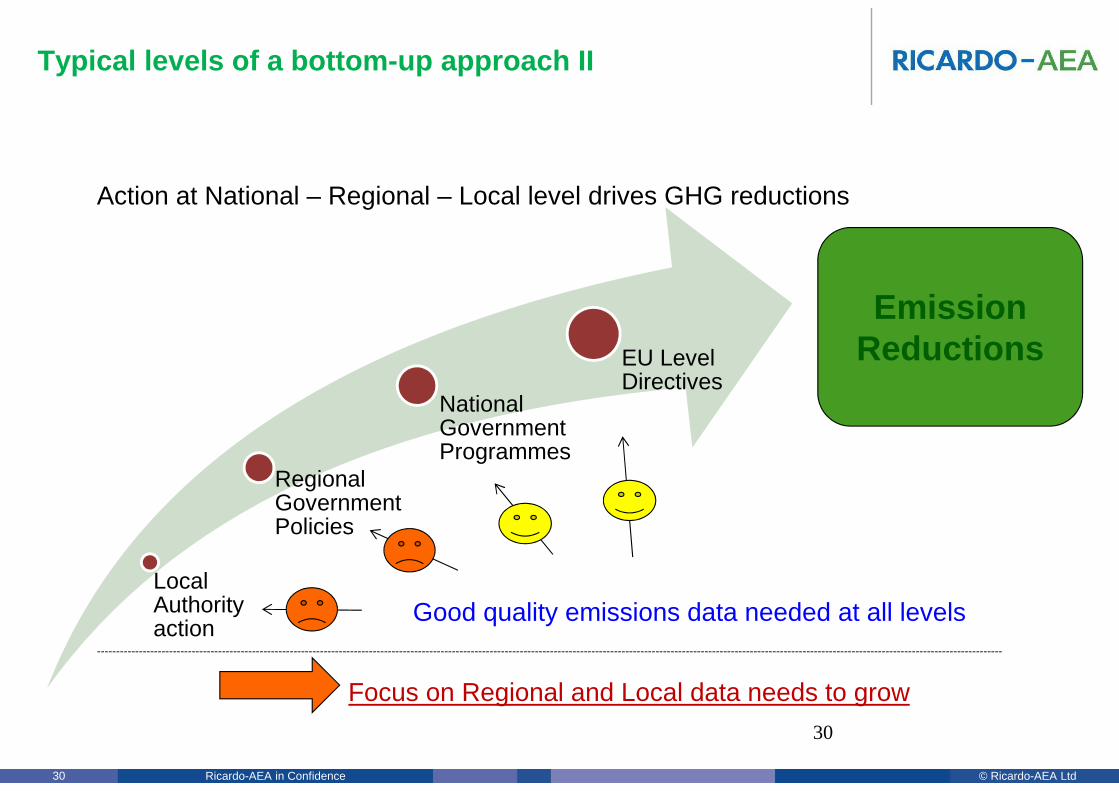
Typical levels of a bottom -up approach II
Action at National – Regional – Local level drives GHG reductions
Good quality emissions data needed at all levels------------------------------------------------------------------------------------------------------------------------------------------------------------------------------------------------------------------------------------------------
Focus on Regional and Local data needs to grow
Local Authority action
Regional Government Policies
National Government Programmes
EU Level Directives
Emission Reductions
© Ricardo-AEA LtdRicardo-AEA in Confidence31
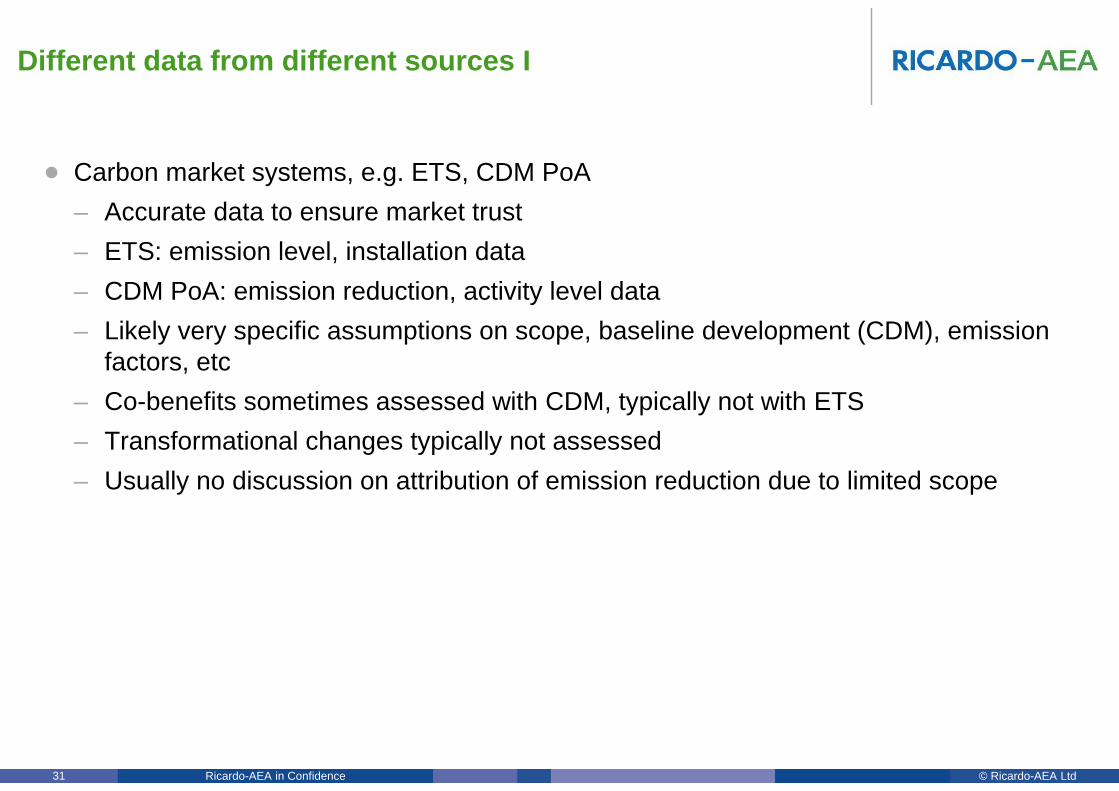
• Carbon market systems, e.g. ETS, CDM PoA
– Accurate data to ensure market trust
– ETS: emission level, installation data
– CDM PoA: emission reduction, activity level data
– Likely very specific assumptions on scope, baseline development (CDM), emission factors, etc
– Co-benefits sometimes assessed with CDM, typically not with ETS
– Transformational changes typically not assessed
– Usually no discussion on attribution of emission reduction due to limited scope
Different data from different sources I
© Ricardo-AEA LtdRicardo-AEA in Confidence32
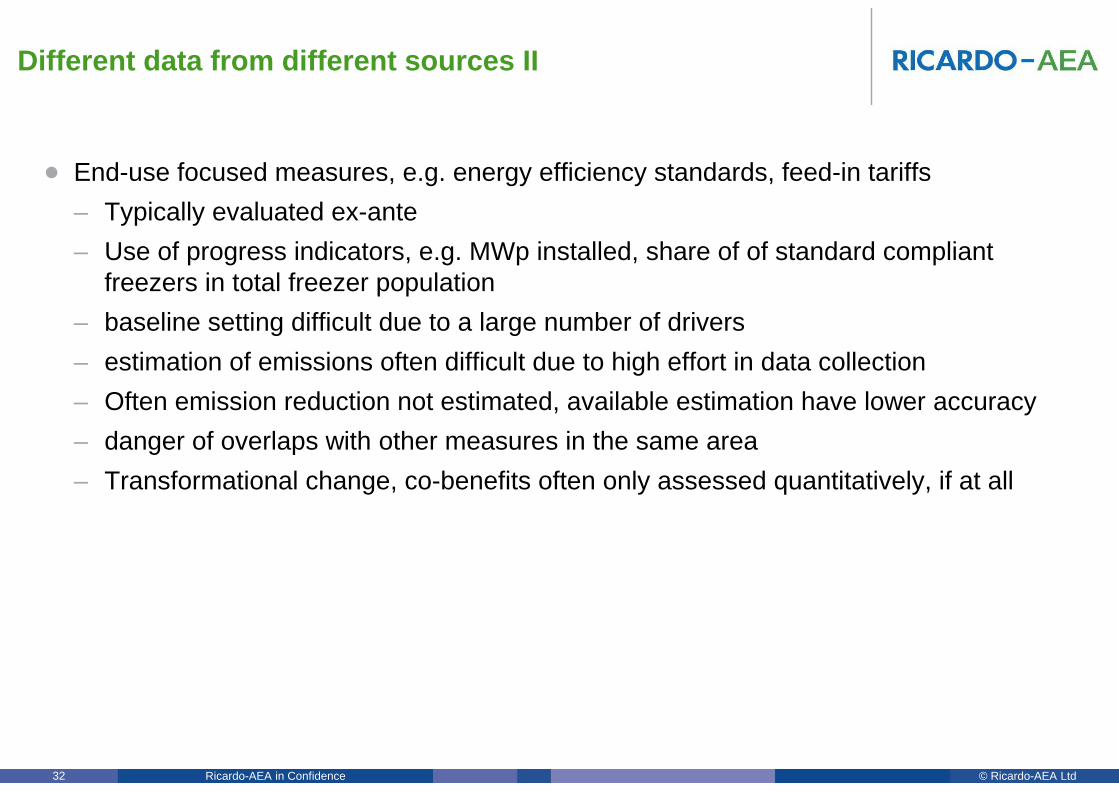
• End-use focused measures, e.g. energy efficiency standards, feed-in tariffs
– Typically evaluated ex-ante
– Use of progress indicators, e.g. MWp installed, share of of standard compliant freezers in total freezer population
– baseline setting difficult due to a large number of drivers
– estimation of emissions often difficult due to high effort in data collection
– Often emission reduction not estimated, available estimation have lower accuracy
– danger of overlaps with other measures in the same area
– Transformational change, co-benefits often only assessed quantitatively, if at all
Different data from different sources II
© Ricardo-AEA LtdRicardo-AEA in Confidence33
33
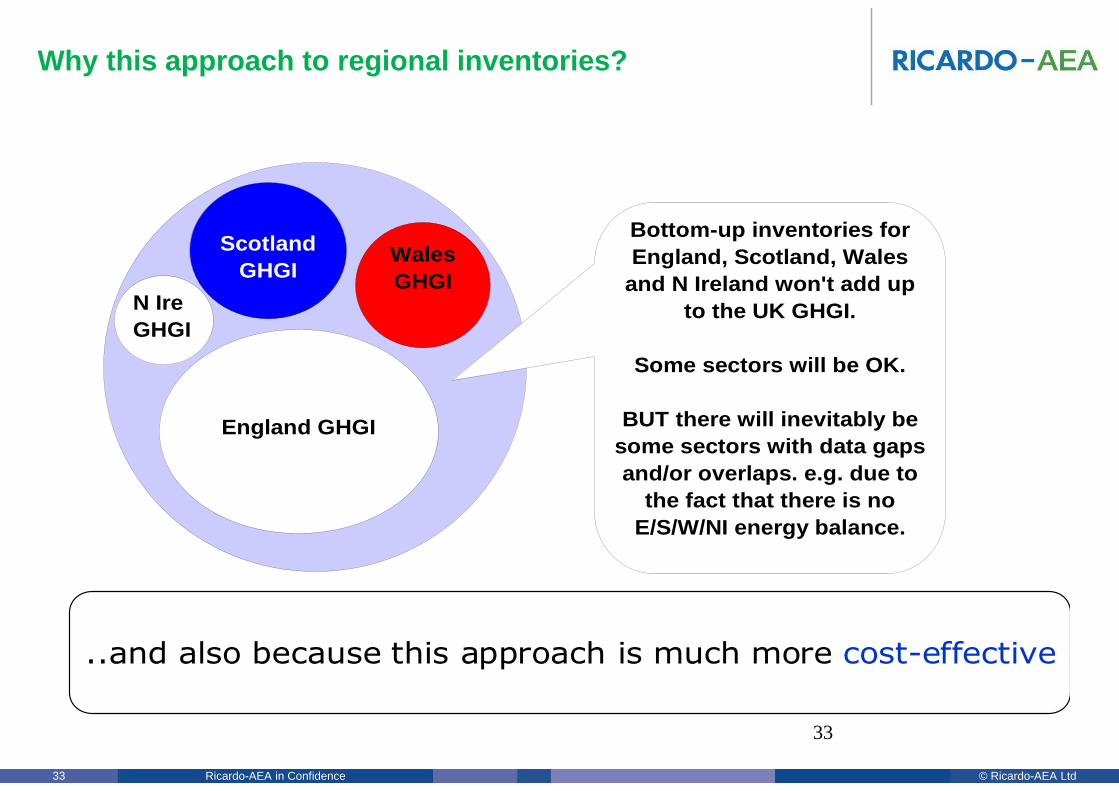
Why this approach to regional inventories?
N IreGHGI
ScotlandGHGI
Wales GHGI
England GHGI
Bottom-up inventories for England, Scotland, Wales
and N Ireland won't add up to the UK GHGI.
Some sectors will be OK.
BUT there will inevitably be some sectors with data gaps and/or overlaps. e.g. due to
the fact that there is no E/S/W/NI energy balance.
..and also because this approach is much more cost-effective


