
1
Elevated Serum Sialic Acid Levels Predict Prostate Cancer As Well As Bone Metastases
Cong Zhang1*, Lei Yan1*, Hongkai Song1,2, Zheng Ma1,3, Dongshan Chen1, Feilong Yang1, Liang Fang1,
Zeyan Li1, Kui Li4, Dawei Li1, Nengwang Yu1, Hainan Liu1, Zhonghua Xu1
1. Department of Urology, Qilu Hospital of Shandong University, Wenhuaxi Road 107#, Jinan, 250012,
P.R.China
2. Department of Bone and Soft Tissue Tumor, Shandong Cancer Hospital affiliated to Shandong
University, Wenhuaxi Road 440#, Jinan, 250117, P.R.China
3. Department of Urology, The People's Hospital of Liaocheng, Dongchangxi Road 67#, Liaocheng,
252000, P.R.China
4. Department of Urology, The people's Hospital of Yucheng, Kaituo Road 753#, Dezhou, 251200,
P.R.China
Correspondent author: Dawei Li, Department of Urology, Qilu Hospital of Shandong University, Wenhuaxi
Road 107#, Jinan, 250012, P.R.China;
Tel: +86-531-82166701;
Fax: +86-531-82169044;
Email: [email protected]
Cong Zhang: [email protected]
Lei Yan: [email protected]
Hongkai song: [email protected]
Zheng Ma: [email protected]
Dongshan Chen: [email protected]
Feilong Yang: [email protected]
Liang Fang: [email protected]

2
1
Zeyan Li: [email protected]
KuiLi: [email protected]
Dawei Li: [email protected]
Nengwang Yu: [email protected]
Hainan Liu: [email protected]
Zhonghua Xu: [email protected]
*: These authors contribute equally to the manuscript.
Elevated Serum Sialic Acid Levels Predict Prostate Cancer As Well As Bone Metastases

3
2
Abstract
Objection To evaluate the value of serum sialic acid (SA) in diagnosis of benign prostatic hyperplasia
(BPH), prostate cancer (PCa), and bone metastases in PCa patients. Materials and Methods Data from 540
patients who were newly diagnosed with PCa or BPH between November 2014 and March 2018 were
retrospectively collected and analyzed. Pretreatment SA levels were compared across various groups, then,
associations between SA levels and clinic parameters of patients were analyzed as well. Univariate and
multivariate logistic regression analyses were further used to identify independent associations. Results The
mean SA levels in patients with PCa were significantly higher than with BPH (p = 0.013). Furthermore, PCa
patients with bone metastases showed elevated SA levels compared to with non-bone metastases (p <
0.001). A multivariate logistic regression model showed that: SA level > 52.35 mg/dL was identified to be
independently associated with diagnosis of PCa (HR = 1.645, p = 0.036), and SA level > 59 mg/dL was
identified to be independent association with the presence of bone metastases in PCa patients (HR = 6.421, p
= 0.012). Conclusions Elevated SA level is an independent predictor of prostate cancer as well as its bone
metastases. Therefore, SA level may be a promising diagnostic and prognostic biomarker for prostate cancer
and bone metastases.
Key words: prostate cancer, benign prostatic hyperplasia, bone metastases, serum sialic acid.
Introduction
Prostate cancer (PCa) is a malignant tumor that originates from the man reproductive system, which is
becoming a great detriment to male health. At present, PCa is the second most common diagnosed cancer
4
3
and ranks the second leading cause of deaths in the USA[1]. In 2014, it was reported that 233,000 patients
were diagnosed as PCa in United States, and 29,840 deaths were attributed to it[2]. Although the incidence
of PCa in Asian was lower than that in United States and Europe[3], the morbidity and mortality of PCa in
China is increasing rapidly with the improvement of living standard, changing of lifestyle, and advance in
screening technology[4]. As shown by data, in 2011, the incidence of PCa in China was the ninth most
common malignant tumors, the death rate of PCa in Urban men ranked 9th among male malignant tumors as
well[3]. The traditional prostate cancer marker, prostate-specific antigen (PSA), showed prominent
contributions in the screening, diagnosis, and treatment of prostate cancer. However, there were also some
problems such as high costs, long waiting time, and low specificity and sensitivity. Furthermore, PCa was
prone to be bone metastases, and a considerable proportion of the patients had been advanced stage once
diagnosed. A recent study showed that the survival time of PCa patients with bone metastases was
significantly shorter than that with non-bone metastases[5]. Beyond that, there were great differences in
treatment methods and protocols between the two kinds of patients. At present, emission computerized
tomography (ECT) is most commonly used in assessment of bone metastases in PCa patients and it is
regarded as one of the most effective detection method for bone metastases of patients diagnosed as PCa[6].
However, the examination was expensive and had certain radioactivity. Therefore, ECT was suitable to
further confirm the metastases of cancer patients but not appropriate for long-term monitoring of patient’s
progression.
SA is a generic term for a series of hydroxylated monosaccharide derivatives containing 9 carton atoms,
which locates at the methylated non-reduction terminal of glycoproteins and glycolipids[7]. The synthesis of
glycolipids on the cell membrance is increased and it is secreted into the blood when cells undergo
malignant transformation, as in the following, the concentration of SA is elevated in cancer patients[8].
Though studies had indicated that the level of SA in PCa patients was higher than that in normal
population[9], small sample, no further analysis of multiple factors and no validated cut-off value for the
PCa were existed in these studies. Beyond that, there was few research on the relationship between SA
levels and bone metastases of PCa patients especially involving Asian. Therefore, we investigated the
differences of SA level in patients with prostate neoplasia in order to verify it’s values in the diagnosis of
BPH, PCa, as well as bone metastases in Chinese population, and we further give the optimal cut-off value
for SA level.
Materials and methods
Patients. A retrospective collection of medical records was performed for 540 patients who were newly
5
4
diagnosed as PCa or BPH and treated at the Department of Urology, Qilu Hospital of Shandong University,
between December 2014 and April 2018. Among 540 patients, 408 patients were diagnosed as PCa, and 132
patients were diagnosed as BPH. The diagnosis of all patients had been confirmed by the biopsy or
postoperative pathology. The inclusion criteria for all patients in this study were as follow:
(1) diagnosis of PCa or BPH at Qilu hospital of Shandong University between November 2014 and March
2018.
(2) availability of necessary information, such as pre-treatment blood test records, post-operation pathology
results and other general information.
(3) no diagnosis of second cancers.
(4) not underwent preoperative radiotherapy, chemotherapy, or immunotherapy.
The exclusion criteria were as follows:
(1) Coexisting other malignant tumors or history of any malignant tumors.
(2) Clinical or pathological findings suggest acute or chronic inflammation, such as chronic prostatitis,
systemic infection, etc.
(3) Pathological diagnosis of prostatic malignant neoplasm but not adenocarcinoma.
(4) Taking procoagulant or anticoagulant drugs within the past 2 weeks.
(5) Patients with inadequate clinical information.
Date collection. Clinical date including patients’ age at the time of diagnosis, lactate dehydrogenase (LDH),
alkaline phosphatase (AKP), fibrinogen (FIB), and prostate specific antigen (PSA), pathological
characteristics (including pathological grade and stage), prostate volume (PV) and ECT were retrieved from
the electronic patient records at Qilu Hospital. Based on the patient’s Magnetic Resonance Imaging (MRI)
results, the prostate volume was estimated according to the formula of “prostate volume = length × width ×
height × 0.52”[10]. Pathological grade was evaluated using Gleason system, and pathological stage was
assessed in accordance with 2002 TNM classification [11].
SA measurement. Before receiving any clinical interventions, 5 mL of venous blood was drawn from each
patient in the early morning after 12 hours fast. Blood sample were stored in test tubes that containing a clot
activator and gel, then clotted naturally at room temperature. Subsequently, samples were centrifuged at
2000 rpm for 10 minutes. The serum was separated to determine the concentration of SA by using The
Roche Cobas 8000 automatic analyzer. The normal concentration of SA was defined as 45.6 mg/dL - 75.4
mg/dL.
Statistical analysis. The levels of SA in each group were expressed as mean ± standard deviation (SD), then
the Kolmogorov-Smirnov was adopted to assess whether it obeys normal distribution. Student’s t-test was

6
5
used for normal distribution data, if not, the Mann-Whitney U-test or Kruskal-Wallis H-test was employed.
Linear correlations between SA levels and LDH, AKP, FIB, PSA were evaluated as well. The receiver
operative characteristic (ROC) was adopted to determine the optimal threshold of SA level for different
diagnosis. Univariate and multivariate regression models were constructed to further evaluate the value of
SA levels in differentiating pathological outcomes, and relevant risk was expressed as hazard ratios (HR)
with 95% confidence interval (CI). All tests were two-tailed and “p” less than 0.05 was regarded as
statistically significant. All data were analyzed using the Statistical Package for Social Science version 22.0
(SPSS Inc, Chicago, IL, USA) and GraphPad Prim 6 software (GraphPad Software Inc, San Diego, CA,
USA).
Results
Baseline clinical characteristics of study population. All the patients included in the present study
consecutively presented at the Department of Urology, Qilu Hospital, Shandong University. After
eliminating unqualified patients according to the exclusion criteria, 540 patients were eligible for inclusion
in the finally study. Among those people, 408 were PCa and 132 were BPH. The ages of PCa and BPH were
68.88 ± 8.19 old and 68.11 ± 8.18 old respectively (p = 0.368) (Table 1). The mean level of SA in the PCa
cohort was 56.75 ± 11.47 mg/dL, which was significantly higher than that in the BPH patients (54.05 ± 9.00
mg/dL) (p = 0.013) (Table 1, Fig. 1A).
Associations between SA levels and clinicopathological characteristics of PCa patients. The associations
between SA levels and clinical characteristics of 409 PCa patients were further evaluated. It was significant
that pretreatment SA levels were associated with LDH, AKP, FIB, and PSA (all p < 0.001) (Table 2, Fig. 2A,
B, C, D). Although no relationship was shown between SA levels and age, PV, it was interested that the SA
levels in older patients were lower than that in younger (56.40 ± 10.10 mg/dL vs 57.06 ± 12.59 mg/dL, p =
0.726) (Table 2, Fig. 3A) and SA levels of PCa patients with larger prostate gland were higher than those
with smaller prostate gland (58.00 ± 10.71 mg/dL vs 55.18 ± 10.57 mg/dL, p = 0.080) (Table 2; Fig. 3B).
According to ECT results, 41 PCa patients (10.02%) were diagnosed with bone metastases, 121 PCa patients
(29.58%) were non-bone metastases and other 59 PCa patients (14.43%) were suggestive of suspicious bone
metastases. The remaining 188 people (45.97%) did not perform the examination or lost the results. The
mean level of SA in patients with bone metastases was significantly higher than that with suspicious bone
metastases or non-bone metastases (bone metastases: 69.97 ± 15.14 mg/dL; suspicious bone metastases:
59.89 ± 12.24 mg/dL; non-bone metastases: 54.58 ± 9.74 mg/dL, respectively. pb < 0.001) (Table 2, Fig.
1B). Analysis of the bone metastases and non-bone metastases revealed that patients with bone metastases
7
6
showed elevated SA levels compared to patients with non-bone metastases (69.97 ± 15.14 mg/dL vs 54.58 ±
9.74 mg/dL, pa < 0.001) (Table 2, Fig. 1B). Moreover, preoperative SA levels of patients diagnosed as PCa
with advanced pathological stage were higher than that with early pathological stage, but not statistically
significant (pT4: 58.16 ± 13.45 mg/dL; pT3: 55.56 ± 6.24 mg/dL; pT2: 54.10 ± 8.52 mg/dL, respectively. p
= 0.391) (Table 1; Fig. 3C). However, when considering pathological grade of PCa patients on the basis of
Gleason score(GS), SA levels in men with high grade cancer (GS > 7) were elevated compared to the low
grade (GS ≤ 7) (58.34 ± 13.05 mg/dL vs 55.11 ± 9.43 mg/dL; p = 0.024) (Table 1; Fig. 2E).
Linear correlation analyses were performed to further evaluate correlations between SA levels and LDH,
AKP, FIB, PSA in PCa patients. AKP, FIB were strongly related to SA levels (r = 0.427, p = 0.000; r =
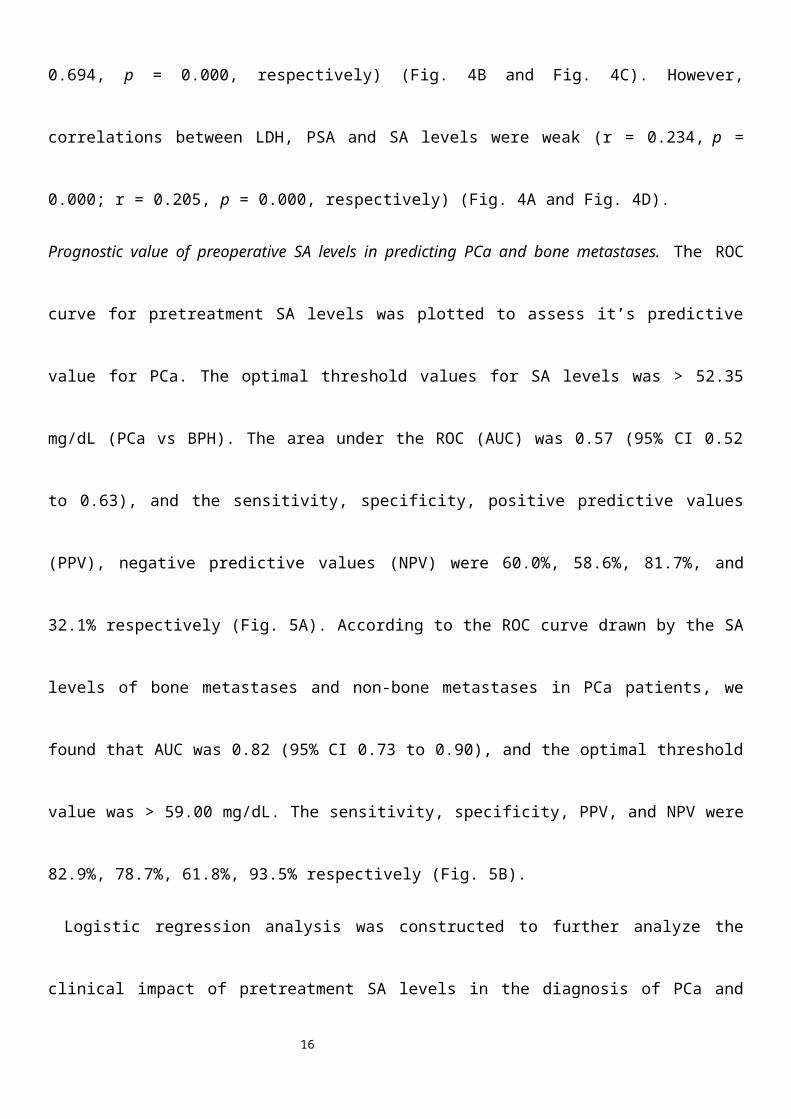
0.694, p = 0.000, respectively) (Fig. 4B and Fig. 4C). However, correlations between LDH, PSA and SA
levels were weak (r = 0.234, p = 0.000; r = 0.205, p = 0.000, respectively) (Fig. 4A and Fig. 4D).
Prognostic value of preoperative SA levels in predicting PCa and bone metastases. The ROC curve for
pretreatment SA levels was plotted to assess it’s predictive value for PCa. The optimal threshold values for
SA levels was > 52.35 mg/dL (PCa vs BPH). The area under the ROC (AUC) was 0.57 (95% CI 0.52 to
0.63), and the sensitivity, specificity, positive predictive values (PPV), negative predictive values (NPV)
were 60.0%, 58.6%, 81.7%, and 32.1% respectively (Fig. 5A). According to the ROC curve drawn by the
SA levels of bone metastases and non-bone metastases in PCa patients, we found that AUC was 0.82 (95%
CI 0.73 to 0.90), and the optimal threshold value was > 59.00 mg/dL. The sensitivity, specificity, PPV, and
NPV were 82.9%, 78.7%, 61.8%, 93.5% respectively (Fig. 5B).
Logistic regression analysis was constructed to further analyze the clinical impact of pretreatment SA
levels in the diagnosis of PCa and bone metastases. In univariate analysis, elevated SA levels significantly
predicted poor diagnostic outcomes, containing PCa and bone metastases (all p < 0.05) (Table 3). In
addition, elevated FIB levels and high pathological grade were significantly associated with the diagnosis of
bone metastases (FIB: HR=1.521, p = 0.005; high grade: HR = 4.904, p = 0.000, respectively) (Table 3).
Furthermore, we found that the conventional screening biomark, PSA, did not show significant risk to both
PCa and bone metastases (HR: 1.058, p = 0.000; HR: 1.006, p = 0.000, respectively) (Table 3). There were
insignificant association between worse outcomes and other index (Table 3). Then, AKP, LDH, FIB,
pathological grade, and SA were further included in the subsequent multivariate analysis. We find that SA >
52.35 mg/dL remained an independent risk for PCa (HR = 1.645, p = 0.036) (Table 4). SA > 59 mg/L and
high pathological grade continued to be strong factors related to bone metastases (SA: HR = 6.421, p =
0.012; high grade: HR = 19.774, p = 0.005, respectively) (Table 4). However, FIB did not show any
8
7
significant correlation with bone metastases in multivariate analysis.
Discussion
SA is a terminal component of the non-reducing end of carbohydrate chains of glycoproteins and
glycolipids[12]. It was mainly expressed in the cell membrance and displayed biological activity by acting
as a receptor for biologically activating molecules or mediating intracellular activities, such as recognition,
adhesion and antigens[13]. In the early tumor progression, the glycoprotein on the cell membrane would be
changed on certain degree, and the activity of glycosyltransferases in the cells would be enhanced[14]. Then,
the SA was overexpressed that acted as specific terminal glycan of glycoproteins [15]. Secreting excessive
amounts of SA sialylated tumor cells, helping it evade the monitoring and killing of immune system, in
addition, SA could cause damage to the immune system containing lymphocytes and macrophages[16, 17].
Studies had shown that elevated level of SA was significantly associated with pancreatic cancer, colorectal
cancer, osteosarcoma, oral squamous cell carcinoma, and other malignancies[18-21]. However, it was worth
noting that some studies had observed that SA levels was obviously higher in patients with severe infection
or Type diabetes compared to healthy people[22, 23]. Therefore, when data was enrolled into the presentⅡ
study, any other malignancy, infection, inflammation, diabetes and other correlative factors were eliminated
to avoid interference with the finally outcomes.
PCa was one of the most common genitourinary malignancies of men in the world, and it was one of the
most common causes of death in male cancers in Western countries[24]. In China, the incidence of PCa was
rapidly rising[4]. At present, the most widely used prostate cancer screening index was PSA [25, 26],
however, it was difficult to distinguish PCa and BPH in some cases. The prostate biopsy was regarded as
gold standard that required patients to withstand greater pain, and there was a risk of false negatives for
microscopic prostate cancer. Furthermore, PCa was likely to be accompanied by bone metastases.
Ramankulov A et al. showed that bone metastases were occurred in more than 70% of patients with
advanced adenocarcinoma, accompanied by an occult process[27]. Whether or not bone metastases occurred
was of great significance in tumor prognosis and treatment. Therefore, detection of bone metastases would
be considered as an important part of PCa patients’ management plan. The definitive diagnosis of bone
metastases was depended on the pathology, but a few studies had shown that the detection rate of bone
biopsy was lower than imageological examination in most cases[28]. The diagnostic sensitivity and
specificity of ECT were highest in various imaging examinations and it was considered as one of the
diagnostic standard for bone metastases in cancer patients at present[29]. However, ECT also had some
disadvantages such as high costs, radiation hazards, and difficulty in widespread carried in primary

9
8
hospitals. On the contrary, the test of SA had advantages of safety, low cost, convenient implementation and
generalization in clinical practice.
In the present study, we analyzed pretreatment SA levels in 540 patients as well as other relevant assay
index and clinical characteristics. Similar to Goswami K et al.[9, 30], we found that SA levels in patients
with PCa were significantly higher than those with BPH. Next, PCa patients were further grouped according
to age, AKP, LDH, FIB, PSA, and PV. It was found that SA levels were closely related to LDH, AKP, FIB,
and PSA. Using linear correlation analyses, we found that correlations between AKP, FIB and SA levels
were strong, but relations existed in LDH, PSA and SA levels were weak. However, it was consistent with
the conclusions drawn by CRrook MA et al.[31], no statistically significant correlation was observed
between SA levels and age. Numbers of studies presented that PV could be used as a predictor of worse
characteristics and recurrence in PCa patients[32-34], therefore the preoperative MRI results were
preformed to estimate the volume of prostate according to “ prostate volume = length × width × height ×
0.52 ”. To our knowledge, it was the first study founding that there was no significant correlation between
SA levels and PV. Meanwhile, PV had no significant value in the diagnosis of PCa and bone metastases. In
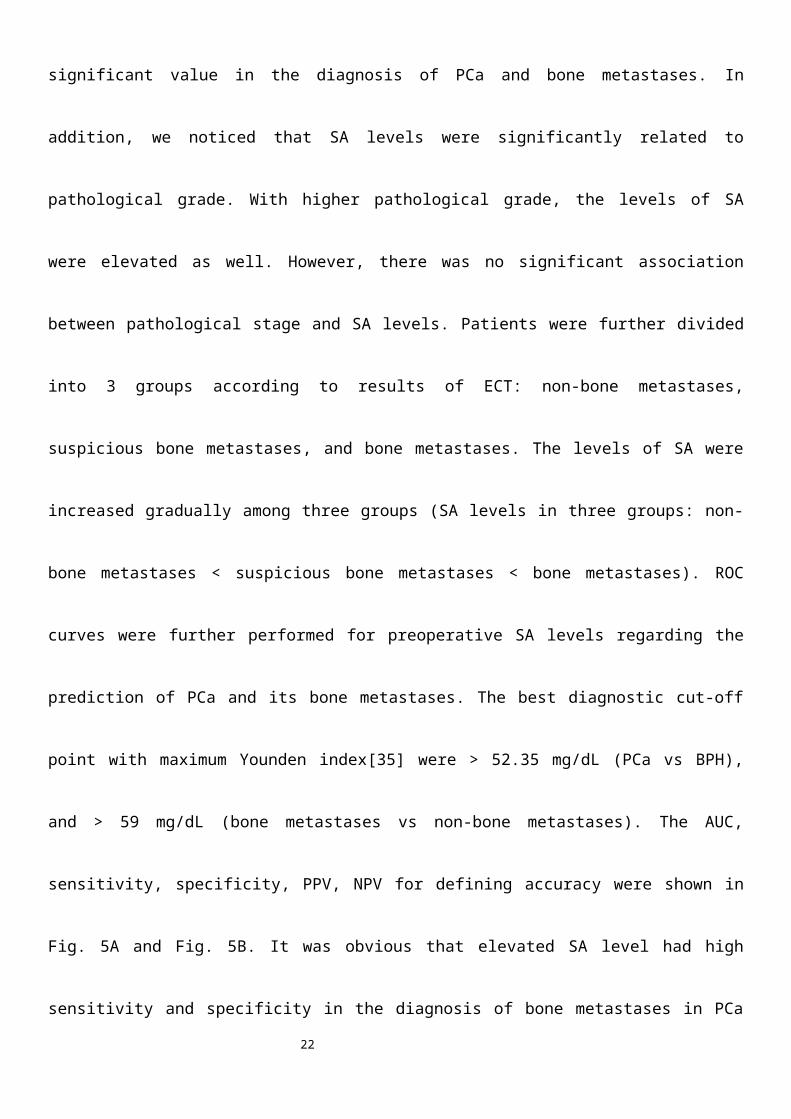
addition, we noticed that SA levels were significantly related to pathological grade. With higher pathological
grade, the levels of SA were elevated as well. However, there was no significant association between
pathological stage and SA levels. Patients were further divided into 3 groups according to results of ECT:
non-bone metastases, suspicious bone metastases, and bone metastases. The levels of SA were increased
gradually among three groups (SA levels in three groups: non-bone metastases < suspicious bone metastases
< bone metastases). ROC curves were further performed for preoperative SA levels regarding the prediction
of PCa and its bone metastases. The best diagnostic cut-off point with maximum Younden index[35] were >
52.35 mg/dL (PCa vs BPH), and > 59 mg/dL (bone metastases vs non-bone metastases). The AUC,
sensitivity, specificity, PPV, NPV for defining accuracy were shown in Fig. 5A and Fig. 5B. It was obvious
that elevated SA level had high sensitivity and specificity in the diagnosis of bone metastases in PCa
patients. SA levels were further incorporated into univariate and multivariate analysis, and the results
showed that elevated SA levels were significant for diagnosis of PCa and bone metastases. Therefore,
elevated SA levels could play a promising role in the diagnosis of PCa and bone metastases in PCa patients.
Still, a few limitations should be noticed in present study. First, because the present study was
retrospective, the potential for confounding remained. In addition, all the data were sourced from Qilu
Hospital of Shandong University, so limitations may be existed in the general applicability of the results.
Conclusions
10
9
The present study demonstrated that preoperative SA levels in PCa patients were significantly higher than
that in BPH patients, and elevated SA levels were closely associated with bone metastases. This study
suggested that SA levels may be a promising biomarker and a reliable predictor for PCa and its bone
metastases.
Ethical approval
This was a retrospective study and clinical data were identified before analysis; therefore, ethical approval
was not required.
Conflict of interest None.
Acknowledgements
This study was supported by financial grants from the National Natural Science Foundation of China
(grant Nos: 81502213 and 81372335) (https://isisn.nsfc.gov.cn/egrantweb/), the Natural Science Foundation
of Shandong Province (grant Nos: ZR201709230247 and ZR2015HM046)
(http://jihlx.sdstc.gov.cn/STDPMS/ZR/Default.aspx), and the Focused Research and Development Program
of Shandong Province (grant Nos: 2016GSF201171 and GG201703180001)
(http://jihlx.sdstc.gov.cn/STDPMS/GG/Default.aspx).

11
10
References
1. Evans-Axelsson S, Timmermand OV, Bjartell A, Strand SE, Elgqvist J. Radioimmunotherapy for Prostate
Cancer--Current Status and Future Possibilities. Seminars in nuclear medicine. 2016,46(2):165-79.
2. Siegel R, Ma J, Zou Z, Jemal A. Cancer statistics, 2014. CA: a cancer journal for clinicians. 2014,64(1):9-
29.
3. Chen W. Cancer statistics: updated cancer burden in China. Chinese journal of cancer research = Chung-
kuo yen cheng yen chiu. 2015,27(1):1.
4. Chen W, Zheng R, Zeng H, Zhang S, He J. Annual report on status of cancer in China, 2011. Chinese
journal of cancer research = Chung-kuo yen cheng yen chiu. 2015,27(1):2-12.
5. He J, Zeng ZC, Yang P, Chen B, Jiang W, Du SS. Clinical features and prognostic factors for patients
with bone metastases from prostate cancer. Asian journal of andrology. 2012,14(3):505-8.
6. Lein M, Miller K, Wirth M, Weissbach L, May C, Schmidt K, et al. Bone turnover markers as predictive
tools for skeletal complications in men with metastatic prostate cancer treated with zoledronic acid. The
Prostate. 2009,69(6):624-32.
7. Wickramasinghe S, Medrano JF. Primer on genes encoding enzymes in sialic acid metabolism in
mammals. Biochimie. 2011,93(10):1641-6.
8. Cylwik B, Chrostek L, Panasiuk A, Szmitkowski M. Serum total and free sialic acid in patients with
chronic liver disease. Clinical chemistry and laboratory medicine. 2010,48(1):137-9.
9. Goswami K, Nandeesha H, Koner BC, Nandakumar DN. A comparative study of serum protein-bound
sialic acid in benign and malignant prostatic growth: possible role of oxidative stress in sialic acid
homeostasis. Prostate cancer and prostatic diseases. 2007,10(4):356-9.
10. Babaei Jandaghi A, Shakiba M, Nasseh H, Korouji Y, Esmaeili S, Khadem Maboudi AA, et al.
Application of bland-altman method in comparing transrectal and transabdominal ultrasonography for
estimating prostate volume. Iranian journal of medical sciences. 2015,40(1):34-9.
11. Wittekind C, Compton CC, Greene FL, Sobin LH. TNM residual tumor classification revisited. Cancer.
2002,94(9):2511-6.
12. Yokoyama H, Jensen JS, Jensen T, Deckert T. Serum sialic acid concentration is elevated in IDDM
especially in early diabetic nephropathy. Journal of internal medicine. 1995,237(5):519-23.
13. Michalakis K, Ilias I, Triantafyllou A, Polymeris A, Kastriotis I, Chairakaki AD, et al. Detection of
prostate cancer by sialic acid level in patients with non-diagnostic levels of prostate-specific antigen.
12
11
Maturitas. 2012,73(4):325-30.
14. Raval GN, Parekh LJ, Patel DD, Jha FP, Sainger RN, Patel PS. Clinical usefulness of alterations in sialic
acid, sialyl transferase and sialoproteins in breast cancer. Indian journal of clinical biochemistry : IJCB.
2004,19(2):60-71.
15. Dadhich M, Prabhu V, Pai VR, D'Souza J, Harish S, Jose M. Serum and salivary sialic acid as a
biomarker in oral potentially malignant disorders and oral cancer. Indian journal of cancer. 2014,51(3):214-
8.
16. Schauer R. Achievements and challenges of sialic acid research. Glycoconjugate journal. 2000,17(7-
9):485-99.
17. Yogeeswaran G. Cell surface glycolipids and glycoproteins in malignant transformation. Advances in
cancer research. 1983,38:289-350.
18. Gruszewska E, Chrostek L, Cylwik B, Tobolczyk J, Szmitkowski M, Kuklinski A, et al. Serum sialic
acid as a marker of pancreatic cancers. Clinical laboratory. 2013,59(7-8):781-8.
19. Sandhu R, Lal H, Kundu ZS, Kharb S. Serum fluoride and sialic acid levels in osteosarcoma. Biological
trace element research. 2011,144(1-3):1-5.
20. Dhakar N, Astekar M, Jain M, Saawarn S, Saawarn N. Total sialic acid, total protein and total sugar
levels in serum and saliva of oral squamous cell carcinoma patients: A case control study. Dental research
journal. 2013,10(3):343-7.
21. Verazin G, Riley WM, Gregory J, Tautu C, Prorok JJ, Alhadeff JA. Serum sialic acid and
carcinoembryonic levels in the detection and monitoring of colorectal cancer. Diseases of the colon and
rectum. 1990,33(2):139-42.
22. Rajendiran KS, Ananthanarayanan RH, Satheesh S, Rajappa M. Elevated levels of serum sialic acid and
high-sensitivity C-reactive protein: markers of systemic inflammation in patients with chronic heart failure.
British journal of biomedical science. 2014,71(1):29-32.
23. Ekin S, Meral I, Gunduz H, Mert N. Comparative study of total protein, and total and lipid-associated
serum sialic acid levels in patients with type 2 diabetes mellitus. Journal of clinical laboratory analysis.
2003,17(4):124-6.
24. Fu W, Madan E, Yee M, Zhang H. Progress of molecular targeted therapies for prostate cancers.
Biochimica et biophysica acta. 2012,1825(2):140-52.
25. Wang MC, Valenzuela LA, Murphy GP, Chu TM. Purification of a human prostate specific antigen.
Investigative urology. 1979,17(2):159-63.
26. Oesterling JE, Jacobsen SJ, Klee GG, Pettersson K, Piironen T, Abrahamsson PA, et al. Free, complexed
13
12
and total serum prostate specific antigen: the establishment of appropriate reference ranges for their
concentrations and ratios. J Urol. 1995,154(3):1090-5.
27. Huggins C, Hodges CV. Studies on prostatic cancer: I. The effect of castration, of estrogen and of
androgen injection on serum phosphatases in metastatic carcinoma of the prostate. 1941. J Urol.
2002,168(1):9-12.
28. Arredondo SA, Downs TM, Lubeck DP, Pasta DJ, Silva SJ, Wallace KL, et al. Watchful waiting and
health related quality of life for patients with localized prostate cancer: data from CaPSURE. J Urol.
2008,179(5 Suppl):S14-8.
29. Peterson JJ, Kransdorf MJ, O'Connor MI. Diagnosis of occult bone metastases: positron emission
tomography. Clinical orthopaedics and related research. 2003(415 Suppl):S120-8.
30. El Melegy NT, Aboulella HA, Abul-Fadl AM, Mohamed NA. Potential biomarkers for differentiation of
benign prostatic hyperplasia and prostate cancer. British journal of biomedical science. 2010,67(3):109-12.
31. Crook MA, Tutt P, Pickup JC. Elevated serum sialic acid concentration in NIDDM and its relationship
to blood pressure and retinopathy. Diabetes care. 1993,16(1):57-60.
32. Briganti A, Chun FK, Suardi N, Gallina A, Walz J, Graefen M, et al. Prostate volume and adverse
prostate cancer features: fact not artifact. European journal of cancer. 2007,43(18):2669-77.
33. Freedland SJ, Isaacs WB, Platz EA, Terris MK, Aronson WJ, Amling CL, et al. Prostate size and risk of
high-grade, advanced prostate cancer and biochemical progression after radical prostatectomy: a search
database study. Journal of clinical oncology : official journal of the American Society of Clinical Oncology.
2005,23(30):7546-54.
34. Yashi M, Mizuno T, Yuki H, Masuda A, Kambara T, Betsunoh H, et al. Prostate volume and biopsy
tumor length are significant predictors for classical and redefined insignificant cancer on prostatectomy
specimens in Japanese men with favorable pathologic features on biopsy. BMC urology. 2014,14:43.
35. Hanley JA, McNeil BJ. The meaning and use of the area under a receiver operating characteristic (ROC)
curve. Radiology. 1982,143(1):29-36.

14
13
Table 1. Clinical characteristics of PCa and BPH patients
Characteristics PCa BPH p value
Patients (n; %) 408 (75.6%) 132 (24.4%)
Age (y) 68.88 ± 8.19 68.11 ± 8.18 0.368*
SA (mg/dL) 56.75 ± 11.47 54.05 ± 9.00 0.013*
PCa: prostate cancer; BPH: benign prostatic hyperplasia; p < 0.05 is considered as statistically significant; p*: Mann-
Whitney U-test.

15
14
Table 2. Correlations between preoperative SA levels and clinicopathological parameters of PCa patients
Characteristics n (%) SA levels (mg/dL, Mean ± SD) p valuePatients 408 (100.00) 56.75 ± 11.47Agea 0.726*
≤ 69 y > 69 y
215 (52.70)193 (47.30)
57.06 ± 12.5956.40 ± 10.10
LDHa < 0.001* ≤ 190 U/L > 190 U/L
204 (50.00)204 (50.00)
54.31 ± 8.7159.19 ± 13.27
AKPa < 0.001* ≤ 70 U/L > 70 U/L
209 (51.23)199 (48.77)
52.88 ± 8.2460.81 ± 12.92
FIBa < 0.001*≤ 3.18 g/L> 3.18 g/L
205 (50.25)203 (49.75)
50.68 ± 6.1462.88 ± 12.33
PSAa < 0.001*≤ 19.48 ng/mL> 19.48 ng/mL
204 (50.00)204 (50.00)
54.63 ± 9.1058.87 ± 13.12
PVa 0.080*≤ 35.88 mL> 35.88 mLNot performed MRI
94 (23.04)94 (23.04)
220 (53.92)
55.18 ± 10.5758.00 ± 10.71
——Pathological grade 0.024* Low (GS ≤ 7)
High (GS > 7)Missing information
193 (47.30)206 (50.49)
9 (2.21)
55.11 ± 9.4358.34 ± 13.05
——Pathological stage 0.391#
pT2pT3pT4biopsy
102 (25.00)16 (3.92)34 (8.33)
256 (62.75)
54.10 ± 8.5255.56 ± 6.2458.16 ± 13.45
——ECT(bone metastases)
< 0.001a *< 0.001b #
Non-bone metastasesSuspicionBone metastasesNot performed ECT
121 (29.66)59 (14.46)41 (10.05)
188 (46.08)
54.58 ± 9.7459.89 ± 12.2469.97 ± 15.14
——PCa: prostate cancer; BPH: benign prostate hyperplasia; PV: prostate volume; GS: Gleason score; Continuous variables are
expressed as mediana; Pathological grade fall into high grade and low grade using GS; Pathological stage is assessed by
postoperative pathology results (not biopsy) in accordance with 2002 TNM classification; p < 0.05 is considered as
statistically significant; pa: no-bone metastases versus bone metastases; pb: no-bone metastases versus suspicion versus bone
metastases; p*: Mann-Whitney U-test; p#: Kruskal-Wallis H-test.
16
15
Table 3. Univariate analysis of preoperative variables prognostic for PCa and its bone metastases
PCa vs BPH Bone metastases vs Non-bone metastases
Variables HR (95%CI) p value Variables HR (95%CI) p value
Age 1.011 (0.987~1.103) 0.351 Age 0.999 (0.956~1.045) 0.974
AKP 1.016
(1.006~1.025)
0.001 AKP1.042 (1.025~1.058)
0.000
LDH 1.002
(0.999~1.006)
0.230 LDH 1.016 (1.008~1.025) 0.000
FIB 1.205
(0.974~1.491)
0.086 FIB1.521 (1.132~2.042)
0.005
PSA 1.058
(1.036~1.080)
0.000 PSA1.006 (1.003~1.008)
0.000
PV 0.990
(0.985~0.995)
0.000 PV 1.000 (0.996~1.003) 0.788
Pathological grade
High vs Low4.904 (2.076~11.582) 0.000
SA (mg/dL)
> 52.35* vs ≤ 52.35*
> 59# vs ≤ 59#
2.040
(1.370~3.037)
2.061
(1.281~3.316)
0.000
0.003
SA (mg/dL)
> 52.35* vs ≤ 52.35*
> 59# vs ≤ 59#
5.246 (1.925~14.296)
16.910 (6.744~42.398)
0.001
0.000
PCa: prostate cancer; BPH: benign prostate hyperplasia; LDH: lactate dehydrogenase; AKP: alkaline phosphatase ; FIB:
fibrinogen; PSA: prostate specific antigen; PV: prostate volume; HR: hazard ratio; Pathological grade: high (Gleason score
> 7); low (Gleason score 7); SA*: cut-off value of SA levels regarding prediction of PCa; SA#: cut-off value of SA levels
regarding prediction of bone metastases. p < 0.05 is considered as statistically significant; 95% CI: 95% confidence interval.
17
16
Table 4. Multivariate analysis of preoperative variables prognostic for PCa and its bone metastases
PCa vs BPH Bone metastases vs Non-bone metastases
Variables HR (95%CI) p value Variables HR (95%CI) p value
AKP 1.010 (0.999~1.022) 0.069 AKP 1.046(1.021~1.072) 0.000
LDH 0.997 (0.993~1.001) 0.183 LDH 1.008(0.995~1.022) 0.215
FIB 0.912 (0.732~1.136) 0.411 FIB 0.738(0.388~1.404) 0.354
PSA 1.059 (1.037~1.082) 0.000 PSA 1.005(1.002~1.009) 0.006
Pathological grade
High vs Low19.774 (2.460~158.925) 0.005
SA (mg/dL)
> 52.35 vs ≤ 52.351.645 (1.033~3.316) 0.036
SA (mg/dL)
> 59 vs ≤ 596.421 (1.502~27.449) 0.012
PCa: prostate cancer; BPH: benign prostate hyperplasia; LDH: lactate dehydrogenase; AKP: alkaline phosphatase ; FIB:
fibrinogen; PSA: prostate specific antigen; PV:prostate volume; HR: hazard ratio; Pathological grade: high (Gleason score >
7); low (Gleason score 7); p < 0.05 is considered as statistically significant; 95% CI: 95% confidence interva.
17
18
Fig. 1 (A) Comparison of SA levels between PCa and BPH patients; (B) Comparison of SA levels
among bone metastases, suspicious bone metastases, and non-bone metastases in PCa patients (pa:
no-bone metastases versus suspicion versus bone metastases; pb: no-bone metastases versus bone
metastases).
19
18
Fig. 2 The comparisons of SA levels in various subgroups of PCa patients. (A) LDH; (B) AKP; (C)
FIB; (D) PSA; (E) Gleason score.

19
20
Fig. 3 The comparisons of SA levels within different subgroups of patients diagnosed as PCa. (A)
Age; (B) PV; (C) Pathological stage.
21
20
Fig. 4 Liner correlations between SA levels and LDH, AKP, FIB, PSA in PCa patients. (A) Liner
correlation between SA levels and LDH; (B)Liner correlation between SA levels and AKP; (C) Liner
correlation between SA levels and FIB; (D) Liner correlation between SA levels and PSA .
22
21
Fig. 5 (A) ROC curves for determination of cut-off value of SA levels regarding prediction of PCa;
(B) ROC curves for determination of cut-off value of SA levels regarding prediction of bone
metastases in PCa patients.

23
22
Abbreviations
PCa prostate cancer
BPH benign prostatic hyperplasia
SA serum sialic acid
ECT emission computerized tomography
MRI magnetic resonance imaging
LDH lactate dehydrogenase
AKP alkaline phosphatase
FIB fibrinogen
PSA prostate specific antigen
PV prostate volume
GS Gleason score
AUC the area under the ROC
PPV positive predictive values
NPV negative predictive values
ROC the receiver operative characteristic
HR hazard ratios
95% CI 95% confidence interval


