
Full title:Looking for the positives? A mixed-methods study using routinely collected, publicly available data to identify positive deviants in healthcare quality and safety.
Short title:Positive deviants in quality and safety.
Jane K. O’Hara*Leeds Institute of Medical Education, University of Leeds / Yorkshire & Quality Research Group, Bradford Institute for Health ResearchJane.o’[email protected]
Katja GrasicCentre for Health Economics, University of [email protected]
Nils GutackerCentre for Health Economics, University of [email protected]
Andrew StreetDepartment of Health Policy, London School of Economics and Political [email protected]
Robbie FoyLeeds Institute of Health Sciences, University of [email protected]
Carl ThompsonSchool of Healthcare, University of [email protected]
John WrightYorkshire & Quality Research Group, Bradford Institute for Health [email protected]
Rebecca LawtonSchool of Psychology, University of Leeds / Yorkshire & Quality Research Group, Bradford Institute for Health [email protected]
Competing interests
1
We declare that we have no competing interests.
FundingThe research was funded by the NIHR CLAHRC Yorkshire and Humberhttp://clahrc-yh.nihr.ac.uk. The views expressed are those of the authors and not necessarily those of the NHS, the NIHR or the Department of Health.
Ethical approvalThis study did not require ethical approval.
GuarantorJOH is the submitting author and acts as guarantor for the manuscript.
ContributorshipJOH drafted the paper, and managed the project described. RL led the project, with AS, KG, NG conducting the statistical analysis. RL, RF, CT, JW all contributed to the expert group and helped draft the paper. All authors commented on and agreed the final draft of the manuscript.
AcknowledgementsThe authors would like to thank the members of the CLAHRC YH ‘Evidence Based Transformations in the NHS’ Steering Group for their contributions to this study.
Abstract word count: 248Main text word count: 4067Number of figures and tables: 6Appendices: 3
2

Abstract:
Objectives:Solutions to quality and safety problems exist within healthcare organisations, but to maximise the learning from these positive deviants, we first need to identify them. This study explores using routinely collected, publicly available data in England to identify positively deviant services in one region of the country.Design and setting:A mixed methods study undertaken July 2014 to February 2015, employing expert discussion, consensus, and statistical modelling to identify indicators of quality and safety, establish a set of criteria to inform decisions about which indicators were robust and useful measures, and whether these could be used to identify positive deviants. Results: We identified 49 indicators of quality and safety from acute care settings across 8 data sources. Twenty six indicators did not allow comparison of quality at the sub-hospital level. Of the 23 remaining indicators, 12 met all criteria and were possible candidates for identifying positive deviants. Four indicators (readmission and patient reported outcomes for hip and knee surgery) offered indicators of the same service. These were selected by an expert group as the basis for statistical modelling, which supported identification of one service in Yorkshire and Humber showing a 50% positive deviation from the national average.Conclusion: Relatively few indicators of quality and safety relate to a service level, making meaningful comparisons and local improvement based on the measures, difficult. It was possible, however, to identify a set of indicators that provided robust measurement of the quality and safety of services providing hip and knee surgery.
Key words: Positive deviance, quality measurement, safety measurement, outliers.
3

Introduction
Positive deviance, originally founded in international public health[1] is an approach to supporting quality improvements through identification of successful solutions to problems from communities, teams or individuals that show consistently exceptional performance in the area of interest.[2-3] The power of positive deviance lies in the identification of strategies to solve a problem from within the same community experiencing the problem. Such strategies are, arguably, more likely to be adopted and sustained by the wider community.[1] Bradley and colleagues[4] have outlined a four stage process (see Figure 1) for using positive deviance within healthcare. The first stage in this process is the identification of positive outliers.
Methods for identifying performance outliers have been used for fifty years in healthcare (e.g. ‘tracers’[5]) but are fraught with methodological and conceptual issues, including multiple ways of measuring the same thing,[6] as well as problems with the simple act of ‘measurement’ itself.[7] Whilst the identification of outliers in healthcare is not new, focussing on the ‘positive’ end of the distribution is more novel.[3] Positive deviance is no mere statistical or technical exercise; it is an improvement method that seeks to understand the nature of the ‘deviance’, and to spread sustainable solutions to the wider healthcare community. This focus mitigates some of the concerns raised in recent critiques of the assessment of quality and safety in healthcare,[6,8] as outliers are identified with the explicit purpose of learning how they achieve this status.
The positive deviance approach has recently begun to gain traction within health services, with successful application across such diverse areas as hand hygiene,[9] acute cardiac care,[10] and diabetes care in nursing homes.[11] However, a recent systematic review highlighted that greater transparency is required in the reporting of methods used to identify variance, particularly due to the novelty of this approach in healthcare.[2] But if the method is to be used more widely than healthcare research, it is important to understand whether routinely collected data can be used to understand variation in quality and safety across services, and whether it is possible to identify positive outliers from these existing data sources.
AimThis paper describes our exploration of the initial stage of the positive deviance approach (stage one in Figure 1). Our overall aim was to explore the identification of hospital services that demonstrate exemplary quality and safety performance in a single region in England using routinely collected, publicly available data.
4

Figure 1. The positive deviance process for healthcare organisations (reproduced with permission[4]).
Objectives
1) identify quality and safety indicators that are publicly available or can be constructed from routinely collected datasets, and develop criteria for assessing the suitability of available indicators for identifying positive deviants;2) using these criteria, assess the suitability of available indicators for identifying positive deviants;3) critically examine a sample of shortlisted indicators as candidates for the identification of positive deviants.
Methods
This was a mixed methods study undertaken between July 2014 and February 2015, employing expert discussion, consensus, and statistical modelling. The study was overseen by an expert group of academics and clinicians (n = 26) convened as part of the NIHR-funded Collaboration for Leadership in Applied Health Research and Care Yorkshire & Humber (CLAHRC-YH). Within this group there was expertise in statistical analysis and health economics, patient safety, health services and implementation research, health and organisational
5

psychology, medical and surgical specialties, primary care, and nursing. A full list of the expert group is presented in Appendix 1. The group met face-to-face every three months for the duration of the study. The study was led by a small research team comprising health services researchers (JOH and RL) along with health economists (KG, NG and AS). The study focused upon data from the Yorkshire and Humber region. This is a geographically large region in the north of England, with a population of approximately 5.3 million, 22 NHS trusts, 23 clinical commissioning groups, and a workforce totalling 125,875.
Research objective 1: Identifying a set of quality and safety indicators, and developing criteria for their assessment
DesignDiscussion and consensus agreement within expert group.
Procedure
Step 1: A systematic review of all existing indicators of quality and safety was outside the scope of this project. Instead, the expert group constructed a preliminary list of sources of indicator definitions based on their knowledge of indicators used for hospital performance assessment in the English NHS context (e.g. those in the NHS Outcomes Framework) and internationally (e.g. by the OECD). Only those indicator definitions that could be applied to administrative English hospital data that are readily available to local quality managers and health service researchers were considered (Figure 2). This excluded indicators constructed from national audits and those relying on patient identifiable information. This list was circulated via email and group members were asked to identify gaps and suggest additional indicators. At the second expert group meeting the final list was ratified.
Step 2: In order for the available indicators to be assessed for their suitability in identifying positive deviants, a set of criteria was developed by the expert group. Whilst there are examples within the published literature relating to criteria for quality indicator development,[12-13] there is a lack of an overarching approach to assessing measures within the context of positive deviance,[2] as well as wider quality and safety measurement.[14]
The approach to developing a robust set of criteria was, therefore, necessarily iterative in nature and broadly based upon the principles espoused by the Institute of Medicine.[15] The five principles are: i) importance (policy relevance, covering the population of interest, amenable to change), ii) scientific soundness (validity and reliability), iii) feasibility (in this case - publicly available), iv) alignment (interpretable, stable definitions over time), and v)
6

comprehensiveness (safety, effectiveness, patient-centredness, timeliness, efficiency, and equity).[16] These principles were used as a starting point to develop our criteria, and expanded to incorporate epidemiological, health economic and quality improvement considerations. Further, criteria were required to facilitate progression to Stages 2-4 of the positive deviance approach (see Figure 1).
Figure 2: Sources of quality and safety indicators for secondary healthcare services in England
Published indicators: Patient Safety Thermometer (PST): https://www.safetythermometer.nhs.uk/ NHS Staff Survey (NHSSS): http://www.nhsstaffsurveys.com National Patient Safety Agency Dataset (NPSA): http://www.nrls.npsa.nhs.uk Public Health England (PHE): http://www.phoutcomes.info/
Indicators that can be constructed from English Hospital Episode Statistics (HES) OECD health indicators https://data.oecd.org/health.htm Agency for Healthcare Research and Quality (AHRQ) Quality Indicators
https://www.qualityindicators.ahrq.gov Quality Watch; series of indicators by The Health Foundation and the Nuffield
Trust http://www.qualitywatch.org.uk/ NHS Outcomes Framework http://content.digital.nhs.uk/nhsof
From these discussions, the expert group agreed a set of twelve criteria to assess the appropriateness of an indicator. See Table 1 for a full description of the developed criteria.
Research objective 2: Assessment of available indicators against the agreed criteria
DesignA mixed methods approach was employed.
Procedure
Step 1: Coverage of population of interestAll indicators listed in Table 2 were first assessed to ensure that they met the first criterion (Table 1), with the population of interest in this study being patients within acute healthcare services. All those that passed this criterion were put forward for assessment at Step 2.
Step 2: Relevance for clinical teams
7

It has been recently argued by experts in measuring variation that “single overall indicators that attempt to judge the quality of a whole hospital or primary care centre should be avoided. Given the complexity and diversity of clinical care undertaken by institutions, an [aggregated] measure obscures more than it illuminates and should be resisted”.[8, p.1] This is supported by recent empirical work that found that, for patient safety culture, the most significant source of variability was at the level of the unit or clinical area.[17] For these reasons the expert group made the decision that each indicator had to represent data at the level of the ward, service or department. This second criterion listed in Table 1 was therefore assessed by a four member sub-group, comprising two senior nurses and two senior physicians, with those receiving a >50% consensus shortlisted to be considered in the later stages of assessment.
Step 3: Statistical propertiesThe third step of this process was assessment against criteria 3 to 7 (Table 1), which required exploration of the statistical properties of the indicators. We constructed descriptive statistics summarizing the ‘at risk’ population and incidence rates for each of the indicators, and calculated between-provider variation in the indicator achievements. This was done at national level including all relevant cases in the English NHS. We did not impose any strict statistical cut-offs on any of these statistics; instead we discussed the results with the wider group and emphasized possible statistical problems that might arise. The descriptive statistics were calculated for each of the three years’ worth of data. This provided an indication of whether the indicator was consistently measured over time or whether there were coding changes.
Step 4: Relevance and impactThe final step involved assessing the shortlisted indicators against criteria 8 to 12 in Table 1 again via the full expert group.
Research objective 3: Using the shortlisted indicators to identify positive deviants
DesignStatistical analysis of routine patient-level data to adjust for case-mix differences among hospitals and isolate hospital performance effects.
ProcedureWe examined the shortlisted indicators using data drawn from Hospital Episode Statistics (HES) and other data sources (see Figure 2) covering the years 2011 to 2013. Hospitals were excluded from the analysis if they treated fewer than 30 patients for each indicator throughout this period.
8

Patients are clustered within hospitals, and we applied hierarchical models to differentiate between patient and hospital influences on observed performance.[18-20] Provider performance is captured by a random error term from which we derive Empirical Bayes predictions of individual hospitals’ performances.[21] We estimated logistic regression models for binary outcomes (yes/no) and ordinary least squares regression models for continuous variables. Risk-adjusters included: age (in 5 year bands except >85), sex, age-sex interactions, indicators for the presence of individual Elixhauser comorbid conditions [22-23], area-level income deprivation (measured at lower super output area (LSOA) level and coded as quintiles of the empirical distribution), and year of admission.
In the main statistical analyses, data were pooled across the three financial years to improve statistical power.[24] In sensitivity analyses we explored each hospital’s performance by year to ascertain stability over time and rule out temporary shocks that may have driven the pooled performance estimate. We performed separate analyses for each of the patient group and indicator.
Uncertainty with regard to performance estimates was assessed through one-sided hypothesis tests of positive deviations from the common intercept (i.e. the national average). These statistical tests were not used as a selection mechanism but solely as a screening device to guard against selecting hospitals that appeared to be performing well by chance.
Results
Research objective 1: Identifying a set of quality and safety indicators, and developing criteria for their assessment
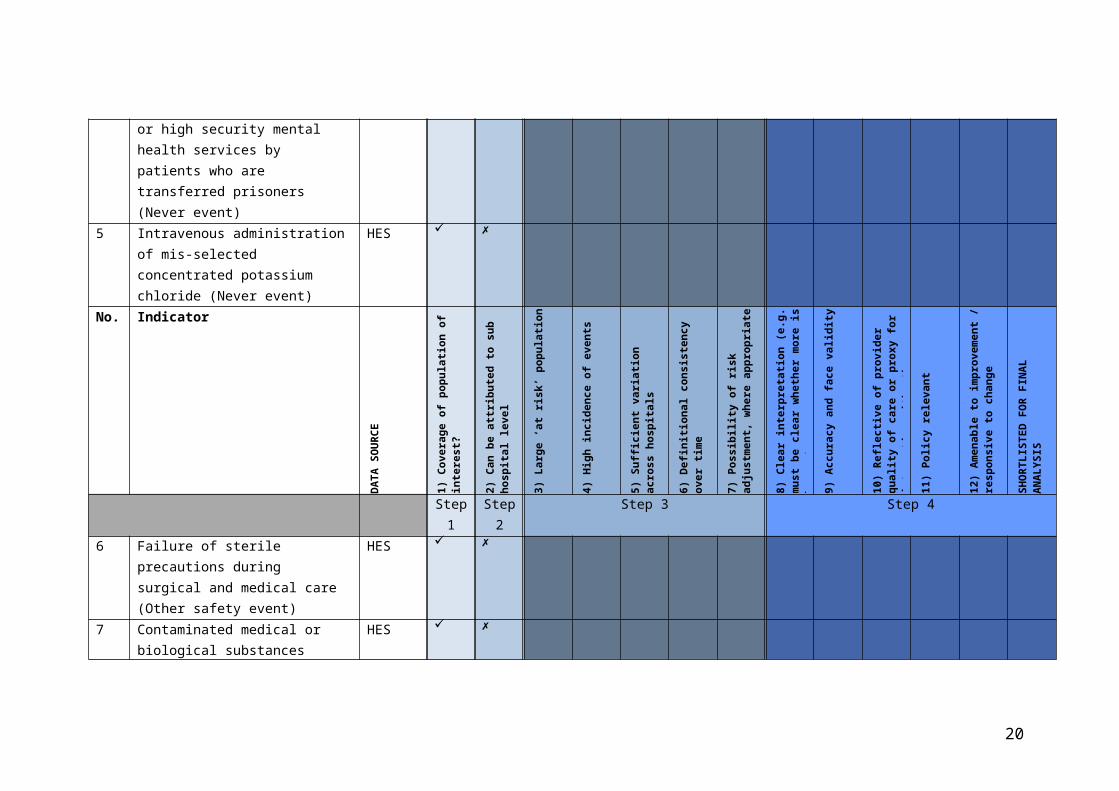
Following discussion within the expert group, we were able to extract or construct a total of 49 indicators of quality and safety from the datasets listed in Figure 2. The full list of these indicators is detailed in Table 2. Following discussion within the expert group, a set of 12 criteria was agreed. Criteria are listed in Table 1, in the order that they were applied to each indicator.
The first criterion assesses the degree to which an indicator relates to the population of interest, which in this context refers to any publicly available and routinely collected measure of quality and safety within acute healthcare services. The second criterion was specifically related to the positive deviance approach, in that indicators needed to specifically represent (or be interpretable as) a measure of service level or unit quality and safety, to allow further qualitative exploration of the likely origins of the deviance. For this reason, this criterion was assessed early in the process to avoid undertaking unnecessary
9
assessment of indicators that would fail to support the further planned stages of the positive deviance approach.
Criteria 3 to 7 all concern the statistical properties of the indicators, with assessment at this stage undertaken by the health economists within the expert group (KG, NG and AS) (See Appendix 3 for full results). Greater overall benefits are more likely to be realized for larger ‘at risk’ populations, all else equal, so this forms criterion 3. The fourth criterion considers whether there is a sufficiently high incidence of events within this population for statistical analyses to be feasible, recognizing that it is difficult to identify significant provider variation for rare events. The next step (criterion 5) is to consider variation in the indicator across hospitals: if all exhibit the same level of achievement there would be no positive (or negative) deviants. Sometimes the definition of indicators changes over time, or coding practices change, making it difficult to make valid comparisons over time. Criterion 6 captures this possibility. Finally in this stage, criterion 7 considers whether the indicator permits risk-adjustment, recognizing that variation in raw measures may reflect differences among patients rather than the performance of the organisations under consideration. Some indicators do not require risk adjustment, notably never events which should not occur for anyone. All statistical criteria had to be met for consideration within the final assessment stage.
Criteria 8 to 12 were then applied to assess the degree to which indicators represent robust, interpretable and relevant measures of quality and safety within acute healthcare, that are likely to be responsive to change during later stages of the positive deviance approach.
10

Table 1: List of criteria, stage assessed and nature of assessment
Criteria When assessed? Assessed through?1) Coverage of population of interest
Step 1:Only measures passing this criterion entered into long list
Expert discussion
2) Can be attributed to sub hospital level (e.g. clinical teams/departments)
Step 2 Consensus among four clinicians
3) Large ‘at risk’ population
Step 3 Data exploration
4) High incidence of events Step 3 Data exploration5) Sufficient variation across hospitals
Step 3 Data exploration
6) Definitional consistency over time
Step 3 Data exploration
7) Possibility of risk adjustment, where appropriate
Step 3 Data exploration
8) Clear interpretation (e.g. is more always better?)
Step 4 Expert discussion
9) Data accuracy and face validity
Step 4 Expert discussion
10) Reflective of provider quality or safety of care, or proxy for interaction with other care providers (e.g. primary care)
Step 4 Expert discussion
11) Policy relevant Step 4 Expert discussion12) Amenable to improvement / responsive to change
Step 4 Expert discussion
11

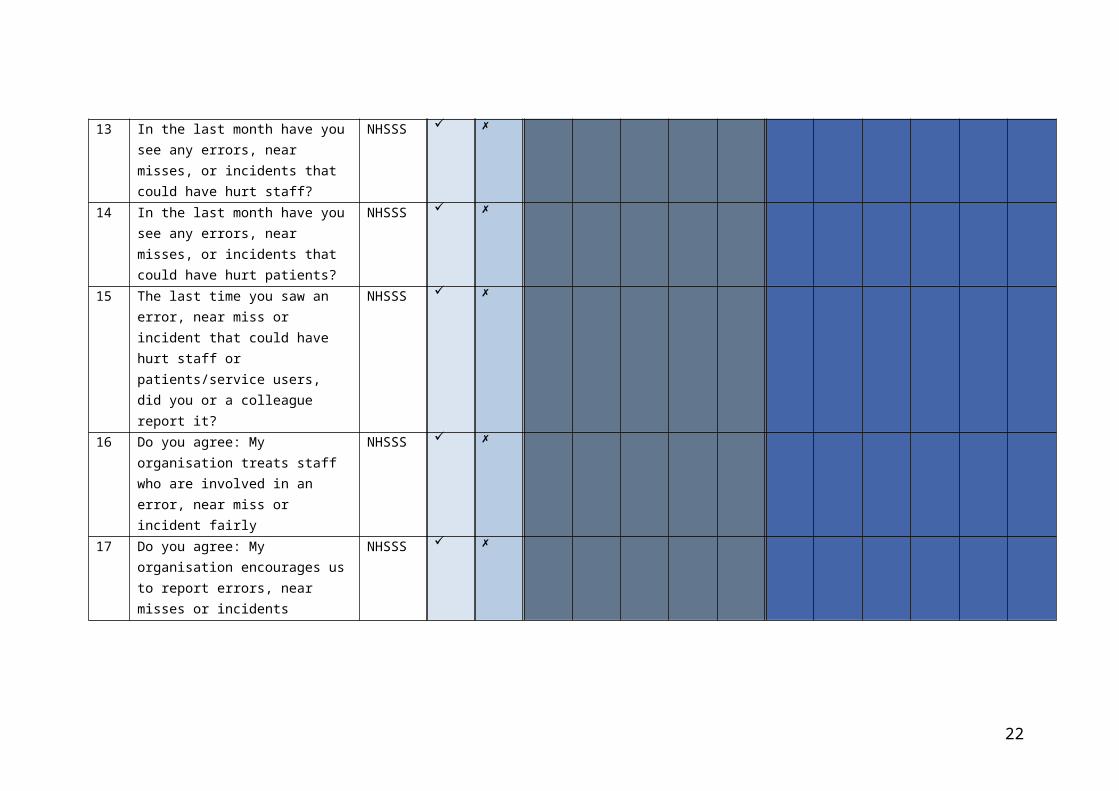
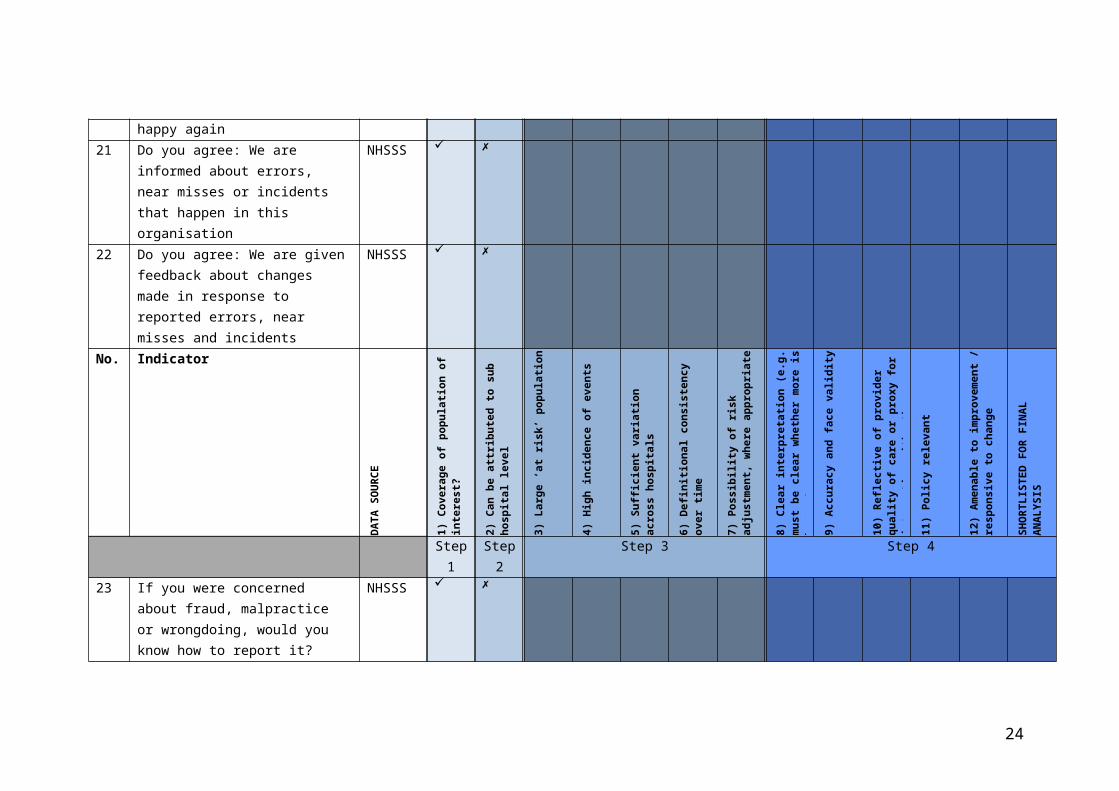
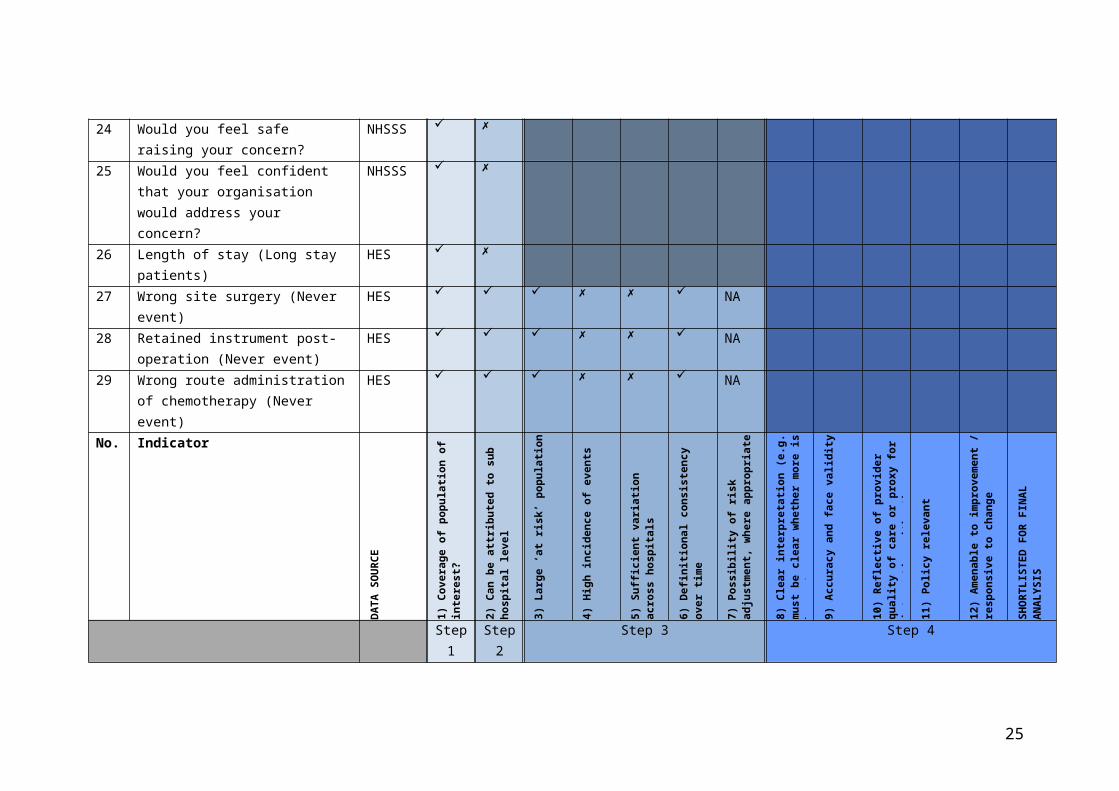
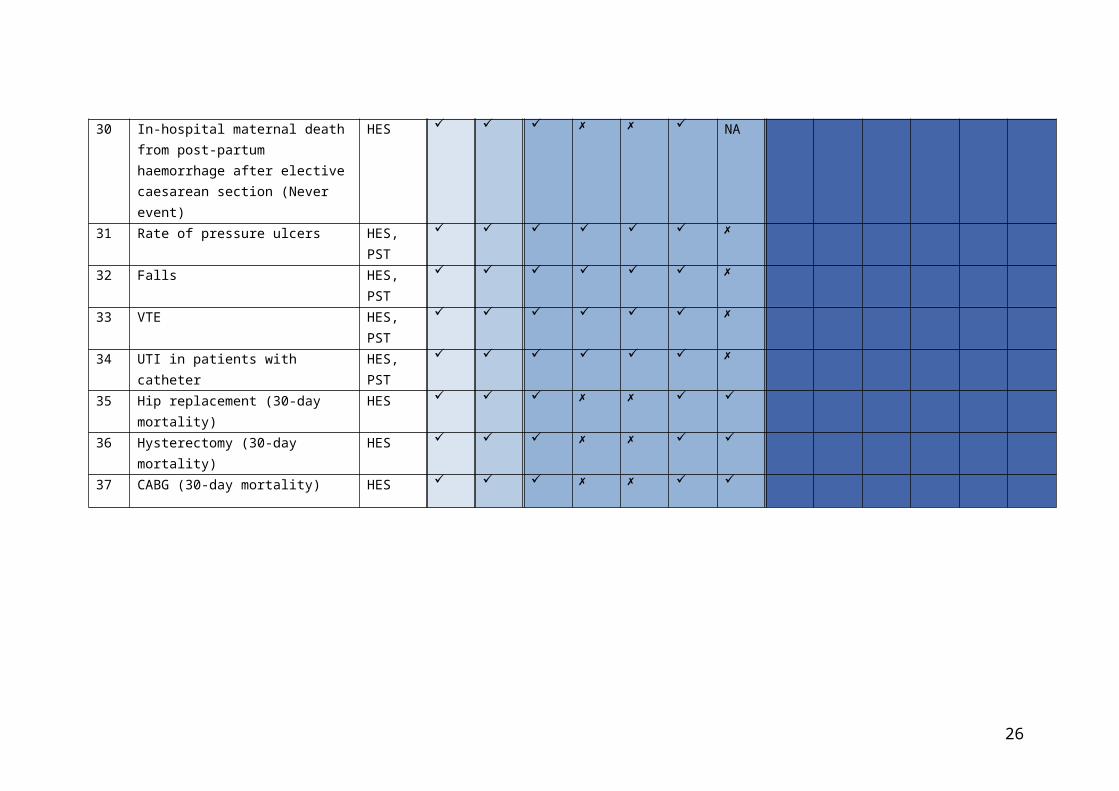
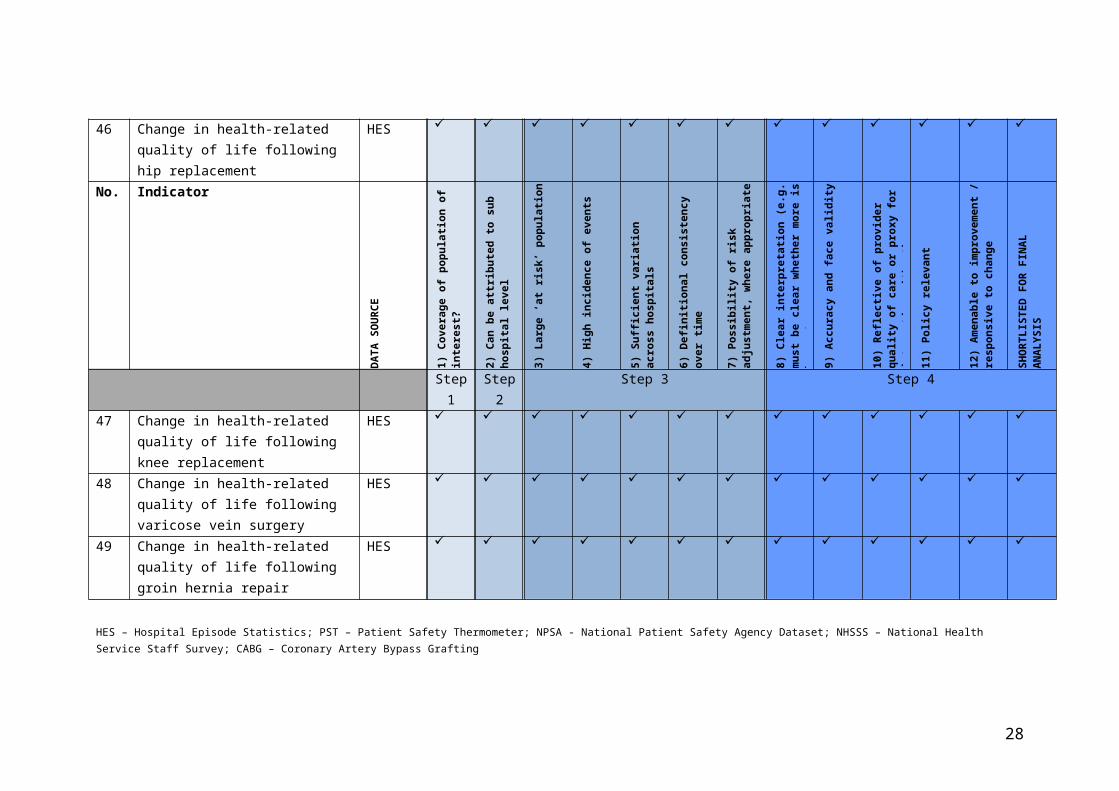
Table 2: Long list of available indicators, assessment against agreed criteria, and final shortlisted indicators
No. Indicator
DA
TA
SO
UR
CE
1)
Cove
rage
of p
opu
lati
on o
f in
tere
st?
2)
Can
be
attr
ibu
ted
to
sub
hos
pit
al
leve
l
3)
Larg
e ‘a
t ris
k’ p
opu
lati
on
4)
Hig
h in
cid
ence
of e
ven
ts
5)
Suff
icie
nt
vari
atio
n a
cros
s h
osp
ital
s
6)
Def
init
ion
al c
onsi
sten
cy o
ver
tim
e
7)
Pos
sib
ilit
y of
ris
k a
dju
stm
ent,
w
her
e ap
pro
pri
ate
8)
Clea
r in
terp
reta
tion
(e.
g. m
ust
be
clea
r w
het
her
mor
e is
bet
ter)
9)
Acc
ura
cy a
nd
face
val
idit
y
10
) R
efle
ctiv
e of
pro
vid
er q
ual
ity
of
care
or
pro
xy fo
r in
tera
ctio
n w
ith
ot
her
car
e p
rovi
der
s
11
) P
olic
y re
leva
nt
12
) A
men
able
to
imp
rove
men
t /
resp
onsi
ve t
o ch
ange
SHO
RT
LIST
ED
FO
R F
INA
L A
NA
LYSI
S
Step 1
Step 2
Step 3 Step 4
1 Patient safety incident reports NRLS
2 Misplaced naso or orogastric tube not detected prior to use (Never event)
HES
3 Inpatient suicide using non-collapsible rails (Never event)
HES
4 Escape from within the secure perimeter of medium or high security mental health services by patients who are transferred prisoners (Never event)
HES
5 Intravenous administration of mis-selected concentrated potassium chloride (Never event)
HES
12
No. Indicator
DA
TA
SO
UR
CE
1)
Cove
rage
of p
opu
lati
on o
f in
tere
st?
2)
Can
be
attr
ibu
ted
to
sub
hos
pit
al
leve
l
3)
Larg
e ‘a
t ris
k’ p
opu
lati
on
4)
Hig
h in
cid
ence
of e
ven
ts
5)
Suff
icie
nt
vari
atio
n a
cros
s h
osp
ital
s
6)
Def
init
ion
al c
onsi
sten
cy o
ver
tim
e
7)
Pos
sib
ilit
y of
ris
k a
dju
stm
ent,
w
her
e ap
pro
pri
ate
8)
Clea
r in
terp
reta
tion
(e.
g. m
ust
be
clea
r w
het
her
mor
e is
bet
ter)
9)
Acc
ura
cy a
nd
face
val
idit
y
10
) R
efle
ctiv
e of
pro
vid
er q
ual
ity
of
care
or
pro
xy fo
r in
tera
ctio
n w
ith
ot
her
car
e p
rovi
der
s
11
) P
olic
y re
leva
nt
12
) A
men
able
to
imp
rove
men
t /
resp
onsi
ve t
o ch
ange
SHO
RT
LIST
ED
FO
R F
INA
L A
NA
LYSI
S
Step 1
Step 2
Step 3 Step 4
6 Failure of sterile precautions during surgical and medical care (Other safety event)
HES
7 Contaminated medical or biological substances (Other safety event)
HES
8 Unintentional cut, puncture, perforation or haemorrhage during surgical and medical care (Other safety event)
HES
9 MRSA rates HES, PHE
10 Survival following pneumonia HES
11 Pneumonia (28-day emergency readmission)
HES
12 Deep Vein Thrombosis (NHS Thermometer)
HES, PST, NPSA
13
No. Indicator
DA
TA
SO
UR
CE
1)
Cove
rage
of p
opu
lati
on o
f in
tere
st?
2)
Can
be
attr
ibu
ted
to
sub
hos
pit
al
leve
l
3)
Larg
e ‘a
t ris
k’ p
opu
lati
on
4)
Hig
h in
cid
ence
of e
ven
ts
5)
Suff
icie
nt
vari
atio
n a
cros
s h
osp
ital
s
6)
Def
init
ion
al c
onsi
sten
cy o
ver
tim
e
7)
Pos
sib
ilit
y of
ris
k a
dju
stm
ent,
w
her
e ap
pro
pri
ate
8)
Clea
r in
terp
reta
tion
(e.
g. m
ust
be
clea
r w
het
her
mor
e is
bet
ter)
9)
Acc
ura
cy a
nd
face
val
idit
y
10
) R
efle
ctiv
e of
pro
vid
er q
ual
ity
of
care
or
pro
xy fo
r in
tera
ctio
n w
ith
ot
her
car
e p
rovi
der
s
11
) P
olic
y re
leva
nt
12
) A
men
able
to
imp
rove
men
t /
resp
onsi
ve t
o ch
ange
SHO
RT
LIST
ED
FO
R F
INA
L A
NA
LYSI
S
Step 1
Step 2
Step 3 Step 4
13 In the last month have you see any errors, near misses, or incidents that could have hurt staff?
NHSSS
14 In the last month have you see any errors, near misses, or incidents that could have hurt patients?
NHSSS
15 The last time you saw an error, near miss or incident that could have hurt staff or patients/service users, did you or a colleague report it?
NHSSS
16 Do you agree: My organisation treats staff who are involved in an error, near miss or incident fairly
NHSSS
17 Do you agree: My organisation encourages us to report errors, near misses or incidents
NHSSS
14

No. Indicator
DA
TA
SO
UR
CE
1)
Cove
rage
of p
opu
lati
on o
f in
tere
st?
2)
Can
be
attr
ibu
ted
to
sub
hos
pit
al
leve
l
3)
Larg
e ‘a
t ris
k’ p
opu
lati
on
4)
Hig
h in
cid
ence
of e
ven
ts
5)
Suff
icie
nt
vari
atio
n a
cros
s h
osp
ital
s
6)
Def
init
ion
al c
onsi
sten
cy o
ver
tim
e
7)
Pos
sib
ilit
y of
ris
k a
dju
stm
ent,
w
her
e ap
pro
pri
ate
8)
Clea
r in
terp
reta
tion
(e.
g. m
ust
be
clea
r w
het
her
mor
e is
bet
ter)
9)
Acc
ura
cy a
nd
face
val
idit
y
10
) R
efle
ctiv
e of
pro
vid
er q
ual
ity
of
care
or
pro
xy fo
r in
tera
ctio
n w
ith
ot
her
car
e p
rovi
der
s
11
) P
olic
y re
leva
nt
12
) A
men
able
to
imp
rove
men
t /
resp
onsi
ve t
o ch
ange
SHO
RT
LIST
ED
FO
R F
INA
L A
NA
LYSI
S
Step 1
Step 2
Step 3 Step 4
18 Do you agree: My organisation treats reports of errors, near misses or incidents confidentially
NHSSS
19 Do you agree: My organisation blames or punishes people who are involved in errors, near misses or incidents
NHSSS
20 Do you agree: When errors, near misses or incidents are reported, my organisation takes action to ensure that they do not happy again
NHSSS
21 Do you agree: We are informed about errors, near misses or incidents that happen in this organisation
NHSSS
22 Do you agree: We are given feedback about changes made in response to reported errors, near misses and incidents
NHSSS
15

No. Indicator
DA
TA
SO
UR
CE
1)
Cove
rage
of p
opu
lati
on o
f in
tere
st?
2)
Can
be
attr
ibu
ted
to
sub
hos
pit
al
leve
l
3)
Larg
e ‘a
t ris
k’ p
opu
lati
on
4)
Hig
h in
cid
ence
of e
ven
ts
5)
Suff
icie
nt
vari
atio
n a
cros
s h
osp
ital
s
6)
Def
init
ion
al c
onsi
sten
cy o
ver
tim
e
7)
Pos
sib
ilit
y of
ris
k a
dju
stm
ent,
w
her
e ap
pro
pri
ate
8)
Clea
r in
terp
reta
tion
(e.
g. m
ust
be
clea
r w
het
her
mor
e is
bet
ter)
9)
Acc
ura
cy a
nd
face
val
idit
y
10
) R
efle
ctiv
e of
pro
vid
er q
ual
ity
of
care
or
pro
xy fo
r in
tera
ctio
n w
ith
ot
her
car
e p
rovi
der
s
11
) P
olic
y re
leva
nt
12
) A
men
able
to
imp
rove
men
t /
resp
onsi
ve t
o ch
ange
SHO
RT
LIST
ED
FO
R F
INA
L A
NA
LYSI
S
Step 1
Step 2
Step 3 Step 4
23 If you were concerned about fraud, malpractice or wrongdoing, would you know how to report it?
NHSSS
24 Would you feel safe raising your concern?
NHSSS
25 Would you feel confident that your organisation would address your concern?
NHSSS
26 Length of stay (Long stay patients) HES
27 Wrong site surgery (Never event) HES NA
28 Retained instrument post-operation (Never event)
HES NA
29 Wrong route administration of chemotherapy (Never event)
HES NA
16

No. Indicator
DA
TA
SO
UR
CE
1)
Cove
rage
of p
opu
lati
on o
f in
tere
st?
2)
Can
be
attr
ibu
ted
to
sub
hos
pit
al
leve
l
3)
Larg
e ‘a
t ris
k’ p
opu
lati
on
4)
Hig
h in
cid
ence
of e
ven
ts
5)
Suff
icie
nt
vari
atio
n a
cros
s h
osp
ital
s
6)
Def
init
ion
al c
onsi
sten
cy o
ver
tim
e
7)
Pos
sib
ilit
y of
ris
k a
dju
stm
ent,
w
her
e ap
pro
pri
ate
8)
Clea
r in
terp
reta
tion
(e.
g. m
ust
be
clea
r w
het
her
mor
e is
bet
ter)
9)
Acc
ura
cy a
nd
face
val
idit
y
10
) R
efle
ctiv
e of
pro
vid
er q
ual
ity
of
care
or
pro
xy fo
r in
tera
ctio
n w
ith
ot
her
car
e p
rovi
der
s
11
) P
olic
y re
leva
nt
12
) A
men
able
to
imp
rove
men
t /
resp
onsi
ve t
o ch
ange
SHO
RT
LIST
ED
FO
R F
INA
L A
NA
LYSI
S
Step 1
Step 2
Step 3 Step 4
30 In-hospital maternal death from post-partum haemorrhage after elective caesarean section (Never event)
HES NA
31 Rate of pressure ulcers HES, PST
32 Falls HES, PST
33 VTE HES, PST
34 UTI in patients with catheter HES, PST
35 Hip replacement (30-day mortality) HES
36 Hysterectomy (30-day mortality) HES
37 CABG (30-day mortality) HES
17

No. Indicator
DA
TA
SO
UR
CE
1)
Cove
rage
of p
opu
lati
on o
f in
tere
st?
2)
Can
be
attr
ibu
ted
to
sub
hos
pit
al
leve
l
3)
Larg
e ‘a
t ris
k’ p
opu
lati
on
4)
Hig
h in
cid
ence
of e
ven
ts
5)
Suff
icie
nt
vari
atio
n a
cros
s h
osp
ital
s
6)
Def
init
ion
al c
onsi
sten
cy o
ver
tim
e
7)
Pos
sib
ilit
y of
ris
k a
dju
stm
ent,
w
her
e ap
pro
pri
ate
8)
Clea
r in
terp
reta
tion
(e.
g. m
ust
be
clea
r w
het
her
mor
e is
bet
ter)
9)
Acc
ura
cy a
nd
face
val
idit
y
10
) R
efle
ctiv
e of
pro
vid
er q
ual
ity
of
care
or
pro
xy fo
r in
tera
ctio
n w
ith
ot
her
car
e p
rovi
der
s
11
) P
olic
y re
leva
nt
12
) A
men
able
to
imp
rove
men
t /
resp
onsi
ve t
o ch
ange
SHO
RT
LIST
ED
FO
R F
INA
L A
NA
LYSI
S
Step 1
Step 2
Step 3 Step 4
38 CABG (28-day emergency readmission)
HES
39 Stroke (30-day mortality) HES
40 Hip fracture HES
41 Stroke (28-day emergency readmission)
HES
42 Hip fracture (28-day emergency readmission)
HES
43 Hip replacement (28-day emergency readmission)
HES
44 Knee replacement (28-day emergency readmission)
HES
45 Hysterectomy (28-day emergency readmission)
HES
46 Change in health-related quality of life following hip replacement
HES
18

No. Indicator
DA
TA
SO
UR
CE
1)
Cove
rage
of p
opu
lati
on o
f in
tere
st?
2)
Can
be
attr
ibu
ted
to
sub
hos
pit
al
leve
l
3)
Larg
e ‘a
t ris
k’ p
opu
lati
on
4)
Hig
h in
cid
ence
of e
ven
ts
5)
Suff
icie
nt
vari
atio
n a
cros
s h
osp
ital
s
6)
Def
init
ion
al c
onsi
sten
cy o
ver
tim
e
7)
Pos
sib
ilit
y of
ris
k a
dju
stm
ent,
w
her
e ap
pro
pri
ate
8)
Clea
r in
terp
reta
tion
(e.
g. m
ust
be
clea
r w
het
her
mor
e is
bet
ter)
9)
Acc
ura
cy a
nd
face
val
idit
y
10
) R
efle
ctiv
e of
pro
vid
er q
ual
ity
of
care
or
pro
xy fo
r in
tera
ctio
n w
ith
ot
her
car
e p
rovi
der
s
11
) P
olic
y re
leva
nt
12
) A
men
able
to
imp
rove
men
t /
resp
onsi
ve t
o ch
ange
SHO
RT
LIST
ED
FO
R F
INA
L A
NA
LYSI
S
Step 1
Step 2
Step 3 Step 4
47 Change in health-related quality of life following knee replacement
HES
48 Change in health-related quality of life following varicose vein surgery
HES
49 Change in health-related quality of life following groin hernia repair
HES
HES – Hospital Episode Statistics; PST – Patient Safety Thermometer; NPSA - National Patient Safety Agency Dataset; NHSSS – National Health Service Staff Survey; CABG – Coronary Artery Bypass Grafting
19
Research objective 2: Assessment of available indicators against the agreed criteria
A flow chart summary of the findings across the four stages addressing this second research question, is presented in Appendix 2.
Step 1: Coverage of population of interestFollowing discussion within the expert group, all indicators were judged to pass the first criterion. As per our overall objective, the population of interest referred to acute healthcare services.
Step 2: Relevance for clinical teamsTable 1 displays the results of the assessment of the second criterion by the four senior clinical staff. From the initial 49 available indicators, 23 supported measurement of quality or safety at a ward/service level. Examples of indicators failing assessment against this criterion were four of the ‘never events’, MRSA rates, pneumonia mortality and readmission data, and all indicators initially drawn from the national NHS staff survey (NHSSS). The 23 indicators passing assessment against this criterion then proceeded to Step 3.
Step 3: Statistical propertiesFollowing our examination of the available data, of the 23 indicators judged to allow scrutiny at the ward or service level, 12 failed to meet the statistical criteria we set to allow meaningful assessment of provider variation. For example, survival following CABG, hip replacement and hysterectomy were judged to have insufficient incidence and variation across hospitals to accurately model variation across hospitals over time.
Step 4: Relevance and impactThe expert group met to discuss the final set of 11 indicators, agreeing that all those shortlisted passed the criteria for Step 4.
Research objective 3: Using the shortlisted indicators to identify positive deviants
The next phase of the work was to undertake a statistical exploration of the shortlisted indicators in identifying positive deviants. Given the size and scope of the project, and the overall aim of exploring the full, four-stage positive deviance approach across subsequent work, we were precluded from undertaking this analysis on all shortlisted indicators, and sought to narrow the candidates for analysis further.
Four of the shortlisted indicators assessed quality and safety within a single service – elective hip and knee surgery - and reflected two key perspectives with both clinical outcomes (readmissions) and patient outcomes (PROMs). This
20

composite suite of indicators was judged by the expert group to provide the most robust indication of quality and safety of a service, when compared with the other single indicators reaching this stage of the process. Therefore, to continue our exploration of indicators for positive deviance, it was agreed that 28-day emergency readmissions and patient-reported health-related quality of life (HRQoL) as measured by the Oxford Hip and Knee Scores (OHS/OKS) at six months after elective primary hip or knee replacement surgery would be taken forward as the four outcomes of interest. These two surgical procedures constitute a large part of elective inpatient activity in England, are recorded in routinely collected inpatient records using well-defined procedure codes, and are commonly performed by the same clinical teams in the same facilities. Thus, the group was confident that these four measures, of all of those available from the four stages of the indicator selection, provided the best chance of identifying positive deviance from our routinely collected, publicly available datasets.
Based on the selected indicators, we examined data from 146,346 elective primary hip replacements and 163,558 knee replacements in 146 English NHS hospital trusts, of which 14 were based in the Yorkshire & Humber region. In addition to the risk factors described in the methods section, the analyses of post-operative Oxford Scores also adjusted for pre-operative HRQoL.
The results of these analyses are presented in Table 3. We adopted a purposeful sampling approach that involved comparing units/services according to their performance on each indicator against the benchmark and calculating the probability that they exceeded it. We then selected two services located in the Yorkshire & Humber region to facilitate future progression to later qualitative exploration stages of the positive deviant approach: one that appeared to perform exceptionally well against the benchmark on each of the four indicators with high probability (positive deviant; provider C), and one, for comparative purposes, that appeared to be unexceptional, but within the top end of the range (provider E). The qualitative exploration of identified services is not presented here, but will be the subject of future publications.
Figure 3 shows the performance of all hospitals in the region on each of the four indicators (expressed as percentage deviations from the benchmark), where the selected hospitals C and E are highlighted in dark colour.
A number of sensitivity analyses were performed to explore other explanations of relative performance. For example, we compared the proportion of patients at each hospital that bypassed their local provider to attend this hospital since such behaviour has been linked to unobserved severity.[25] There were concerns that some services may have been treating a more complex mix of patients (perhaps because local private providers might have been attracting less complex
21
patients), so we examined the distribution of each providers case-mix on the basis of histograms of the linear predictors for each hospital (based on the readmission analysis). We examined hospitals’ PROM survey response rates to assess the potential for reporting bias, and the proportions of patients readmitted to a different provider to the original hospital to capture differences in readmission thresholds. The two selected providers do not stand out from the other providers in Yorkshire & Humber in these analyses.
Figure 3: Performance of hip and knee services in Yorkshire & Humber relative to national average (benchmark), expressed as percentage deviation (post-op HRQoL in squared brackets).
22

Table 3: Performance metrics and results of sensitivity analyses for all hospitals in Yorkshire & Humber
Provider Number of patients
Post-operative PROM Score* p-value Probability of
readmission* p-value Probability of bypassing
Predicted risk of readmission
PROM participation
Probability of readmission elsewhere
Total hip replacement (THR)A 735 37.5 70.0% 6.0% 14.3% 10% 5.8% 54% 17.3%B 567 38.2 27.5% 6.5% 6.9% 17% 5.6% 57% 2.3%C 791 40.0 99.9% 3.3% 99.9% 12% 5.2% 45% 5.6%D 1,106 38.3 33.8% 4.8% 72.4% 34% 5.0% 63% 24.5%E 608 39.0 91.2% 5.5% 34.5% 15% 5.1% 77% 14.3%F 490 36.6 0.0% 6.1% 16.4% 10% 5.4% 64% 0.0%G 734 38.2 25.7% 6.6% 3.9% 13% 5.3% 48% 5.8%H 1,772 38.4 36.3% 5.9% 9.7% 38% 5.3% 49% 21.8%I 218 38.9 90.8% 4.9% 68.4% 61% 5.2% 63% 16.4%K 1,261 37.8 1.5% 7.4% 0.0% 29% 5.6% 69% 6.8%L 1,342 38.1 9.7% 5.8% 15.3% 26% 5.3% 52% 7.2%M 1,307 38.3 33.0% 4.8% 76.4% 8% 5.0% 64% 8.2%N 1,298 39.3 99.7% 5.2% 52.1% 18% 5.3% 62% 2.8%O 1,222 37.9 2.2% 5.6% 23.6% 27% 5.1% 61% 2.9%National 146,346 38.5 5.4% 29% 5.4% 54% 15.4%Total knee replacement (TKR)A 1,143 34.1 35.8% 4.8% 96.1% 10% 6.4% 50% 18.6%B 542 35.1 96.5% 5.4% 67.8% 16% 6.0% 55% 0.0%C 735 36.2 99.9% 4.1% 99.6% 15% 5.7% 45% 0.0%D 1,177 35.2 99.9% 4.3% 99.6% 42% 5.6% 67% 20.5%E 558 35.5 99.8% 5.9% 44.8% 16% 5.9% 76% 8.6%F 1,015 33.9 33.0% 8.5% 0.0% 9% 5.8% 62% 2.2%G 1,090 34.4 75.0% 5.8% 50.2% 13% 5.9% 54% 6.2%H 2,084 35.9 99.6% 7.8% 0.0% 37% 6.0% 53% 13.4%I 1,458 35.3 99.9% 4.8% 96.1% 68% 5.7% 61% 4.5%K 1,688 33.5 90.0% 6.6% 6.9% 31% 6.3% 65% 8.8%L 1,375 34.7 89.9% 5.6% 64.6% 23% 6.0% 44% 4.9%M 1,505 33.8 7.8% 5.9% 42.3% 8% 5.7% 66% 1.1%N 1,515 35.7 99.9% 6.9% 3.6% 19% 5.7% 57% 3.6%O 1,846 34.0 23.3% 6.1% 29.5% 25% 5.7% 61% 1.8%National 163,558 34.2 5.9% 28% 5.9% 53% 12.9%
23
Discussion
This study aimed to add to the scientific understanding of positive deviance as an improvement method, by exploring the identification of positively deviant health services from routinely collected, publicly available quality and safety data. In doing this, we developed a set of criteria for selecting indicators for the purpose of identifying positive deviants, applied criteria to shortlist potential indicators, and identified positive outliers. This paper therefore provides a replicable method by which healthcare organisations, policy makers or improvement bodies can identify positive deviants in quality or safety outcomes.
There is increasing interest within both academic and health service communities regarding the potential for approaches which seek to identify, celebrate and learn from excellent quality and safety performance. Without a systematic and standardised set of approaches to identify positive outliers, we risk a proliferation of well-intentioned but ultimately untested approaches, potentially leading to wasted effort and misdirected improvement attempts. This paper is the first to present a detailed description of this first stage of the positive deviance approach, with an explicit intention to both explicate and critique the process of identification of indicators. As such, the findings raise a number of issues.
First, we found that many of the indicators used for examining the quality and safety of health care services did not allow identification of variation at the level of the service/ward. This is critical for quality and safety improvement because large variation is expected across services within a hospital e.g. falls in elderly medical wards are more frequent than on a maternity or paediatric ward. Indeed, in terms of quality and safety, organisational level indicators may be meaningless or even obscure important differences between services across organisations.[8] Other authors have called for the collection and use of quality metrics that reflect the complexity of care,[26] which would both facilitate identification of intra-organisational variance, and local improvement efforts using the information within these contextualised indicators. Our findings suggest that, against these requirements, many existing and routinely available quality and safety indicators may be inappropriate for identifying and understanding positive deviants in quality and safety of care.
Second, a key question concerns who might undertake the positive deviance stage 1 approach outlined here. It is arguable that individual NHS hospitals may not be able to follow such a process, with issues including capability, capacity and resource implications for accessing some of the publicly accessible data used here. However, our proposed approach could easily be replicated by improvement bodies, national audits as well as policy makers and regulatory
24
authorities. For these organisations there are clear advantages of having a replicable and robust process for undertaking these types of analysis.
Finally, while there are a variety of sophisticated statistical methods to assess provider performance, there will invariably be uncertainty about the true performance of each individual provider. This implies that any selection of services/wards for further in-depth qualitative study will necessarily involve some risk of type I error, in which hospitals are falsely identified as performing exceptionally. We minimise the risk of type 1 error in this study by conducting a range of sensitivity checks and found our estimates of relative hospital performance to be robust. Above and beyond this, the costs of error in the positive deviant approach may be lower than the stigma associated with incorrectly identifying negative deviants; this being a concern about common applications of performance assessment in health care.[8]
Limitations
There are a number of limitations within this study. First is the time lapse between the measurement of the indicators contained within the national datasets, and their eventual publication. This means that our judgements are based on data that may not represent services as they currently operate.
Second, identifying deviants using consistency over a period of three years as a criterion limits the process to services demonstrating exceptional, but stable performance, rather than those that might have seen recent improvement. The latter group is clearly of interest and may be better suited to study the effectiveness of quality interventions than general stable performers due to the evident discontinuity in their service design. However, identifying structural breaks in performance is difficult in short time-series due to quality improvements common to all providers (general trend) and regression to the mean. Furthermore, this would limit the positive deviance approach to improvement efforts that occur during the data period and exclude those that occurred before.
A third limitation concerns the subjectivity inherent in using the expert group as a basis for this work, potentially influencing the identification of datasets, criteria development, and the selection of final indicators for statistical modelling. However, given the membership of this group comprised both academic and clinical expertise from across relevant disciplines, and the transparency of our approach described here, we believe that we have been able to minimise this as far as possible.
25
A final limitation of the study, based upon the scale of the work, was our inability to statistically explore all shortlisted indicators in the final stage. However, given that these single indicators could not be combined with others to create a more robust, composite assessment of services, the authors feel confident that the four related indicators taken forward presented the best option for the focus of this work.
Conclusions
We aimed to explore the process of identifying positively deviant health services from routinely collected, publicly available quality and safety data. Whilst it is possible to identify a number of indicators for this purpose, there are significant challenges in identifying positive deviants using quality and safety indicators that support meaningful comparison and improvement efforts. The difficulties inherent in using administrative data to understand quality and safety are well known. However, the burden of measurement is brought into sharp relief at this time of austerity when delivery pressures in UK health services are great. Our findings support Berwick’s recommendation for an urgent and wide ranging focus on what (and how) we measure in health services, and where possible, streamlining this list to fewer, more meaningful measures, ideally “to measure only what matters, and only for learning”.[27, p.1329] The UK’s newly established Patient Safety Measurement Unit[28] will need to play a key role in co-producing measures that facilitate understanding of variation at the service level, and evaluation of the improvement that follows.
26

References:
1. Marsh DR, Schroeder DG, Dearden KA, et al. The power of positive deviance. BMJ 2004;329:1177–9.
2. Baxter R, Taylor N, Kellar I, et al. What methods are used to apply positive deviance within healthcare organisations? A systematic review. BMJ Qual Saf 2016;25:190-201.
3. Lawton R, Taylor N, Clay-Williams R, et al. Positive deviance: a different approach to achieving patient safety. BMJ Qual Saf 2014;3:880–3
4. Bradley EH, Curry LA, Ramanadhan S, et al. Research in action: using positive deviance to improve quality of health care. Implementation Science 2009;4:25.
5. Kessner DM, Kalk CE, Singer J. Assessing health quality. The case for tracers. N Eng J Medicine 1973; 288:189-194.
6. Shahian DM, Normand S-LT. What is a performance outlier? BMJ Qual Saf 2015;24:95–99.
7. Dixon-Woods M, Leslie M, Bion J, Tarrant C. What Counts? An ethnographic study of infection data reported to a patient safety program. Milbank Quarterly. 2012; 90:548-591.
8. Black N. To do the service no harm: the dangers of quality assessmentJ Health Serv Res Pol 2015;20:65–66.
9. Marra AR, Noritomi DT, Westheimer Cavalcante AJ, et al. A multicenter study using positive deviance for improving hand hygiene compliance. Am J Infect Control 2013;41:984–8.
10. Bradley EH, Curry LA, Spatz ES, et al. Hospital strategies for reducing risk-standardized mortality rates in acute myocardial infarction. Ann Intern Med 2012;156:618–26.
11. Gabbay RA, Friedberg MW, Miller-Day M, et al. A positive deviance approach to understanding key features to improving diabetes care in the medical home. Ann Fam Med 2013;11 (Suppl 1):S99–107.
12. Rushforth B, Stokes T, Andrews E, Willis TA, McEachan R, Faulkner S, Foy R. Developing 'high impact' guideline-based quality indicators for UK primary care: a multi-stage consensus process. BMC Family Practice 2015;16:156
27
13. Kötter T, Blozik E, Scherer M. Methods for the guideline-based development of quality indicators – a systematic review. Implement Sci. 2012;7:21.
14. Stelfox HT, Straus SE. Measuring quality of care: considering conceptual approaches to quality indicator development and evaluation. J ClinEpidemiol. 2013;66:1328–37.
15. Institute of Medicine. Performance measurement: accelerating improvement. Washington, DC: The National Academies Press, 2006.
16. Doggen K, Lavens A, Van Casteren V. The right indicator for the job: different levels of rigor may be appropriate for the development of quality indicators. Comment on Stelfox and Straus. J Clin Epidemiol 2014;67:963–964.
17. Schwendimann R, Zimmermann N, Küng K, et al. Variation in safety culture dimensions within and between US and Swiss Hospital Units: an exploratory study. BMJ Qual Saf 2013;22:32-41.
18. Goldstein, H. & Spiegelhalter, D. J. League Tables and Their Limitations: Statistical Issues in Comparisons of Institutional Performance. Journal of the Royal Statistical Society 1996;159:385-443.
19. Ohlssen DI, Sharples LD, Spiegelhalter DJ. A hierarchical modelling framework for identifying unusual performance in health care providers. Journal of the Royal Statistical Society: Series A (Statistics in Society). 2007;170(4):865-90.
20. Snijders, T. a. B. & Bosker, R. J. 2012. Multilevel Analysis - An Introduction to Basic and Advanced Multilevel Modeling, Los Angeles, Sage.
21. Skrondal, A. & Rabe-Hesketh, S. 2009. Prediction in multilevel generalized linear models. Journal of the Royal Statistical Society. Series A (Statistics in Society), 172, 659-87.
22. Elixhauser, A., Steiner, C., Harris, D. & Coffey, R. Comorbidity measures for use with administrative data. Medical Care 1998;36:8-27.
23. Gutacker, N., Bloor, K. & Cookson, R. Comparing the performance of the Charlson/Deyo and Elixhauser comorbidity measures across five European countries and three conditions. European Journal of Public Health 2015;25:15-20.
28

24. Walker, K., Neuburger, J., Groene, O., Cromwell, D. A. & Van Der Meulen, J. Public reporting of surgeon outcomes: low numbers of procedures lead to false complacency. Lancet 2013;382:1674-77.
25. McClellan M, McNeil BJ, Newhouse JP. Does More Intensive Treatment of Acute Myocardial Infarction in the Elderly Reduce Mortality? Analysis Using Instrumental Variables. JAMA. 1994;272(11):859-866.
26. Pannick S, Wachter RM, Vincent C, Sevdalis. Rethinking medical ward quality. BMJ 2016; 355:i5417
27. Berwick DM. Era 3 for Medicine and Health Care. JAMA. 2016;315(13):1329-1330. doi:10.1001/jama.2016.150
28. NHS Improvement Patient Safety Measurement Unit: https://improvement.nhs.uk/resources/patient-safety-collaboratives/ Accessed 25th September 2017.
29
30


