
Steady State Service Levels through FY2016
Continuation of “$0” Annual Salary Increases for all Represented and Non-Represented Employees (represents an eight-year period through the end of FY 2016)
Fare Increase in FY2014 ($2.75 Base & 40 Pass Multiple) [see attachment]
Reserves @ $1.5M At the end of FY2018 - “FISCAL CLIFF”
Unsustainable HealthCare business model
2
FY2013 –
3

FY2013 – FY2018 RESERVES BALANCE TREND
4
Employee Incentive Payment Re-opening Restrooms Healthcare Reform Operational Business Roadmap NO Fare Increase in FY14 Security Enhancements Employee Merit Increase
Service Restoration Employer of Choice Improved Public Perception Improved Employee Morale Balanced Budget Sustainability Regional Transit Provider of
Choice
5

6
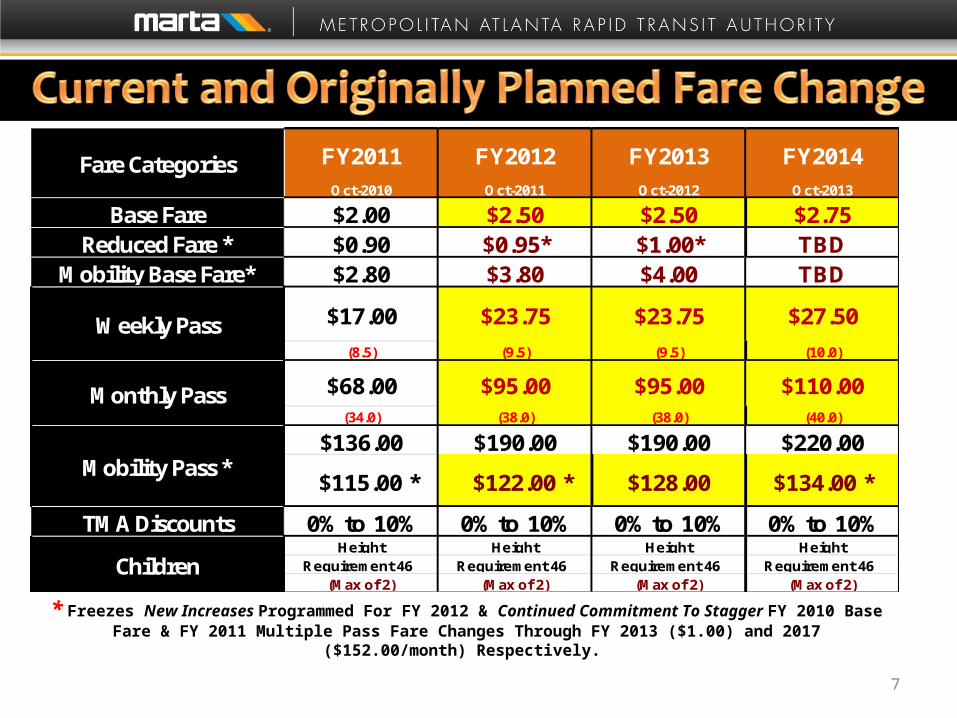
* Freezes New Increases Programmed For FY 2012 & Continued Commitment To Stagger FY 2010 Base Fare & FY 2011 Multiple Pass Fare Changes Through FY 2013 ($1.00) and 2017
($152.00/month) Respectively.
FY2011 FY2012 FY2013 FY2014
Oct-2010 Oct-2011 Oct-2012 Oct-2013
Base Fare $2.00 $2.50 $2.50 $2.75 Reduced Fare * $0.90 $0.95* $1.00* TBD
Mobility Base Fare* $2.80 $3.80 $4.00 TBD
$17.00 $23.75 $23.75 $27.50
(8.5) (9.5) (9.5) (10.0)
$68.00 $95.00 $95.00 $110.00 (34.0) (38.0) (38.0) (40.0)
$136.00 $190.00 $190.00 $220.00
$115.00 * $122.00 * $128.00 $134.00 *
TMA Discounts 0% to 10% 0% to 10% 0% to 10% 0% to 10%Height Height Height Height
Requirement 46” Requirement 46” Requirement 46” Requirement 46”(Max of 2) (Max of 2) (Max of 2) (Max of 2)
Children
Fare Categories
Weekly Pass
Monthly Pass
Mobility Pass *
7
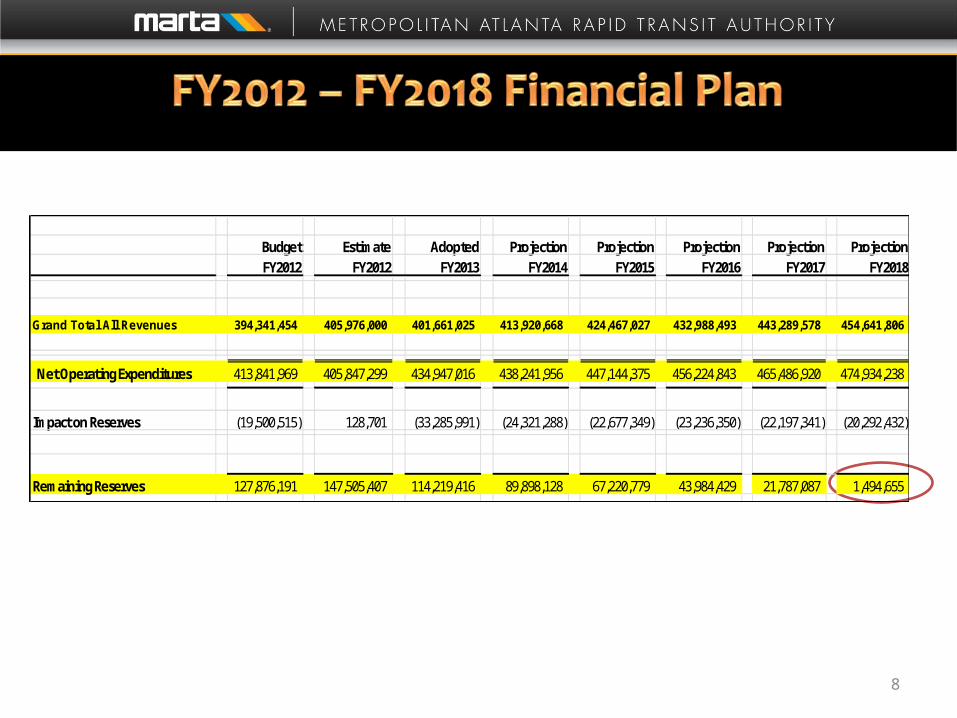
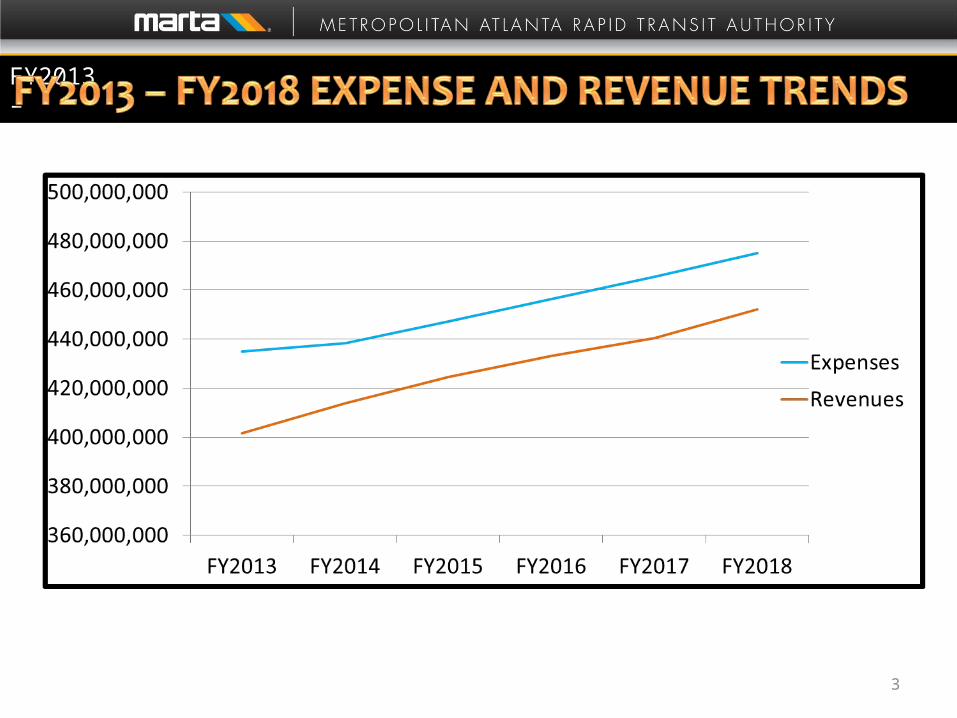
Budget Estimate Adopted Projection Projection Projection Projection ProjectionFY2012 FY2012 FY2013 FY2014 FY2015 FY2016 FY2017 FY2018
Grand Total All Revenues 394,341,454 405,976,000 401,661,025 413,920,668 424,467,027 432,988,493 443,289,578 454,641,806
Net Operating Expenditures 413,841,969 405,847,299 434,947,016 438,241,956 447,144,375 456,224,843 465,486,920 474,934,238
Impact on Reserves (19,500,515) 128,701 (33,285,991) (24,321,288) (22,677,349) (23,236,350) (22,197,341) (20,292,432)
Remaining Reserves 127,876,191 147,505,407 114,219,416 89,898,128 67,220,779 43,984,429 21,787,087 1,494,655
8
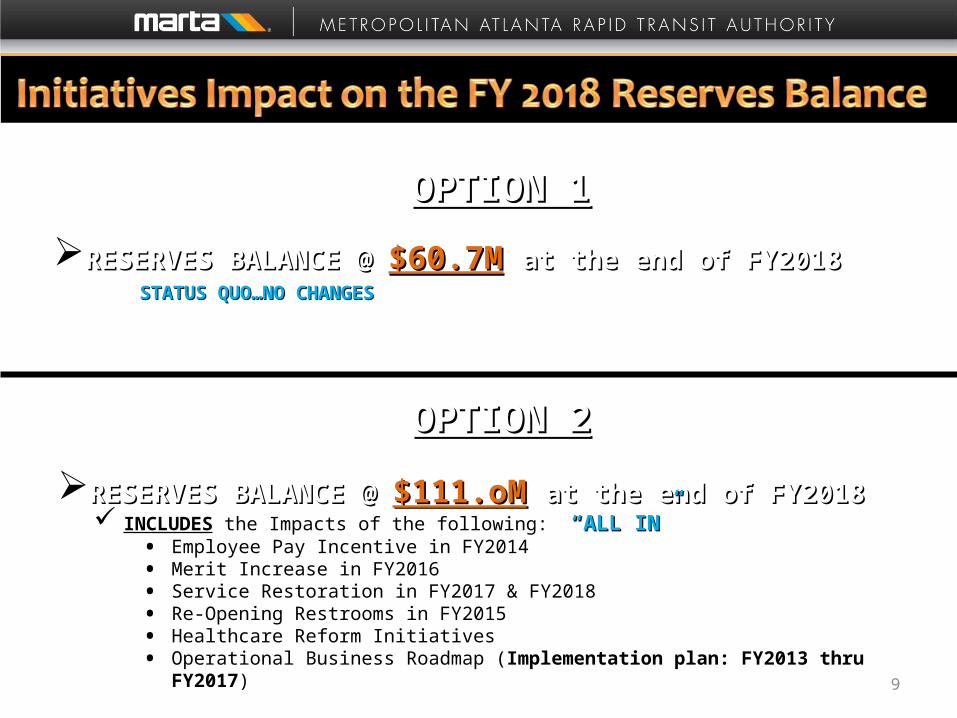
OPTION 2OPTION 2
RESERVES BALANCE @ RESERVES BALANCE @ $111.oM$111.oM at the end of FY2018at the end of FY2018 INCLUDES the Impacts of the following: “ALL IN” “ALL IN”
• Employee Pay Incentive in FY2014• Merit Increase in FY2016 • Service Restoration in FY2017 & FY2018• Re-Opening Restrooms in FY2015 • Healthcare Reform Initiatives • Operational Business Roadmap (Implementation plan: FY2013 thru FY2017)
9
OPTION 1OPTION 1
RESERVES BALANCE @ RESERVES BALANCE @ $60.7M$60.7M at the end of FY2018 at the end of FY2018 STATUS QUO…NO CHANGES STATUS QUO…NO CHANGES
10
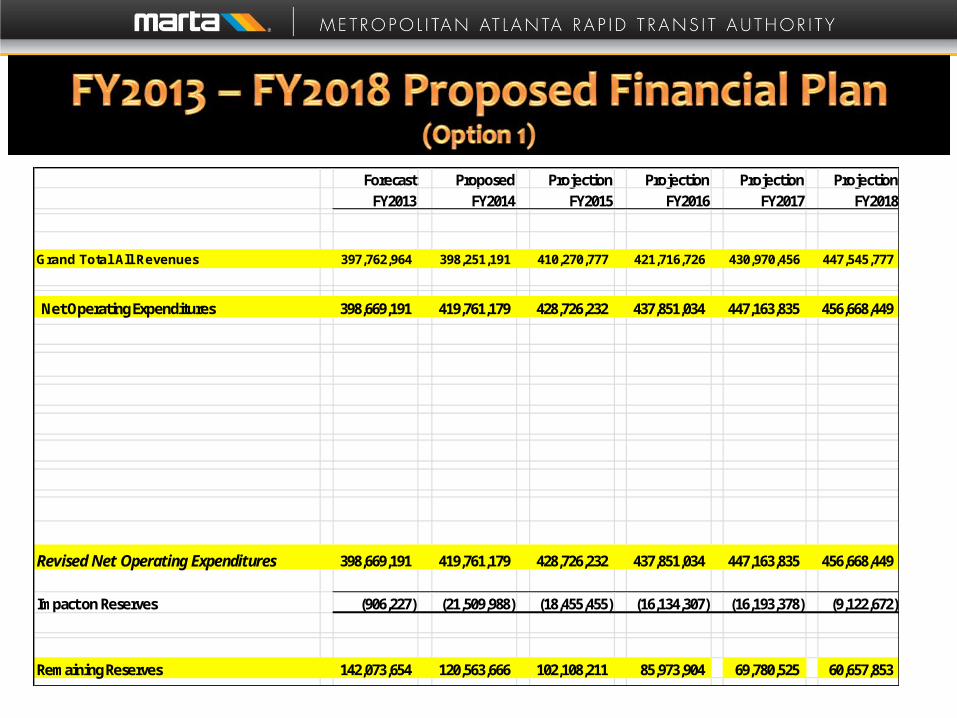
Forecast Proposed Projection Projection Projection ProjectionFY2013 FY2014 FY2015 FY2016 FY2017 FY2018
Grand Total All Revenues 397,762,964 398,251,191 410,270,777 421,716,726 430,970,456 447,545,777
Net Operating Expenditures 398,669,191 419,761,179 428,726,232 437,851,034 447,163,835 456,668,449
Revised Net Operating Expenditures 398,669,191 419,761,179 428,726,232 437,851,034 447,163,835 456,668,449
Impact on Reserves (906,227) (21,509,988) (18,455,455) (16,134,307) (16,193,378) (9,122,672)
Remaining Reserves 142,073,654 120,563,666 102,108,211 85,973,904 69,780,525 60,657,853

CUSTOMER RELIEF CUSTOMER RELIEF STEADY STATE SERVICE LEVELS STEADY STATE SERVICE LEVELS through through
FY2016FY2016
SERVICE RESTORATION SERVICE RESTORATION in FY2017in FY2017
Re-Opening Re-Opening RESTROOMSRESTROOMS
““KNUCKLE-HEAD BEHAVIOR” KNUCKLE-HEAD BEHAVIOR” CampaignCampaign
SECRET SHOPPERS PROGRAM SECRET SHOPPERS PROGRAM to monitor/ to monitor/
improve customer serviceimprove customer service
NO FARE NO FARE Increase in FY2014
SECURITY ENHANCEMENTSSECURITY ENHANCEMENTS
• Security Cameras on Bus/Rail
• Increased Police visibility
• “See & Say” App11

EMPLOYEE RELIEFEMPLOYEE RELIEF
EMPLOYEE INCENTIVE PAYMENT EMPLOYEE INCENTIVE PAYMENT for Non-Rep & Rep – approximately $8.3M in December 2013 (FY2014)
EMPLOYEE MERIT INCREASE EMPLOYEE MERIT INCREASE in July 2015 (FY2016)
EMPLOYEE MORALE INCENTIVESEMPLOYEE MORALE INCENTIVES• Dress Code – Relaxed Dress
Business Appropriate• Bus Roadeo/Rail Rodeo • Telecommute Policy
Implementation
12

FISCAL RELIEFFISCAL RELIEF
Implementation of the Operational Business Roadmap RecommendationsHealthcare Savings InitiativesPension Costs Stabilized
Modest Fare Increases• Proposed Fare Increase in FY2015
– 15 cents • Proposed Fare Increase in FY2016
– 10 cents • Proposed Fare Increase in FY2018
– 10 cents
13

Forecast Proposed Projection Projection Projection ProjectionFY2013 FY2014 FY2015 FY2016 FY2017 FY2018
Grand Total All Revenues 397,762,964 398,251,191 410,270,777 421,716,726 430,970,456 447,545,777
Net Operating Expenditures 398,669,191 419,761,179 428,726,232 437,851,034 447,163,835 456,668,449
Proposed Initiatives:
Employee Incentive Payment in FY2014 8,315,621 0 0 0 0
Service Restoration in FY2017 5,000,000 5,000,000
Merit Increase in FY2016 A21 8,500,000 8,627,500 8,756,913
Re-opening Restrooms 1,325,000 1,325,000 1,325,000 1,325,000
Healthcare Reform Initiatives (5,000,000) (10,000,000) (15,000,000) (18,000,000)
Operational Business Roadmap Initiatives (60% of Est.) 12,900 (1,123,423) (7,373,068) (12,536,464) (13,670,653) (17,176,853)
Net Impact of Proposed Initiatives 12,900 7,192,198 (11,048,068) (12,711,464) (13,718,153) (20,094,940)
Revised Net Operating Expenditures 398,682,091 426,953,377 417,678,164 425,139,570 433,445,682 436,573,509
Impact on Reserves (919,127) (28,702,186) (7,407,387) (3,422,843) (2,475,226) 10,972,268
Remaining Reserves 142,060,754 113,358,568 105,951,181 102,528,338 100,053,112 111,025,380
14

* Freezes New Increases Programmed For FY 2012 & Continues Commitment To Stagger FY 2010 Base Fare & FY 2011 Multiple Pass Fare Changes Through FY
2013 ($1.00)
FY2011 FY2012 FY13/FY14 FY2015 FY2016 FY2018Oct-2010 Oct-2011 Oct-2012 Jul-2014 Jul-2015 Jul-2017
Base Fare $2.00 $2.50 $2.50 $2.65 $2.75 $2.85 Reduced Fare * $0.90 $0.95* $1.00* $1.10 $1.15 $1.20 Mobility Base
Fare*$2.80 $3.80 $4.00 $4.30 $4.50 $4.70
$17.00 $23.75 $23.75 $25.25 $26.25 $27.25 (8.5) (9.5) (9.5) (9.5) (9.5) (9.6)
$68.00 $95.00 $95.00 $101.00 $105.00 $109.00 (34.0) (38.0) (38.0) (38.1) (38.2) (38.2)
$136.00 $190.00 $190.00 $202.00 $210.00 $218.00 $115.00 * $122.00 * 128.00 * TBD TBD TBD
TMA Discounts 0% to 10% 0% to 10% 0% to 10% 0% to 10% 0% to 10% 0% to 10%Height Height Height Height Height Height
Requirement 46” Requirement 46” Requirement 46” Requirement 46”Requirement
46”Requirement 46”
(Max of 2) (Max of 2) (Max of 2) (Max of 2) (Max of 2) (Max of 2)
Implemented Proposed
Children
Fare Categories
Weekly Pass
Monthly Pass
Mobility Pass *
15

16

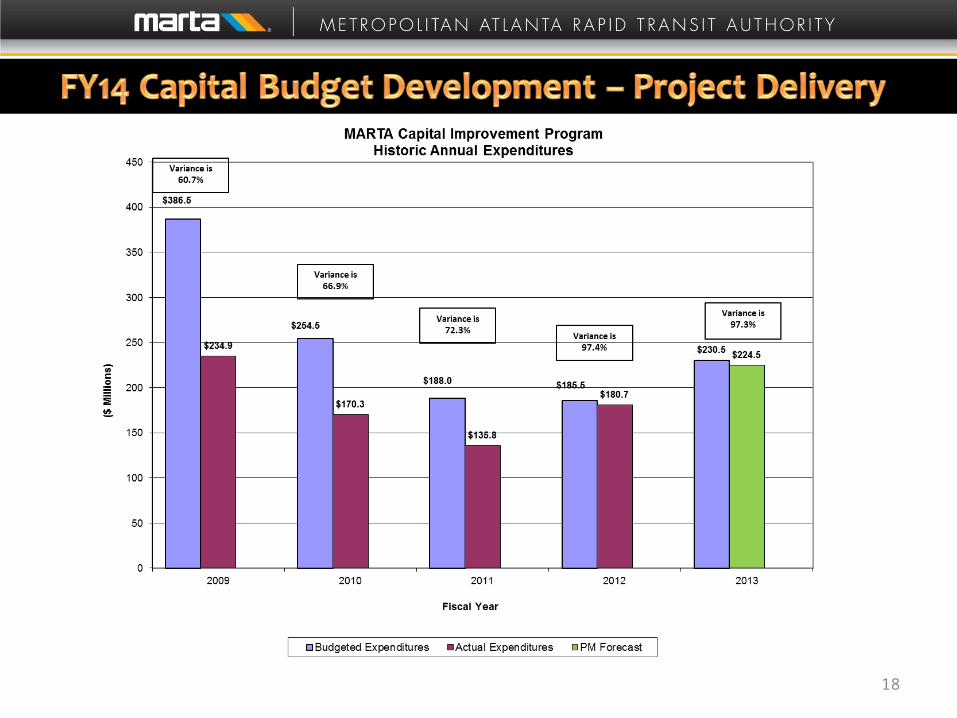
Projects already under contract or in the very late stages of the procurement process
Policy directives in terms of size of Bus and Mobility procurements
Project Prioritization Scoring (Expert Choice):• Life/safety critical projects• Operations critical projects
Partial funding for Planning functions Partial funding for CIP Support and
various business support functions17
18
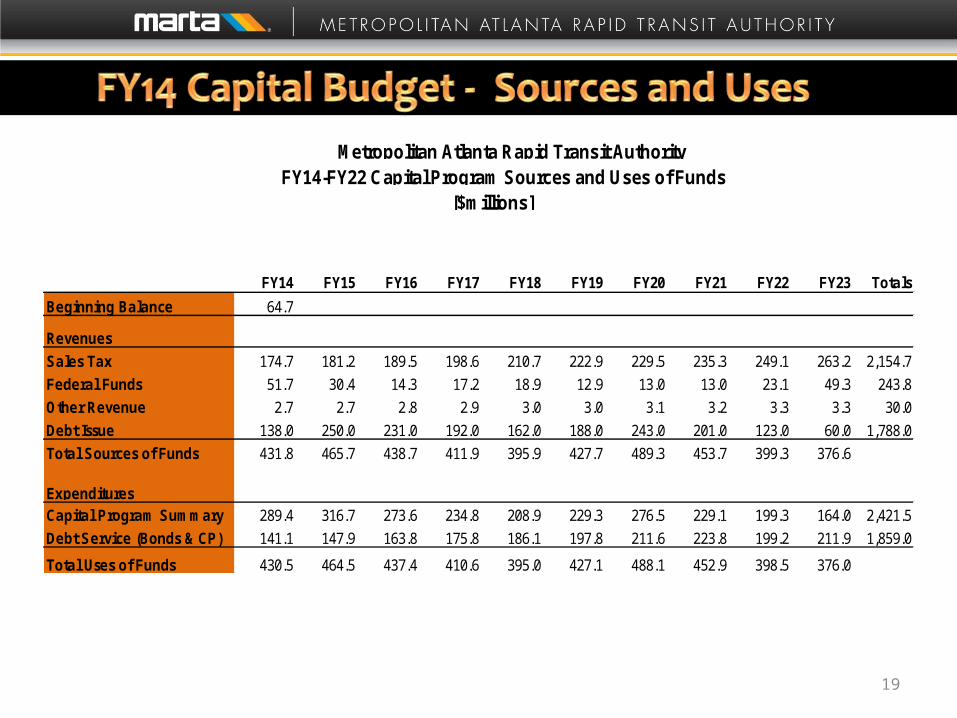
[$millions]
FY14 FY15 FY16 FY17 FY18 FY19 FY20 FY21 FY22 FY23 Totals
Beginning Balance 64.7 1.3 1.1 1.2 1.3 0.9 0.6 1.2 0.8 0.8
Revenues
Sales Tax 174.7 181.2 189.5 198.6 210.7 222.9 229.5 235.3 249.1 263.2 2,154.7
Federal Funds 51.7 30.4 14.3 17.2 18.9 12.9 13.0 13.0 23.1 49.3 243.8
Other Revenue 2.7 2.7 2.8 2.9 3.0 3.0 3.1 3.2 3.3 3.3 30.0
Debt Issue 138.0 250.0 231.0 192.0 162.0 188.0 243.0 201.0 123.0 60.0 1,788.0
Total Sources of Funds 431.8 465.7 438.7 411.9 395.9 427.7 489.3 453.7 399.3 376.6
ExpendituresCapital Program Summary 289.4 316.7 273.6 234.8 208.9 229.3 276.5 229.1 199.3 164.0 2,421.5
Debt Service (Bonds & CP) 141.1 147.9 163.8 175.8 186.1 197.8 211.6 223.8 199.2 211.9 1,859.0
Total Uses of Funds 430.5 464.5 437.4 410.6 395.0 427.1 488.1 452.9 398.5 376.0
Metropolitan Atlanta Rapid Transit Authority FY14-FY22 Capital Program Sources and Uses of Funds
19

20

FY '14 CIP By Program Category
Total Ten-Year CIP
FY 2014
FY 2015
FY 2016
FY 2017
FY 2018
FY 2019
FY 2020
FY 2021
FY 2022
FY 2023
Maintenance of Way $51.9 $14.0 $10.8 $2.8 $3.9 $1.6 $5.0 $4.8 $3.8 $3.3 $1.8 Vehicles $567.6 $65.5 $62.3 $70.6 $57.2 $66.4 $65.8 $46.9 $42.1 $41.6 $49.2
Systems $1,171
.3 $125.0 $159.9 $141.5 $137.0 $95.4 $106.7 $155.9 $116.3 $78.1 $55.3 Facilities $390.6 $61.4 $59.8 $35.3 $17.4 $26.4 $31.8 $48.9 $36.7 $45.9 $27.0 Non-Asset $241.0 $23.4 $23.9 $23.5 $19.4 $19.2 $20.1 $20.1 $30.2 $30.5 $30.8 Total FY ' 14 CIP
$2,422.4 $289.4 $316.8 $273.7 $234.9 $209.0 $229.4 $276.6 $229.2 $199.4 $164.1
[$ in Millions]
21
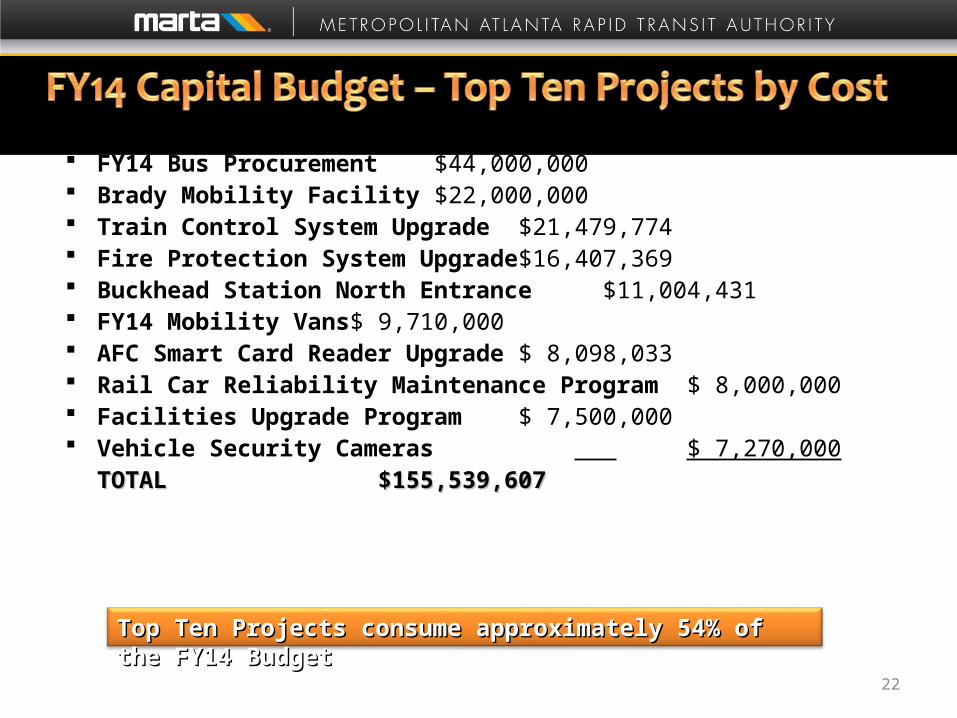
FY14 Bus Procurement $44,000,000 Brady Mobility Facility $22,000,000 Train Control System Upgrade $21,479,774 Fire Protection System Upgrade $16,407,369 Buckhead Station North Entrance $11,004,431 FY14 Mobility Vans $ 9,710,000 AFC Smart Card Reader Upgrade $ 8,098,033 Rail Car Reliability Maintenance Program $ 8,000,000 Facilities Upgrade Program $ 7,500,000 Vehicle Security Cameras $ 7,270,000
TOTALTOTAL $155,539,607 $155,539,607
Top Ten Projects consume approximately 54% of Top Ten Projects consume approximately 54% of the FY14 Budgetthe FY14 Budget
22

23


