
SPAIN
WEEKLY ECONOMIC BULLETIN
JUNE 15th 2018

NIPO: 057-17-031-3 Elaboración y coordinación: Secretaría de Estado de Economía y Apoyo a la Empresa
Dirección General de Análisis Macroeconómico y Economía Internacional Subdirección General de Análisis Coyuntural y Previsi ones Económicas

INDEX (1) Table 1. Quarterly National Accounts. Main Aggregates. Year-on-year change
Table 1a. Quarterly National Accounts. Main Aggregates. Quarter-on-quarter change
Table 1b. Quarterly National Accounts: Wages, Productivity and Labour Costs
Table 2. General and Industry Activity Indicators
Table 3. Construction and Services Activity Indicators
Table 4. Domestic Demand (Private Consumption and Equipment Investment)
Table 4a. Housing Indicators
Table 5. External Demand, Balance of Payments and Net External Reserves
Table 6. Labour Market
Table 7. Prices and Wages
Table 8. Public Sector: State Operations
Table 9. Monetary and Financial Sector
Table 10. International Indicators (I)
Table 11. International Indicators (II)
Table 12. Summary of Indicators
Chart 12. Summary of Indicators
(1) Supplementary data and list of abbreviations can be obtained from Síntesis de Indicadores
Económicos.

Table 1. QUARTERLY NATIONAL ACCOUNTS. BASE 2010 Chain-linked volume; adjusted data (1) June 15, 2018
Year-on-year growth rate in %
2017 2018(2) 2017 I 2017 II 2017 III 2017 IV 2018 I
DEMAND Final consumption expenditure 2.2 2.6 1.9 2.2 2.1 2.5 2.6 . Households 2.4 2.8 2.2 2.4 2.4 2.5 2.8 . Non-profit Institutions (3) 2.7 4.2 3.2 3.3 2.3 2.0 4.2 . General government 1.6 1.9 1.0 1.5 1.4 2.4 1.9 Gross fixed capital formation 5.0 3.5 4.9 3.9 5.6 5.6 3.5 . Tangible fixed assets 5.2 3.7 5.2 4.1 5.7 6.0 3.7 . Equipment and cultivated assets 6.1 2.2 6.1 3.9 6.6 7.7 2.2 . Construction 4.6 4.7 4.5 4.3 5.1 4.8 4.7 . Intelectual Property Products 3.7 2.9 3.5 2.9 5.0 3.3 2.9 Change in inventories (4) 0.1 0.1 0.1 0.0 0.2 0.1 0.1 Domestic demand (4) 2.8 2.8 2.5 2.5 3.0 3.2 2.8 Good and service exports 5.0 3.2 5.6 4.5 5.6 4.4 3.2 Good and service imports 4.7 2.8 4.5 3.1 5.9 5.2 2.8 Net exports (4) 0.3 0.2 0.5 0.6 0.1 -0.1 0.2 GROSS VALUE ADDED Agriculture, forestry and fishing 3.7 3.3 5.0 3.7 4.2 2.0 3.3 Industry 3.7 2.8 3.0 3.4 3.9 4.6 2.8 Construction 4.9 6.0 4.5 4.9 4.9 5.4 6.0 Services 2.6 2.5 2.7 2.6 2.5 2.5 2.5 GDP m.p. 3.1 3.0 3.0 3.1 3.1 3.1 3.0
(1) Seasonally and calendar adjusted data. (2) Available period data. (3) Non-profit making institutions serving households. (4) Contribution to GDP growth (percentage points). (ESA 2010). Source: INE.
-6
0
6
2013 2014 2015 2016 2017 2018
GDP (y-o-y % change)
Domestic demand (4)
Net exports (4)
GROSS DOMESTIC PRODUCT & COMPONENTS
-15
0
15
2013 2014 2015 2016 2017 2018
Private Consumption Expenditure
GFCF Construction
GFCF Equipm.and cultivat.assets
DOMESTIC DEMAND: COMPONENTS (y-o-y % change)
-8
0
8
2013 2014 2015 2016 2017 2018
Goods and services exports
Goods and services imports
NET EXPORTS: COMPONENTS (y-o-y % change)
-14
-7
0
7
2013 2014 2015 2016 2017 2018
GVA Industry
GVA Construction
GVA Services
GVA NON AGRICULTURAL SECTORS (y-o-y % change)

Table 1a. QUARTERLY NATIONAL ACCOUNTS. BASE 2010 Chain-linked volume; adjusted data (1)
June 15, 2018
Quarter-on-quarter growth rate in %
2016 IV 2017 I 2017 II 2017 III 2017 IV 2018 I
DEMAND
Final consumption expenditure 0.2 0.6 0.7 0.6 0.5 0.7
. Households 0.4 0.5 0.8 0.7 0.6 0.7
. Non-profit Institutions (2) 0.8 -0.3 0.9 0.8 0.5 1.9
. General government -0.6 1.1 0.5 0.4 0.4 0.5
Gross fixed capital formation 0.8 2.8 0.6 1.4 0.7 0.8
. Tangible fixed assets 0.7 3.0 0.6 1.3 0.9 0.7
. Equipment and cultivated assets -0.2 3.7 0.1 2.8 0.9 -1.6
. Construction 1.3 2.5 1.0 0.2 1.0 2.4
. Intelectual Property Products 1.1 1.5 0.6 1.7 -0.5 1.0
Good and service exports 1.5 2.4 1.0 0.6 0.3 1.3
Good and service imports 0.6 3.7 0.5 1.0 0.0 1.3
GROSS VALUE ADDED
Agriculture, forestry and fishing 0.9 2.4 -0.3 1.1 -1.1 3.7
Industry 1.2 0.8 1.2 0.6 1.8 -0.9
Construction 1.0 1.6 1.1 1.1 1.5 2.1
Services 0.5 0.7 0.7 0.7 0.4 0.8
GDP M.P. 0.7 0.8 0.9 0.7 0.7 0.7
(1) Seasonally and calendar adjusted data. (2) Non-profit making institutions serving households. (3) Contribution to GDP growth (percentage points). (ESA 2010). Source: INE.
-1
0
1
2
2013 2014 2015 2016 2017 2018
GDP (q-o-q % change)
Net Exports (3)
Domestic Demand (3)
GROSS DOMESTIC PRODUCT AND COMPONENTS
-4
0
4
8
2013 2014 2015 2016 2017 2018
Private Consumption Expenditure
GFCF Construction
GFCF Equipment and cultivated assets
DOMESTIC DEMAND: COMPONENTS (q-o-q % change)
-2
0
2
4
2013 2014 2015 2016 2017 2018
Goods and services exports
Goods and services imports
NET EXPORTS: COMPONENTS (q-o-q % change)
-4
0
4
2013 2014 2015 2016 2017 2018
GVA Industry
GVA Construction
GVA Services
GVA NON AGRICULTURAL SECTORS (q-o-q % change)
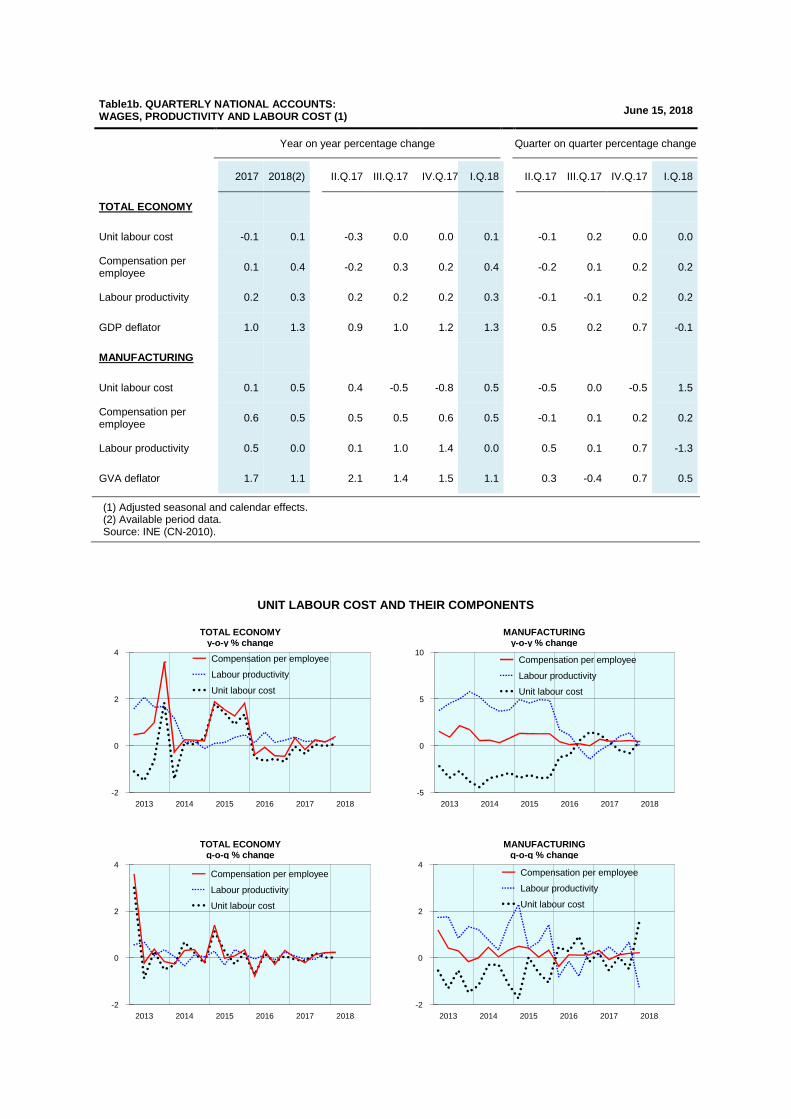
Table1b. QUARTERLY NATIONAL ACCOUNTS: WAGES, PRODUCTIVITY AND LABOUR COST (1) June 15, 2018
Year on year percentage change Quarter on quarter percentage change
2017 2018(2)
II.Q.17 III.Q.17 IV.Q.17 I.Q.18
II.Q.17 III.Q.17 IV.Q.17 I.Q.18
TOTAL ECONOMY
Unit labour cost -0.1 0.1
-0.3 0.0 0.0 0.1
-0.1 0.2 0.0 0.0
Compensation per employee 0.1 0.4
-0.2 0.3 0.2 0.4
-0.2 0.1 0.2 0.2
Labour productivity 0.2 0.3
0.2 0.2 0.2 0.3
-0.1 -0.1 0.2 0.2
GDP deflator 1.0 1.3
0.9 1.0 1.2 1.3
0.5 0.2 0.7 -0.1
MANUFACTURING
Unit labour cost 0.1 0.5
0.4 -0.5 -0.8 0.5
-0.5 0.0 -0.5 1.5
Compensation per employee
0.6 0.5
0.5 0.5 0.6 0.5
-0.1 0.1 0.2 0.2
Labour productivity 0.5 0.0
0.1 1.0 1.4 0.0
0.5 0.1 0.7 -1.3
GVA deflator 1.7 1.1
2.1 1.4 1.5 1.1
0.3 -0.4 0.7 0.5
(1) Adjusted seasonal and calendar effects. (2) Available period data. Source: INE (CN-2010).
UNIT LABOUR COST AND THEIR COMPONENTS
-2
0
2
4
2013 2014 2015 2016 2017 2018
Compensation per employee
Labour productivity
Unit labour cost
TOTAL ECONOMYy-o-y % change
-5
0
5
10
2013 2014 2015 2016 2017 2018
Compensation per employee
Labour productivity
Unit labour cost
MANUFACTURINGy-o-y % change
-2
0
2
4
2013 2014 2015 2016 2017 2018
Compensation per employee
Labour productivity
Unit labour cost
TOTAL ECONOMYq-o-q % change
-2
0
2
4
2013 2014 2015 2016 2017 2018
Compensation per employee
Labour productivity
Unit labour cost
MANUFACTURINGq-o-q % change

Table 2. GENERAL AND INDUSTRY ACTIVITY INDICATORS (Year-on-year percentage change except as indicated) June 15, 2018 Previous Latest
2017 2018(1) 2017 III 2017 IV 2018 I 2018 II(1) data data Date
GENERAL Composite Activity Indicator (2) 3.1 2.9 3.1 2.9 2.9 - .. .. Q.1. 18
Social Security covered workers 3.6 3.3 3.5 3.5 3.4 3.1 3.1 3.1 May. 18 Electric power consumption (3) 1.7 2.0 0.5 3.2 2.1 1.8 2.4 1.0 " Non energy imports (vol.) 3.9 0.7 5.1 4.0 0.7 - 2.7 -5.3 Mar. 18 Households & business financing (4) -2.4 -2.9 -2.7 -2.4 -2.8 -3.2 -3.4 -3.2 Apr. 18 Economic Sentiment Indicator 108.6 110.0 108.7 110.1 110.0 110.0 110.6 109.4 May. 18
Large Firms Sales (5) 3.7 3.5 3.6 3.7 3.6 3.4 3.9 3.4 Apr. 18 Central Balance Sheet (Quarterly) - Gross operating income -0.4 - -1.5 -0.4 - - .. .. Q.4. 17
- ROI -Cost of debt (6) 3.5 - 2.4 3.7 - - .. .. " INDUSTRY Composite Industry Indicator (2) 3.8 2.9 3.9 4.1 2.9 - .. .. Q.1. 18
IPI calendar adjusted 3.2 2.3 2.8 5.2 2.7 1.2 5.1 1.2 Apr. 18 Social Security covered workers 3.1 3.2 3.1 3.2 3.3 3.0 3.1 2.9 May. 18
Business Surveys (balances in pp) - Industry confidence indicator (sa) 1.0 2.5 -0.1 4.3 2.8 2.1 3.3 0.8 " - Industry unfilled orders 1.8 3.0 0.7 6.2 4.2 1.1 -1.1 3.3 " - Inventories 6.2 4.1 8.3 0.4 2.6 6.5 4.8 8.2 " Industry capacity utilization (sa) % 78.7 80.0 78.7 79.1 79.7 80.3 .. .. Q.2. 18
Industry Turnover Index (7) 7.9 4.8 7.9 8.3 4.8 - 3.9 4.9 Mar. 18 Industry new orders (7) 8.0 4.6 9.0 7.5 4.6 - 3.0 3.8 " Manufacturing PMI Index 54.8 54.8 53.6 55.9 55.3 53.9 54.4 53.4 May. 18
-4
0
4
80
100
120
2013 2014 2015 2016 2017 2018
Economic Sentiment Indic. (right s.)
Composite Activity Indicator (y-o-y)
ACTIVITY INDICATORS
-6
0
6
12
2013 2014 2015 2016 2017 2018
Y-o-y
Annualized q-o-q
INDUSTRY PROD. INDEX (CALENDAR ADJUSTED)
-8
-4
0
4
8
2013 2014 2015 2016 2017 2018
Large firms sales (y-o-y)
Electric power consumption (y-o-y)
ELEC. POWER CONSUM. AND LARGE FIRM SALES
-22
-11
0
11
64
70
76
82
2013 2014 2015 2016 2017 2018
ICI
Cap.Utiliz.(right scale)
INDUSTRY CONF. IND. AND CAPACITY UTILIZATION
(1) Available period data. (2) Adjusted for seasonal, calendar and outliers effects. (3) Adjusted for calendar and temperature effects. (4) Deflated by CPI without energy and food. (5) Seasonal and calendar adjusted deflated and fixed sample. (6) Ordinary income on net assets (before taxes) minus interest on borrowed funds. (7) At current prices and adjusted for calendar. Sources: MTMS, REE, BE, AEAT, INE, European Commission, Markit.

Table 3. CONSTRUCTION AND SERVICES ACTIVITY INDICATORS (Year-on-year percentage change except as indicated) June 15, 2018
Previous Latest
2017 2018(1) 2017 III 2017 IV 2018 I 2018 II(1) data data Date
CONSTRUCTION
Composite Construction Indicator (2) 6.7 9.4 7.5 7.5 9.4 - .. .. Q.1. 18
Production in Construction Index (4) -1.7 5.3 3.8 -5.8 5.3 - 2.2 17.1 Mar. 18
Social Security covered workers 6.2 6.7 6.1 7.1 6.8 6.5 6.4 6.6 May. 18
Floorage approvals: total 21.8 13.7 25.2 24.5 13.7 - 11.3 15.9 Feb. 18
Floorage approvals: housing 24.8 19.8 28.9 24.8 19.8 - 11.1 28.1 "
Official bidding (at current prices) 37.6 77.9 34.9 107.0 77.9 - 37.2 141.5 Mar. 18
Construction confidence indicator (3) -26.9 -4.7 -23.5 -15.7 -4.3 -5.4 -12.3 1.5 May. 18
Mortgages. Number 7.2 4.8 17.3 -0.9 4.8 - 11.1 -6.4 Mar. 18
" . Amount borrowed 13.5 3.6 15.0 13.8 3.6 - -2.5 -4.7 "
Housing: Prices per sq meter 2.4 2.7 2.7 3.1 2.7 - .. .. Q.1. 18
Dwelling sales 14.7 15.6 14.6 17.7 11.6 29.7 -3.1 29.7 Apr. 18
- New 10.6 15.0 17.2 23.8 11.1 29.3 -4.6 29.3 "
- Used 15.7 15.7 14.0 16.4 11.7 29.8 -2.8 29.8 "
SERVICES
Composite Services Indicator (2) 3.7 3.4 3.6 3.4 3.4 - .. .. Q.1. 18
Social Security covered workers 3.6 3.4 3.6 3.6 3.5 3.1 3.1 3.2 May. 18
Foreign tourists 8.6 2.3 8.2 2.8 6.0 -4.4 9.6 -4.4 Apr. 18
Tourists total expenditure 12.2 4.6 13.0 5.4 7.7 -1.8 12.1 -1.8 "
Hotel overnight stays 2.9 -0.5 1.4 1.4 3.5 -8.1 7.1 -8.1 "
Retail trade confidence indicator (3) 11.0 11.0 10.9 10.4 11.7 9.9 10.9 8.8 May. 18
Services confidence indicator (3) 22.5 23.5 25.2 22.3 23.5 23.5 22.5 24.5 "
Services Turnover Index (4) 6.6 6.4 5.8 6.1 6.4 - 6.6 6.8 Mar. 18
Services PMI Index 56.4 56.5 56.8 54.5 56.8 56.0 55.6 56.4 May. 18
-8
0
8
2013 2014 2015 2016 2017 2018
Turnover Index
Social Security covered workers
SERVICES: SOCIAL SECURITY COVERED WORKERS AND TURNOVER INDEX (y-o-y % change)
-12
-8
-4
0
4
-50
-25
0
25
50
2013 2014 2015 2016 2017 2018
Housing prices
Mortgages: amount borrowed (right s.)
HOUSING PRICES AND MORTGAGES: AMOUNT BORROWED (y-o-y % change)
-68
-34
0
-16
0
16
2013 2014 2015 2016 2017 2018
Confidence Indicator (balances)
Composite Indicator (y-o-y % change)(right s.)
CONSTRUCTION INDICATORS
-32
-16
0
16
32
-2
0
2
4
6
2013 2014 2015 2016 2017 2018
Confidence Indicator (balances)
Comp. Ind. (y-o-y % change)(right s.)
SERVICES INDICATORS
(1) Available period data. (2) Adjusted for seasonal, calendar and outliers effects. (3) Balances in percentage points. (sa). (4) Adjusted for calendar. Sources: Eurostat, MTMS, MFOM, Markit, INE, European Commission and SGACPE.

Table 4. DOMESTIC DEMAND (PRIVATE CONSUMPTION AND EQUIPMENT INVESTMENT) (Year-on-year percentage change except as indicated) June 15, 2018
Previous Latest
2017 2018(1) 2017 III 2017 IV 2018 I 2018 II(1) data data Date
PRIVATE CONSUMPTION
Composite Consumption Indicator (2) 2.0 2.5 2.0 2.3 2.5 - .. .. Q.1. 18 Retail sales index deflated (*) 0.9 1.4 1.0 0.3 1.9 0.0 1.7 0.0 Apr. 18
Consum.goods.Apparent consumption(2) 1.7 4.2 2.9 3.4 4.2 - 5.5 4.0 Mar. 18
IPI consumer goods (calendar adjusted) 1.0 1.1 0.3 2.1 1.5 -0.1 3.6 -0.1 Apr. 18
Consumer goods imports (vol.) 2.5 2.3 2.5 3.7 2.3 - 1.9 -2.4 Mar. 18
Passenger car registrations 7.7 10.1 5.8 10.6 10.5 9.5 12.3 7.2 May. 18
Real wages (3) 1.5 2.4 1.9 2.1 2.4 - .. .. Q.1. 18 Consumer confidence indicator (4) -0.7 -0.4 0.2 -1.5 -0.6 -0.1 -0.7 0.5 May. 18
Large firms sales. Consumption (5) 2.7 3.5 2.0 3.0 3.3 4.3 4.1 4.3 Apr. 18
EQUIPMENT INVESTMENT
Composite Equipment Indicator (2) 6.8 6.4 6.5 7.8 6.4 - .. .. Q.1. 18 Capital goods.Apparent consumption(2) 4.9 6.4 11.3 5.3 6.4 - 2.8 9.4 Mar. 18
IPI capital goods (calendar adjusted) 4.1 3.2 5.7 8.6 3.3 3.0 4.5 3.0 Apr. 18
Capital goods imports (vol.) 6.4 -4.5 4.1 4.3 -4.5 - -2.2 -11.6 Mar. 18
Truck registrations 13.6 11.4 15.1 11.1 8.9 15.0 23.0 8.6 May. 18
Large firms sales. Capital (5) 2.5 6.1 3.7 4.1 7.1 2.9 6.7 2.9 Apr. 18
BUSINESS SURVEYS
Consumer goods. Capacity utilization (%) 72.2 75.1 74.4 68.1 75.6 74.6 .. .. Q.2. 18 Capital goods. Capacity utilization (%) 83.7 87.4 84.2 84.7 87.1 87.8 .. .. "
-18
0
18
36
-36
-22
-8
6
2013 2014 2015 2016 2017 2018
Passenger car registrations
Consumer Confidence I.(right s.)
CONSUMER CONF. INDICATOR AND PASSENGER CAR REG. (balances and y-o-y % change)
-6
0
6
12
2013 2014 2015 2016 2017 2018
Consumer goods
Capital goods
IPI (CALENDAR ADJUSTED) y-o-y % change
-11
0
11
-5
0
5
2013 2014 2015 2016 2017 2018
Composite Indicator (right s.)
Apparent Consumption
CONSUMER GOODS: COMPOSITE AND APPARENT CONSUMPTION (y-o-y % change)
-15
0
15
2013 2014 2015 2016 2017 2018
Composite Indicator
Apparent Consumption
CAPITAL GOODS: COMPOSITE AND APPARENT CONSUMPTION (y-o-y % change)
(1) Available period data. (2) Adjusted for seasonal, calendar and outliers effects. (3) Adjusted for seasonal and calendareffects .Deflated by private consumption expenditure deflator. (4) Balances in percentage points (sa). (5) Seasonal and calendar adjusted, deflated and fixed sample. (*) Without service station. Sources: SGACPE, INE, AEAT, European Commission, ANFAC and MICT.

Table 4a. HOUSING INDICATORS (Year-on-year percentage change except as indicated) June 15, 2018
Previous Latest
2017 2018(1) 2017 III 2017 IV 2018 I(1) 2018 II(1) data data Date
LEADING INDICATORS Housing starts (thousands) 19.5 - - - - - 6.9 6.2 Mar. 17 Floorage approvals: housing 24.8 19.8 28.9 24.8 19.8 - 11.1 28.1 Feb. 18 Official bidding. Residential 73.8 67.4 80.3 -8.3 67.4 - 14.9 274.9 Mar. 18 Housing order books (balances in pp) -24 -2 -14 -9 4 -10 -14 -7 May. 18 COINCIDENT INDICATORS Housing investment (QNA)(2010=100)(2)
8.3 8.7 9.2 9.5 8.7 - .. .. Q.1. 18 Construction GVA (QNA)(2010=100)(2)
4.9 6.0 4.9 5.4 6.0 - .. .. " Composite Housing Indicator (2) 7.8 9.9 8.5 8.5 9.9 - .. .. " CIPI(3). Building -1.8 8.4 5.4 -4.2 8.4 - 5.6 22.4 Mar. 18 IPI art.of concrete,cement & plaster(4) 15.1 14.1 13.1 18.6 15.4 10.2 12.4 10.2 Apr. 18 IPI Clay building materials(4) 4.6 -0.9 3.4 -3.0 0.5 -4.6 1.7 -4.6 " Construction employment. LFS 5.1 6.5 4.3 6.0 6.5 - .. .. Q.1. 18 Construction unemployment. LFS -17.7 -12.0 -19.1 -13.8 -12.0 - .. .. " HOUSING MARKET ACTIVITY Housing. Built for sale (thousands) 33.0 4.9 8.9 7.7 4.9 - 2.2 2.7 Feb. 18 Housing sales (thousands) 465.0 170.4 118.7 110.0 128.3 42.0 39.6 42.0 Apr. 18 - New 83.1 29.9 21.2 20.2 22.8 7.1 7.0 7.1 " - Used 382.0 140.4 97.5 89.9 105.5 34.9 32.5 34.9 " Non-resident foreigners transactions -11.8 -28.5 11.5 5.6 -28.5 - .. .. Q.1. 18 Housing investment deflator (QNA) (2) 4.8 4.1 5.0 5.9 4.1 - .. .. " Housing Price Index 6.2 6.2 6.6 7.2 6.2 - .. .. " - New 5.9 5.7 6.5 7.4 5.7 - .. .. " - Used 6.3 6.3 6.7 7.2 6.3 - .. .. " Rental CPI 0.4 1.1 0.5 0.8 1.0 1.2 1.2 1.2 May. 18 FINANCIAL CONDITIONS New housing mortgages - Number 9.8 5.6 22.1 1.3 5.6 - 13.8 -5.2 Mar. 18 - Amount borrowed 16.8 11.2 28.1 9.2 11.2 - 17.4 -0.8 " Interest rate on house purchase (5) 2.20 2.22 2.22 2.15 2.22 2.23 2.26 2.23 Apr. 18 Credit to households for housing -2.7 - -2.8 -2.7 -2.5 -2.3 -2.5 -2.3 " Delinquency household loans ratio (%) 4.75 - 4.72 4.75 - - .. .. Q.4. 17 Affordability based on wages (%) (6) 34.1 - 34.2 34.3 - - .. .. "
1) Available period data. (2) Calendar and seasonal adjusted series. (3) Construction Industry Production Index. (4) Corrected for calendar effects. (5) To households. Annual equivalent rate. (6) Without deductions. Sources: MECE, INE, MFOM, MICT, Eurostat and BE.
0
25
50
2013 2014 2015 2016 2017 2018
Housing: built for sale
New housing sales
HOUSING. BUILT FOR SALE AND NEW SALESthousands
7
14
21
28
2012 2013 2014 2015 2016 2017
Housing starts
Housing accrued
HOUSING STARTS AND ACCRUEDthousands

-16
0
16
2012 2013 2014 2015 2016 2017 2018
Housing investment (QNA)
Composite Housing Indicator
HOUSING INVESTMENT AND COMPOSITE INDICATORy-o-y % change
-40
-20
0
20
2012 2013 2014 2015 2016 2017 2018
IPI clay building materials
IPI concrete, cement & plaster articles
IPI CONCR, CEM & PLAST. ART. AND IPI CLAY BUILD.y-o-y % change
-80
-60
-40
-20
0
20
2012 2013 2014 2015 2016 2017 2018
Housing order books
Construction confidence indicator
ORDER BOOKS & CONSTRUCTION CONFIDENCEbalances in pp
-60
10
80
2011 2012 2013 2014 2015 2016 2017
Housing floorage approvals
CIPI building
HOUSE FLOORAGE APPROVALS & CIPI BUILDING y-o-y % change (smoothed)
-5
-2
1
-55
0
55
2012 2013 2014 2015 2016 2017 2018
Credit to households
Mortgages: amount borrowed (right s.)
CREDIT FOR HOUSE PURCHASE & MORTGAGESy-o-y % change
-12
-4
4
2
3
4
2012 2013 2014 2015 2016 2017 2018
Housing Prices per m2
Interest rate on house purchase (right s.)
HOUSING PRICE & INTEREST RATEy-o-y % change & percentage
16
22
28
32
38
44
2012 2013 2014 2015 2016 2017 2018
Unemployment rate
Affordability based on wages (right s.)
UNEMPLOYMENT RATE & AFFORDABILITY percentage
0
4
8
2011 2012 2013 2014 2015 2016 2017
HOUSEHOLDS LOANS DELINQUENCY RATIOpercentage
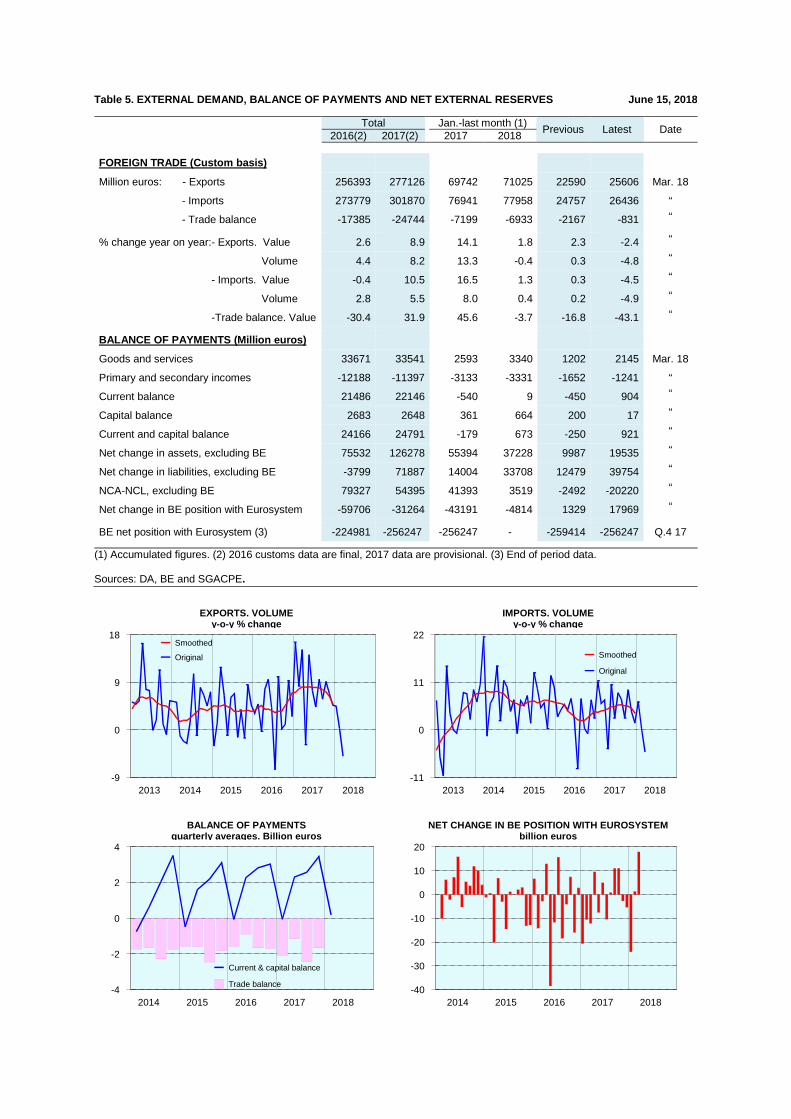
Table 5. EXTERNAL DEMAND, BALANCE OF PAYMENTS AND NET EXTERNAL RESERVES June 15, 2018
Total Jan.-last month (1)
Previous Latest Date 2016(2) 2017(2) 2017 2018
FOREIGN TRADE (Custom basis)
Million euros: - Exports 256393 277126 69742 71025 22590 25606 Mar. 18
- Imports 273779 301870 76941 77958 24757 26436 “
- Trade balance -17385 -24744 -7199 -6933 -2167 -831 “ % change year on year:- Exports. Value 2.6 8.9 14.1 1.8 2.3 -2.4 “ Volume 4.4 8.2 13.3 -0.4 0.3 -4.8 “ - Imports. Value -0.4 10.5 16.5 1.3 0.3 -4.5 “ Volume 2.8 5.5 8.0 0.4 0.2 -4.9 “ -Trade balance. Value -30.4 31.9 45.6 -3.7 -16.8 -43.1 “ BALANCE OF PAYMENTS (Million euros)
Goods and services 33671 33541 2593 3340 1202 2145 Mar. 18
Primary and secondary incomes -12188 -11397 -3133 -3331 -1652 -1241 “
Current balance 21486 22146 -540 9 -450 904 “ Capital balance 2683 2648 361 664 200 17 “ Current and capital balance 24166 24791 -179 673 -250 921 “ Net change in assets, excluding BE 75532 126278 55394 37228 9987 19535 “ Net change in liabilities, excluding BE -3799 71887 14004 33708 12479 39754 “ NCA-NCL, excluding BE 79327 54395 41393 3519 -2492 -20220 “ Net change in BE position with Eurosystem -59706 -31264 -43191 -4814 1329 17969 “ BE net position with Eurosystem (3) -224981 -256247 -256247 - -259414 -256247 Q.4 17
-9
0
9
18
2013 2014 2015 2016 2017 2018
Smoothed
Original
EXPORTS. VOLUMEy-o-y % change
-11
0
11
22
2013 2014 2015 2016 2017 2018
Smoothed
Original
IMPORTS. VOLUMEy-o-y % change
-4
-2
0
2
4
2014 2015 2016 2017 2018
Current & capital balance
Trade balance
BALANCE OF PAYMENTSquarterly averages. Billion euros
-40
-30
-20
-10
0
10
20
2014 2015 2016 2017 2018
NET CHANGE IN BE POSITION WITH EUROSYSTEMbillion euros
(1) Accumulated figures. (2) 2016 customs data are final, 2017 data are provisional. (3) End of period data. Sources: DA, BE and SGACPE.

Table 6. LABOUR MARKET June 15, 2018 Latest data Change over previous year, thousands Percentage change over previous year
Average Average Previous Latest Average Average Previous Latest
Date Thousands 2017 2018(1) data data 2017 2018(1) data data
LABOUR FORCE SURVEY
Labour force Q.1. 18 22670 -81 -23 19 -23 -0.4 -0.1 0.1 -0.1 Employment " 18874 483 436 490 436 2.6 2.4 2.6 2.4 - Non agricultural " 18041 438 450 486 450 2.5 2.6 2.7 2.6 - Wage earners " 15792 487 451 537 451 3.2 2.9 3.5 2.9 - Temporary workers " 4123 223 173 179 173 5.6 4.4 4.4 4.4 - Permanent workers " 11669 264 279 358 279 2.3 2.4 3.2 2.4 Unemployment " 3796 -564 -459 -471 -459 -12.6 -10.8 -11.1 -10.8 % of labour force Points of change over previous year
Unemployment rate " - 17.2 16.7 16.5 16.7 -2.4 -2.0 -2.1 -2.0 - Male " - 15.7 15.2 15.0 15.2 -2.5 -2.0 -2.2 -2.0 - Female " - 19.0 18.5 18.3 18.5 -2.4 -2.0 -1.9 -2.0 - Young (16-24 years) " - 38.7 36.3 37.5 36.3 -5.8 -5.3 -5.4 -5.3 PUBLIC EMPLOYMENT SERVICES
Change over previous year,thousands Percentage change over previous year
Registered unemployed May. 18 3252 -361 -258 -237 -209 -9.3 -7.1 -6.6 -6.0 Registered contracts (2) " 2058 1522 323 168 31 7.6 3.8 10.5 1.5 - Permanent contracts(2) " 200 216 132 38 33 12.6 16.5 25.2 19.6 - Temporary contracts (2) " 1858 1306 191 130 -2 7.2 2.5 8.9 -0.1 SOCIAL SECURITY SYSTEM
Covered workers (3) May. 18 18916 626 588 556 570 3.6 3.3 3.1 3.1 - Payroll employment (3) " 15640 601 560 524 538 4.2 3.8 3.5 3.6
(1) Available data period. (2) Aggregate data for the average. (3) Monthly average. Sources: INE and MTMS.
-6
-3
0
3
6
2013 2014 2015 2016 2017 2018
Employment LFS
Social security covered workers
EMPLOYMENT (LFS)% change over previous year
-16
-8
0
8
16
2013 2014 2015 2016 2017 2018
Unemployment LFS
Registered unemployment
UNEMPLOYED% change over previous year
-6
-3
0
3
6
2013 2014 2015 2016 2017 2018
Total
Permanent workers
EMPLOYEES (LFS)% change over previous year
12
16
20
24
28
2013 2014 2015 2016 2017 2018
All
Men
Women
UNEMPLOYMENT RATE (LFS)% of labour force
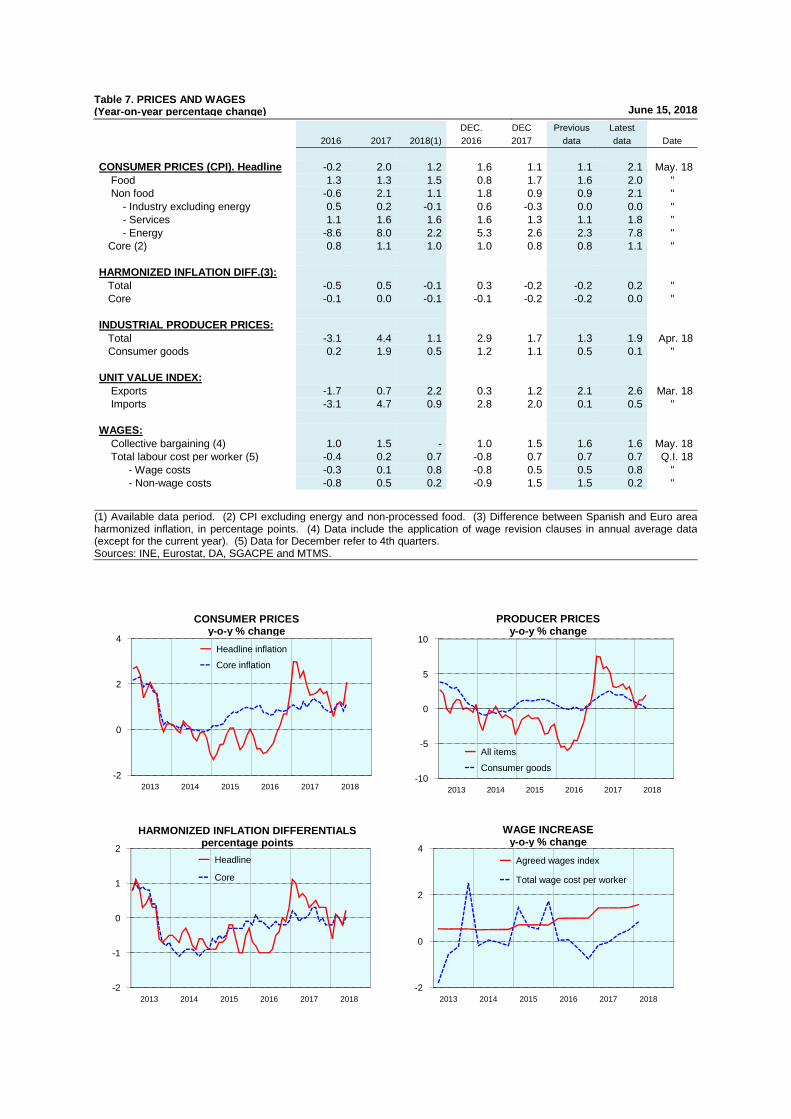
Table 7. PRICES AND WAGES (Year-on-year percentage change) June 15, 2018
DEC. DEC Previous Latest 2016 2017 2018(1) 2016 2017 data data Date
CONSUMER PRICES (CPI). Headline -0.2 2.0 1.2 1.6 1.1 1.1 2.1 May. 18 Food 1.3 1.3 1.5 0.8 1.7 1.6 2.0 " Non food -0.6 2.1 1.1 1.8 0.9 0.9 2.1 " - Industry excluding energy 0.5 0.2 -0.1 0.6 -0.3 0.0 0.0 " - Services 1.1 1.6 1.6 1.6 1.3 1.1 1.8 " - Energy -8.6 8.0 2.2 5.3 2.6 2.3 7.8 " Core (2) 0.8 1.1 1.0 1.0 0.8 0.8 1.1 " HARMONIZED INFLATION DIFF.(3): Total -0.5 0.5 -0.1 0.3 -0.2 -0.2 0.2 " Core -0.1 0.0 -0.1 -0.1 -0.2 -0.2 0.0 " INDUSTRIAL PRODUCER PRICES: Total -3.1 4.4 1.1 2.9 1.7 1.3 1.9 Apr. 18 Consumer goods 0.2 1.9 0.5 1.2 1.1 0.5 0.1 " UNIT VALUE INDEX: Exports -1.7 0.7 2.2 0.3 1.2 2.1 2.6 Mar. 18 Imports -3.1 4.7 0.9 2.8 2.0 0.1 0.5 " WAGES: Collective bargaining (4) 1.0 1.5 - 1.0 1.5 1.6 1.6 May. 18 Total labour cost per worker (5) -0.4 0.2 0.7 -0.8 0.7 0.7 0.7 Q.I. 18 - Wage costs -0.3 0.1 0.8 -0.8 0.5 0.5 0.8 " - Non-wage costs -0.8 0.5 0.2 -0.9 1.5 1.5 0.2 "
-2
0
2
4
2013 2014 2015 2016 2017 2018
Headline inflation
Core inflation
CONSUMER PRICESy-o-y % change
-10
-5
0
5
10
2013 2014 2015 2016 2017 2018
All items
Consumer goods
PRODUCER PRICESy-o-y % change
-2
-1
0
1
2
2013 2014 2015 2016 2017 2018
Headline
Core
HARMONIZED INFLATION DIFFERENTIALSpercentage points
-2
0
2
4
2013 2014 2015 2016 2017 2018
Agreed wages index
Total wage cost per worker
WAGE INCREASEy-o-y % change
(1) Available data period. (2) CPI excluding energy and non-processed food. (3) Difference between Spanish and Euro area harmonized inflation, in percentage points. (4) Data include the application of wage revision clauses in annual average data (except for the current year). (5) Data for December refer to 4th quarters. Sources: INE, Eurostat, DA, SGACPE and MTMS.

Table 8. PUBLIC SECTOR: STATE OPERATIONS (Accumulated figures in million euro)
June 15, 2018
IN CASH BASIS IN CASH BASIS NATIONAL ACCOUNTING December December % April April % April April % 2016 2017 2017 2018 2017 2018
1. REVENUE 133,588 131,456 -1.6 47,418 49,323 4.0 55,419 60,615 9.4
Taxes 104,915 104,541 -0.4 40,096 41,773 4.2 49,322 53,912 9.3Personal income tax 35,799 36,028 0.6 15,570 17,211 10.5 Corporate income tax 21,678 23,143 6.8 2,037 1,584 -22.3 VAT 31,528 29,235 -7.3 17,439 17,893 2.6 Excise duties 7,739 7,349 -5.0 2,329 2,230 -4.3 Other taxes 8,170 8,784 7.5 2,720 2,856 5.0
Other revenue (1) 28,674 26,915 -6.1 7,322 7,550 3.1 6,097 6,703 9.9
2. EXPENDITURE 149,791 147,746 -1.4 43,634 50,155 14.9 63,042 66,543 5.6
Wages and salaries (2) 16,207 15,836 -2.3 4,656 4,738 1.8 Goods and services 3,516 3,355 -4.6 713 797 11.8 Interest payments 32,078 30,324 -5.5 8,130 12,242 50.6 Current transfers (2) 85,497 85,290 -0.2 27,276 28,341 3.9 Fixed investment 4,338 5,330 22.9 682 1,670 144.9 Capital transfers 8,156 7,611 -6.7 2,178 2,367 8.7
3. NET OVERALL BALANCE (1-2) -16,203 -16,290 0.5 3,784 -832 - -7,623 -5,928 -22.2
Pro-memoria
Total taxes (3) 184,976 192,920 4.3 66,991 69,681 4.0
Personal income tax 72,416 77,038 6.4 27,809 29,603 6.5
VAT 62,845 63,647 1.3 27,887 29,143 4.5
Excise duties 19,866 20,308 2.2 6,537 6,496 -0.6
100
125
150
175
200
2011 2012 2013 2014 2015 2016 2017 2018
Net Overall Balance
Revenue
Expenditure
STATE OPERATIONSAccumulated figures in the last 12 months (€ billio n)
65
70
75
80
2011 2012 2013 2014 2015 2016 2017 2018
PERSONAL INCOME TAXAccumulated figures in the last 12 months (€ billio n)
10
20
30
2011 2012 2013 2014 2015 2016 2017 2018
CORPORATE INCOME TAXAccumulated figures in the last 12 months (€ billio n)
40
50
60
70
2011 2012 2013 2014 2015 2016 2017 2018
VALUE ADDED TAXAccumulated figures in the last 12 months (€ billio n)
(1) Includes fees, property income and current and capital transfers. (2) Homogenized data in relation to the change in the treatment of pensions paid by the State. (3) Includes the participation of regional and local governments.
Source: MHAC.
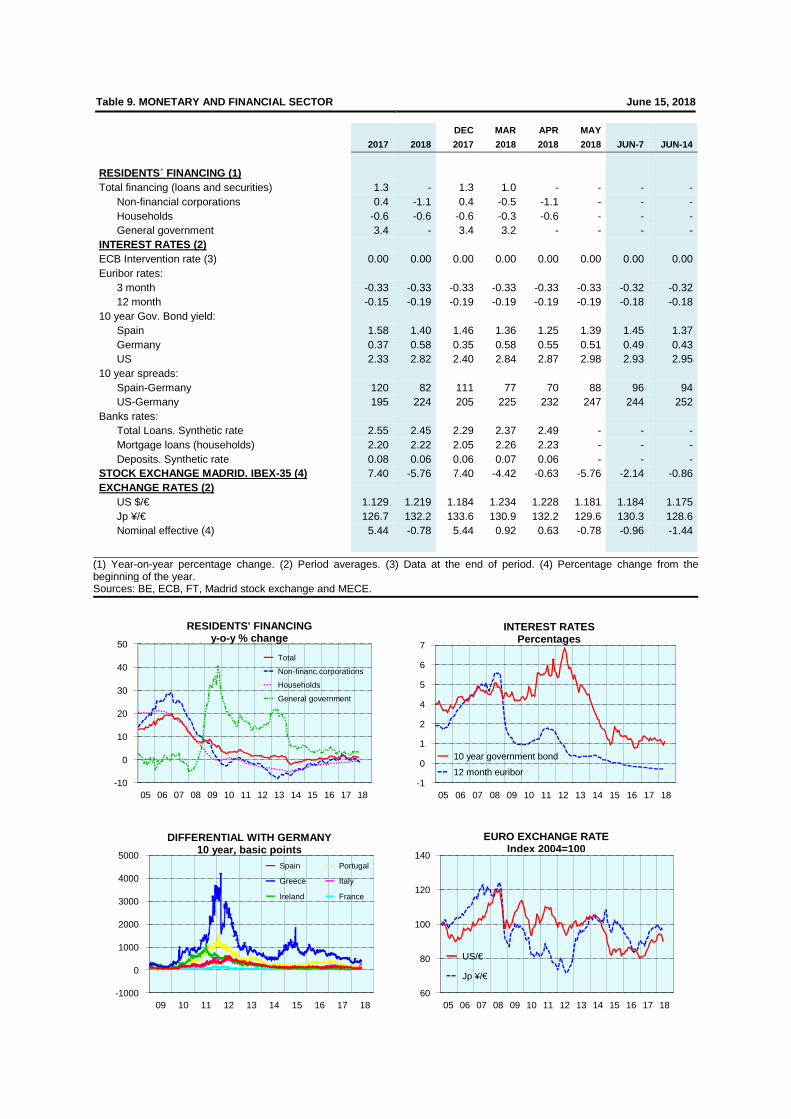
Table 9. MONETARY AND FINANCIAL SECTOR June 15, 2018 DEC MAR APR MAY
2017 2018 2017 2018 2018 2018 JUN-7 JUN-14
RESIDENTS´ FINANCING (1) Total financing (loans and securities) 1.3 - 1.3 1.0 - - - - Non-financial corporations 0.4 -1.1 0.4 -0.5 -1.1 - - - Households -0.6 -0.6 -0.6 -0.3 -0.6 - - - General government 3.4 - 3.4 3.2 - - - - INTEREST RATES (2) ECB Intervention rate (3) 0.00 0.00 0.00 0.00 0.00 0.00 0.00 0.00 Euribor rates: 3 month -0.33 -0.33 -0.33 -0.33 -0.33 -0.33 -0.32 -0.32 12 month -0.15 -0.19 -0.19 -0.19 -0.19 -0.19 -0.18 -0.18 10 year Gov. Bond yield: Spain 1.58 1.40 1.46 1.36 1.25 1.39 1.45 1.37 Germany 0.37 0.58 0.35 0.58 0.55 0.51 0.49 0.43 US 2.33 2.82 2.40 2.84 2.87 2.98 2.93 2.95 10 year spreads: Spain-Germany 120 82 111 77 70 88 96 94 US-Germany 195 224 205 225 232 247 244 252 Banks rates: Total Loans. Synthetic rate 2.55 2.45 2.29 2.37 2.49 - - - Mortgage loans (households) 2.20 2.22 2.05 2.26 2.23 - - - Deposits. Synthetic rate 0.08 0.06 0.06 0.07 0.06 - - - STOCK EXCHANGE MADRID. IBEX-35 (4) 7.40 -5.76 7.40 -4.42 -0.63 -5.76 -2.14 -0.86 EXCHANGE RATES (2) US $/€ 1.129 1.219 1.184 1.234 1.228 1.181 1.184 1.175 Jp ¥/€ 126.7 132.2 133.6 130.9 132.2 129.6 130.3 128.6 Nominal effective (4) 5.44 -0.78 5.44 0.92 0.63 -0.78 -0.96 -1.44
-10
0
10
20
30
40
50
05 06 07 08 09 10 11 12 13 14 15 16 17 18
Total
Non-financ.corporations
Households
General government
RESIDENTS' FINANCINGy-o-y % change
-1
0
1
2
4
5
6
7
05 06 07 08 09 10 11 12 13 14 15 16 17 18
10 year government bond
12 month euribor
INTEREST RATESPercentages
-1000
0
1000
2000
3000
4000
5000
09 10 11 12 13 14 15 16 17 18
Spain
Greece
Ireland
Portugal
Italy
France
DIFFERENTIAL WITH GERMANY10 year, basic points
60
80
100
120
140
05 06 07 08 09 10 11 12 13 14 15 16 17 18
US/€
Jp ¥/€
EURO EXCHANGE RATEIndex 2004=100
(1) Year-on-year percentage change. (2) Period averages. (3) Data at the end of period. (4) Percentage change from the beginning of the year. Sources: BE, ECB, FT, Madrid stock exchange and MECE.

Table 10. INTERNATIONAL INDICATORS (I) June 15, 2018
GDP % change IPI
% change CPI
% annual change Unemployment rate % Labour force (4)
Budget balance (2) % GDP
2017 Latest
q-o-q y-o-y 3 months
(1) 1
year Pre- vious Latest
Pre- vious Latest 2018 2019
Germany 2.5 0.3 I 2.3 -1.2 2.0 Apr 1.6 2.2 May 5.3 5.2 May 1.5 1.5
France 2.3 0.2 I 2.2 -0.5 2.1 Apr 1.6 2.0 May 8.6 8.9 I -2.3 -2.5
U.Kingdom 1.8 0.1 I 1.2 0.3 1.8 Apr 2.4 2.4 May 4.2 4.2 Apr -1.4 -1.3
Italy 1.6 0.3 I 1.4 -0.7 2.3 Apr 0.5 1.0 May 11.1 11.2 Apr -1.8 -0.9
Spain (3) 3.1 0.7 I 3.0 -0.3 1.9 Apr 1.1 2.1 May 16.5 16.7 I -2.4 -1.5
EU 2.6 0.4 I 2.4 -0.9 2.0 Apr 1.5 2.0 May 7.1 7.1 Apr - -
Euro area 2.6 0.4 I 2.5 -1.2 1.8 Apr 1.3 1.9 May 8.6 8.5 Apr -0.6 -0.4
US. 2.3 0.5 I 2.8 1.0 3.5 Apr 2.5 2.8 May 3.9 3.8 May -5.5 -6.1
Japan 1.7 -0.2 I 1.1 0.6 1.7 Apr 1.1 0.6 Apr 2.5 2.5 Apr -3.0 -2.5
OECD 2.5 0.6 IV 2.7 0.1 3.2 Mar 2.3 2.3 Apr 5.5 5.5 Jan -2.6 -2.6
-4
-2
0
2
4
6
2013 2014 2015 2016 2017 2018
Spain
Germany
France
US
GDPy-o-y % change
-8
-4
0
4
8
2013 2014 2015 2016 2017 2018
Spain
Germany
France
US
INDUSTRIAL PRODUCTIONy-o-y % change. Smoothed series
-2
0
2
4
2013 2014 2015 2016 2017 2018
Spain
Germany
France
US
CPIy-o-y % change
-10
-5
0
5
2014 2015 2016 2017 2018 2019
Spain
Germany
France
US
BUDGET BALANCE% GDP
(1) Average of last 3 months relative to the previous 3 months average. (2) European Commission, IMF and OECD. (3) In Spain IPI calendar and seasonal adjusted. (4) In Germany registered unemployment. Sources: Eurostat, European Commission, IMF, OECD, The Economist and INE.
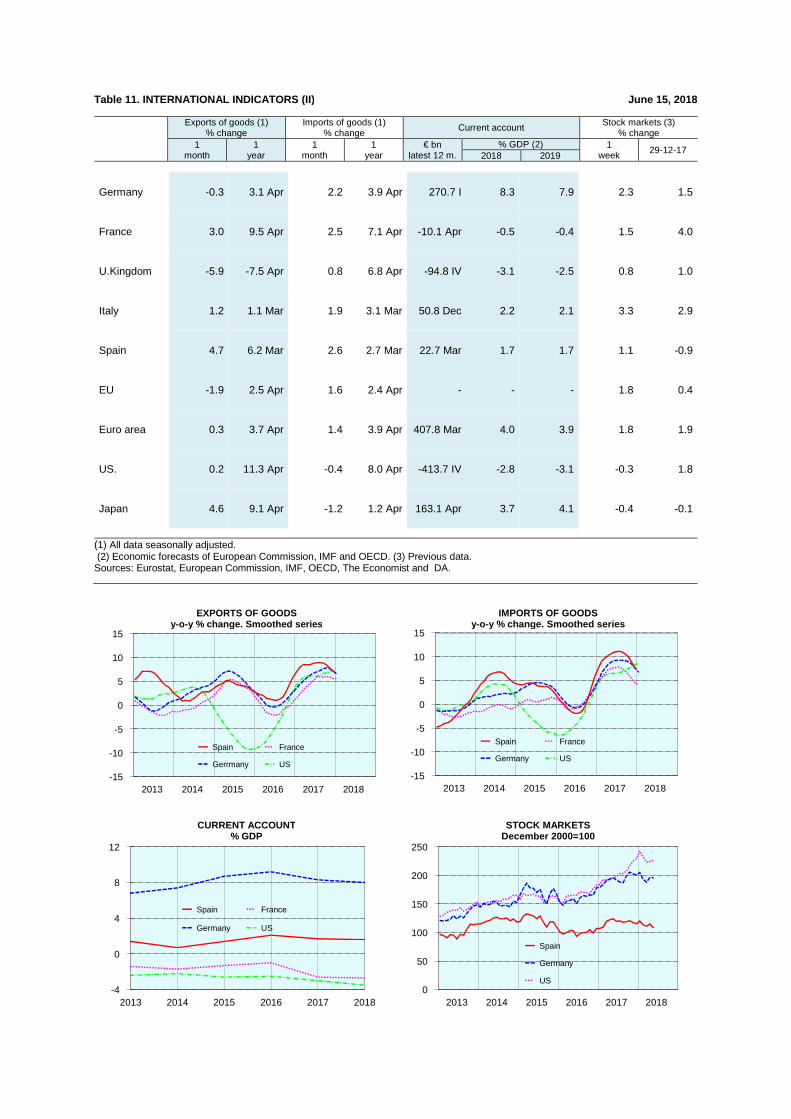
Table 11. INTERNATIONAL INDICATORS (II) June 15, 2018
Exports of goods (1) % change
Imports of goods (1) % change
Current account Stock markets (3) % change
1 month
1 year
1 month
1 year
€ bn latest 12 m.
% GDP (2) 1 week 29-12-17
2018 2019
Germany -0.3 3.1 Apr 2.2 3.9 Apr 270.7 I 8.3 7.9 2.3 1.5
France 3.0 9.5 Apr 2.5 7.1 Apr -10.1 Apr -0.5 -0.4 1.5 4.0
U.Kingdom -5.9 -7.5 Apr 0.8 6.8 Apr -94.8 IV -3.1 -2.5 0.8 1.0
Italy 1.2 1.1 Mar 1.9 3.1 Mar 50.8 Dec 2.2 2.1 3.3 2.9
Spain 4.7 6.2 Mar 2.6 2.7 Mar 22.7 Mar 1.7 1.7 1.1 -0.9
EU -1.9 2.5 Apr 1.6 2.4 Apr - - - 1.8 0.4
Euro area 0.3 3.7 Apr 1.4 3.9 Apr 407.8 Mar 4.0 3.9 1.8 1.9
US. 0.2 11.3 Apr -0.4 8.0 Apr -413.7 IV -2.8 -3.1 -0.3 1.8
Japan 4.6 9.1 Apr -1.2 1.2 Apr 163.1 Apr 3.7 4.1 -0.4 -0.1
-15
-10
-5
0
5
10
15
2013 2014 2015 2016 2017 2018
Spain
Gerrmany
France
US
EXPORTS OF GOODSy-o-y % change. Smoothed series
-15
-10
-5
0
5
10
15
2013 2014 2015 2016 2017 2018
Spain
Germany
France
US
IMPORTS OF GOODSy-o-y % change. Smoothed series
-4
0
4
8
12
2013 2014 2015 2016 2017 2018
Spain
Germany
France
US
CURRENT ACCOUNT% GDP
0
50
100
150
200
250
2013 2014 2015 2016 2017 2018
Spain
Germany
US
STOCK MARKETSDecember 2000=100
(1) All data seasonally adjusted. (2) Economic forecasts of European Commission, IMF and OECD. (3) Previous data. Sources: Eurostat, European Commission, IMF, OECD, The Economist and DA.
D. G. de Análisis Macroeconómico y Economía Interna cional S. G. de Análisis Coyuntural y Previsiones Económic as
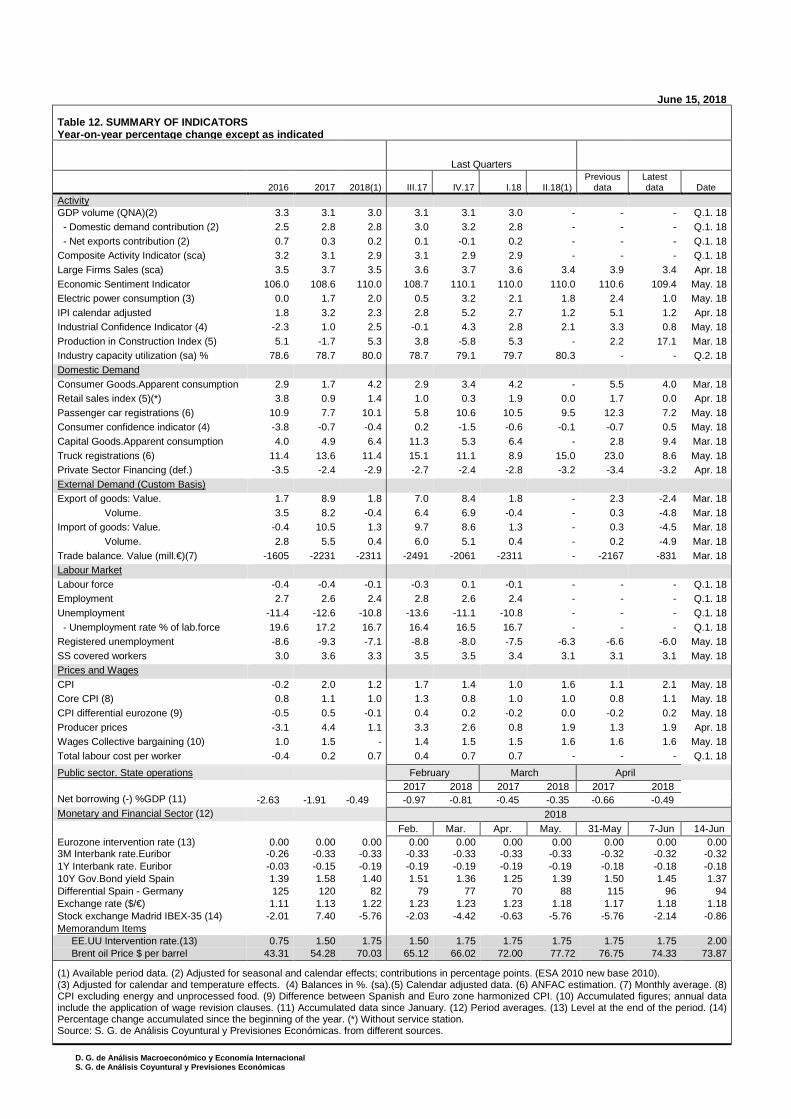
June 15, 2018 Table 12. SUMMARY OF INDICATORS Year-on-year percentage change except as indicated
Last Quarters
2016 2017 2018(1) III.17 IV.17 I.18 II.18(1) Previous
data Latest data Date
Activity GDP volume (QNA)(2) 3.3 3.1 3.0 3.1 3.1 3.0 - - - Q.1. 18
- Domestic demand contribution (2) 2.5 2.8 2.8 3.0 3.2 2.8 - - - Q.1. 18 - Net exports contribution (2) 0.7 0.3 0.2 0.1 -0.1 0.2 - - - Q.1. 18 Composite Activity Indicator (sca) 3.2 3.1 2.9 3.1 2.9 2.9 - - - Q.1. 18 Large Firms Sales (sca) 3.5 3.7 3.5 3.6 3.7 3.6 3.4 3.9 3.4 Apr. 18
Economic Sentiment Indicator 106.0 108.6 110.0 108.7 110.1 110.0 110.0 110.6 109.4 May. 18 Electric power consumption (3) 0.0 1.7 2.0 0.5 3.2 2.1 1.8 2.4 1.0 May. 18 IPI calendar adjusted 1.8 3.2 2.3 2.8 5.2 2.7 1.2 5.1 1.2 Apr. 18 Industrial Confidence Indicator (4) -2.3 1.0 2.5 -0.1 4.3 2.8 2.1 3.3 0.8 May. 18 Production in Construction Index (5) 5.1 -1.7 5.3 3.8 -5.8 5.3 - 2.2 17.1 Mar. 18 Industry capacity utilization (sa) % 78.6 78.7 80.0 78.7 79.1 79.7 80.3 - - Q.2. 18
Domestic Demand Consumer Goods.Apparent consumption 2.9 1.7 4.2 2.9 3.4 4.2 - 5.5 4.0 Mar. 18 Retail sales index (5)(*) 3.8 0.9 1.4 1.0 0.3 1.9 0.0 1.7 0.0 Apr. 18 Passenger car registrations (6) 10.9 7.7 10.1 5.8 10.6 10.5 9.5 12.3 7.2 May. 18 Consumer confidence indicator (4) -3.8 -0.7 -0.4 0.2 -1.5 -0.6 -0.1 -0.7 0.5 May. 18 Capital Goods.Apparent consumption 4.0 4.9 6.4 11.3 5.3 6.4 - 2.8 9.4 Mar. 18 Truck registrations (6) 11.4 13.6 11.4 15.1 11.1 8.9 15.0 23.0 8.6 May. 18 Private Sector Financing (def.) -3.5 -2.4 -2.9 -2.7 -2.4 -2.8 -3.2 -3.4 -3.2 Apr. 18 External Demand (Custom Basis) Export of goods: Value. 1.7 8.9 1.8 7.0 8.4 1.8 - 2.3 -2.4 Mar. 18 Volume. 3.5 8.2 -0.4 6.4 6.9 -0.4 - 0.3 -4.8 Mar. 18 Import of goods: Value. -0.4 10.5 1.3 9.7 8.6 1.3 - 0.3 -4.5 Mar. 18 Volume. 2.8 5.5 0.4 6.0 5.1 0.4 - 0.2 -4.9 Mar. 18 Trade balance. Value (mill.€)(7) -1605 -2231 -2311 -2491 -2061 -2311 - -2167 -831 Mar. 18 Labour Market Labour force -0.4 -0.4 -0.1 -0.3 0.1 -0.1 - - - Q.1. 18
Employment 2.7 2.6 2.4 2.8 2.6 2.4 - - - Q.1. 18 Unemployment -11.4 -12.6 -10.8 -13.6 -11.1 -10.8 - - - Q.1. 18 - Unemployment rate % of lab.force 19.6 17.2 16.7 16.4 16.5 16.7 - - - Q.1. 18 Registered unemployment -8.6 -9.3 -7.1 -8.8 -8.0 -7.5 -6.3 -6.6 -6.0 May. 18
SS covered workers 3.0 3.6 3.3 3.5 3.5 3.4 3.1 3.1 3.1 May. 18 Prices and Wages CPI -0.2 2.0 1.2 1.7 1.4 1.0 1.6 1.1 2.1 May. 18 Core CPI (8) 0.8 1.1 1.0 1.3 0.8 1.0 1.0 0.8 1.1 May. 18 CPI differential eurozone (9) -0.5 0.5 -0.1 0.4 0.2 -0.2 0.0 -0.2 0.2 May. 18 Producer prices -3.1 4.4 1.1 3.3 2.6 0.8 1.9 1.3 1.9 Apr. 18 Wages Collective bargaining (10) 1.0 1.5 - 1.4 1.5 1.5 1.6 1.6 1.6 May. 18 Total labour cost per worker -0.4 0.2 0.7 0.4 0.7 0.7 - - - Q.1. 18
Public sector. State operations February March April 2017 2018 2017 2018 2017 2018 Net borrowing (-) %GDP (11) -2.63 -1.91 -0.49 -0.97 -0.81 -0.45 -0.35 -0.66 -0.49 Monetary and Financial Sector (12) 2018 Feb. Mar. Apr. May. 31-May 7-Jun 14-Jun Eurozone intervention rate (13) 0.00 0.00 0.00 0.00 0.00 0.00 0.00 0.00 0.00 0.00 3M Interbank rate.Euribor -0.26 -0.33 -0.33 -0.33 -0.33 -0.33 -0.33 -0.32 -0.32 -0.32 1Y Interbank rate. Euribor -0.03 -0.15 -0.19 -0.19 -0.19 -0.19 -0.19 -0.18 -0.18 -0.18 10Y Gov.Bond yield Spain 1.39 1.58 1.40 1.51 1.36 1.25 1.39 1.50 1.45 1.37 Differential Spain - Germany 125 120 82 79 77 70 88 115 96 94 Exchange rate ($/€) 1.11 1.13 1.22 1.23 1.23 1.23 1.18 1.17 1.18 1.18 Stock exchange Madrid IBEX-35 (14) -2.01 7.40 -5.76 -2.03 -4.42 -0.63 -5.76 -5.76 -2.14 -0.86 Memorandum Items EE.UU Intervention rate.(13) 0.75 1.50 1.75 1.50 1.75 1.75 1.75 1.75 1.75 2.00 Brent oil Price $ per barrel 43.31 54.28 70.03 65.12 66.02 72.00 77.72 76.75 74.33 73.87
(1) Available period data. (2) Adjusted for seasonal and calendar effects; contributions in percentage points. (ESA 2010 new base 2010). (3) Adjusted for calendar and temperature effects. (4) Balances in %. (sa).(5) Calendar adjusted data. (6) ANFAC estimation. (7) Monthly average. (8) CPI excluding energy and unprocessed food. (9) Difference between Spanish and Euro zone harmonized CPI. (10) Accumulated figures; annual data include the application of wage revision clauses. (11) Accumulated data since January. (12) Period averages. (13) Level at the end of the period. (14) Percentage change accumulated since the beginning of the year. (*) Without service station. Source: S. G. de Análisis Coyuntural y Previsiones Económicas. from different sources.

D. G. de Análisis Macroeconómico y Economía Interna cional S. G. de Análisis Coyuntural y Previsiones Económic as
Graph 12. SUMMARY INDICATORS
-6
-3
0
3
6
2013 2014 2015 2016 2017 2018
Domestic Demand (contrib.)
GDP
Net exports (contrib.)
GDP AND COMPONENTS (Adjusted Data)y-o-y % change
-15
0
15
2013 2014 2015 2016 2017 2018
Households Cons.Exp.
GFCF Equip.and others
GFCF Construction
DOMESTIC DEMAND: COMPONENTS (Adjusted Data)y-o-y % change
-18
-12
-6
0
6
2013 2014 2015 2016 2017 2018
IPI calendar adjusted
ICl
INDUSTRY: PRODUCTION AND CONFIDENCEy-o-y % change and balances
-8
-4
0
4
8
86
93
100
107
114
2013 2014 2015 2016 2017 2018
Large Firms Sales (left)
Econ.Sent.I.(right)
Elect.Power Con (left)
ACTIVITY INDICATORSy-o-y % change
-5
0
5
10
15
2013 2014 2015 2016 2017 2018
Imports
Exports
IMPORTS AND EXPORTS. CUSTOMSy-o-y % change (volume)
-14
0
14
2013 2014 2015 2016 2017 2018
Consumer goods (adjusted)
Capital goods (adjusted)
CONSUMER GOODS. APPARENT CONSUMPTION y-o-y % change
-5
0
5
2013 2014 2015 2016 2017 2018
Employment LFS
Social Security covered workers
EMPLOYMENT (y-o-y % change)
-2
0
2
4
2013 2014 2015 2016 2017 2018
CPI
Core inflation
CONSUMER PRICES (y-o-y % change)


