
i
Sandra Isabel Cardoso Gaspar Martins Mestre em Matemática Aplicada
An approach to teach Calculus/Mathematical Analysis (for
engineering students) using computers and active learning – its conception,
development of materials and evaluation
Dissertação para obtenção do Grau de Doutor em Ciências da Educação
Orientador: Vitor Duarte Teodoro, Professor Auxiliar, Faculdade de Ciências e Tecnologia da Universidade
Nova de Lisboa Co-orientador: Tiago Charters de Azevedo, Professor Adjunto, Instituto Superior de Engenharia de Lisboa do Instituto Politécnico de Lisboa
Júri: Presidente: Prof. Doutor Fernando José Pires Santana Arguentes: Prof. Doutor Jorge António de Carvalho Sousa Valadares Prof. Doutor Jaime Maria Monteiro de Carvalho e Silva Vogais: Prof. Doutor Carlos Francisco Mafra Ceia Prof. Doutor Francisco José Brito Peixoto Prof. Doutor António Manuel Dias Domingos
Prof. Doutor Vítor Manuel Neves Duarte Teodoro Prof. Doutor Tiago Gorjão Clara Charters de Azevedo
Janeiro 2013

ii
Título: An approach to teach Calculus/Mathematical Analysis (for engineering students) using computers
and active learning – its conception, development of materials and evaluation
2012, Sandra Gaspar Martins (Autora), Faculdade de Ciências e Tecnologia da Universidade Nova de
Lisboa e Universidade Nova de Lisboa
A Faculdade de Ciências e Tecnologia e a Universidade Nova de Lisboa tem o direito, perpétuo e sem
limites geográficos, de arquivar e publicar esta dissertação através de exemplares impressos reproduzidos
em papel ou de forma digital, ou por qualquer outro meio conhecido ou que venha a ser inventado, e de a
divulgar através de repositórios científicos e de admitir a sua cópia e distribuição com objectivos
educacionais ou de investigação, não comerciais, desde que seja dado crédito ao autor e editor.

iii
Às minhas doces filhotas
Alice, Laura e Marta.
E ao meu maridão Rogério.

iv

v
I want to profoundly acknowledge…
…to my advisor, Dr. Vitor Duarte Teodoro, for his constant availability, for his dedication, for
his understanding and support. For his intelligent comments based on his scientific vision, aiming
to perform honest and excellent quality research.
… to my co-advisor, Dr. Tiago Charters de Azevedo, for his interest and support and by his
pertinent comments and suggestions.
… to my students…those who participated in this research for believing… to all, because they
make me love more and more my profession!
…to the Instituto Politécnico de Lisboa for the support by a PROTEC scholarship.
… to my dear English reviewer, Celina, for the hard work she had.
…to Teresa for having suffered with me the difficulties of PhD.
… to my parents and sisters for being pillars that are always there!
… to Laura for the kisses in eyes that were not given.
… to Marta for the close hugs that I did not give her.
… to Alice for the nights that I did not snuggle her in bed.
… to Rogério, for existing!
Aknowledgements

vi
vii
This thesis reports a new approach to the teaching of Mathematical Analysis 1/ Calculus (AM1)
to students of engineering, applying results of research on the use of computers and active
learning with the aim of enhancing understanding. The main goal of the new approach is to
reduce the known problem of failure and superficial understanding in introductory college
mathematics in Portugal (and other countries).
This researcher created the approach named ActivMathComp where:
Students are active and collaborate with colleagues during classes;
Computer is embedded as a communication, interaction and computational tool;
Students use interactive digital learning documents;
Students explore concepts in order to develop a deep understanding of them;
Students contact with mathematical applications;
Students have frequent short quizzes with immediate feedback on a Learning
Management System;
The teacher/student relationship is grounded on trust, on mutual understanding and on
students’ involvement on their own learning.
The interactive digital documents were created assuming principles such as the zone of
proximal development (Vygotsky) and multiple representations.
Towards its comparison with the traditional approach, the ActivMathComp was implemented
in a group of 16 AM1 students at the Civil Engineering Undergraduate Program of the Instituto
Superior de Engenharia de Lisboa. The participants freely chose to enrol in the group and were
required to bring their own laptop to classes. Took place a quasi-experiment where all the other
seven classes following AM1 were taken as a comparison group.
The participating students got significantly higher grades than the other students and had a
higher success rate. Data gathered from questionnaires and tests were screened to identify
Abstract

viii
possible bias but some doubts remain. The participating students evaluated ActivMathComp as
highly positive in nearly all aspects.
Keywords:
Calculus
Mathematical Analysis
Computers
Technology
Active Learning

ix
Esta tese apresenta uma nova abordagem ao ensino da Análise Matemática 1/ Cálculo (AM1) para
estudantes de engenharia, aplicando os resultados da investigação sobre o uso de computadores e
da aprendizagem activa com o objectivo de melhorar a sua aprendizagem. O principal objectivo
desta nova abordagem é minorar os problemas de insucesso e de compreensão superficial da
matemática introdutória de matemática no ensino superior em Portugal (e outros países).
Esta investigadora criou esta abordagem chamada ActivMathComp em que:
Nas aulas, os alunos estão activos e colaboram entre si;
O computador é incluído como ferramenta computacional, de interacção e de
comunicação.
Os alunos utilizam documentos digitais interactivos;
Os alunos exploram os conceitos tendo em vista uma compreensão profunda;
Os alunos contactam com as aplicações da matemática;
Os alunos têm frequentes mini-testes com feedback imediato num Sistema de Gestão da
Aprendizagem;
A relação professor/aluno assenta na confiança, compreensão mutua e no envolvimento
dos estudantes na sua própria aprendizagem.
Os documentos digitais interactivos foram criados usando princípios como a zona de
desenvolvimento próximo (Vygotsky) e as múltiplas representações.
Com vista à sua comparação com a abordagem tradicional, o ActivMathComp foi
implementado num grupo de 16 estudantes de AM1 da Licenciatura em Engenharia Civil do
Instituto Superior de Engenharia de Lisboa. Os alunos decidiram livremente inscrever-se no grupo
e era pedido que trouxessem o seu próprio portátil para as aulas. Realizou-se uma quasi-
experiência em que as outras sete turmas de AM1 funcionaram como grupo de comparação.
Resumo

x
Os participantes obtiveram notas significativamente superiores às dos outros alunos e
apresentam uma taxa mais alta de aprovação entre os avaliados. Os dados do questionário foram
estudados de modo a identificar possíveis motivos de enviesamento e algumas dúvidas
permanecem. Os participantes avaliaram o ActivMathComp muito positivamente em quase todos
os aspectos.
Palavras Chave:
Cálculo
Análise Matemática
Computadores
Tecnologia
Aprendizagem Activa

xi
Résumé

xii
Cette thèse présente une nouvelle approche de l'enseignement de Analyse Mathématique 1/Calcul
(AM1) pour les étudiants d'ingénierie appliquant les résultats de recherche sur l'utilisation des
ordinateurs et sur l'apprentissage actif pour améliorer leur apprentissage. Le principal objectif de cette
nouvelle approche est de pallier les problèmes d'échec et de la compréhension superficielle des
mathématiques introductives à l'enseignement supérieur au Portugal (et d'autres pays).
Cette rechercher a créé l’approche appelée ActivMathComp où:
Les étudiants sont actifs et travaillent ensemble en classe;
L'ordinateur est inclus comme un outil de calcul et de communication.
Les étudiants utilisent documents interactifs;
Les étudiants explorent les concepts pour développer une compréhension profonde;
Les étudiants prennent contact avec les applications des mathématiques;
Les étudiants font souvent petites tests avec une retour immédiate dans un système de
gestion de l'apprentissage;
La relation professeur / étudiant est basé sur la confiance, la compréhension mutuelle et la
participation des étudiants dans leur apprentissage.
Les documents interactifs prendre en considération principes comme la zone de développement
proximale (Vygotsky) et de multiples représentations.
En vue de leur comparaison avec l’approche traditionnelle, l’ActivMathComp a été testé avec un
groupe de 16 étudiants d’AM1 de la Graduation en Ingénierie Civil, à l’Institut Supérieur d’
Ingénierie de Lisbonne. Les étudiants ont librement décidé d'adhérer au groupe où ont été invités à
apporter leur propre ordinateur portable pour les classes. C’est fait une quasi- expérience où les sept
autres classes d’AM1 ont été le groupe de comparaison.
Les participants ont obtenu des notes significativement supérieurs à ceux des autres étudiants, et
ont une plus élevé taux d'approbation parmi ceux évalués. Les données du questionnaire ont été
étudiées pour identifier les causes possibles de biais, certains doutes subsistent. Les participants ont
évaluée ActivMathComp très positivement en presque tous les aspects.

xiii
Mots-clés:
Calcul
Analyse Mathématique
Ordinateurs
Technologie
Apprentissage actif

1
Aknowledgements v
Abstract vii
Resumo ix
Résumé xi
Table of Contents 1
List of Figures 10
List of Tables 16
List of Abbreviations 20
Introduction 22
1 Computers and Learning Software on Mathematics 27
Use of Computers on Mathematics Learning 28 1.1
1.1.1 A brief overview from the past to the present 28
1.1.2 Influences of the computers in teaching and learning 29
Software 30 1.2
1.2.1 Computer Algebra Systems: Maxima 30
Table of Contents

2
1.2.2 Modelling software: Modellus 32
1.2.3 Spreadsheet software: Excel 36
1.2.4 Dynamic Geometry Software: GeoGebra 39
1.2.5 Learning Management Systems (LMS): Moodle 41
1.2.6 Editors of mathematical symbols 46
Online Resources 51 1.3
1.3.1 Online software 51
1.3.2 Online tutorials and quizzes 55
1.3.3 Online repositories 57
Research on Teaching and Learning with Computers – Special Attention to its Use in 1.4
Mathematics 58
1.4.1 Research with computers in general 58
1.4.2 Research with Computer Algebra Systems 60
1.4.3 Research with Modelling software 60
1.4.4 Research with Spreadsheets 62
1.4.5 Research with Learning Management Systems 64
1.4.6 Research with Dynamic Geometry Software 65
1.4.7 Research with applets 65
2 Research Connected with Mathematics Teaching and Learning, with a
Particular Emphasis on Introductory Calculus 67
Institutional Mathematics Trends around the World 67 2.1
2.1.1 Calculus Reform Movement 68
2.1.2 PISA 69
2.1.3 TIMSS Advanced 72
2.1.4 NCTM Principles 75
2.1.5 MAA Trends 75
2.1.6 ATM Principles 76

3
Calculus Teaching and Learning 76 2.2
2.2.1 Realistic Mathematics Education 77
2.2.2 Computer-assisted instruction in China 77
2.2.3 Integrated Math, Physics and Undergraduate Laboratory Science, English and
Engineering 78
2.2.4 Calculus Consortium based at Harvard University 78
2.2.5 Calculus as a Laboratory Course 79
2.2.6 CALCULUS & Mathematica® 80
2.2.7 Calculus in Context 81
2.2.8 Visual Calculus 82
2.2.9 Evaluation of Calculus Reform classes by gender 82
Undergraduate Mathematics Teaching and Learning 83 2.3
2.3.1 Active Learning strategies in Toronto 83
2.3.2 Mathematics, software and curricula – Open University of Catalonia84
2.3.3 WebALT – Using ICT in mathematics education 84
2.3.4 Teaching Mathematics to Civil Engineering 85
Undergraduate Teaching and Learning of STEM (Science, Technology, Engineering and 2.4
Mathematics) 86
2.4.1 Student-Centered Active Learning Environment for Undergraduate Programs
(SCALE-UP) 87
2.4.2 TEAL – an MIT approach based in SCALE-UP 88
2.4.3 Calculus teaching based in SCALE-UP 89
2.4.4 Peer Instruction 89
2.4.5 Seven principles for good practice in undergraduate education 90
Mathematics Teaching and Learning 92 2.5
2.5.1 Carnegie Learning 92
2.5.1 SimCalc MathWorlds 93
2.5.2 Teaching functions with computers 94

4
2.5.3 Tutorials 94
3 Topics around Mathematics Didactics 96
Active Learning in Higher Education 97 3.1
Learning Styles 100 3.2
3.2.1 The model of Felder and Silverman (ILS) 101
3.2.2 The model of Kolb: Experiential Learning Model (LSI) 103
3.2.3 The model of MYERS-BRIGGS (MBTI) 107
3.2.4 Teaching Calculus to all learning styles 108
Do Not Work Always Alone 110 3.3
Proximal Development Zone (PDZ) 111 3.4
Working Memory 111 3.5
Meaningful Learning and Concept Maps 113 3.6
Multiple Representations 113 3.7
Modelling/Applications of Calculus 115 3.8
Assessment 116 3.9
3.9.1 Is traditional assessment an accurate measure of student’s learning effectiveness in
Mathematical Analysis? 116
3.9.2 Possible solutions of assessment 117
3.9.3 Tests with Feedback 118
4 Interactive Learning Documents 120
Interactivity 121 4.1
Students’ attitude fostered by the ILDs 123 4.2
4.2.1 Active Learning 124
4.2.2 Learning at Each One’s Pace 124
External support 125 4.3
4.3.1 Using Software 125

5
4.3.2 External Links 130
4.3.3 Quizzes on Moodle as Complement 131
Concepts approach 131 4.4
4.4.1 Application Problems 132
4.4.2 Concrete-to-Abstract Approach to Concepts 132
4.4.3 Proximal Development Zone (PDZ) 134
4.4.4 Focus in One Objective Each Moment 135
4.4.5 Multiple Representations 136
4.4.6 Concept Maps 137
Format/Appearance 138 4.5
4.5.1 All in One Document 138
4.5.2 Carefully Structured and Organized 138
4.5.3 Appellative 139
4.5.4 Advantages and Disadvantages of the Format 139
5 Methodology 141
Research Questions 141 5.1
Research Design 142 5.2
The Experimental Class of Mathematical Analysis 1 (TEAM1) 143 5.3
5.3.1 Active learning and collaborative work 143
5.3.2 Relationships in the classroom 145
5.3.3 Assessment 146
5.3.4 Application problems 148
5.3.5 Software 149
5.3.6 Moodle web page 152
5.3.7 Links 153
The Other Classes 154 5.4
6
Instruments 155 5.5
5.5.1 Focus groups 155
5.5.2 Questionnaires 156
5.5.3 Tests and exams 156
6 Data Analysis, Results and Discussion 157
Introduction 157 6.1
Some Characteristics of the Statistical Procedures Used in the Chapter 159 6.2
Part A-Formal data 161
Success rate 161 6.3
Grades 161 6.4
Part B- Data from AM1 questionnaire 163
General Characterization of Students 164 6.5
6.5.1 Age 164
6.5.2 Gender 165
6.5.3 Working students 165
6.5.4 Attitude toward computers 166
Students Behaviour and Results during Secondary School 166 6.6
6.6.1 Type of mathematics 167
6.6.2 Grades 167
6.6.3 Hours spent studying 168
Students Behaviour and Results at LEC 169 6.7
6.7.1 Profile in LEC 169
6.7.2 Lessons attended in LEC 170
6.7.3 Time spent studying in LEC when there are no exams 171
6.7.4 Time spent studying in LEC during exams period 171
AM1 Study 172 6.8

7
6.8.1 AM1 missed lessons 172
6.8.2 Amount of time spent studying for AM1 173
6.8.3 Students commitment towards AM1 173
6.8.4 AM1 study methods 174
6.8.5 Relationship with AM1 175
6.8.6 External support to AM1 176
Grades of AM1 177 6.9
6.9.1 Grades by group 177
6.9.2 Grades by group, with background as covariate 179
6.9.3 Grades by group, among students that are 19 years old or more 182
6.9.4 Grades by group, among students that are in ISEL for three or more semesters 183
6.9.5 Grades by group, among students that are not in evening classes 183
6.9.6 Grades by group, among students that were not in evening classes, who are 19 years
old or more and were in ISEL/AM1 for three or more semesters. 184
6.9.7 Grades by class 185
6.9.8 Grades by teachers 187
Part C- Qualitative and quantitative data about TEAM1 188
Questionnaire of TEAM1 189 6.10
6.10.1 TEAM1 why? 189
6.10.2 Materials: Interactive Learning Documents 191
6.10.3 Quizzes 192
6.10.4 Two teaching methods 193
6.10.5 Characterization of TEAM1 194
6.10.6 Characterization of the student 196
6.10.7 Teaching method of TEAM1 197
6.10.8 Other factors 198
6.10.9 Comments 198
8
TEAM1, why not? 201 6.11
Teacher’s view – Qualitative data 203 6.12
6.12.1 Description of the students of TEAM1 204
6.12.2 Performance 206
6.12.3 More reflections 206
Part D- Discussion 207
7 Conclusions 210
Theoretical Contributions 211 7.1
Practical contributions 216 7.2
7.2.1 Interactive Learning Documents (ILDs) 216
7.2.2 The implementation of Moodle 219
Empirical Contributions 220 7.3
7.3.1 Primary hypothesis 220
7.3.2 Secondary hypotheses 221
Threats to validity 223 7.4
Generality 223 7.5
Future work 223 7.6
References 225
Appendix A – Tests and exams 237
Appendix B – Questionários e Focus Groups 244
Questionário apenas para os alunos que frequentaram a TEAM1: 244
Questionário para todos os alunos de AM1: 249
Caracterização do aluno 250
Caracterização do docente/turma 256
Caracterização de AM1 258

9
Caracterização global de AM1, do docente e do aluno 258
TEAM1 (Turma Experimental de Análise Matemática 1) 260
Guião do Focus Group 261
Appendix C – Comments of TEAM1 students 263
Comentários sobre “A existência dos mini-testes foi benéfica? Porquê?” 263
Comentários sobre “Em geral, teve mais interesse pelas aulas da TEAM1 do que por outras aulas de
AM1 a que tenha assistido? Porque lhe parece que isso tenha acontecido?” 264
Comentários sobre “O que esperava da TEAM1? Houve de facto?” 265
Comentários sobre “O que achou da TEAM1?” 266
Comentários sobre “De TUDO o que vimos atrás, o que é que considera que teve maior impacto no
seu sucesso/insucesso? (Indique pelo menos 5 itens.)” 267
Appendix D – Comments of AM1 students 269
Comentários sobre “Indique outros factores que tenham contribuído para o seu sucesso/insucesso a
AM1 este semestre. Ou algo que lhe pareça relevante sobre estes assuntos” 269
Comentários sobre a AM1 270
Comentários sobre “Se quiser, acrescente outros motivos porque não assistiu à TEAM1, ou algo que
lhe pareça pertinente.” 270

10
Figure 1. Plot of two functions in WxMaxima, a piecewise function (red) and another one defined
by one expression (blue). ................................................................................................................. 31
Figure 2. Example of basic calculations performed by WxMaxima. ............................................ 32
Figure 3. Mathematical model in Modellus. ................................................................................ 33
Figure 4. Bars associated to variables in Modellus. ..................................................................... 33
Figure 5. Animations using angles, sine, cosine, etc. created in Modellus. ................................... 34
Figure 6. A typical screen in Modellus with animations produced by a simple model. ................. 34
Figure 7. Use of a photo to get real data in Modellus. .................................................................. 35
Figure 8. Calculation of 20 terms of a sequence in a spreadsheet software. .................................. 36
Figure 9.Plot of a few terms of a sequence. ................................................................................. 37
Figure 10. Insert "1" in one cell. ................................................................................................. 37
Figure 11. Insertion of a column with the distance between a sequence and its limit. ................... 37
Figure 12. Study of a sequence in a spreadsheet. ......................................................................... 38
Figure 13.Creating the point A and B. ......................................................................................... 39
Figure 14. Creating the straight line through A and B and the circle with center at A ................... 40
List of Figures

11
Figure 15. A new A and B provides a new figure. ....................................................................... 40
Figure 16. By dragging the point A, the derivative of the function (in red) is computed and
displayed on the graph. .................................................................................................................... 41
Figure 17. Part of a Moodle page with links to different files and a test/quiz. .............................. 42
Figure 18. Example of messagens sent in a forum and its answers. .............................................. 42
Figure 19. Examples of questions (of closed answer) of a test. .................................................... 43
Figure 20. Example of a wiki in Moodle. .................................................................................... 43
Figure 21. Example of a homework set in Moodle. ..................................................................... 44
Figure 22. Example of a questionnaire in Moodle. ...................................................................... 44
Figure 23. The chat window in Moodle....................................................................................... 45
Figure 24. Record of students’ grades. ........................................................................................ 45
Figure 25. Formula written in LaTeX. ........................................................................................ 46
Figure 26. Example of a window in TeXnicCenter, showing the LaTeX code and the buttons that
automatically introduce the code. .................................................................................................... 46
Figure 27. An Emacs window, writing formulas in LaTeX code. ................................................ 47
Figure 28. A LyX window, writing formulas in LaTeX code but seeing it immediately in a
"normal/unencoded view". Source: http://www.lyx.org/ ................................................................... 47
Figure 29. A BaKoMa TeX Word, writing formulas in LaTeX code or using buttons and seeing it
in a "normal/unencoded view". Source: http://texteditors.org ........................................................... 48
Figure 30. A ScientificWorkPlace window in which mathematics is written, calculations are made
and functions are ploted. Source: http://www.findsim.net ................................................................ 49
Figure 31. Menu to insert mathematical symbols in Microsoft Office 2010. ................................ 49
Figure 32. Inclusion of Mathype features at Microsoft Office 2010. Source:
http://www.chartwellyorke.com/mathtype/index.html ...................................................................... 50

12
Figure 33. A window of Aurora program and the resultant formula. Source: http://elevatorlady.ca/
........................................................................................................................................................ 50
Figure 34. Output of a formula written in MathML and visualised in XHTML. ........................... 51
Figure 35. A function and its Taylor polynomial of order 3. ........................................................ 51
Figure 36. Example of an applet using Geogebra. Source:
http://www.mnwest.edu/fileadmin/static/website/dmatthews/Geogebra/GeogebraAppletIndexB.htm.
........................................................................................................................................................ 52
Figure 37. Example of WolframAlpha output when we input a function. Source:
http://www.wolframalpha.com/ ....................................................................................................... 53
Figure 38. Example of WolframAlpha output when we input "countries population". Source:
http://www.wolframalpha.com/ ....................................................................................................... 54
Figure 39. Example of a question in a Module of inequations. ..................................................... 55
Figure 40. First presentation of the subject and other part of animation. ...................................... 56
Figure 42. Example of exercise in Calculus & Mathematica. ....................................................... 57
Figure 43. A SCALE-UP class in NCSU with Robert Beichner teaching. Retrieved from www
http://www.ncsu.edu Copyright [2007] by SCALE-UP. Reprinted with permission. ......................... 88
Figure 44. The Nine-Region Learning Style Type Grid. From “Learning styles and learning
spaces: Enhancing experiential learning in higher education,” by A.Y. Kolb and D.A. Kolb, 2005,
Academy of Management Learning and Education, 4, p.198. Reprinted with permission................ 104
Figure 45. The mean score on AC-CE and AE-RO for respondents who reported different
educational specialization and for the three specialized normative subgroups (in bold). From “The
Kolb Learning Style Inventory Version 3.1: 2005 Technical Specifications,” by A.Y. Kolb and D.
A. Kolb, 2005, retrieved from www.learningfromexperience.com.Copyright [2005] by
HayGroup.p.27. Reprinted with permission. .................................................................................. 105
Figure 46. Experiential Learning Cycle. From “The Kolb Learning Style Inventory - Version 3.1:
2005 Technical Specifications,” by A.Y. Kolb and D. A. Kolb, 2005, retrieved from

13
www.learningfromexperience.com .Copyright [2005] by HayGroup. p.3. Reprinted with permission.
..................................................................................................................................................... 106
Figure 47. Using Combo Boxes to explore the concept of conjunction. ..................................... 121
Figure 48. Using Check Boxes and Text Fields to explore the concept of absolute value. .......... 122
Figure 49. Example of a page personalized using the tools of Adobe Reader. ............................ 123
Figure 50. Construction of the Taylor polinomial by the student. .............................................. 124
Figure 51. Use of a Spreadsheet to get a plot and a table of some terms of a sequence. .............. 125
Figure 52. Creation of a graphic in a CAS to explore the composition of functions. .................. 126
Figure 53. Modelling the front of Vasco da Gama shopping center using Modellus. .................. 126
Figure 54. Multiple representations of sin(x) using Modellus- includes animations.................... 127
Figure 55. MathType a mathematics editor. .............................................................................. 128
Figure 56. Answers written with a mathematics editor (Mathtype). ........................................... 129
Figure 57. Applet of the Taylor polynomial of the function sin(x) of degree 6 at the point
. ..................................................................................................................................... 130
Figure 58. Web page of Instituto Superior Técnico to support students to get better formation in
basic mathematics. http://modulos.math.ist.utl.pt/ .......................................................................... 130
Figure 59. Web page of Faculadade de Ciências da Universidade do Porto to give support to
students about elementary mathematics. http://cmup.fc.up.pt/cmup/apoiomat/ ............................... 131
Figure 60. Icon thar shows that there is a quizz on Moodle. ...................................................... 131
Figure 61. Problem about determination of the best dimenstions of a reservatory. ..................... 132
Figure 62. Usage of the series of Zenon's Paradox to show intuitively the meaning of the
convergence of a series. ................................................................................................................. 133
Figure 63. Definition (abstract and formal) of convergence of a series. ..................................... 134
14
Figure 64. Exercises to introduce primitivation techniques. ....................................................... 135
Figure 65. Problems of maximization (minimization). ............................................................... 136
Figure 66. Calculation of the limit of sequences using multiple representations. ........................ 137
Figure 67. Example of a concept map made by the teacher. ....................................................... 137
Figure 68. Front cover of chapter 7- Diferenciability. ................................................................ 139
Figure 69. Integral properties presented with combo boxes to let students choose the meaningful
option. ........................................................................................................................................... 144
Figure 70. Two multiple choice questions from the Moodle test about Logic. ............................ 147
Figure 71. A question with numeric answer from the Moodle test of series. .............................. 147
Figure 72. Application example explored in class. .................................................................... 148
Figure 73. Applet to study the limit of a piecewise function at . ....................................... 151
Figure 74. Page of TEAM1 in Moodle. ..................................................................................... 152
Figure 75. Honour board with the four best students in each mini-test. ...................................... 153
Figure 76. Web page of Instituto Superior Técnico to support students to get better formation in
basic mathematics: http://modulos.math.ist.utl.pt/ .......................................................................... 154
Figure 77. Web page of Faculadade de Ciências da Universidade do Porto to give support to
students about elementary mathematics: http://cmup.fc.up.pt/cmup/apoiomat/ .............................. 154
Figure 78. Distribution of AM1 students. .................................................................................. 158
Figure 79. Distribution of AM1 students. .................................................................................. 164
Figure 80. Example of a page from a ILD with Combo Boxes and Check Boxes. ...................... 217
Figure 81. Example of a page from a ILD where the approach of a concept goes from concrete to
abstract and where are used multiple representations of a concept. ................................................. 218

15
Figure 82. Example of a page from a ILD where the student only have to think about the properties
of integrals, does not have to copy it. ............................................................................................. 219

16
Table 1. Engineering students and faculty distribution among the cathegories of the Index of
Learning Styles ............................................................................................................................. 102
Table 2. Quantity of students subscribed, assessed and approved by groups and success rate. .... 161
Table 3. Comparison of AM1 grades between participants and the other students. ..................... 162
Table 4. Tests of normality of the grades of AM1 students. ....................................................... 162
Table 5. Test of homogeneity of variances of the grades of AM1 students. ................................ 162
Table 6. One-way ANOVA of the grades of AM1 students in both groups. ............................... 162
Table 7. Average of students age, by group. .............................................................................. 164
Table 8. Quantity of students of each gender by group. ............................................................. 165
Table 9. Working students, by group......................................................................................... 165
Table 10. Measure of students’ attitudes toward computers, by group, in a scale of 1 to 7, where
7 = very much. ............................................................................................................................. 166
Table 11. Students who have learned mathematics A, per group. ............................................... 167
Table 12. Students’ grades at mathematics during secondary school and entrance grade to ISEL,
per group. ...................................................................................................................................... 168
Table 13. Number of students spending a given number of hours studying, in the 12th grade, per
group. ............................................................................................................................................ 168
List of Tables

17
Table 14. Students profile in LEC by group. ............................................................................. 169
Table 15. Students attending a given percentage of LEC lessons, per group. ............................. 170
Table 16. Number of students studying a given number of hours, per week, not counting time
spent in classes, when there are no exams, per group. .................................................................... 171
Table 17. Number of students studying a given number of hours, per week, during exams period,
per group. ...................................................................................................................................... 171
Table 18. Number of students that have missed a given amount of AM1 lessons. ...................... 172
Table 19. Number of hours spent studying AM1, per group. ..................................................... 173
Table 20. Students commitment towards AM1 in a scale of 1 (Totally disagree) to 7 (Totally
agree). .......................................................................................................................................... 174
Table 21. Students study methods across groups, evaluated on a scale of 1 (Totally disagree) to 7
(Totally agree). ............................................................................................................................. 175
Table 22. Students relationship with AM1, across groups, in a scale of 1 (Totally disagree) to 7
(Totally agree). ............................................................................................................................. 176
Table 23. Students’ evaluation of external support to AM1, across groups, in a scale of 1 (Totally
disagree) to 7 (Totally agree). ....................................................................................................... 177
Table 24. Grades of students respondent to questionnaire, per group. ........................................ 178
Table 25. Tests of normality of the grades of AM1' students. .................................................... 178
Table 26. Test of homogeneity of variances of the grades of AM1' students. ............................. 178
Table 27. One-way ANOVA of the grade of the students of AM1 in both groups ...................... 178
Table 28. One-way ANOVAs of the covariates of the grade of the students of AM1 in both groups
(the participants group and the comparison group). ........................................................................ 180
Table 29. Tests of Between-Subject Effects of grades between group and the covariates. .......... 180

18
Table 30. ANCOVA (Tests of Between-Subject Effects) with grades as dependent variable, group
as fixed factor and grade at Mathematics in 12th
grade of school; Grade to ISEL entrance; and level
of study at 12th
grade of school as covariates. ................................................................................ 181
Table 31. Estimates of average grade across groups. ................................................................. 181
Table 32. Grades of AM1’students that have 19 years old or more. ........................................... 182
Table 33. ANOVA of grades of students with 19 years old or more, across groups. ................... 182
Table 34. Grades of AM1’students that are in ISEL for 3 or more semesters. ............................ 183
Table 35. ANOVA of grades of students for three or more semesters in AM1, across groups. ... 183
Table 36. Grades of AM1' students that were not in evening classes. ......................................... 183
Table 37. ANOVA of grades of the students not in evening classes, across groups. ................... 184
Table 38. Grades of AM1 students. ........................................................................................... 184
Table 39. ANOVA of grades of the students not in evening classes, across groups. ................... 185
Table 40. Grades of AM1' students by class. ............................................................................. 185
Table 41. ANOVA of AM1’ grades across classes (with five or more students)......................... 186
Table 42. Homogeneous subsets of classes with five or more students, by Scheffea,b
................ 186
Table 43. Grades of AM1' students by groups with the same teacher. ........................................ 187
Table 44. ANOVA of grades of students across groups of students with the same teacher. ........ 187
Table 45. Homogeneous subgroups according to Post Hoc Scheffea,b,c
Comparisons of grades of
students in groups with the same teacher. ....................................................................................... 188
Table 46. Number of TEAM1 students that has a determined level of agreement with the statement
“I participated in TEAM1 because…”. .......................................................................................... 190
Table 47. Number of TEAM1 students that has a determined level of agreement with statements
about the ILDs created for TEAM1. ............................................................................................... 191

19
Table 48. Number of TEAM1 students that has a determined level of agreement with affirmations
about the quizzes of TEAM1. ........................................................................................................ 192
Table 49. Number of TEAM1 students that has a determined level of agreement with the
statements about teaching methods. ............................................................................................... 194
Table 50. Number of TEAM1 students that has a determined level of agreement with the
statements about the characterization of TEAM1. .......................................................................... 195
Table 51. Number of TEAM1 students that has a determined level of agreement with the
statements about their own characterization as TEAM1 students. ................................................... 196
Table 52. Number of TEAM1 students that have a certain level of agreement with the statements
about TEAM1’ teaching method. ................................................................................................... 197
Table 53. Number of TEAM1 students that has a determined level of agreement with the
statements about factors that may influence students’ performance. ............................................... 198
Table 54. Frequency of key ideas in comments of twelve TEAM1 students to the question: What
did you expect from TEAM1? Did that existed in fact? .................................................................. 199
Table 55. Frequency of key ideas in comments of twelve TEAM1’ students to the question: What
did you think about TEAM1? ........................................................................................................ 199
Table 56. Frequency of key ideas in comments of TEAM1’ students to the question: From all that
was approached before, what had the biggest impact in your success/failure? (Specify at least 5
items.) ........................................................................................................................................... 200
Table 57. Number of AM1students that has a determined level of agreement with sentences about
their reasons and interest in participating on TEAM1. (NAND- nor agree nor disagree; NR/NO – did
not respond/no opinion) ................................................................................................................. 202
20
AM1 – Análise Matemática 1 (Mathematical Analysis 1)
AMS – American Mathematical Society
ATM – Association of Teachers of Mathematics (of United Kingdom)
ICT- Information and Communication Technology
ILD – Interactive Learning Document –created to support the study.
IREM – Institut de Recherche sur l’Enseignement des Mathématiques (of France)
ISEL – Instituto Superior de Engenharia de Lisboa (Engineering Superior Institute of Lisbon)
LEC – Licenciatura em Engenharia Civil (Civil Engineering Undergraduation)
MAA – Mathematical Association of America
MIT – Massachusetts Institute of Technology
NCSU – North Carolina State University
NCTM – National Council of Teachers of Mathematics (of USA)
NRC – National Research Council (of USA)
NSF – National Science Foundation (of USA)
OECD – Organization for Economic Co-operation and Development
List of Abbreviations

21
PALOP – Países Africanos de Língua Oficial Portuguesa (African Countries of Portuguese
Official Language)
TEAM1 – Turma Experimental de Análise Matemática 1 (The Experimental Class of AM1)
USA – United States of America

22
Mathematics has high failure rates from the earlier grades to higher education (E. Machado, 2006).
Particularly, Mathematical Analysis/Calculus1 (AM1) arise, according to Domingos (2003), Husch
(2001), Treisman (1992), Mumford (1997) an awarded with a Fields Medal, as a course with
worrying failure rates. For example, the failure rate of Mathematical Analysis 1(AM1) at Instituto
Superior de Engenharia de Lisboa (ISEL), in 2006/07, was around 89%; in the USA, in 1987, from
the 600 000 students taking college calculus, only 46% obtained grade D or above (Anderson &
Loftsgaarden, 1987).
Moreover, the understanding of the concepts, even by students who get a passing grade, is
sometimes incipient and instrumental (Domingos, 2003). Students “frequently come to view calculus
as strictly procedural” (Zerr, 2010), tending to memorize processes instead of deeply understanding it
(Domingos, 2003). Tall (1993) emphasizes the difficulties that students have in specific concepts such
as limits and infinite processes.
With the identification of those problems arose the necessity of change. According to Tall (1993)
“a general dissatisfaction with the calculus course has emerged in various countries round the world.”
According to Artigue et al.(1990), the Institut de Recherche sur l’Enseignement des Mathématiques in
France have pursued the need to make the development of the subject matter more meaningful to
students. In the USA arose the Calculus Reform involving several national institutions and many
1 As in Tall (1993) will not be made a distinction between Mathematical Analysis and Calculus because both may mean different things in different places/countries. The focus will be on what is common: the study of
limits and, differential and integral calculus. Taking into account that “the details of these approaches, the level
of rigour, the representations (geometric, numeric, symbolic, using functions or independent and dependent
variables), the individual topics covered, vary greatly from course to course”. Moreover ActivMathComp
approach does not pretend to be fixed to a curriculum, its aim is to be adaptable to other mathematical
curriculums.
Introduction

23
universities. Under this reform, Gleason and Hughes-Hallet (1992, p. 1), teachers in Harvard, state:
“We believe that the calculus curriculum needs to be completely re-thought”.
With technology development, arise recommendations in order to take advantage of computer use
to deep students learning (Blackwell, Trzesniewski, & Dweck, 2007; Kaput, 1994; NCTM, 2000;
Teodoro, 2002). Many problems may be addressed and solved by the use of computers in all their
potentialities. The “ICT [Information and Communication Technologies] and computing
technologies can be used to address problems originated by the great diversity in the classrooms, not
only of background or culture, but also of cognitive style” (Caprotti, Seppala, & Xambó, 2007).
According to Machado, computers allow a process of mathematics teaching/learning more addressed
to the student, bearing having in mind the individual processes and rhythms as well as the suitability
of contents to the capacities of students. For Capproti et al. (2007) the new teacher will “adopt a
technology, either in the classroom or online, and promotes learning using it”; “ICT has the potential
to revolutionize teaching habits, namely administering online assessment and testing by automated
software tools”. Crato (2004) states that students should use ICT more and better in secondary and
undergraduate school and less in basic school. According to Tall, Smith and Piez (2008) Calculus is
the area of mathematics that get the “most interest and investment in the use of Technology.
Initiatives around the world have introduced a range of innovative approaches from programming
numerical algorithms in various languages, to use of graphic software to explore calculus concepts, to
fully featured computer algebra systems”. “The influx of technology into the college classroom has
been inevitable, and the use of computer algebra systems in college level mathematics is becoming
increasingly common” (Borchelt, 2007). However, the usage of computers in the technical sense, as
an essential tool, is far from reality to most of university students, namely in the initial years of their
graduations (Teodoro, 2002).
According to Chickering and Gameson (1987) to achieve active learning students must do “more
than just listen: they must read, write, discuss, or be engaged in solving problems”, students must be
engaged in “higher-order thinking tasks as analysis, synthesis, and evaluation”. Active learning is
used, with success, in several approaches with different kinds of students, sometimes in top
universities other times in common universities. Several projects are examples of it: SCALE-UP
(2008) in North Carolina State University, TEAL (Dori & Belcher, 2004) in Massachusetts Institute
of Technology (MIT), Peer Teaching (Lasry, Mazur, & Watkins, 2008) in Harvard University.
According to Bonwell and Eison, “throughout the 1980s, numerous leaders in the field of higher
education (Cross 1987) and a series of national [USA] reports (Study Group 1984) repeatedly urged

24
college and university faculty to actively involve and engage students in the process of learning”.
However, Thielens and Wagner ( 1987 ) state that the way of teaching of 89% of mathematics and
physics teachers in the USA is lecturing, the traditional teaching method in which the teacher talks,
the students listen and sometimes some students answer to some questions. From the author
experience, it is believed that nowadays in Portugal, the number is similar or even higher.
With this study I intended to create an approach to the teaching of theoretical-practical classes of
Mathematical Analysis 1 (AM1) that could fight the high failure rates and get a deep understanding of
concepts by students, grounded in existing knowledge in mathematics education and research in
active learning. The fundamental principles of the approach, named ActivMathComp, are:
Students are active and collaborate with colleagues during classes;
Computer is embedded as a communication, interaction and computational tool;
Students use interactive digital learning documents;
Students explore concepts in order to develop a deep understanding of them;
Students contact with mathematical applications;
Students have frequent short quizzes with immediate feedback on a Learning Management
System;
The teacher/student relationship is grounded on trust, on mutual understanding and on
students’ involvement on their own learning.
The ActivMathComp does not follow exactly any of the approaches mentioned on the literature. It
integrates different aspects of various approaches. It is complete in the sense that it gives directions
for the teaching method, for the type of approach to the curriculum, provides support material, gives
guidance for the assessment and self-assessment of students, gives directions to the relationships
among students/teacher/colleagues, gives directions for using the computer as a communication tool,
a computational tool, and as a tool to explore concepts and get a deeper understanding.
The goal of the study, besides the design of a new learning environment, is to assess its
implementation in a course. The main issue to investigate is whether the ActivMathComp improves
the performance of students, both in higher rate of approval and in better grades. It also intends to
evaluate the receptivity of this approach and realize the evaluation that the students, who were subject
to the approach, make of it. It intends to evaluate: the interactive support materials developed for the
approach, in terms of quality and usefulness; to know whether it is practical, or not, to write

25
mathematics in the support materials (using the computer); to find out the advantages/disadvantages
of taking quizzes with immediate feedback, weekly, on Moodle.
To answer the research questions, the ActivMathComp was implemented in a non-ordinary class
named Experimental Class of Mathematical Analysis 1(TEAM1) that could not be randomly chosen,
since those students must take their personal laptop to every class. A questionnaire was given to every
student of AM1 to find if TEAM1 students are different from the other students in background,
attitudes or behaviours. A questionnaire to TEAM1 students aimed to understand what evaluation
those students make of ActivMathComp, including the evaluation of the interactive support materials
and the quizzes. The grades of all students were also collected to find if there were significant
differences of grades among students of TEAM1 and the other students.
In case of being proved that ActivMathComp is an approach with positive evaluation, it should be
spread to be used in practice to teach AM1 in more higher education institutions and to be an
inspiration to the creation of new approaches to the teaching of other courses of mathematics or even
of science, technology or engineering.
This thesis begins by a literature revision made in the first three chapters. Chapter 4 presents the
interactive learning materials created to the learning of AM1 in the scope of this thesis. Chapter 5 is
dedicated to the methodology, chapter 6 to data analysis, results and discussion; the conclusions are
in chapter 7.
Chapter 1 presents many types of software and online resources, and the way it may be used to
teach mathematics (especially AM1). The chapter finishes presenting research about the usage of
software to teach mathematics.
Chapter 2 begins by studying current trends in mathematics teaching in some regions around the
world. Then several projects about AM1 teaching and its studies are presented. Afterwards, projects
not only of AM1 but of several undergraduate mathematics courses are studied. The study is then
generalized to undergraduate courses (not necessarily of mathematics) and, on the other hand, to
mathematics but not necessarily at the undergraduate level.
In chapter 3 are addressed several topics of mathematics didactics that aim to contribute to
enhance mathematics learning. Research about some themes connected with the way of teaching
(mathematics) is reported: active learning; some classifications of learning styles, assessment,
students’ relationship, student-teacher relationship, support material, etc.

26
The Interactive Learning Documents (ILDs) that are support materials created to this study are
presented in chapter 4. Its features and the principles behind their conception are also presented.
Chapter 5 reports the methodology used in a quasi-experiment to investigate the effectiveness of
ActivMathComp. It introduces the detailed research questions and presents the design created to
answer to those questions and the instruments used to measure the variables.
In chapter 6 the statistical treatment of data is made and the results taken from data are discussed.
Chapter 7 resumes the theoretical, practical and empirical contributions of this study and makes
proposals for future work.

27
“Technology is essential in teaching and learning mathematics; it influences the mathematics
that is taught and enhances students’ learning.” (National Research Council of USA, 1996, p.
24).
This Chapter discusses the use of computers to enhance mathematics learning. The chapter begins by
a presentation of a historical overview of use of computers in education and the influences of the
computers in learning. Next, the Chapter illustrates how some software may be useful to enhance
students learning of calculus and shows some available online resources. At the end, the Chapter
reports research on mathematics learning with computers.
Devices such as calculators, PDAs, IPads, mobile phones with math applications, etc., are not
discussed since they may be considered particular cases of computers.
1 Computers and Learning Software
on Mathematics

28
Use of Computers on Mathematics Learning 1.1
This section presents an overview of the use of computers on mathematics learning since the creation
of personal computers and shows possible influences of the use of computers in teaching and
learning.
1.1.1 A brief overview from the past to the present
Personal computers appeared, according to the Computer History Museum (2011) in the decade of
1970. In the following decade, mainly in the USA, took place a calculus teaching reform that
attributed an important role to the use of computers.
According to Rubin (1999), in the nineties although the computers being considered as having
large potential there were several obstacles and concerns around its use: the risk of bad use; afraid
that it substitutes the teacher; afraid of creation of inequalities between students that have access to it
and those who do not have; it was not part of the curriculum; the need of give formation to the
teachers to use it; and the need to develop it.
In the beginning of this siècle, at least in more developed countries, technology became more
tangible to everyone: more user-friendly, lower prices and were available more information and
communication technology in institutions. However, according to Norton, McRobbie, and Cooper,
(2000) technology still had a small role in education.
In Portugal, the usage of technology nearly started in the last decade and it is still little spread. A
study of Ponte (2004) shows that less than 1% of secondary mathematics teachers use computers as
teaching tools. This opinion is also corroborated by Carvalho e Silva (2003). Probably the reality in
the teaching of calculus was and is not very different. From my experience, in the institutes I am more
connected to, like Faculdade de Ciências da Universidade de Lisboa, Instituto Superior Técnico da
Universidade Técnica de Lisboa, Faculdade de Ciências e Tecnologia da Universidade Nova de
Lisboa, Universidade de Évora and Instituto Superior de Engenharia de Lisboa do Instituto
Politécnico de Lisboa, there are only very few isolated cases of Calculus teachers using computers to
something else than content delivery and slideshows.
This lack of general use of computers to teach mathematics was studied by Lavicza (Lavicza,
2007, 2010) in an on-line questionnaire sent to 4 500 mathematicians in the United States (US),

29
Hungary (HG) and the United Kingdom (UK). The respondents that frequently use Computer Algebra
Systems (CAS) in teaching are 17% in US, 15% in HG and 9% in UK. Taken into account the
possible overrepresentation of CAS users in the participants it may be concluded that the use of CAS
is not constant in every classroom.
Besides that, according to Machado (2006) the question is not any more if the computer should be
used but how we can take the best advantage of it to enhance Calculus learning. Already in (1997)
Carvalho e Silva did not question the necessity of using computers to teach mathematics but evoke
the necessity of the creation of adequate software, sites with suggestions of effective problems using
computers and sites allowing an exchange of experiences.
1.1.2 Influences of the computers in teaching and learning
Computers may revolutionize learning. The use of computers may influence curriculum, didactics,
assessment, motivation, socialization, etc.
Teodoro and Ross (1993) believe that computers may change and improve significantly the
curriculum so it would be a waste of means to use computers only to develop informatics literacy.
According to Collins, we may expect the following eight shifts influenced by the use of
computers:
1. A shift from whole-class to small-group instruction.
2. A shift from lecture and recitation to coaching.
3. A shift from working with better students to working with weaker
students.
4. A shift toward more engaged students.
5. A shift from assessment based on test performance to assessment
based on products, progress, and effort.
6. A shift from a competitive to a co-operative social structure.
7. A shift from all students learning the same thing to different students
learning different things.
8. A shift from the primacy of verbal thinking to the integration of visual
and verbal thinking. (1991, p. 2)

30
The “ICT [Information and Communication Technologies] and computing technologies can be
used to address problems originated by the great diversity in the classrooms, not only of background
or culture, but also of cognitive style” (Caprotti et al., 2007).
According to Machado (2006), computers allow a teaching-learning process more centred on
students, having in mind the individual processes and rhythms and the adaptation of content to the
capabilities of each student.
Capproti et al. (2007) reinforces the idea that “The new teacher will become a facilitator that
adopts a technology, either in the classroom or online, and promotes learning using it”, they also
argue that “ICT has the potential to revolutionize teaching habits, namely administering online
assessment and testing by automated software tools”.
Software 1.2
This section explores software that may be used in a Calculus course. Many programs are mentioned
for each type of software and one is explored in detail to give a more concise idea of its usefulness in
calculus teaching. One important task in software selection was to be freeware (or free software –
even better, as a matter of principles, since it shares its code) or widely used, since financial
difficulties may be a problem in its use by students and teachers.
1.2.1 Computer Algebra Systems: Maxima
Computer Algebra Systems (CAS) are software programs that facilitate to work with symbolic
mathematics. The core functionality of a CAS is manipulation of mathematical expressions in
symbolic form. They often have some other features associated like graphical representations.
There are commercial CAS like Algebrator, ClassPad Manager, LiveMath, Magma, Maple,
Mathcad, Mathematica, MATLAB, TI InterActive!, WIRIS and free CAS like Axiom, Cadabra,
Casyopée, CoCoA, DCAS, DoCon, Eigenmath, FriCAS, GAP, GiNaC, Macaulay, Mathomatic,
Maxima, PARI/GP, Reduce, Sage, SINGULAR, SymPy, and Xcas.

31
CAS will be illustrated using Maxima since it began to be developed on a reliable institution:
Massachusetts Institute of Technology, is free software, has a user-friendly interface named
WxMaxima and is widely used to do mathematical research and to teach mathematics.
Maxima (see Error! Not a valid bookmark self-reference. and Figure 2) is “a system for the
manipulation of symbolic and numerical expressions, including differentiation, integration, Taylor
series, Laplace transforms, ordinary differential equations, systems of linear equations, polynomials,
sets, lists, vectors, matrices, and tensors. Maxima yields high precision numeric results by using exact
fractions, arbitrary precision integers, and variable precision floating point numbers. Maxima can plot
functions and data in two and three dimensions”(Maxima, n.d.).
Figure 1. Plot of two functions in WxMaxima, a piecewise function (red)
and another one defined by one expression (blue).

32
1.2.2 Modelling software: Modellus
There are computer programs for quantitative modelling, i.e., for representation of quantitative
reasoning with tools that provide numerical results (Santos, Vargas, Mendizabal, & Madsen, 2003).
Some commercial examples are: STELLA, Vensim and Coach. A freeware example is Modellus.
Modellus will be used to exemplify this type of software since it is freeware, is used by “thousands of
teachers and students worldwide” (Teodoro, 2002, p. 125) and was recommended to teach
mathematics. Modellus enables multiple representations of functions (defined by an analytic
expression, or a piecewise function, or recursively) and differential equations. By an expression of a
function (or a differential equation) it is possible to create graphs, tables and animations. It is also
possible to change parameters, variables, and domains. For example, a model like in Figure 3 can be
Figure 2. Example of basic calculations performed by WxMaxima.
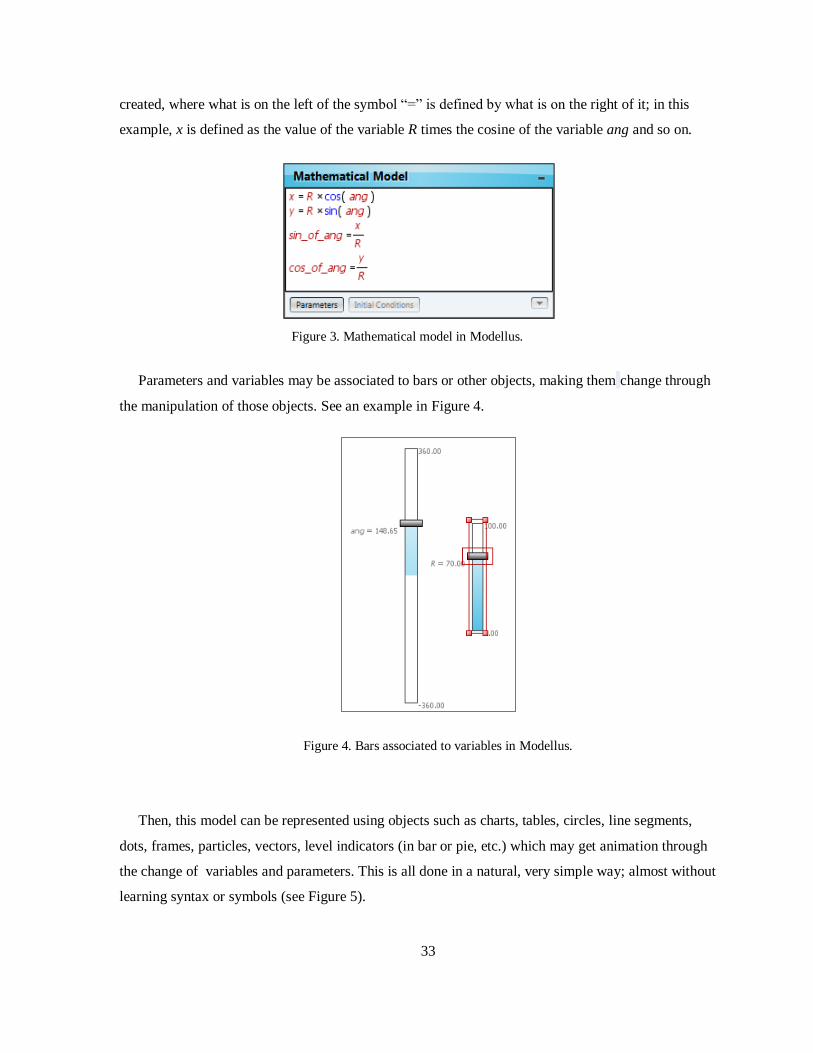
33
created, where what is on the left of the symbol “=” is defined by what is on the right of it; in this
example, x is defined as the value of the variable R times the cosine of the variable ang and so on.
Parameters and variables may be associated to bars or other objects, making them change through
the manipulation of those objects. See an example in Figure 4.
Then, this model can be represented using objects such as charts, tables, circles, line segments,
dots, frames, particles, vectors, level indicators (in bar or pie, etc.) which may get animation through
the change of variables and parameters. This is all done in a natural, very simple way; almost without
learning syntax or symbols (see Figure 5).
Figure 3. Mathematical model in Modellus.
Figure 4. Bars associated to variables in Modellus.

34
This activity can be pre-built by the teacher or built by the student with proper guidance. A typical
screen is shown in Figure 6.
Figure 5. Animations using angles, sine, cosine, etc. created in Modellus.
Figure 6. A typical screen in Modellus with animations produced by a simple model.

35
Another possibility available with Modellus is the use of images to get real data (see Figure 7). In
the following example one seeks a parabola that models the roof of Centro Comercial Vasco da Gama
in Lisbon.
According to, its author, Teodoro:
Modellus is a computer tool for modelling and experimentation. This computer tool
has a user interface that allows students to start doing meaningful conceptual and
empirical experiments (...). The different steps in the process of constructing and
exploring models can be done with Modellus, both from physical points of view and
from mathematical points of view (...). Mathematical models are treated as concrete-
abstract objects: concrete in the sense that they can be manipulated directly with a
computer and abstract in the sense that they are representations of relations between
variables. (2002, p. 13)
Figure 7. Use of a photo to get real data in Modellus.

36
1.2.3 Spreadsheet software: Excel
There are many spreadsheet software available on the market: Microsoft Excel, Apple Numbers, etc;
there are also freeware: Gnumeric, OpenOffice Calc, etc. Microsoft Excel will be used to illustrate
this type of program because it is widely used and all of them have very similar features.
To exemplify the usage of spreadsheet software to teach calculus we will adopt here the
suggestion of Abramovitch and Levis (1994) to teach the definition of limit of a sequence:
⇒ | |
This is a definition which, in Domingos (2003), Tall (1992) and Tall and Schwarzenberger (1978),
is an example of advanced mathematical thinking and is referenced as unclear to most students.
The suggestion is to create, as in Figure 8, a sheet with a sequence in one column (using the
advantages of spreadsheet software).
Figure 8. Calculation of 20 terms of a sequence in a spreadsheet software.
Make a plot to provide a visual sense of the behaviour of the sequence (See Figure 9).

37
Figure 9.Plot of a few terms of a sequence.
Make a prevision of the limit (See Figure 10).
Figure 10. Insert "1" in one cell.
Make a column with the distance of the sequence to the limit and ask each student to use his own
notion of “near” to choose a δ (for example 0.5; 0.1; 10-6
). (See Figure 11.)
Figure 11. Insertion of a column with the distance between a sequence and its limit.
For that find the correspondent using the spreadsheet and confirm it analytically.
Show analytically that, given any δ there is an order from which the distance between the
sequence and the limit is less than δ.

38
A possibility of full screen of Excel is in Figure 12.
According to Abramovich and Levin (1994), is natural that the teacher provides a spreadsheet
when it is not needed that the student gets used to manage the spreadsheet, since in this way the
student saves time. However, according to Papert (1991) a spreadsheet may be used to develop the
constructive thoughts and to explore mathematics.
To avoid misconceptions is recommend the use of different sequences like divergent, convergent,
oscillating, periodic and chaotic. An analogue scenario may be used to explore the Bolzano-Cauchy
theorem as well as convergence of series.
Figure 12. Study of a sequence in a spreadsheet.

39
1.2.4 Dynamic Geometry Software: GeoGebra
Dynamic Geometry Software (DGS) are computer programs which allow creating and manipulating
geometric constructions. There are multiple titles of 2D Dynamic Geometry commercial software
such as Geometer’s Sketchpad, Cabri Geometry, Cinderella, Euklid DynaGeo, Euklides, GCCL,
Geometrix, MathKit, etc; Open Source software of the same kind are GeoGebra, DrGeo, Eukleides,
GeoNext, GeoProof, GeoView, KmPlot, OpenEuclid, etc. There is also 3D Dynamic geometry
software but it is not interesting to Calculus in . The illustration of the DGS will be made with
GeoGebra.
It is usual to start by introducing some points.
Figure 13.Creating the point A and B.
Then the points are used to define new objects such as lines, circles, parabolas, vectors, polygons,
angles, etc.

40
Figure 14. Creating the straight line through A and B and the circle with center at A
that passes through C.
After some construction, points can be dragged in order to see the changes on the construction.
Figure 15. A new A and B provides a new figure.
41
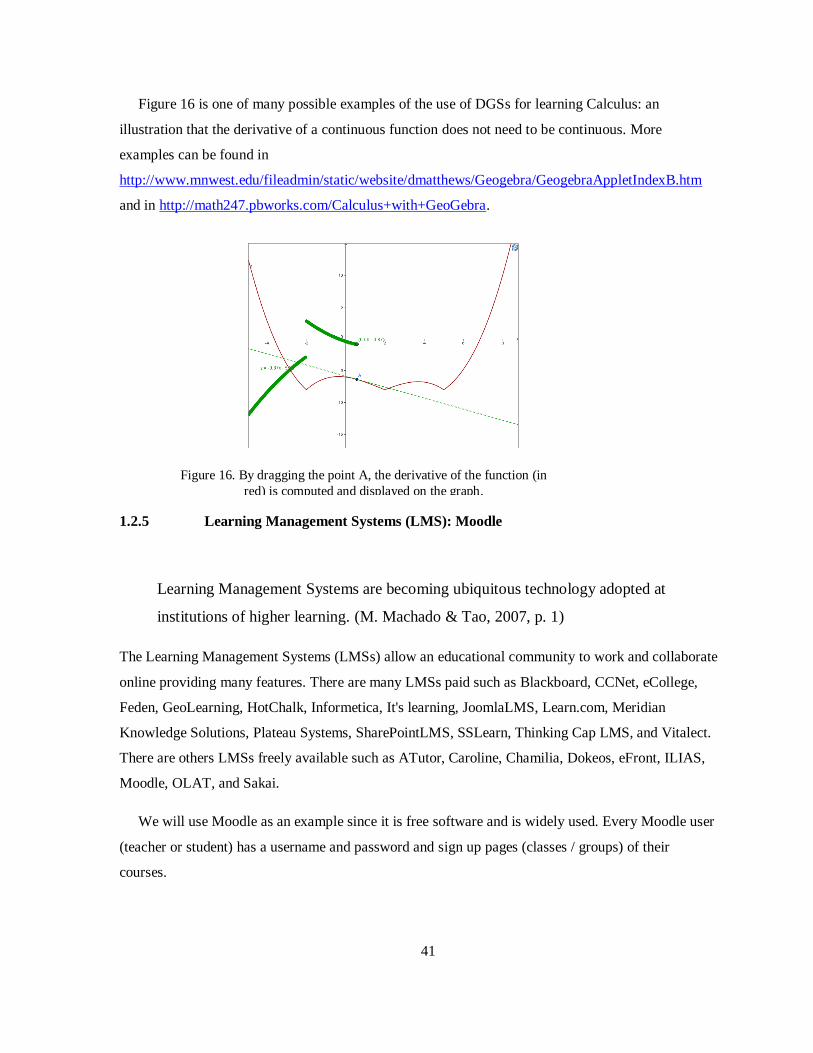
Figure 16 is one of many possible examples of the use of DGSs for learning Calculus: an
illustration that the derivative of a continuous function does not need to be continuous. More
examples can be found in
http://www.mnwest.edu/fileadmin/static/website/dmatthews/Geogebra/GeogebraAppletIndexB.htm
and in http://math247.pbworks.com/Calculus+with+GeoGebra.
1.2.5 Learning Management Systems (LMS): Moodle
Learning Management Systems are becoming ubiquitous technology adopted at
institutions of higher learning. (M. Machado & Tao, 2007, p. 1)
The Learning Management Systems (LMSs) allow an educational community to work and collaborate
online providing many features. There are many LMSs paid such as Blackboard, CCNet, eCollege,
Feden, GeoLearning, HotChalk, Informetica, It's learning, JoomlaLMS, Learn.com, Meridian
Knowledge Solutions, Plateau Systems, SharePointLMS, SSLearn, Thinking Cap LMS, and Vitalect.
There are others LMSs freely available such as ATutor, Caroline, Chamilia, Dokeos, eFront, ILIAS,
Moodle, OLAT, and Sakai.
We will use Moodle as an example since it is free software and is widely used. Every Moodle user
(teacher or student) has a username and password and sign up pages (classes / groups) of their
courses.
Figure 16. By dragging the point A, the derivative of the function (in
red) is computed and displayed on the graph.

42
A page may contain available files of any kind with materials like slides, lists of exercises,
resource sheets, etc. (see Figure 17). Web pages or links to other pages can be created …
Figure 17. Part of a Moodle page with links to different files and a test/quiz.
Forums can be created. Any forum message may be sent to all registered users (see Figure 18).
Figure 18. Example of messagens sent in a forum and its answers.
Tests can be made with several questions (Figure 19) with closed or open answers. The closed
answers are automatically corrected. The teacher has to correct the open answer questions but it is a
simple process.

43
Figure 19. Examples of questions (of closed answer) of a test.
Wikis can also be created (Figure 20). In a wiki, all stakeholders can write or rewrite a page.
Figure 20. Example of a wiki in Moodle.
Deliveries of homework can be set with fixed-term delivery (see Figure 21).

44
Figure 21. Example of a homework set in Moodle.
Questionnaires, such as the one in Figure 22, can be placed online (and answered anonymous or
not):
Figure 22. Example of a questionnaire in Moodle.

45
Participants may use “Chat” (see Figure 23).
Figure 23. The chat window in Moodle.
It is possible to get a list of students’ grades (Figure 24).
Figure 24. Record of students’ grades.
There are many other features such as glossaries, databases, lessons, workshops, referendums,
SCORM / AICC, etc.

46
1.2.6 Editors of mathematical symbols
Until a few years ago, the production of computer written texts with mathematical symbols was
arduous: there were few programs that allowed that and these programs required the knowledge of
codes (such as using AucTeX in Emacs for LaTeX) or spending much time looking at inefficient
symbol menus and with unprofessional results (like MathType) or were expensive and inefficient
(like BaKoMaTeX, ScientificWorkPlace and MathType). In recent times there has been considerable
development in the editors of mathematical symbols but, at least for many people, it is still not as
easy as to handwriting it.
LaTeX is a high-quality typesetting system; it includes features designed for the production of
technical and scientific documentation. LaTeX is standard for the communication and publication of
scientific documents and is free software. As a result of all these advantages it is widely used by the
mathematicians community (Borovik, 2011).
To write in LaTeX we may use various types of editors like Emacs, LyX, Scientific Workplace,
MathType, etc. they then do the compilation using a LaTeX compiler, usually Miktex, and then texts
are obtained in one of several possible formats: pdf, ps, dvi, etc. all with a similar look to Figure 25.
Figure 25. Formula written in LaTeX.
Figure 26. Example of a window in TeXnicCenter, showing the LaTeX code and the buttons that
automatically introduce the code.

47
A free LaTeX editor, TeXnicCenter, allows writing either by introducing code or using menus
(that make the automatic introduction of the code), the result is presented to the user (before
compilation) on code (Figure 26).
Emacs is a traditional free software LaTeX editor which lets you write LaTeX using code (or
menus that convert the symbols into code) as shown in the shaded area of Figure 27. The final format
is obtained after compilation.
Figure 27. An Emacs window, writing formulas in LaTeX code.
Figure 28. A LyX window, writing formulas in LaTeX code but seeing it immediately in a
"normal/unencoded view". Source: http://www.lyx.org/

48
Lyx is another editor with Emacs-like feature (
Figure 28) but with the difference that it only serves to write in LaTeX, unlike Emacs that serves
many other purposes that have nothing to do with LaTeX (this makes it harder to work with Emacs
for someone that does not want to do other things with it).
The Bakoma Tex Word is a paid LaTeX editor. It uses the system WYSIWYG - "What You See Is
What You Get", i.e., when the user write, it compiles instantly, obtaining the final form immediately.
On the other hand, if the user prefer, may write directly in code (see Figure 29).
Figure 29. A BaKoMa TeX Word, writing formulas in LaTeX code or using buttons and seeing it in a
"normal/unencoded view". Source: http://texteditors.org
ScientificWorkPlace (SWP), a paid LaTeX editor that allows previewing of the symbols not as
code (Figure 30). This program joins the functionalities of a LaTeX editor with the functionalities of a

49
high level CAS (Computer Algebra System). SWP allows making graphics of two and three
dimensions; calculating derivatives, primitives, integrals, solutions of equations, differential
equations, etc.; working with arrays, simplify expressions step by step, etc.
Figure 30. A ScientificWorkPlace window in which mathematics is written, calculations are made and
functions are ploted. Source: http://www.findsim.net
Today, the Microsoft Office 2010 has a practical feature (Figure 31) for including mathematical
expressions in Word, PowerPoint, Excel, etc. We may customize expressions of immediate
introduction and using “insert equation” we get a tab that allows quick introduction of symbols.
Figure 31. Menu to insert mathematical symbols in Microsoft Office 2010.
The output does not have the quality of LaTeX but has a reasonable quality:
√

50
It is also possible to add the MathType program to Microsoft Office programs, to introduce other
features like numbering equations, cross-references, navigation between equations, etc. (see Figure
32).
Figure 32. Inclusion of Mathype features at Microsoft Office 2010. Source:
http://www.chartwellyorke.com/mathtype/index.html
The Aurora program (paid) allows to enter mathematical expressions in Microsoft Office using
LaTeX, ensuring a perfect final result as in LaTeX (see Figure 33).
Figure 33. A window of Aurora program and the resultant formula. Source: http://elevatorlady.ca/
Some steps towards the integration of mathematical symbols on the World Wide Web are being
taken using MathML. MathML is a language that was not intended to be written by users (since many

51
lines of code are required to write a simple equation). However, there are several programs (such as
MathType, the Formulator, etc.) that translate the mathematical expressions into MathML allowing
the user to include them in the XHTML code of a webpage. The output is not yet professional, see .
Figure 34. Output of a formula written in MathML and visualised in XHTML.
Online Resources 1.3
There are a multitude of sites that provide online resources that can be used for learning calculus.
Here will be shown some examples of online software, tutorials, quizzes and repositories.
1.3.1 Online software
Let's start with applets that are small applications designed to do a certain action. When a web page
has an applet, sometimes we insert/choose something, and press a button (that makes the browser run
the applet) and we get the result, without installing any special software to this application.
Figure 35. A function and its Taylor polynomial of order 3.
For example, the applet of Figure 35 works as a window that was opened by clicking a link on the
page: http://www.math.psu.edu/dlittle/java/calculus/taylorseries.html. This applet was designed to

52
plot the Taylor Polynomial of a function , at the point of order As is chosen a bigger , the
polynomial (red) approaches more and more to the function (black).
There are applets available online on a wide range of Calculus topics. They allow to explore the
definition of the limit of a sequence, the limit of a function, the derivative of a function, the integral,
the primitive, the area of a region, the volume of a solid of revolution, the mean value theorem, etc.
There are also applets in Mathematica, Maple, Geogebra, etc. The applets in Mathematica belong to
Wolfram Demonstrations Project. The applets in Maple are Maplets. The applets in Geogebra allow
making geometric constructions as in Geogebra or exploring previously made constructions as in the
example of Figure 36.
Figure 36. Example of an applet using Geogebra. Source:
http://www.mnwest.edu/fileadmin/static/website/dmatthews/Geogebra/GeogebraAppletIndexB.htm.

53
Figure 37. Example of WolframAlpha output when we input a function. Source:
http://www.wolframalpha.com/
Figure 37 shows Wolfram|Alpha, a computational knowledge engine. When the user enter a
question or calculation,Wolfram|Alpha comput the answer using its computational power and or its
database. The questions may not be only about mathematics and those that are, do not need to be
asked with symbolic mathematical language. This is a new concept and may have as consequence to

54
increase proximity between mathematics and real life. In the example was introduced an expression
that is interpreted as a function and it displays a very complete study of that function.
We may enter questions that are not about mathematics. For example, when entering the name of a
country we get its flag, its geographical location, the number of habitants, its area, etc. When entering
the name of a food we get very detailed information about its nutritive properties. As we see in Figure
38, when entering “countries population” we get data about population, country by country, all
around the world.
Figure 38. Example of WolframAlpha output when we input "countries population". Source:
http://www.wolframalpha.com/

55
There are many other types of software available online. The Google Docs allow you to use
spreadsheets, text editors and drawing tools, make presentations and forms. The Office Web Apps
allow online use of the Microsoft programs: Word, Excel, PowerPoint and OneNote. In ZCubesTM
is
possible to use a browser, a word processor, a spreadsheet, a drawing tool, a slide maker; it is possible
to do e-cards, albums, personal web pages, web sites, data analysis, engineering solutions, robotics
and many other things.
1.3.2 Online tutorials and quizzes
On the Internet we also find very interesting features. For example, the Instituto Superior Técnico,
from Universidade Técnica de Lisboa, has developed Modules to Support Training in Basic
Mathematics (http://modulos.math.ist.utl.pt/) that was designed to assist students in the improvement
of their mathematics knowledge that should have been acquired in the pre-university education.
Each module is devoted to a theme. That theme begins to be approached with a theoretical
summary, is followed by some examples and, finally, there are exercises– multiple choice exercises
that when the user requests shows the correct answer (see Figure 39). There are so many exercises as
you which in the sense that there is a database that has a set of basis questions for which the computer
generates a new question every time this is requested. It is available online for free.
Figure 39. Example of a question in a Module of inequations.

56
Visual Calculus (http://archives.math.utk.edu/visual.calculus/ ) is a project which addresses
various topics of Calculus. What this website has of special is that to explain the themes, it uses
tutorials with animations (in Flash) that allow the user to reflect on what is explained and enables the
user to advance only when appropriated. These animations are also used in problem solving using
hints to help the student to progress alone. In addition, it also uses applets to deep understanding. It is
available online for free.
Figure 40. First presentation of the subject and other part of animation.
Calculus & Mathematica (C&M), http://www-cm.math.uiuc.edu/, reflects another concept – using
the computer as first approach of calculus themes. The connection with reality and visual learning are
also privileged. In C&M the themes are introduced using the Mathematica®, usually making plots
(that privilege visual learning) of several concrete examples, trying then to understand the logic of the
concept, being the generalization only presented at the end. Are courses, adopted by some
universities, taught exclusively online with interactive computer based texts.

57
Figure 41. Example of exercise in Calculus & Mathematica.
1.3.3 Online repositories
Many repositories might be found online with much support material to learning/teaching of
mathematics, most material is distributed for free. Among the examples with biggest prestige we may
find:
Wolfram MathWorld, http://mathworld.wolfram.com/, from Wolfram;
THE CALCULUS PAGE, http://calculus.org, from the University of California;
Calculus resources, http://www.chipola.edu/instruct/math/mathlab/calculus.htm, from the
Chipola College;
MathArchives, http://archives.math.utk.edu/calculus/crol.html, from the University of
Tennessee;
The Math Forum @ Drexel, http://mathforum.org/, from the Drexel University;

58
Calculus on the web, http://cow.temple.edu/~cow/cgi-bin/manager, from Temple University;
Illuminations http://illuminations.nctm.org/ from NCTM;
Ressouces Pédagogiques http://icb.u-bourgogne.fr/universitysurf/math.html from the
Université de Bourgogne;
Infotheque, http://www.infotheque.info/, from the Agence Universitaire de la Francophonie;
Mathemitec, http://mathemitec.free.fr/index.php;
KhanAcademy http://www.khanacademy.org/;
Portal das Escolas, https://www.portaldasescolas.pt/.
We may also find whole courses online like the OpenCourseWare, http://ocw.mit.edu from MIT,
U-Now, http://unow.nottingham.ac.uk/, from University of Nottingham and OpenCourseWare,
http://ocw.nd.edu, from the University of Notre Dame.
Research on Teaching and Learning with Computers – Special 1.4
Attention to its Use in Mathematics
This section presents diverse research on teaching and learning using computers. Different types of
software are specified. As expected, is given special attention to the use of computers in mathematics
teaching and learning.
1.4.1 Research with computers in general
Timmerman and Kruepke (2006) made a meta-analysis to study the results of computer assisted
instruction (CAI) in college students and got the conclusion that it gives better results than the
traditional instruction. CAI results are stronger in social sciences subjects, when traditional
instruction is in lecture format, in studies published after 1994 and to CAI in many different units
Kulik and Kulik (1985) also made a meta-analysis of 101 studies about computer based education
and found out that it gives better grades to college students of around 0.26 standard deviations. When
compared with programed instruction and individualized instruction it is a good result since those
kinds of instruction only got an increase of 0.1 standard deviations. Other conclusions were that that
instruction allows to save time of instruction and produces good changes in the attitudes of students
towards instruction and computers.

59
Tall, Smith and Piez studied 29 PhD thesis finished in the ten years before about technology and
Calculus. The general trends they found in the dissertations were:
Technology used inappropriately usually makes no significant difference, although
sometimes the mere access to better tools appears to alter the environment enough to allow
observable benefits.
Technology integrated intelligently with curriculum and pedagogy produces measurable
learning gains.
There is little evidence that the “brand” or type of technology makes any significant
difference, beyond to obvious fact that some tasks require more powerful tools than others.
Some, such as Mathematica and Maple give a broader environment for presentation using
notebooks and exploration using built-in programs. The important thing is not which tools
are used but how they are used.
There is evidence that using tools such as Mathematica and Maple for conceptual
exploration, to learn how to instruct the software to carry out symbolic calculations, leads to
conceptual gains in solving problems that can be transfered to later courses. In comparison,
students following traditional courses tend to use more procedural solution processes.
Technology enables some types of learning activities (e.g., discovery learning) and facilitates
some others (e.g., cooperative learning) that are harder or impossible to achieve without
technology. (2004, p. 18)
Machado (2006) systematized the way new technologies, by their potential capacity to promote
learning, are used by philosophies of psychology, in education:
The behaviourists see computers as a new way to give stimuli and reinforcement to get
expected responses, as a way to make reborn the programmed teaching. Computers are
considered an environment that allows more practice and training, in order to settle and
consolidate certain responses or behaviors, desirable behaviors by constructing scientific
stimuli, responses, feedback, and reinforcement. In this perspective, there are now
sophisticated examples of educational software, with modules that adapt to the preferences
of student learning. These products allow students to use their learning processes, with
different progressions and feedback in each case.
To the cognitivists, the main focus of the learning act goes to cognitive functions and mental
processes of learning. The main importance goes to the ways and the strategies used by

60
learners. The computer is seen as a tool to identify and potentiate those structures. In this
point of view the student needs to plan and define strategies to finish its project.
The constructivists see the computer as a good way to potentiate, in students, the
construction of knowledge. This can be achieved by hypermedia products, in which the
student can choose the contents that best suit him, using interactivity and choosing the most
adequate paths. Constructivists also consider the computer/internet good for communication.
In this way, may be promoted learning communities in which, by users/peers interactions,
with or without tutors, the knowledge is built. Virtual reality environments are also
recognized by constructivists as enhancers to build knowledge.
1.4.2 Research with Computer Algebra Systems
In his PhD’s thesis, Tokpah (2008), made a meta-analysis of 31 studies and found that regardless of
how it is used, CAS instruction has the potential to increase learning and so improve students
performance.
Heid (1988) taught an Applied Calculus course to a class of 39 college students during 15 weeks.
During 12 weeks he taught calculus concepts using graphics and CAS to make routine computations.
In the last three weeks they developed competencies. Those students made an examination only with
routine procedures and got almost as well as the others 100 students that studied routine procedures
the whole time.
Palmiter (1991) compared the performance in calculus of 120 random engineering students, 60
taught using CAS and 60 taught using traditional methods. The performance of the students using
CAS was better in comparison with the traditional students, in a test of conceptual knowledge and
also in a computational exam. The CAS utilized was Macsyma – the predecessor of Maxima. It was
used to compute limits, sums, derivatives, and integrals; to solve equations and to plot a graph.
1.4.3 Research with Modelling software
Modellus is a modelling software used by “thousands of teachers and students worldwide” (Teodoro,
2002, p. 125) and was recommended to teach mathematics, among other places, in the book
Teaching Mathematics using ICT (Oldknow, Taylor, & Tetlow, 2010) and in an article of NCTM’s
journal The mathematics Teacher:

61
Modellus is an excellent tool for integrating mathematical models with applications in
other fields. It will be as useful to science teachers as to those in mathematics, and I
recommend it especially for teachers collaborating with colleagues in science. (Dickey,
1998, p. 529)
According to Teodoro (2002) the trends of education are giving emphasis to the necessity of
including information technologies such as the Internet and quality educational software like
Modellus.
Becerra (2005) studied a class of 41 students, of the 10th grade, split into a control and an
experimental group. Both had a reading, a lab activity and had to solve a set of thermodynamic
problems. Moreover the experimental group worked in pairs and used Modellus to model the
problem. The results of the experimental group were better. According to the author, to make
Modellus model the event, they have to take it to mathematical language, they control the variables,
and they effectively understand the real event. With Modellus they visualized thermodynamic
processes, related different representations of it and interpreted it. Modellus allows to make
meaningful connections between concepts and its applications.
Araujo, Veit e Moreira (2006) investigated the performance of undergraduate students learning
Kinematics, a part of Physics course, using Modellus in complementary learning activities. The
complementary learning activities were of two kinds: exploratory activities where students use
Modellus models built by the teachers to observe and analyse their essential features and try to
understand the mathematics behind the model; and expressive activities where students build the
whole model, creating ways of representing and testing the situation, from its mathematical structure
to the evaluation of the final results. They concluded that there is a statistically significant
improvement in the performance of the experimental group when compared to the control group,
submitted only to a traditional approach. Moreover, the results suggest that the application of
modelling activities exerts a positive influence on the individual’s predisposition to learn physics.
This occurs when students perceive the relevance of some mathematical relations and concepts during
the interaction with the conceptual models. Subjects which previously seemed to be very abstract for
them turned out to be familiar and more concrete.
Neves, Silva and Teodoro (2009) reported the implementation of a new course component
composed by innovative workshop activities based on computational modelling in the general physics
course taken by undergraduate engineering students. Modellus was chosen because it allows the

62
creation of animations with interactive objects which have their mathematical properties defined in
the model and to complement them with multiple tables and graphs. An essential advantage of the
modelling process with Modellus was to be able to correct the models and at the same time visualise
the effect of the change in the animation. Modellus was also of special relevance in helping students
to realise that many different, everyday life physical situations can be explained using the same
simple mathematical model.
Teodoro (2002) used two case studies, one with secondary school students and another with first
year undergraduate students, to see if students can create “models and animations with Modellus
without a lot of specific instruction and training given by a teacher, but only with support from
written materials and, or, short classroom introductions where physics, modelling and the specific
functionalities of the software are approached in an integrated way”. The conclusion of the studies
was that students find Modellus easy to use and that they can use it to “create, explore models, and
solve problems”.
Another conclusion of the studies was that Modellus can be a “cognitive artefact” for students
(Plano, 2004). It was designed “to support student’s reasoning, allowing them to work concretely and
visually with abstract mathematical objects, provide ways of making multiple representations,
confront data and models, and face thinking and implications of what they are thinking”. The
conclusion was that it was a “cognitive artefact” for the students that participated in that study,
however there is not warranty that it would be for all students. Most students report that “Modellus
helped them reach all or some of these goals”. Most reported how useful it was to visualize physical
ideas and models, reducing the gap between abstract models and concrete phenomena.
Ochoa (2012) studied how does develop the process of understanding of the rate of change as
variational interpretation of the derivative, using a case study with four pre-calculus students.
The results of this study showed that one of the factors involved in understanding mathematics is the
interaction with some media. In this case, through interaction with the software GeoGebra and
Modellus the students showed progress in their mathematical understanding.
1.4.4 Research with Spreadsheets
According to Frith, Jaftha and Prince (2002) the Excel environment facilitates the understanding and
representation of functions in four different ways: with a formula, a table of values, graphically and
verbally- the “rule of four” of the Calculus Consortium (see 2.2.4). More, he states that “there is a

63
great deal of experience of and knowledge about using Spreadsheets to enhance learning in
mathematics”.
Liang and Martin (2008) used Excel to teach calculus to business students since “function
graphing or plotting is the easiest way to understand the theoretical properties of a mathematical
function”. Many computer programs provide powerful graphing or plotting options but they choose
Excel since it seems to be the easiest and the most widely available one. The results of this
investigation are that the hands-on approach of doing Excel problems during the class improves the
student’s ability to stay focused; the use of a visual approach through Excel graphing and other
procedures “seems to be a more appropriate learning vehicle for our students”, they also found that
students appreciated using Excel and feel that have learned more in the course.
Erfle (2000) also chose Excel to teach Managerial Economics since “it is most appropriately
taught using the same toolkit that business managers rely on”. He focused on constrained
optimization and econometric estimation and affirms that there are better econometric software
packages on the market “but none of these packages are widely available. By contrast, Excel is
ubiquitous.”
Haspekian (2005) studied the use of spreadsheet to teach a seventh grade mathematics course in
France and found that: “In spite of an apparent simplicity of use, the tool generates some complexity:
new objects are created, usual objects are modified and new action modalities are available. (...)
spreadsheets intermingle and interfere with the concepts of variable, unknown, formula, equation...”
A natural question arrived: “Do these interferences have a positive, negative or negligible influence
on the expected conceptualisations?”
This question was explored with two classes on a case study. One class with 24 studious students
from middle and upper classes with no difficulties on mathematics and that already had an
introduction to spreadsheets, in their classroom there were a computer at the teacher desk with a
video-projector. The other class, on the other hand, had 28 problematic students, many of them
excluded from other schools, with very difficult behaviour, two thirds of them had difficulties in
mathematics and they had never been in contact with spreadsheets, not even with computers at
school; their classroom had no computer at teacher desk nor a video-projector. Both classes took the
same amount of time and with similar success in the activities that involved manipulation of the
spreadsheet, but the activities that were based on previous mathematics knowledge were solved faster
and with more success by the students of the class with the best students. It was interpreted that the

64
use of spreadsheet to teach mathematics does not lead to the traditional approach but encourages a
different way of thinking. However, a weakness of the study was the fact that one of the classes had a
teacher without expertise in the use of spreadsheets.
1.4.5 Research with Learning Management Systems
Aydin and Tirkes (2010) compared four open source LMS: Moodle, ATutor, Dokeos and Olat and
concluded that “Moodle appears to present a clear advantage practically in all the [17] features
compared.”
Al-Ajlan and Zedan (2008) compared ten LMS: Desire2Learn (8.1); KEWL; ANGEL Learning
Management Suite (7.1); eCollege; The Blackboard Learning System (V.7); Moodle (1.8); Claroline
(1.6); Dokeos (2.1.1); OLAT; and Sakai (2.3.1). The comparison based on Learner Tools gave the
best scores to Moodle, Desire2Learn, ANGEL Learning Management Suite, and Sakai with 15 out of
16 features or capabilities. The comparison based on Support Tools showed that all products have all
features and capabilities except eCollege, Dokeos and The Blackboard Learning System. The
comparison based on Technical Specifications Tools showed the best products are Moodle, Sakai and
OLAT, which have missed only 1 out of 8 Technical Specifications Tools. The final result of the
comparison among the ten LMS products was that the best products are Moodle and Sakai, which
have missed just 2 out of 40 features, and the second products are Desire2Learn and ANGEL
Learning Management Suite equally, which have missed 3 out of 40 features.
Machado and Tao (2007) compared user experience between two LMS: the “leading proprietary
solution, Blackboard” and “the leading open source solution, Moodle” using online surveys on a
control group and two study groups. The LMS were used as adjuncts to traditional face-to-face
delivery modality. Moodle “was the preferred choice of the users.”
Bremer and Bryant (2005) made a report that documents the reflections of the instructor using
Moodle to teach and the conclusions of a survey of students involved in a trial use of Moodle. The
conclusion of the instructor was: “Moodle has some interesting features. The fact that constructivist
thinking is designed into the tool, rather than as an afterthought, is a good thing”. The summary of the
answers to the question: “Which do you prefer as an overall tool for learning?” was that 8 students
prefer Moodle, 2 prefer Blackboard and 10 did not answered.

65
Corish (2005) describes the migration of New Zealand community of LMS’s users from
Blackboard and WebCT to Moodle as well as his own change from a septic against Moodle to an
enthusiastic defender. He criticizes Moodle’s documentation and online help. However, he says that
“Moodle functionality meets or exceeds the functionality of Blackboard”; “appreciates the way that
Moodle encourages instructors to organize materials sequentially; and the tools that Moodle offers to
instructors and students to encourage regular student participation in course activities” (making jus to
the claim that Moodle was developed from the ground up with the principles of social constructivism
in mind). The writer “whole heartedly recommends the adoption of Moodle”.
Pinheiro (2005) studied 97 institutions of higher education in Portugal, 19 of them said to use a
LMS but it was only possible to find it in 11. Among the 34 institutions that said that they wanted to
implement it, 47% said they would do it in two years. The free LMS in use were Moodle, Pedago,
Teleduc, the purchased software were Luvit and Teleformar and one was developed in the institution:
E-studo.
1.4.6 Research with Dynamic Geometry Software
Christou and al. (2004) made an experiment using three primary school teachers that volunteered
to get a solution of a mathematical problem using Geometer’s Sketchpad. Their procedures and
thoughts were analysed and may illustrate how to move from empirical exploration of a problem into
a proof of it. The “interplay between action (constructions and measurements) and dependent
properties provided students the motive and the context to explain their conjectures and reached proof
through reasoning”. The researcher found that the dragging facilities were fundamental to reach the
solution.
1.4.7 Research with applets
Banchoff (2005) created Java applets to multivariable calculus and evaluated it. He made a
questionnaire in three semesters to 99 students. When asked if applets were useful, 94% of students
said “yes”; 3% did not answer and 3% answered “no”.
According to Kamthan (2008) Java Applets, with its interactivity, allow “leaning by doing” and it
enables a deeper understanding of concepts and makes students participate more in class. They may
motivate more students. They are useful when are manipulated by students and also when are used by
the teacher to explain a concept to class.

66
Pierce and Atkinson (2003) report the result of an exercise where the students had to write about
the graph of a function and its gradient and used an applet in order to strengthen and clarify their
ideas about derivatives. This exercise was conducted by 19 students and the responses were compared
with the responses of three mathematicians.With this applet was assessed the capacity of students to
apply the concept of derivative in new approaches, taking students into higher level thoughts.

67
This chapter shows research connected with mathematics teaching and learning. Since introductory
Calculus is the focus of this dissertation this chapter gives special attention to it.
Institutional Mathematics Trends around the World 2.1
The focus of this section is the concerns and new trends on mathematics of significant institutions in
our global world.
It begins by describing the Calculus Reform that was a strong movement in the USA towards a
complete change in the way introductory Calculus was taught. It promoted a total reform of Calculus
with changes in curriculum and pedagogy.
Concerns about mathematics effective understanding of relevant institutions lead to two
international studies and their recommendations that will be presented in this section. PISA is an
OECD study about the level of mathematics literacy of 15 years old students. TIMSS is an
international study of pre-college calculus students. The definition of the subjects of those two studies
2 Research Connected with
Mathematics Teaching and Learning,
with a Particular Emphasis on
Introductory Calculus

68
as well as the way that those subjects are addressed is of huge importance since it is a reflex of the
countries’ interests.
Institutions of mathematics teachers and researchers suggest principles to achieve effective
understanding of mathematics by the students.
This internationalization has a natural impact in educational policies of many countries around the
world, contributing to a globalization of standards, which has many natural advantages but may have
the perverted effect of harm world diversity.
2.1.1 Calculus Reform Movement
Mathematics community became worried and started to think that were needed to change
mathematics teaching and mathematics curriculum, due to high failure rates and little effective
understanding of college mathematics and also due to the small number of students subscribing to
STEM (Science, Technology, Engineering and Mathematics) graduations to be far away from
mathematics. A conference, in 1986, marked the beginning of Calculus Reform Movement. The main
themes of the conference were that Calculus courses should include fewer points and students should
learn by active engagement with the subject (MAA, 1986).
The National Science Foundation (NSF) of the USA has supported 127 projects of calculus
reform. The first results of a study performed by NSF to synthesize the impact of the calculus reform
are: the most usual/important objectives of the projects were computer use/ laboratory experience,
applications and conceptual understanding; the pedagogical techniques most cited were technical
writing, discovery learning, use of multiple representations of a concept, and cooperative learning.
Most of immediate evaluations show that:
Students in reform courses had better conceptual understanding, higher retention rates,
higher confidence levels, and greater levels of continued involvement in mathematics
than those in traditional courses; however, scores on common traditional exams yielded
mixed results, making it unclear whether there was any significant loss of traditional
skills in reform students. (Ganter, 1999, p. 3)
In the same study, Ganter (1999), arrived, among others, to the conclusions that: the students with
no previous experience in calculus accept better reform methods than the others; the reform led to
many discussions among faculty about the way in which calculus is taught; the attitudes of students
69
and faculty seem to be negative in the first year of implementation but improved later when revisions
were made in consequence of feedback (this could be one reason to the high retention rates in
immediate evaluation); most faculty believe that traditional teaching of calculus was ineffective
however there is much discussion about whether this reform is arriving to the solution or not.
2.1.2 PISA
The Programme for International Student Assessment (PISA) is an assessment made by Organization
for Economic Co-Operation and Development (OECD) in key competencies in reading, mathematics
and science to 15-years-old students. It happens every three years since 2000, each assessment has a
focus in one theme but makes a brief assessment of other two themes. The participants belong to 40 -
65 countries from the OECD and partner countries.
The mathematical studies, in PISA, measure the students’ Mathematical literacy, defined as:
An individual’s capacity to identify and understand the role that mathematics plays in
the world, to make well-founded judgments and to use and engage with mathematics in
ways that meet the needs of that individual’s life as a constructive, concerned and
reflective citizen. (OECD, 2009, p. 84)
PISA does not aim to test students’ ability to perform mathematical operations, but rather assess
students’ skills on recognizing, formulating and tackling “mathematical problems in the context of
real life” (OECD, 2009). The skills used to face those problems are:
Reproduction skills [which] refer to the reproduction of knowledge, such as
recognition of familiar mathematical processes and problem types and carrying out
routine operations. These are needed for the simplest of the tasks set for students in
PISA.
Connection skills [which] require students to move beyond routine problems to make
interpretations and links in different situations, but still in relatively familiar contexts.
These tend to be used in problems of medium difficulty.
Reflection skills [which] require insight and reflection on the part of students, as well
as creativity in identifying mathematical elements in a problem and in making
connections. These problems are often complex, and tend to be the most difficult in
PISA. (OECD, 2003, p. 4)
The areas of mathematics measured by PISA were:

70
Space and shape, involving spatial and geometric phenomena and the properties of
objects;
Change and relationships, involving relationships between variables, and an
understanding of the ways in which they are represented, including equations;
Quantity, involving numeric phenomena as well as quantitative relationships and
patterns; and
Uncertainty, involving probabilistic and statistical phenomena. (OECD, 2003, p. 4)
In 2003, PISA ran in 41countries with more than 275 000 students. The test was divided into six
levels, where students in Level 1 only perform low complex tasks and in Level 6 students perform the
most complex tasks. The results of the test for all students show that only 4 per cent can perform the
highly complex tasks. About a third of OECD students can perform relatively difficult tasks at Levels
4, 5 or 6. About three-quarters of OECD students can perform at least mathematical tasks at Level 2.
However, over a quarter of students are not proficient beyond Level 1 in Italy and Portugal, over a
third in Greece and over half in Mexico and Turkey. A number of partner countries also have high
numbers at Level 1 or below. Eleven per cent of students in OECD countries are not capable even of
Level1 tasks. These students may still be able to perform basic mathematical operations, but were
unable to use mathematical skills in a given situation, as required by the easiest PISA tasks. In some
countries, over 20 per cent are in this category (OECD, 2003).
Comparing mathematics performance in PISA 2003 (the one that had a focus on mathematics)
with PISA 2000 and 2006 only a few countries had a statistically significant change in performance.
Along with the mathematics test they made a questionnaire to schools and another to students. The
students’ questionnaire measured “motivation”, “self-related beliefs” in mathematics learning,
“emotional factors” and “learning strategies”. The OECD concluded that:
Intrinsic interest in mathematics is far lower, across countries, than in reading.
The great majority of students believe that studying mathematics will help them in the
future.
All education systems aspire not just to transmit subject knowledge but also to prepare
students well for life in general. The views of the majority of 15-year-olds suggest that
education systems are quite successful in this respect.

71
Students’ concept of their mathematics abilities is both an important outcome of
education and a powerful predictor of student success. A large proportion of 15–year-
olds are not confident of their own abilities in mathematics.
Anxiety in relation to mathematics is widespread.
Interest in and enjoyment of mathematics is closely associated with performance in all
OECD countries.
Students who believe in their abilities and efficacy, and who are not anxious about
mathematics, are particularly likely to do well in it.
Although PISA 2003 does not show strong links between students’ self-reports on the
learning strategies they use and performance, the results do suggest that students are
most likely to initiate high quality learning, using various strategies, if they are well
motivated, not anxious about their learning and believe in their own capacities.
From the perspective of teaching this implies that effective ways of learning –
including goal setting, strategy selection and the control and evaluation of the learning
process – can and should be fostered by the educational setting and by teachers. (2003,
p. 13)
Some examples of PISA exercises:
Exercise A:
The picture shows the footprints of a man walking. The pacelength is the distance between the
rear of two consecutive footprints.
For men, the formula,
, gives an approximate relationship between and where,
number of steps per minute, and pacelength in meters.
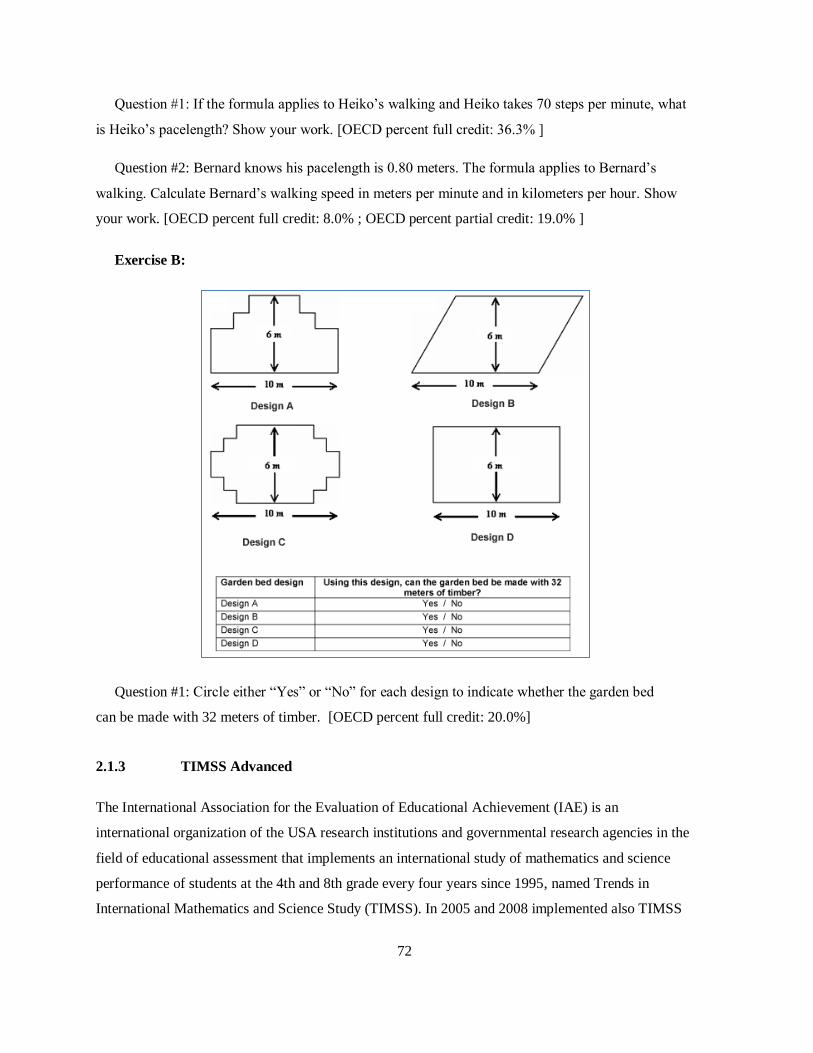
72
Question #1: If the formula applies to Heiko’s walking and Heiko takes 70 steps per minute, what
is Heiko’s pacelength? Show your work. [OECD percent full credit: 36.3% ]
Question #2: Bernard knows his pacelength is 0.80 meters. The formula applies to Bernard’s
walking. Calculate Bernard’s walking speed in meters per minute and in kilometers per hour. Show
your work. [OECD percent full credit: 8.0% ; OECD percent partial credit: 19.0% ]
Exercise B:
Question #1: Circle either “Yes” or “No” for each design to indicate whether the garden bed
can be made with 32 meters of timber. [OECD percent full credit: 20.0%]
2.1.3 TIMSS Advanced
The International Association for the Evaluation of Educational Achievement (IAE) is an
international organization of the USA research institutions and governmental research agencies in the
field of educational assessment that implements an international study of mathematics and science
performance of students at the 4th and 8th grade every four years since 1995, named Trends in
International Mathematics and Science Study (TIMSS). In 2005 and 2008 implemented also TIMSS

73
Advanced that studies the achievement in Advanced Mathematics in the final year of secondary
school. Both tests include items on algebra, calculus and geometry. The cognitive domains tested
were: knowing, applying, and reasoning. It also collected background information of students,
teachers and schools (Mullis, Martin, Robitaille, & Foy, 2009).
In TIMSS Advanced 2008 participated more than 20 000 students of 10 countries. The population
of this study were students in the final year of secondary schooling who have taken courses in
advanced mathematics. Results showed that, compared with the international scale average, three
countries had higher achievement, six had a lower achievement and one had achievement close to the
scale average. Portugal didn’t participate.
In TIMSS Advanced 2008 no immediate relation was found between performance and years of
schooling, or students’ age or Human Development Index (HDI) of the country:
The three top-performing countries—the Russian Federation, the Netherlands, and
Lebanon—are not among those with the most years of schooling or the oldest students.
However, the Philippines [the lowest performer] did have the youngest students and
was one of the two countries with the fewest years of schooling.
There is little consistency across the 10 countries in the relationship between a
country’s HDI value and average achievement in advanced mathematics for the
specialized groups of students that participated in TIMSS Advanced 2008. (Mullis,
Martin, Robitaille, & Foy, 2009, pp. 69,75)
The definitions of the cognitive domains analysed were:
Knowing refers to the student’s knowledge base of mathematical facts, concepts, tools, and
procedures.
Applying focuses on the student’s ability to apply knowledge and conceptual understanding
in a problem situation.
Reasoning goes beyond the solution of routine problems to encompass unfamiliar situations,
complex contexts, and multi-step problems.
The questions of TIMSS assessment are more traditional than the PISA ones. Many of them are
based on memorization, may be answered using procedures, aren’t in context of real world problems,
and may be answered without conceptual understanding of the subject.

74
Globally, geometry was the easiest subject to those students, calculus was the hardest and algebra
was in the middle. About cognitive domains, knowing was the easiest, applying was the hardest and
reasoning was in the middle.
The difference of average achievement in 1995 and 2008 in three of the four countries declined
significantly between the two assessments in advanced mathematics.
Next, some questions used in TIMSS 2008 will be presented. Students may use calculator on this
test.
Question A: The derivative with respect to of
√ is
a) √
b)
√
c)
⁄
d)
⁄
e) √
This question is on Calculus and the answers were: 44% correct, 49% wrong and 7% with no
response.
Question B: The function , is defined in the following graph

75
For what value(s) of in the interval is the function NOT continuous?
This question is on Functions and the answers were: 46% correct, 34% wrong and 20% with no
response.
Question C: How many solutions does the equation have in the interval to
?
a) 0
b) 2
c) 4
d) 8
This question is on Geometry and the answers were: 46% correct, 46% wrong and 8% with no
response.
2.1.4 NCTM Principles
The National Council of Teachers of Mathematics (NCTM) of the USA proposed, in 2000, six
principles for school mathematics to reach high-quality mathematics education:
Equity: Excellence in mathematics education requires equity—high expectations and
strong support for all students.
Curriculum: A curriculum is more than a collection of activities: it must be coherent,
focused on important mathematics, and well-articulated across the grades.
Teaching: Effective mathematics teaching requires understanding what students know
and need to learn and then challenging and supporting them to learn it well.
Learning: Students must learn mathematics with understanding, actively building new
knowledge from experience and prior knowledge.
Assessment: Assessment should support the learning of important mathematics and
furnish useful information to both teachers and students.
Technology: Technology is essential in teaching and learning mathematics; it influences
the mathematics that is taught and enhances students’ learning. (NCTM, 2000, p. 12)
2.1.5 MAA Trends
The New Calculus Conference promoted by the Mathematical Association of America (MAA)
summarized that new calculus courses should:

76
cover fewer topics and give more emphasis on fundamental concepts;
place less emphasis on complex manipulative skills and emphasize
modelling the real world;
promote experimentation and conjecturing;
teach students to think and reason mathematically, develop problem-
solving skills;
make use of calculators and computers. (Gordon, Hughes-Hallett,
Ostebee, & Usiskin, 1994, p. 56)
2.1.6 ATM Principles
The Association of Teachers of Mathematics (ATM) of the United Kingdom has the following four
principles that appear in the front of every issue of its magazine: Mathematics Teaching.
1. The ability to cooperate mathematically is an aspect of human functioning which is as
universal as language itself. Attention needs constantly to be drawn to this fact. Any
possibility of intimidating with mathematical expertise is to be avoided.
2. The power to learn rests with the learner. Teaching has a subordinate role. The teacher has a
duty to seek out ways to engage the power of the learner.
3. It is important to examine critically approaches to teaching and to explore new possibilities,
whether deriving from research, from technological developments or from the imaginative
and insightful ideas of others.
4. Teaching and learning are cooperative activities. Encouraging a questioning approach and
giving due attention to the ideas of others are attitudes to be encouraged. Influence is best
sought by building networks of contacts in professional circles. (Laurence, 2010)
Calculus Teaching and Learning 2.2
In this section some projects and research developed on Calculus teaching and learning will be
presented. Most of the projects that were born in the USA had influence of Calculus Reform.

77
2.2.1 Realistic Mathematics Education
According to Gravemeijer and Doorman (1999), usually the applications of Calculus appear only
after the theory and practice as something that do not belong to the natural teaching. Realistic
Mathematics Education (RME) is a Dutch approach to teach mathematics where the applications are
the basis of learning, where the problems are presented in its context, the problems are experientially
real to the students.
It starts with the part named Sum&Difference. There students investigate properties of series and
relations between series. The second part is named Distance&Speed and students use time, distance
and velocity as models of situations that are experientially real for them. The first problem posed is
how to visualize the motion of an object that moves with varying speed. Next is investigated the
relation between the area of the graphic and the total distance covered over a longer period of time.
Finally students determine velocities from distance-time graphics and formulas. In this way students
seek for a general way to solve those problems with arbitrary functions… they seek for differential
and integral calculus. In this approach the formal mathematics comes from the activity done by the
student.
2.2.2 Computer-assisted instruction in China
According to Lang (1999), in China, in the last 20 years of the past century, Calculus changed in
curriculum and in way of teaching. Computer assisted instruction was included in Calculus books
used in universities by the State Education Commission of China. It was also chosen mathematical
experiments that allow a deeper understanding of concepts.
The author taught a calculus class that includes a 2 hours per week laboratory class to foster the
scientific exploratory spirit of students. Laboratory courses focused on two aspects: 'verification' and
'exploration'. According to the author (by its own experience) this approach makes calculus more
enjoyable and more meaningful.

78
2.2.3 Integrated Math, Physics and Undergraduate Laboratory Science, English and
Engineering
Pendergrass, Kowalczyk, and Dowd (1999) describe Integrated Math, Physics and Undergraduate
Laboratory Science, English and Engineering (IMPULSE) a single course including the curriculum
of Mathematics, Physics, Chemistry, English and Enginery.
In this course is used teamwork with teachers and students, using methods of active and
cooperative learning in a classroom specially oriented to technology. The assessment is made with
special attention to a correct evaluation of students. This course have reduced costs because it is more
efficient in the use of instruction times.
IMPULSE calculus students mixed lecture and group computer exercises in a computer-equipped
studio. The comparison with control groups was favourable for the IMPULSE calculus students in
terms of grades and students dropout. The results of the other courses of IMPULSE were also
positive.
A similar approach was implemented in Arizona State University (Roedel et al., 1995).
2.2.4 Calculus Consortium based at Harvard University
One project that emerged from the Calculus Reform was the Calculus Consortium based at Harvard
University. This project reflects the way of thinking of many people, geographically distant, from
completely different institutions, working with diverse realities, with different personal experiences.
It involves over 22 people, not only mathematics teachers at the university (also top researchers in
mathematics) but also mathematics teachers at secondary schools, engineers, physics, chemists,
biologists, and economists from all the USA and over.
Calculus teaching was completely rethought from curriculum to pedagogic practices. The result is a
group of Calculus books that are translated into many languages (including Brazilian Portuguese) and
are used around the world: Calculus – Single variable (D. Hughes-Hallett et al., 2005); Calculus –
Multivariable (McCallum et al., 2005); Applied Calculus (Hughes-Hallett et al., 2006); and
ConcepTests - Calculus (Hughes-Hallett et al., 2003).
Mathematicians, physicists, engineers, biologists, chemists and economists discussed what to
include in the curriculum. Some topics were included, others were discarded. According to them,

79
should be given emphasis to the power of calculus not the special cases in which it fails. It is not
important to have total generality neither to show “pathological examples” (Gleason & Hughes-
Hallett, 1992).
These books follow some principles:
The focus is on a few topics – it is preferable the depth than the breath
of coverage.
The rule of four – whenever it makes sense, the topics are presented in
four perspectives: algebraic, graphic, numeric and verbal.
Exercises are considered of central importance because students learn
more when they are more active.
The biggest part of exercises cannot be made following a procedure -
it, forces students to think.
There are many practical problems which are open-ended real world
problems.
When introducing a topic, formal definitions and procedures evolve
from practical problems.
The main concepts are explained in plain English to encourage
students to read it in detail (D. Hughes-Hallett et al., 2005).
Hughes-Hallett in 2000 defends that many aspects of calculus reform were already so much
incorporated in practice that were considered as mainstream. Some examples are the multiple
representations of concepts, the emphasis on conceptual understanding and the use of technology.
2.2.5 Calculus as a Laboratory Course
Project CALC: Calculus As a Laboratory Course was another project supported by NSF to Calculus
Reform. The key features of the approach are ”real-world problems, hands-on activities, discovery
learning, writing and revision of writing, teamwork, intelligent use of available tools, and high
expectations of students”. It is a three-semester renewed calculus course developed at Duke
University in North Carolina, based on a computer laboratory “were the students, working in pairs,
explore real-world problems with real data, conjecture and test their conjectures, discuss their work
with each other, and write up their results and conclusions on a technical word processor. This

80
laboratory experience drives the rest of the course. It shapes the contents and the approach of the text
and the format of the classroom activities”.
The goals of this course are that every student should:
be able to use mathematics to structure their understanding of and
investigate questions in the world around them;
be able to use calculus to formulate problems, to solve problems, and
to communicate the solutions of problems to others;
be able to use technology as an integral part of the problem-solving
process;
learn to work and learn cooperatively (Moore & Smith, 1992).
In 1992 ten colleges and universities used this approach. The course materials are available in
http://www.math.duke.edu/education/proj_calc/index.html and produced the book named Calculus:
Modelling and Application (Smith & Moore, 1996). In 1995 the authors joined to a group to create
interactive learning materials for mathematics and applications available at
http://www.math.duke.edu/education/ccp/index.html .
2.2.6 CALCULUS & Mathematica®
CALCULUS&Mathematica® is an interactive course of calculus created by three university teachers:
Jerry Uhl, Horacio Porta and Bill Davis. The courseware consists of four types of Mathematica® files
(called notebooks):
Basics, which present fundamental ideas;
Tutorials, samples of the basics;
Give It a Try, actual student work; and
Literacy Sheets, questions that the student answers away from the computer.
Four textbooks accompany the software: CALCULUS&Mathematica® (Davis, Porta,
& Uhl, 1994). The courseware always puts the mathematics in the context of
measurement, and puts the programming in the context of mathematics. We put new
ideas into students' heads by having them interact with Mathematica® graphics, and by
having them explain what the graphics mean. Thus, students get a vivid image of
things. (Uhl, 1995, p. 67)
It presents a complete rethinking of:

81
The mathematics of calculus;
Calculus as a first course in scientific measurement;
Mathematics as an empirical science;
How to present calculus ideas visually;
What students do in calculus;
What motivates students to do calculus;
How to motivate students to write about calculus;
How technology should be used in mathematics education.
To make calculations with Mathematica®
allows to get more time to explore deeper the concepts.
With this course students use professional tools, work with real world problems, learn mathematics,
programming and get practice to write.
According to Uhl (1995), CALCULUS&Mathematica® is “used on campuses across America and
abroad”. This method of teaching provides equal possibilities for students from rural isolated places
and for inner-city, since students only meet at most once a week. And this time is not used to lecture
but to get classroom discussion.
2.2.7 Calculus in Context
Calculus in Context is, according to Callahan et al. (1995), a project to develop a new curriculum
to Calculus, funded by the National Science Foundation (of the USA). This project created a
Calculus book, software and a teacher handbook. The curriculum main premise is that differential
equations are central in Calculus. The use of software allows to solve numerically the differential
equations and then be utilized by students beginning calculus.
Next the goals aimed by the project developers in terms of curriculum, and attitudes of students
are described.
Curricular goals: Develop calculus in the context of scientific and mathematical questions.
Treat systems of differential equations as fundamental objects of study.
Construct and analyse mathematical models.
Use the method of successive approximations to define and solve problems.
Develop geometric visualization with hand-drawn and computer graphics.
Give numerical methods a more central role.

82
Functional goals:
Encourage collaborative work.
Enable students to use calculus as a language and a tool.
Make students comfortable tackling large, messy, ill-defined problems.
Foster an experimental attitude towards mathematics.
Help students appreciate the value of approximate solutions.
Teach students that understanding grows out of working on problems.
This new approach is now possible due to technology:
Differential equations can now be solved numerically, so they can take their rightful place in
the introductory calculus course.
The ability to handle data and perform many computations makes exploring messy, real-
world problems possible.
Since we can now deal with credible models, the role of modelling becomes much more
central to the subject. (Callahan et al., 1995)
2.2.8 Visual Calculus
According to Husch (2002), Visual Calculus2 is a project that aimed creating and letting available on
a web site several materials that use technology to teach calculus. This site includes, for each theme,
tutorials, quizzes, drill problems and interactive modules (LiveMath, Java, and Javascript) which can
be used by either students or faculty and includes detailed instructions for TI-85 and TI-86 graphing
calculators.
The interactive modules are of particular interest since they have animations that force students to
interact with the computer and get information at their pace.
2.2.9 Evaluation of Calculus Reform classes by gender
Joiner, Malone and Haimes (2002) studied if calculus reform was less discriminatory for students
of different genders, personalities, beliefs, mathematical skills and attitudes to computers. Classes
were studied qualitatively and quantitatively. The conclusions were that students were more satisfied
2 http://archives.math.utk.edu/visual.calculus/index.html

83
with computer classes than the non-computer classes of the calculus reform. Females perform
substantially better in reform classes than in lecture classes (perhaps because of the bigger use of
interaction in reform classes).
Undergraduate Mathematics Teaching and Learning 2.3
This section presents research on undergraduate mathematics (not necessarily calculus) teaching and
learning.
2.3.1 Active Learning strategies in Toronto
Most mathematicians agree that the best way to learn mathematics is by actively doing
mathematics; by discussing it with others; and by synthesizing major ideas. (Rosenthal,
1995, p. 223)
Passivity and isolation of students are natural consequences of the lecture format that is usual to
teach advanced mathematics, according to Rosenthal (1995). In the University of Toronto, where he
is a teacher, to make students participate and interact more, they organized students into groups of
three to five and gave to them problems to solve in one hour. The instructor was not lecturing, was
only available for questions. The results were highly positive in popularity and performance.
Another unusual strategy was that students must write to short essays. Those essays may be
around any part of the subject; they could be a well explained summary, or an illustration, or an
application to other subject, or a computer program to verify a theoretical result, etc. In the end, the
second essay was reviewed by a peer and reformulated. The students opinion about this was positive
and the author feels that is deeps the understanding of the subject by the students.
The message of Rosenthal (1995, p. 227) is that:
Our experience with co-operative learning techniques has been overwhelmingly
positive. (…) they are popular and productive. (…) Furthermore, they can be used in
virtually any problem-solving type of course, at virtually any university level.
84
2.3.2 Mathematics, software and curricula – Open University of Catalonia
Mathematics courses have been fully integrated with educational technology like mathematical
software and Java applets, in the Open University of Catalonia- an online University. That software
was used to perform real-life calculations that illustrate applications of mathematics to computer
science problems and as interactive tools that enhance the understanding of concepts.
Another innovation introduced was a complete rethought of the mathematical curriculum to
change the traditional curriculum to a new curriculum adjusted to the mathematics they will need in
the following subjects and into their future professional needs.
According to Juan, Huertas, Steegmann, Corcoles, and Serrat (2008) statistics show that students
perception of mathematical courses changed in a positive sense in terms of usefulness of the course,
satisfaction on learning materials, interest of mathematical software and global evaluation.
2.3.3 WebALT – Using ICT in mathematics education
In the paper of Olga Capprotti from the University of Helsinki, Mika Seppala from the University of
Helsinki and Florida State University, and Sebastian Xambó from the Technical University of
Catalonia (2007) is discussed how instruction will benefit from technology in the near future and
some solutions provided by the WebALT eContent Project.
According to them, the main challenges in mathematics education are to keep students focused in
subject matter, to motivate them to work independently and to fight the high dropout rate. And the
Information and Communication Technology (ICT) has the potential to revolutionize teaching habits,
namely administering online assessment and testing by automated software tools. The “difficulty
regarding expressing mathematical formulae in the virtual setting is probably the main obstacle
slowing down the spread of e-education in the sciences”.
That paper shows two online mathematics courses, taught as synchronous lecturing. In Helsinki
was taught a basic Calculus course and in Catalonia was taught a remedial geometry course. Students
and teacher share the view of a browser window, a chat window and a whiteboard where they see and
annotate slides. The teacher teaches using, for example, slides and, at the same time students ask
questions. The lesson may be recorded for later review. The course of Helsinki, implemented in 2004
was successful but in 2006 only 25 of the 70 students that were present in the first day took actively
part in the course. The other course does not refer evaluation.

85
WebALT courses may also be used in presence teaching. The subject is broken into many
modules, each module is about only one topic. It has an explanation of the topic of at most 10
minutes. Teachers may discuss the topic with students for some more minutes and next help students
to solve problems around that topic.
Those explanations are recorded and are available for students to review it whenever they want,
since it was perceived as very important for students. And are not only explanations by lecturing, but
rather discussions where many people discuss the topic under the guidance of the main presenter. Are
asked questions and are expected that students assisting to it give an answer in an interactive way.
Two types of problems of the module are provided: some in a traditional way, to be printed out and
solved; others are delivered by the Web ALT System and automatically graded.
2.3.4 Teaching Mathematics to Civil Engineering
Due to the temporary removal of the requirement for A-level mathematics as an entry qualification to
civil engineering degrees in the United Kingdom there was a large debate around the current roles of
mathematics in the undergraduate engineering education with a particular focus on civil engineering.
Kent and Noss (2003) made a study to understand that role and to identify some visions of future
directions for the teaching of mathematics. They used interviews and visits to universities,
professional institutions and civil engineering companies, supported by a literature review and a
questionnaire survey of university civil engineering departments.
Their main results were:
1. They have found agreement from every quarter that undergraduate
engineering students continue to need to know and to learn
mathematics. The fundamental question is what kind of mathematics is
needed and when.
2. The system of mathematical education in engineering formation is ripe
for change-regulatory frameworks, entry routes to the profession, and
post-14 school mathematics provision are all likely to experience
major changes in the near future. Therefore there is a need to consider
the mathematical knowledge that is required, by whom, and in what
form. For example, geometry is a key area of knowledge for civil
engineers that is currently under-taught in schools and universities, and

86
there is reason to consider making geometry more of an organising
theme for mathematics courses than is currently the norm.
3. There are possibilities in the ‘new symbolisms’ that practising
engineers use, through software, to engage with mathematical ideas.
These need to be critically examined in engineering education,
alongside well understood algebraic symbolism.
4. It is time to reconsider pedagogical approaches that can best ‘deliver’
the mathematical needs of students. Mathematics could benefit from
being more ‘pulled’ into the context of design-oriented engineering
teaching, rather than ‘pushed’ into students in the absence of a context.
This entails a shift in approach from teaching mathematical techniques
towards teaching through modelling and problem solving.
5. Carefully-designed IT use can make it possible to use mathematical
ideas before understanding the techniques. In the pre-computational
era, a strong objection to pull-based mathematics was that to use a
mathematical idea properly required a detailed understanding of the
techniques of its application. But times, and technologies, change.
6. There is a need for national leadership to stimulate, and to promote the
spread of, the innovative work in curriculum design and delivery
currently being carried out by enthusiastic individuals and individual
departments. This is a role that the professional institutions (together
with cross-sector engineering organisations such as the Engineering
Technology Board) should be well placed to assume, as campaigners
for the engineering profession and controllers of the accreditation
mechanisms for engineering degrees. (Kent & Noss, 2003)
Undergraduate Teaching and Learning of STEM (Science, 2.4
Technology, Engineering and Mathematics)
According to Ferrini-Mundy and Guçler (2009) in the USA, since 1980’s have grown increasingly
stronger efforts to reform and improve teaching and learning in undergraduate Science, Technology,
Engineering and Mathematics (STEM) subjects. Since then many programs have born in the USA (in

87
National Science Foundation, Mathematical Association of America, and others) to support improved
education for undergraduate STEM students (NSF, 1986). Three kinds of strategies were used for the
improvement of undergraduate STEM learning:
Capacity-building strategies: involve building networks and
communities of individuals all committed to improve learning.
Examples: PKAL, NExT.
Curricular strategies: improve materials and resources available for
teaching, including rethinking traditional contents, introducing
technology, organizing courses around interdisciplinary ideas,
providing authentic research experiences to undergraduates, and
keeping material current and representative of new directions in the
discipline.
Pedagogical strategies: improving the teaching of undergraduate
STEM content by using such innovations as probes or clickers, small
groups or peer-assisted instruction in large lectures, and instructional
assessments such as diagnostic concept inventories and one-minute
essays. (Ferrini-Mundy & Guçler, 2009)
In this section will be addressed some successful examples of those projects and older
recommendations advocated in response to problems that had already been felt in higher education.
2.4.1 Student-Centered Active Learning Environment for Undergraduate Programs
(SCALE-UP)
Student-Centered Active Learning Environment for Undergraduate Programs (SCALE-UP) is a
learning approach started in 1995 by Robert Beichner at North Carolina State University (U.S.A.) in
the learning of Physics. Now, it is spread throughout the USA and extended at many courses
including Calculus.
The primary goal of the SCALE-UP Project is to establish a highly collaborative,
hands-on, computer-rich, interactive learning environment for large, introductory
college courses. (...) The project involves the development of the pedagogy, classroom
environment, and teaching materials that will support this type of learning. (...) In
comparisons to traditional instruction we have seen significantly increased conceptual

88
understanding, improved attitudes, successful problem solving, and higher success
rates, particularly for females and minorities. (Beichner et al., 2007, p. 1)
To facilitate collaboration the classroom is a studio room with round tables and many white
boards. There is a lot of interaction between students, and between students and the instructors.
SCALE-UP classes have strict rules. Students work in groups of three, with a laptop for each group.
The activities are done by each group, not individually, and are mainly hands-on activities, usually
based on measurements or simulations and referring to interesting questions and problems. There are
also some hypotheses-driven labs where students have to write detailed reports.
Figure 42. A SCALE-UP class in NCSU with Robert Beichner teaching. Retrieved from www
http://www.ncsu.edu Copyright [2007] by SCALE-UP. Reprinted with permission.
The fundamental approach of active, collaborative, social learning has been reported in
hundreds of studies.[…] Social interactions between students and with their teachers
appear to be the “active ingredient” that makes the approach work. (Beichner, 2008)
2.4.2 TEAL – an MIT approach based in SCALE-UP
John Belcher uses a teaching format named Technology Enabled Active Learning (TEAL) in
Massachusetts Institute of Technology (MIT) based in SCALE-UP to teach physics, specifically
electricity and magnetism. As in SCALE-UP, the TEAL format incorporated into the classroom a

89
collaborative, active learning approach, enhanced by visualizations, desktop experiments, web-based
assignments, a personal response system, and conceptual questions. TEAL uses collaborative learning
with students working in small carefully structured groups and instructors circulating in the room and
interacting with students. The room is also a studio-room with capacity for 100 students. The
difference is that TEAL has big emphasis in simulations. The course materials have links to more
than 100 simulations which concretize hard abstract concepts like electrostatics, magnetostatics and
Faraday's Law.
The experimental study of Dori and Belcher with pre-post-test and control group, involving more
than 800 students showed that:
The TEAL-studio format has had a significant and strong positive effect on the
learning outcomes of MIT freshmen. The failure rate, a major trigger for the project,
has decreased sixfold while the relative improvement has almost doubled. (2004, p. 5)
2.4.3 Calculus teaching based in SCALE-UP
At Clemson University in 2006 all Calculus I courses, with around 800 students, became to be
taught using SCALE-UP model. Before that, the percentage of drop, fail or withdraw arrived to 44%,
with SCALE-UP it went to nearly 22%. Due to this results SCALE-UP was adopted permanently
(Benson, Moss, Ohland, & Schiff, 2007).
2.4.4 Peer Instruction
Eric Mazur a physicist at Harvard University uses, since 1991, a non-traditional method of teaching
called Peer Instruction (PI). This method modifies the traditional lecture format to include questions
designed to engage students and uncover difficulties with the material.
A class taught with PI is divided into a series of short presentations, each focused on a
central point and followed by a related conceptual question, called a ConcepTest which
probes students’ understanding of the ideas just presented. Students are given one or
two minutes to formulate individual answers and report their answers to the instructor
[this is done using clickers, but may be done in other ways]. Students then discuss their
answers with others sitting around them; the instructor urges students to try to convince
each other of the correctness of their own answer by explaining the underlying
reasoning. During the discussion, which typically lasts two to four minutes, the

90
instructor moves around the room listening. Finally, the instructor calls an end to the
discussion, polls students for their answers again which may have changed based on
the discussion, explains the answer, and moves on to the next topic. Students are not
graded on their answers to the ConcepTests, but do receive a small amount of credit for
participating consistently over the semester. They also have a strong incentive to
participate because the midterm and final exams include a significant number of
ConcepTest-like questions. Students should read the material before class and some
credit is given for answering some questions online before class.(Crouch & Mazur,
2001)
In the first implementation of PI the scores of students at the Force Concept Inventory and the
Mechanics Baseline Test were strongly better and the results on traditional quantitative problems
were also better. Later on was also required to students to make pre-class readings which made
students to be more interested in discussion sections and had a positive reflex in students
understanding.
The study of Lasry, Mazur and Watkins (2008) shows that PI is also a successful method for
students with less background knowledge than Harvard students.
2.4.5 Seven principles for good practice in undergraduate education
Chickering published in 1969 his seven-vector theory of student development where he suggests
seven principles for good practice in undergraduate education:
1. Encourages Contact Between Students and Faculty. Frequent
student-faculty contact in and out of classes is the most important
factor in student motivation and involvement. Faculty concern helps
students get through rough times and keep on working. Knowing a few
faculty members well enhances students’ intellectual commitment and
encourages them to think about their own values and future plans. (…)
2. Develops Reciprocity and Cooperation Among Students. Learning
is enhanced when it is more like a team effort than a solo race. Good
learning, like good work, is collaborative and social, not competitive
and isolated. Working with others often increases involvement in

91
learning. Sharing one’s own ideas and responding to others’ reactions
sharpens thinking and deepens understanding. (…)
3. Encourages Active Learning. Learning is not a spectator sport.
Students do not learn much just by sitting in classes listening to
teachers, memorizing prepackaged assignments, and spitting out
answers. They must talk about what they are learning, write about it,
relate it to past experiences and apply it to their daily lives. They must
make what they learn part of themselves. (…)
4. Gives Prompt Feedback. Knowing what you know and don’t know
focuses learning. Students need appropriate feedback on performance
to benefit from courses. When getting started, students need help in
assessing existing knowledge and competence. In classes, students
need frequent opportunities to perform and receive suggestions for
improvement. At various points during college, and at the end,
students need chances to reflect on what they have learned, what they
still need to know, and how to assess themselves. (…)
5. Emphasizes Time on Task. Time plus energy equals learning. There
is no substitute for time on task. Learning to use one’s time well is
critical for students and professionals alike. Students need help in
learning effective time management. Allocating realistic amounts of
time means effective learning for students and effective teaching for
faculty. How an institution defines time expectations for students,
faculty, administrators, and other professional staff can establish the
basis for high performance for all. (…)
6. Communicates High Expectations. Expect more and you will get
more. High expectations are important for everyone-for the poorly
prepared, for those unwilling to exert themselves, and for the bright
and well motivated. Expecting students to perform well becomes a
self-fulfilling prophecy when teachers and institutions hold high
expectations of themselves and make extra efforts. (…)
7. Respects Diverse Talents and Ways of Learning. There are many
roads to learning. People bring different talents and styles of learning
to college. Brilliant students in the seminar room may be all thumbs in

92
the lab or art studio. Students rich in hands-on experience may not do
so well with theory. Students need the opportunity to show their talents
and learn in ways that work for them. Then they can be pushed to
learning in new ways that do not come so easily. (Chickering &
Gameson, 1987, p. 3)
Mathematics Teaching and Learning 2.5
This section presents research on mathematics teaching and learning from middle school until
college. A special attention is given to tutorials made to teach mathematics.
2.5.1 Carnegie Learning
The Carnegie Learning Math Series (CLMS) have an interactive software named Cognitive Tutor and
text materials and was designed to teach mathematics from middle school until higher education
(http://www.carnegielearning.com/). The Cognitive Tutor guides student through a personalized study
at their own pace. It might be used as complement to lessons or like a way of giving classes in which
students use Cognitive Tutor and address the teacher only for additional clarifications.
Theoretical Basis
According to Grolnick and Ryan (1987) when a student works to succeed and not avoid failure are
more likely to arrive to an higher level. So the Math Tutor gives feedback messages about success
and as rewards by effective learning. The messages also remember that learning leads to brain growth
and that effort is more important than innate capacities to arrive to understanding (Blackwell et al.,
2007). These messages pretend to take students to work more.
Since expectations about performance that reflect stereotypes, for example about race and gender,
may lead to anxiety, reduced mental capacity and low performance(Good & Inzlicht, 2003), the
CLMS has special care with messages to ensure that all are appropriate to every student.
The CLMS classrooms are centred on structured activities conceived to encourage active dialog.
For example, in the “think-pair-share” (Lyman, 1981) students think about an initial approach and the

93
goals of the problem, then pair-up to share the ideas and solve the problem and in the end they share
their results with the whole class.
Since illustrations and other details that are joined to the essential material often have a negative
effect, according to Mayer, Heiser and Lonn (2001), CLMS materials have no such details unless it is
essential to the understanding of the subject.
Based in the work of Sweller and Cooper (1985) CLMS gives worked examples, since it reduces
working memory load and is very efficient to learn alternating between problem solving and viewing
worked examples. Some exercises are to find the correct resolution among some different ones.
Research Results
In an experience, teachers used Cognitive Tutor Algebra I in some classes and the traditional
textbook in the others. The students of the cognitive tutor get higher performance than the others in
standardized tests and in course grades. Those students also got higher confidence on their ability to
learn mathematics and also found more usefulness of mathematics, when compared with their peers
(Morgan & Ritter, 2002).
In studies in Pittsburgh and Milwaukee, Cognitive Tutor students were compared with others on
standardized tests (SAT and Iowa) and in problem solving exams. The Cognitive tutor students
outscored the others by 85% in problem solving exams (Koedinger, Anderson, Hadley, & Mark,
1997).
In ten high schools of Miami district are used Cognitive Tutor for some classes. Those who used
the Cognitive Tutor significantly outscored their peers on the exam (Sarkis, 2004).
Accordng to Plano (2004), a study in Washington found a pre- to post-test improvement on the
NWEA’s Achievement Levels Test (ALT) for students using the Cognitive Tutor.
2.5.1 SimCalc MathWorlds
SimCalc MathWorlds® uses wireless to make possible to the teacher to view and/or show to the
whole class, the computers or calculators of students. Has also a set of mathematical activities taking
advantage of that technology. The SimCalc is a dynamic software that allows the user to manipulate
tables, graphs and expressions.SimCalc MathWorlds® work with multiple representations (tables,
graphs, function expressions, animations, narratives), design mathematical models and activities and
94
use simulations of various time-based models. It works for Algebra from middle grades until college,
for PreCalculus, and Calculus.
According to Tatar, Roschelle and al. (2007) it was made an experience in Texas, using SimCalc
MathWorlds, with 71 seventh grade teachers. The results show that it had an important impact on
students learning even in the absence of others important conditions.
2.5.2 Teaching functions with computers
Machado (2006) conducted an empirical study with students in the 12th grade of mathematics on the
study of the exponential function and derivative function. The only difference between the
comparison group and experimental group lay in the fact that students in the experimental group had
used the graphical capabilities and computer simulation to see more graphics to better understand and
internalize the correspondence between the algebraic and graphical changes. The math test scores
were more favorable to the experimental group, which concluded that to the process of teaching-
learning mathematics is important the display of graphics and the visual reasoning. Moreover, when
young people come into contact with the computer, began to consider it not only as a mere machine to
play games in extracurricular activities, but also as an excellent ally in the learning process.
2.5.3 Tutorials
In a large review of computer tutorials Kaput (2003) concluded that properly used computer tutorials
add positive value to a course of mathematics.
To a group of students of the first year of university with inadequate mathematical skills and
understanding, was created tutorials using Excel workbooks coded with Visual Basic Applications.
Each tutorial is composed of one worksheet with objectives, some worksheets presenting a part of the
content and many worksheets of examples and exercises. Those worksheets have imbedded a
“graphics tool” that allows to make graphics and include them on the worksheet. Immediate feedback
is given to the students and there are tutors available to give additional support (Frith et al., 2002).
From the respondents to a questionnaire, 70% found useful the explanations of the tutorial and 82%
found useful the immediate feedback. The most important items were, according to students, “the
automated drawing of graphics, the feedback, the visualization of concepts and the fact that they were
“doing maths” on computers”. After that course students feel more confident in mathematics and in
using computers.

95
Kuhn (1999) created an interactive workbook with the class notes for a statistics course at high
school. To allow easy introduction of mathematics symbols it was made in PDF. Those class notes
were complemented with quizzes on the internet. An experiment showed that that interactive
workbook provides enough information to give to internet students the possibility to perform with a
similar level to classroom students.

96
“…I point to the following unwelcome truth: much as we might dislike the implications,
research is showing that didactic exposition of abstract ideas and lines of reasoning
(however engaging and lucid we might try to make them) to passive listeners yields
pathetically thin results in learning and understanding –except in the very small
percentage of students who are specially gifted in the field.” Arons, 1990, (as cited
in,Beichner & Saul, 2003, p. 2)
In this chapter are addressed many different topics around mathematics didactics that are used in
the following chapters. Research that supports (or allows discussion about) choices/actions made in
ActivMathComp to enhance mathematics learning is presented. The topics are largely different from
instruments, didactic recommendations, learning strategies, learning rhythms and types of learning
but all have to do with the learning environment of ActivMathComp.
3 Topics around Mathematics
Didactics

97
Active Learning in Higher Education 3.1
I hear, I forget;
I see, I remember;
I do, I understand.
(Confucius, 500 b.C.)
According to Rubin and Hebert (1998) active(L. Rubin & Hebert, 1998) learning was utilized at a
long time ago in many different ways: the dialogue of Socrates; in the Renaissance, the Rabelais's
model of education of Gargantua; in the decade of 30, the Dewey’s reflexive thinking; in the decade
of 60, Bruner’s discovery method. According to them, good teachers always knew that when students
are involved in their own learning (to discover, manipulate or personalize the information) and not
only passively listening, the learning is deeper.
Active Learning may signify many different approaches but all have the property that students are
not only passively hearing as it is usual in nowadays traditional lectures.
In their report about active learning in higher education Bonwell and Eison state that the term
"active learning" has never been precisely defined in educational literature but:
Some general characteristics are commonly associated with the use of strategies
promoting active learning in the classroom:
Students are involved in more than listening.
Less emphasis is placed on transmitting information and more on developing
students' skills.
Students are involved in higher-order thinking (analysis, synthesis, evaluation).
Students are engaged in activities (e.g., reading, discussing, writing).
Greater emphasis is placed on students' exploration of their own attitudes and
values. (1991, p. 19)
To provide a working definition for that analysis, they defined active learning as anything that
"involves students in doing things and thinking about the things they are doing". Their conclusion is
that the use of active learning techniques in the classroom is vital because of their powerful impact
upon students' learning.
Several studies have shown that students prefer strategies promoting active learning to
traditional lectures. Other research studies evaluating students' achievement have

98
demonstrated that many strategies promoting active learning are comparable to lectures
in promoting the mastery of content but superior to lectures in promoting the
development of students' skills in thinking and writing. Further, some cognitive
research has shown that a significant number of individuals have learning styles best
served by pedagogical techniques other than lecturing. (Bonwell & Eison, 1991, p. iii)
Prince (2004) in his paper “Does active Learning work? A review of the research” considers
different kinds of active learning, from the introduction of student activity into the traditional lecture,
until the introduction of activities promoting student engagement, or the introduction of collaborative
learning or cooperative learning or even problem-based learning. In this study, he found support for
all forms of active learning studied.
Ruhl, Hughes and Schloss (1987) studied a model of active learning named “the pause approach”
which consists of two or three pauses in one hour of lecture where the students clarify their notes
with a colleague. This group was compared with other where the lecture was straight; they were
compared in short-term and long-term retention. The short-term retention was assessed by making
the student write all the fact they could remember 3 minutes after the class. The average was of 108
facts recalled for students of the pause approach and of 80 for the others. The long-term retention was
assessed by a multiple choice exam given one and half week after the last lecture. Test scores were
also higher for students of the pause approach then for the others.
Many studies suggest that during a lecture the attention span by the student is around 15 minutes.
For example Hartley and Davies (1978) found that in a lecture, after a while, the number of students
with attention drops radically with natural consequences on students understanding. More, they found
that when the lecture finishes students remember 70% of what was taught in the beginning of the
lecture and only 20% of what was taught in the end. So, a break in the lecture may result to keep
students engaged during more time.
Engagement is also an important component of active learning. Hake (1998) studied 6000 students
of introductory physics courses and got the conclusion that students with substantial use of interactive
engagement methods performed substantially better. The tests measuring conceptual understanding
were roughly as twice as high in those classes than in traditional teaching.
According to Crato (2009) in the last years emerges some consensus: there are known the
advantages of active learning but is known that we cannot quit the structured transmission of

99
knowledge; are recognized advantages of automatisms and memorization; is known that thought and
memory are not opposed mental realities; the role of examples and abstraction are also questioned.
In the University of Maryland in introductory calculus-based mechanics classes of engineering
students, were substituted traditional problems solving recitations by one hour of active engagement
tutorials using microcomputer based laboratory equipment. This experiment evolved 11 lecture
classes, taught by six teachers with and without tutorials. Redish, Saul and Steinberg (1997) found
that the tutorials gave a significant improvement relatively to the traditional teaching, due to its nature
of active engagement.
Cooperation is one possibility of active learning; Johnson, Johnson and Smith (1998) made a
review of more than 90 years of research and found that cooperation improved learning relatively to
individual work.
To learn Calculus, Cummins (1960), at 50 years ago, already arrived to the conclusion that active
learning has better results than passive reception of lecture. He made an “experience-discovery
approach” and developed study-guide sheets to make students arrive, independently or with help of
class discussion, to some concepts of calculus. The students of the approach performed at the same
level as the others students in traditional skills, but performed much higher in conceptual
understanding.
Another study in the active learning of Calculus, was made by Seltzer and al. (1996) with an
approach that gives emphasis to problem solving through its stress on in-class activities and context-
rich problems. They found that, with this approach students became more independents, and more
interested and involved in mathematics.
In addition to being more productive to teach using active learning techniques, teaching by lecture
particularly affects some types of students. This makes, the authors that follow, classify as immoral
teaching without using active learning techniques.
Treisman (1992) studied the calculus students of the University of California and found that most
of those students graded so low in calculus that they cannot proceed with a major in mathematics
science or technology. The possible causes pointed by the faculty were: a motivation gap, inadequate
preparation, lack of family support or a function of income. Hispanic and rural White students have
similar problems in other schools and universities. Treisman found that student’s entry scores and
family income were inversely correlated with student’s grades at calculus. Those students usually

100
come from high schools not oriented to put students in university and don’t have many peers to study
with. More, sometimes they feel that study with others students is cheating or that it is only made by
weak students. Often to study and have good performance at school is socially considered as negative.
So, many of those students studied alone and far from others view. He noted the contrast of those
students against some Asian American students that often work together to face Calculus and to
whom have a good performance gets social prestige.
Nelson (1996) found that “several alternatives to our traditional ways of teaching have been shown
to lead to stunning improvements in student achievement” and “non-traditional approaches usually
produce large gains by the groups of students who have been hardest to reach with standard
pedagogy”. With those two conclusions he says that it is “hard to justify offering any course that uses
largely passive pedagogies”.
Nelson (1996) based on the studies of Treisman (1992) claim that “a failure to make effective use
of these techniques is also (unintentionally) discriminatory against Blacks and other traditionally
under-represented groups.” Further, he writes that “this raises the question of whether it has already
become immoral to teach without extensive use of the active learning techniques that so enhance
performance”.
Nearly all the approaches of the Chapter 2 used active learning.
Learning Styles 3.2
Felder (1996b) writes that learning styles are “characteristic strengths and preferences in the ways
they [the learners] take in and process information.” A more formal definition was introduced by
Keefe (1979): “characteristic cognitive, affective, and psychological behaviours that serve as
relatively stable indicators of how learners perceive, interact with, and respond to the learning
environment”.
According to Felder and Brent (2005) many learning models have been developed, five of them
have been used in engineering and three of them were assessed to educational use to engineering.
Here will be approached those three models: the model of Felder and Silverman, the model of Kolb
and the model of Myers-Briggs.
101
Each of those models studies different dimensions of learning styles. Independently of the learning
model used, the recommendation of these researchers to enhance learning is to teach using all
dimensions of learning styles.
3.2.1 The model of Felder and Silverman (ILS)
Felder and Spurlin (2005) have a model, based on the model developed by Felder and Silverman
(1988) which classifies engineering students as having preference for one category or the other
among four dimensions:
sensing (concrete thinker, oriented toward facts and procedures) or
intuitive (abstract thinker, innovative, oriented toward theories and
meanings);
visual (prefer visual representations of presented material such as
pictures, diagrams and flow charts) or verbal (prefer written and
spoken explanations);
active (learn by trying things out, enjoy working in groups) or
reflective (learn by thinking things through, prefer working alone or
with a single familiar partner);
sequential (linear thinking process, learn in small incremental steps)
or global (holistic thinking process, learn in large leaps) (Felder &
Spurlin, 2005, p. 103).
To test learning styles it is used a questionnaire: Index of Learning Styles (ILS) available for free
at http://www.engr.ncsu.edu/learningstyles/ilsweb.html. This instrument was studied by Felder e
Spurlin (2005) and may be considered reliable, valid and suitable.
Diverse studies were made using the Index of Learning Styles, for example: Kuri and Truzzi
(2002) studied 110 civil engineering students of the public University of São Paulo in Brazil and
concluded that 69% are Active (so 31% Reflexive), 86% are Sensory (so 14% Intuitive), 76% are
Visual (so 24% Verbal) and 54% are Sequential (so 46% Global); Montgomery in (1995) studied 143
first year students of chemical engineering of the University of Michigan in USA, had 1% of non-
respondents in each category, and concluded that 67% are Active (so 32% Reflexive), 57% are
Sensory (so 42% Intuitive), 69% are Visual (so 30% Verbal) and 28% are Sequential (so 71%
Global).

102
Felder and Spurlin (2005) made a compilation of seventeen studies with a total of 2056
engineering students and 101 engineering faculty and concluded (see Table 1) that most students are:
Active, Sensory, Visual and Sequential. However, traditional classes are mostly the opposite:
Reflective, Intuitive, Verbal and Sequential — the Learning Styles dominant in Engineering Faculty
with exception to the Verbal category. This mismatch, between students learning styles and teaching
styles, should be avoided (Felder & Brent, 2005; Felder & Silverman, 1988; Montgomery, 1995).
Table 1. Engineering students and faculty distribution among the cathegories of the Index of Learning
Styles
Active Reflexive Sensory Intuitive Visual Verbal Sequential Global N
Engineering
Students
64% 36% 63% 37% 82% 18% 60% 40% 2506
Engineering
Faculty
45% 55% 41% 59% 94% 6% 44% 56% 101
Applying those categories to engineering teaching, according with Felder and Brent:
Most engineering instruction is oriented toward introverts (lecturing and individual
assignments rather than active class involvement and cooperative learning), intuitors
(emphasis on science and math fundamentals rather than engineering applications and
operations), thinkers (emphasis on objective analysis rather than interpersonal
considerations in decision-making), and judgers (emphasis on following the syllabus
and meeting assignment deadlines rather than on exploration of ideas and creative
problem solving) (2005, p. 59).
According to Felder (1996a) using much more some learning styles than others is not very good.
The best for students is if all learning styles are often touched in course. Because if student has one
learning style and the teacher is always using the opposite, he will never be comfortable. Otherwise, if
the teacher always uses the student learning style he will not develop the competencies given by the
opposite characteristic of his learning style. It is important to develop competencies in all learning
styles characteristics since a complete engineer will certainly need all. Felder gives some strategies to
use a large range of learning styles in a course:

103
Teach theoretical material by first presenting phenomena and problems
that relate to the theory (sensing, inductive, global).
Balance conceptual information (intuitive) with concrete information
(sensing).
Make extensive use of sketches, plots, schematics, vector diagrams,
computer graphics, and physical demonstrations (visual) in addition to
oral and written explanations and derivations (verbal) in lectures and
readings.
To illustrate an abstract concept or problem-solving algorithm, use at
least one numerical example (sensing) to supplement the usual
algebraic example (intuitive).
Use physical analogies and demonstrations to illustrate the magnitudes
of calculated quantities (sensing, global).
Occasionally give some experimental observations before presenting
the general principle, and have the students (preferably working in
groups) see how far they can get toward inferring the latter (inductive).
Provide class time for students to think about the material being
presented (reflective) and for active student participation (active).
Encourage or mandate cooperation on homework (every style
category).
Demonstrate the logical flow of individual course topics (sequential),
but also point out connections between the current material and other
relevant material in the same course, in other courses in the same
discipline, in other disciplines, and in everyday experience (global).
(Felder, 1996a, p. 6)
3.2.2 The model of Kolb: Experiential Learning Model (LSI)
The Experiential Learning Theory is based on the definition of learning as “the process whereby
knowledge is created through the transformation of experience”. Knowledge results from “the
combination of grasping and transforming experience” (D. A. Kolb, 1984).

104
Figure 43. The Nine-Region Learning Style Type Grid. From “Learning styles and learning spaces:
Enhancing experiential learning in higher education,” by A.Y. Kolb and D.A. Kolb, 2005, Academy of
Management Learning and Education, 4, p.198. Reprinted with permission.
The Experiential Learning Model/Model of Kolb (A. Y. Kolb & Kolb, 2005b) classifies dominant
learning abilities. With respect to the form of grasping experience, people continuously vary from
Concrete Experience (CE) to Abstract Conceptualization (AC). With respect to the form of
transforming experience, people continuously vary from Reflective Information (RI) to Active
Experience (AE).
To get the characterization in terms of learning style by this model is used the Kolb’s Learning
Style Inventory® (McBer and Company, Boston) (LSI) that has been studied and improved from its
first version until the third version that is used nowadays. LSI consists in twelve sentence stems
followed by four possible sentence endings.

105
Figure 44. The mean score on AC-CE and AE-RO for respondents who reported different educational
specialization and for the three specialized normative subgroups (in bold). From “The Kolb Learning
Style Inventory Version 3.1: 2005 Technical Specifications,” by A.Y. Kolb and D. A. Kolb, 2005,
retrieved from www.learningfromexperience.com.Copyright [2005] by HayGroup.p.27. Reprinted with
permission.
Kayes (2002) has studied the current version in 221 graduate and undergraduate business students
and concluded: ” this study provides exploratory evidence for the internal reliability and validity of
the LSI-3, consistent with prior research”.
In an online study with 4679 students split into groups with different educational specialization
(different specializations get very different number of respondents), Kolb and Kolb (2005a), using the
LSI-3, arrived to the following graphic. That graphic induces that educational specialization leads
students to different mean score on AC-CE and AE-RO.
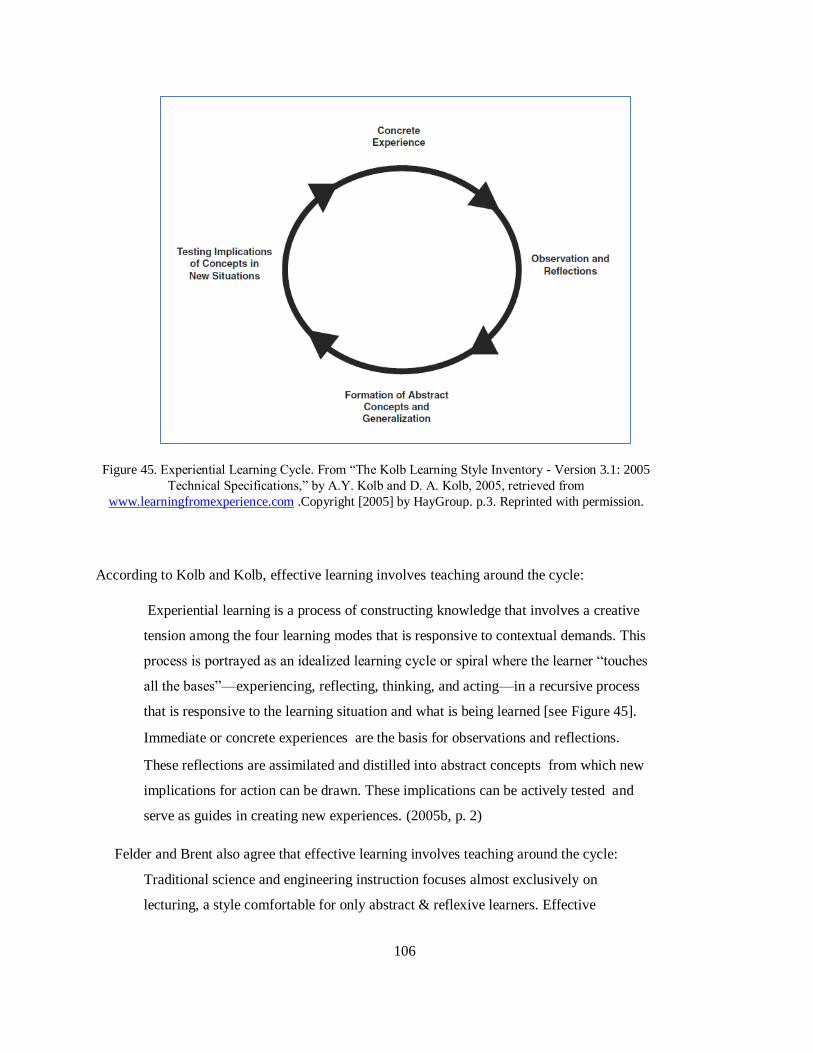
106
Figure 45. Experiential Learning Cycle. From “The Kolb Learning Style Inventory - Version 3.1: 2005
Technical Specifications,” by A.Y. Kolb and D. A. Kolb, 2005, retrieved from
www.learningfromexperience.com .Copyright [2005] by HayGroup. p.3. Reprinted with permission.
According to Kolb and Kolb, effective learning involves teaching around the cycle:
Experiential learning is a process of constructing knowledge that involves a creative
tension among the four learning modes that is responsive to contextual demands. This
process is portrayed as an idealized learning cycle or spiral where the learner “touches
all the bases”—experiencing, reflecting, thinking, and acting—in a recursive process
that is responsive to the learning situation and what is being learned [see Figure 45].
Immediate or concrete experiences are the basis for observations and reflections.
These reflections are assimilated and distilled into abstract concepts from which new
implications for action can be drawn. These implications can be actively tested and
serve as guides in creating new experiences. (2005b, p. 2)
Felder and Brent also agree that effective learning involves teaching around the cycle:
Traditional science and engineering instruction focuses almost exclusively on
lecturing, a style comfortable for only abstract & reflexive learners. Effective

107
instruction involves teaching around the cycle—motivating each new topic (concrete &
reflexive), presenting the basic information and methods associated with the topic
(abstract & reflexive), providing opportunities for practice in the methods (abstract &
active), and encouraging exploration of applications (concrete & active). (2005, p. 59)
3.2.3 The model of MYERS-BRIGGS (MBTI)
According to Rule and Grippin (1988) their model identifies people learning style based on four
dimensions:
Extroverted/Introverted (EI) Extroverts tend to orient themselves to the outside world of
people and objects. Introverts, in contrast, tend to focus on the inner world of concepts and
ideas.
Sensing/Intuitive (SN) Sensors prefer to rely primarily on the observable facts, while
intuitors prefer understanding the relationships or meanings drawn intuitively.
Thinking/Feeling (TF) Thinkers prefer to use logical consequences in making an
impersonal decision. In contrast, Feelers preference reflects decision making based upon
personal or social values.
Judgment/Perception (JP) Judgers have a more planned and ordered way of life while
perceivers are more spontaneous.
People can thus be said to belong to one of sixteen categories, based on their preferences along
each of these dimensions. For example, an ESTP person is Extrovert, Sensor, Thinker and Perceiver.
The instrument used to identify a learner’s type is the MYERS-BRIGGS TYPE INDICATOR™
(MBTI) which is formed by forced choice items: phrases followed by optional choices or questions
followed by single word choices.
Melacon and Thompson (1994) assessed, with MBTI, more than 420 college students. They
studied the MBTI and reached the conclusion that it is reasonably reliable and valid. MTBI’s manual
(Schaubhut, Herk, & Thompson, 2009) also ensures its “good internal consistency and test-retest
reliability (…) factor analysis shows the expected four-factor structure of the assessment”.

108
3.2.4 Teaching Calculus to all learning styles
According to Bonwell and Eison (1991) “cognitive research has shown that a significant number of
individuals have learning styles best served by pedagogical techniques other than lecturing”.
Felder in his paper Matters of style (1996a) gives suggestions to teach chemistry to all learning
styles (based on the Felder-Silverman model). Based on his suggestions, I will try to give examples
of how to do the same using calculus. His suggestions with my examples are:
Teach theoretical material by first presenting phenomena and problems that relate to the
theory (sensing, inductive, global). For example, don’t jump directly into series. First
describe real problems involving series: study tax cuts, the effects of medicines in human
body, calculations of some areas, the paradox of Zeno, etc. and perhaps give the students
some of those problems and see how far they can go before they get all the tools for solving
them.
Balance conceptual information (intuitive) with concrete information (sensing). Intuitors
favour conceptual information--theories, mathematical models, and material that emphasizes
fundamental understanding. Sensors prefer concrete information such as descriptions of
physical phenomena, results from real and simulated experiments, demonstrations, and
problem-solving algorithms. For example, to explain the theorem of implicit functions,
explain, at the same time, the theorem and how in a simple circle with equation ,
is an implicit function of in the neighborhood of certain points.
Make extensive use of sketches, plots, schematics, vector diagrams, computer graphics, and
physical demonstrations (visual) in addition to oral and written explanations and derivations
(verbal) in lectures and readings. For example, the first time you show the definition of finite
limit of a sequence by definition:
⇒ | |
Use real values like
and
Show values of the sequence in tables.
Make plots of the sequence. Explain the concept using the plot and the table. Ask students
to estimate the value of to find the value of using the table and the plot.
To illustrate an abstract concept or problem-solving algorithm, use at least one numerical
example (sensing) to supplement the usual algebraic example (intuitive). For example, when
you talk about Mengoli series begin calculating the value of the sum

109
∑ (
)
Explore the general case, only next:
∑
Occasionally give some experimental observations before presenting the general principle,
and have the students (preferably working in groups) see how far they can get toward
inferring the latter (inductive). For example instead of telling them the proposition that
between two irrational numbers there exists always a rational number, ask them first to find a
rational between the two irrational numbers and 3.14163342374… (remembering students
that the second number cannot be fully represented). Next ask to students to complete with
exist/not exist the proposition: Between two irrational numbers there _____ a rational
number. The students may do this activity interacting, if necessary with classmates.
Provide class time for students to think about the material being presented (reflective) and
for active student participation (active). Occasionally pause during a lecture to allow time for
thinking and formulating questions. Assign "one-minute papers" near the end of a lecture
period, having students write on index cards the lecture's most important point and the single
most pressing unanswered question. Assign brief group problem-solving exercises in class
that require students to work in groups of three or four. Or lecture for ten minutes and then
let students solve the exercises by themselves with the support of classmates and the teacher.
Encourage or mandate cooperation on homework (every style category). Hundreds of
research studies show that students who participate in cooperative learning experiences tend
to earn better grades, display more enthusiasm for their chosen field, and improve their
chances for graduation in that field relative to their counterparts in more traditional
competitive class settings.
Demonstrate the logical flow of individual course topics (sequential), but also point out
connections between the current material and other relevant material in the same course, in
other courses in the same discipline, in other disciplines, and in everyday experience
(global). For example, to begin the chapter of integrals ask the students to find the area of a
square, a rectangle, a circle and a part of a parabola. They will find out that they don’t know
how to calculate the area of a part of a parabola. Tell them that it is one thing that they will
learn in that chapter… they will learn how to find areas of “strange” regions. Tell them that

110
that is now that they will use the antideratives that they have learned in the chapter before.
Tell them also that they will learn to calculate volumes of solids, length of lines, and area of
3D surfaces using those integrals on the following mathematics course.
Do Not Work Always Alone 3.3
There are many possibilities to do not work always alone. Literature is plain of different names and
different meanings: collaborative learning, cooperative learning, co-operative learning, peer learning,
etc. In these approaches may exist formal or informal groups, with common goals or individual goals,
with common assessment or individual assessment… but all have moments in which students do not
work individually (Prince, 2004) . These approaches may vary also with the relation between
“teachers” and students. For example, Bonwell and Eison (1991) describes five different
classifications of peer teachers: (1) teaching assistants, both graduate and undergraduate; (2) peer
tutors, who work with students one on one in an academic area; (3) peer counsellors, who advise
students over a broad range of academic concerns; (4) partnerships, that is, one-to-one relationships
where each partner alternates in the role of teacher and student; and (5) working groups, which work
collectively to enhance individual performance.
Astin in his book What Matters in College (1993) made a longitudinal study with half a million
students in 1300 American high schools and concluded that the interaction student/student and
teacher/student are, by far, the most significant influences on retention and achievement.
In SCALE-UP (see Section 2.4.1), an experience with strongly positive results, students work in
groups of three chosen in a very careful way: the whole set of students are split in three parts
according to their background, and each group has a student from the top third, the middle third and
the bottom third; there are also accounted factors like belonging to a minority: being girl, being black,
etc. Beichner, believes that “social interactions between students and with their teachers appear to be
the active ingredient that makes the approach work.” (Beichner, 2008; Beichner et al., 2007).
Rosenthal (1955) made an experience using group work with positive results: was easy to
implement, popular and productive. In a class of advanced mathematics, nearly once every two weeks
he gave problem exercises to groups of three to five students for around one hour and half as a

111
complement to usual classes. The instructor was available only to questions or to deal with groups not
working well together.
In most of the approaches of the last chapter there are moments in which students do not work
alone.
Proximal Development Zone (PDZ) 3.4
The Proximal Development Zone (PDZ) was defined by Vygotsky(1978) as a zone where students
can perform challenging tasks with support from other competent people (a teacher or a more skilled
peer). To bridge the zone of proximal development, Vigotsky give emphasis to social interactions
where teacher and peers help the student. More, the idea is to include the student in meaningful,
constructive activities that lead to face new conceptions and skills and to increase effective learning.
According to Wilson, Teslow and Taylor (1993) there are several teaching strategies consistent
with the Vygotskian perspective:
Making a student to do a task in multiple ways and with different degrees of difficulty allow
him to realize that by working will arrive to a deeper understanding of concepts.
Apprenticeship learning: “skills are learned in the community of practitioners through
observation, coaching and successive approximation (practice). After observing an expert
execute an activity (modelling), the learner tries it with teacher guidance (coaching). The
expert provides reminders ("scaffolding") which are removed (fading) once the task can be
approximated”.
“Computer-based learning environments can be coupled with varying degrees of overt
guidance and performance support, depending on the needs of the learner” to reach PDZ.
Working Memory 3.5
According to Albuquerque (2011) working memory “corresponds to the ability to maintain and
manipulate information in our mind for very short periods of time”. Do not confound with short-term
memory. While short-term memory tends to be a structure that only holds a piece of information for a
short time, working memory allows you to operate on this information. For example, to remember the

112
digits 1, 4, 6, 2 we use only short-term memory, however, to remember and say the reverse order (2,
6, 4, 1) is required the working memory.
According to Sweller, Merrienboer, & Paas (1998)” working memory is very limited with respect
to the number of elements it can handle but its capacity may be enhanced if information is processed
using both the visual and auditory channel.[…] Everything that is learned as a consequence of
information that is processed in working memory is stored in an effectively limitless long-term
memory in the form of schemas that can vary in their degree of automaticity. Both schema
construction and automation have the dual function of storing information in long-term memory and
reducing the load on working memory”.
According to Gustafsson e Balke (1993) children with high level of working memory are very
good in mathematics and reading and those who have low level of working memory also have trouble
with mathematics and reading. The students with low working memory became overloaded even with
simple tasks; they have difficulty to follow instructions, specially connected and multiple instructions.
In mathematics the wording of the problem give already much work; ask a calculation is to ask too
much to its memory capacity. According to Engle (2010) the correlation between
mathematics/reading and working memory stands for the whole life, including in college.
Thus, according to Albuquerque (2011), to use less memory, the best is to have automated known.
One way to understand what is creating difficulties to the student is to ask to the student what he
already have done and what he wants to do next. It is also important to have conscience of the
cognitive effort or the working charge produced by a task, for example, very large instructions,
unknown contents, inadequate use of language must be pondered and possibly avoided.
Again according to Albuquerque (2011), repetition is central to memory. To learn we should
repeat in the same way and repeat in a more elaborated way each time. Repeat in the same way allows
keeping the information for longer and then processing and retaining. Repeating in a more elaborated
way each time allows long term memory. The author claims to be sure that this leads to "the
acquisition of certain automated systems that free the memory for the use of other more elaborate
strategies."

113
Meaningful Learning and Concept Maps 3.6
The theory of cognitive learning defended by Novak (1984); Ausubel, Novak and Hanesian (1978);
and Moreira and Masini (1982) is based on the concept of meaningful learning. Learning is
meaningful when new information (concept, idea or proposition) gets meaning by some kind of
anchorage to concepts, ideas or propositions that already exist in the personal structure of knowledge
(or meanings) with some degree of clarity, stability and differentiation. During the meaningful
learning process the concepts that interact with the new knowledge and are basis for the assignment
of new meanings will also change as function of its interaction, this is called progressive
differentiation. On the other hand, integrative reconciliation happens when elements in the cognitive
structure with certain degree of clarity, stability and differentiation are perceived as related, they
acquire new meanings and lead to a reorganization of cognitive structure.
Concept maps, according to Moreira (2005), are diagrams indicating relationships between
concepts. It is possible to make a concept map of one lesson, one study unit, one course, etc. When
someone is constructing one, the learning must be meaningful, because if the learning is mechanical
he cannot establish connections. Students may construct its own concept maps but, according to
Moreira (1980), is preferable to use concept maps when the students already have some familiarity
with the subject, so that they are potentially meaningful and allow for the integration, reconciliation
and differentiation of meanings of concepts. He states that concept maps are a strategy that helps to
get meaningful learning.
Other possibility to use concept maps is as a teaching support. According to Valadares, Fonseca
and Soares (2004) they permit the establishment of networks of concepts that progressively
differentiate a central concept in a coherent, structured and integrated manner, guiding the sequence
of teaching.
Multiple Representations 3.7
A teaching approach using multiple representations of mathematical concepts is advocated by several
strands.

114
It is advocated to suite teaching to various learning styles; because people learn in different ways:
some are more visual, others more verbal, some more concrete, others more abstract, etc. (see section
3.2)
It is advocated by the cognitive load theory because if information is processed using both the
visual and auditory channel the working memory handle with a larger capacity (John Sweller et al.,
1998).
It is advocated since it allows us to get more connections between the previous knowledge and the
concept taking into a more meaningful learning (see section 3.6).
It is advocated in the basis conceptions of the books of the Calculus Consortium Based at Harvard
University by the 16 authors and many collaborators, where are included mathematicians from
excellent universities, engineers, physicians, secondary teachers, etc. Those basis conceptions
include the rule of four that states that, whenever it makes sense, the concepts should be presented in
four different representations: verbal, analytical, graphical and numerical (see Calculus Consortium
based at Harvard University – Section 2.2.4).
According to Teodoro (2002) most educational software to mathematics and science already
explore already multiple representations of concepts. This is also one of the most important features
of Modellus software that, beyond the “traditional” multiple representations like tables and graphics,
allows visual interactive representations of mathematical relationships and real representations of
applications of the concept.
The visualization of graphics and visual reasoning are very important in teaching-learning
mathematics. More, it is important, in the study of a function, that students are able to relate algebraic
symbolism and the correspondent graphic (Dagher, 1993; Duval, 1988; E. Machado, 2006).
According with the neuroscientists Blakemore and Frith (2005) the results suggest that the fluency
of adults in arithmetic probably depends on a constant interaction between the quantitative, graphical
and verbal representations of the numbers. Humans use different regions of the brain to make
estimates and exact calculations. The rote calculations are made, mainly using the verbal system
while estimates are made using the quantitative system.

115
Modelling/Applications of Calculus 3.8
Are we teaching calculus in the hope that a small percentage of our students will
catch our love of rigor, or so that most of our students will emerge with the
ability to use calculus in their specialties? (Mumford, 1997, p. 563) – Winner of
the Fields Medal in 1974.
Kaput (1994) uses problems where students uses their own experience to investigate and understand
formal relationships, he uses daily reality to clarify mathematical symbols and graphics.
According to Gravemeijer and Doorman (1999), Realistic Mathematics Education (RME) is a
Dutch approach to teach mathematics using context problems, i.e., problems of which the problem
situation is experientially real to the student.
One of the conclusions of REMIT Project – a large study about what mathematics to teach to civil
engineering students – from Kent and Noss (2003) is that there should be a balance between
mathematics teaching as pure subject by itself and mathematics in context. Besides, it is necessary to
stop teaching processes and start teaching modelling. According to them, software is fully powerful to
explore mathematical modelling.
The PISA –Program for International Student Assessment (2009) in Mathematics measures how
students analyse, reason and communicate ideas and they pose, formulate and interprete mathematical
problems (see Section 2.1.2). Mathematics PISA pose problems from real life where mathematics
could help to analyse, criticise or solve the problems. It includes problems about shopping, traveling,
cook, deal with personal finances, judge political questions, etc. The idea is to use mathematical
known to solve problems where the context is less structured, instructions are not so clear, there are
extra information, where the student may take decisions of what known is relevant, etc.

116
Rosenthal (1995) claims that it is not needed to wait for large initiatives, every faculty may do by
itself the changes needed to go in the directions pointed by the NCTM and the Calculus Reform.
Those directions are to make the material more relevant to the students life and make of students
more active participants on their own learning.
Tall (1991) proposes to show relations between what is studied and real life but only when
introducing a concept. Next, it should create a necessity of a more formal approach and it is what
should be studied from then on.
According to Crato (2009) the most effective to teach is an alliance between theoretical and
applied teaching, where the applied teaching is not too much restricted to particular applications. The
learning succeed when there are a mix of abstract instruction and diverse specific illustrations that
awake the student and motivating him to perceive, imagine and make applications. But learning do
not succeed when it is not accompanied by a generalization by abstraction. Crato (2005) warns,
however, that not all that is taught ought to be immediately justified by its meaning or necessity.
Assessment 3.9
Traditional assessment did not seem an accurate measure of student’s learning effectiveness in
Mathematical Analysis. Having this problem in mind, it was looked for a solution… many
possibilities were addressed.
3.9.1 Is traditional assessment an accurate measure of student’s learning effectiveness
in Mathematical Analysis?
Using a qualitative methodology, Domingos (2003) was looking for some typical students’
performance. He worked with three students, each one identifying a typical performance, all with
success at traditional assessment. He used the concept image classified in incipient, instrumental or
relational and the kind of thought classified in processual, conceptual and proceptual (as is used by
David Tall and others). One of the students had an understanding based only in processes with an
instrumental understanding of the concept. The second had a relational understanding of the concepts,
applying it in diverse moments, so had a proceptual thought. And, the third had concepts image of
low level (incipient or instrumental) but had got good grades at Mathematical Analysis I and other

117
subjects in Mathematics. This reopens the question if traditional assessment is an accurate measure of
student’s learning effectiveness.
Another purpose of this researcher was a characterization of the complexity of student’s concept
image and proceptual thought when learning some concepts like function, limit, derivative,
Lagrange´s theorem, infinitely large, sequence and convergent sequence. The author chooses fifteen
students, and made a data collection by a diversified qualitative investigation. Many students neither
arrived to a relational concept image nor to a conceptual thought, students stayed in low level in both
classifications.
3.9.2 Possible solutions of assessment
Bonwell and Eison (1991) say that one way to modify traditional lectures to increase students'
learning is to include an immediate test of the subject material covered. More, in the context of
using strategies promoting active learning in the classroom, tests provide an obvious way to
involve students in doing something and getting them to think about what they are doing.
According to Rosenthal (1995) the assignments force students “to put together several ideas
and to explain them clearly”.
Fernandes (2009) made a research using all master and doctoral thesis using learning
assessment of students from nursery to secondary level, in Portugal, since 1980. He arrived to the
following conclusions:
Formative assessment practices do not occur continuously or systematically. Most teachers
understand that it helps students to learn, but use a diversity of arguments to justify the
inconsistency between their conceptions and practices (e.g., lack of training, the need to get
through the programme).
Assessment is a teacher’s responsibility. There are few research studies that highlight the
sharing of assessment processes among students, parents, teachers and other participants.
Assessment is not a very transparent process. By rule, criteria for assessment, correction and
classification are not specified or made clear to students.
Assessment tends to be fairly loose and not particularly diversified. Tests are nearly the only
assessment tool.

118
Assessment is mainly regarded as a measure or means of verifying whether aims have been
met or not. Assessment with a view to learning or improving is something that only a
minority of teachers seems to understand and put into practice.
Probably it is not a big mistake to generalize this data to higher education since the generality of
Calculus teachers use traditional teaching methods. There are no real data. There is a small number
of research made in Portugal about learning assessment at mathematics higher education.
3.9.3 Tests with Feedback
Roediger and Karpicke (2006) made a research in which three groups of university students
studied small parts of texts. The first group studied the text four times (SSSS), the second group
studied the text three times and next made a test about it (SSST) and the last group studied once and
then made three tests (STTT). All groups made, later on, a test to find the amount of information that
they were able to remember. In each group, half of people made the test after five minutes while the
other half made the test after a week. The results after five minutes were better for the first group
(who had studied in all the times). The results after a week were better for the students of the third
group (who have made the three tests). This means that, to get a knowledge for shot the best strategy
is to study repeatedly, however, to get a robust knowledge for long time, answering to tests are the
most efficient way of study.
Also by research, these authors (Karpicke & Roediger, 2007) reached the conclusion that the best
strategy is to test not only what we don’t know but also the things we already know (that we have
already answered correctly). Again in this case, it is better to make tests than simply study repeatedly.
In laboratory, Pyc and Rawson (2009), verified that the ideal number of tests to do is from five to
seven.
According to Paula Carneiro (2011) the tests that claim for remembering effort and not only to
information recognition, allow a deeper learning in the future. That means that open answer tests are
better than multiple choice tests. Giving the correct answer and the explanation, after the recovering
effort, enlarges the test efficacy, no matter if the test is of open answer or of multiple choice.
Butler, Pyzdrowski, Goodykoontz and Walker (2008) made an experiment with five sections,
some getting immediate feedback on quizzes and others do not get feedback. They reached the
conclusion that the capacity of online homework to provide immediate feedback is valuable.

119
According to Caprotti et al. (2007) the quizzes graded automatically replaced the books of solved
exercises being a “very valuable component in mathematics courses”.
For short, to do regularly cumulative tests with feedback, if possible of open response, increases
students' learning.

120
As support to the approach used in this study, this researcher created Interactive Learning Documents
(ILDs), a collection of digital documents that aims to provide support for students to learn AM1
(Mathematical Analysis 1/Análise Matemática 1). The ILDs are all the material that the student needs
for the course: the slides of the teacher, the support book (with theory and exercises), the "daily diary"
where students solve the exercises and take their notes, etc.
The ILDs are interactive, not static documents from which the student gets information as in a
traditional PDF, they drive students to answer questions, to complete the settings, to select the
properties that make sense, to choose the meaningful options, etc.
In this sense the ILDs encourage active learning; promote student centered teaching; allows an
evolution at the pace of each student. This learning is done fairly autonomously since it takes into
account the zone of proximal development and thus, with a small support, the student progress on his
own.
These documents encourage the use of software of different types; propose links to external sites
that can serve as complement to the study and have links to applets that help clarify concepts. The
ILDs give emphasis to applications of mathematics, use multiple representations of concepts and
suggest the creation of concept maps by students. They are also complemented with tests on Moodle
that give immediate feedback of student’s level of understanding.
In this Chapter all the thoughts behind the creation of the ILDs are explained, as well as its
functioning. The ILDs are available online in http://moodle.isel.pt/dec/course/view.php?id=104.
4 Interactive Learning Documents

121
Interactivity 4.1
To create the documents was used LaTeX and the package eForms that is part of AcroTeX
(http://www.acrotex.net/) to get form fields like Combo Boxes, Check Boxes, Text Fields, etc. It was
chosen to use LaTeX to make the ILDs because LaTeX allows to write math symbols with easiness, it
also allows to create interaction with simplicity, it's free and it generates PDF documents which all
students can read and add comments to, also for free.
The final product is a new generation PDF file that allows interaction with the user. Combo Boxes
are used to give the possibility to choose one between some options, to complete a sentence, or to
choose a correct result. Students may write an answer, to a question, in a Text Field. Students are also
able, in any part of any page, to add comments (written or audio) and write in it. Each student
personalise his document according to his work as he would do with a workbook in paper.
The Combo Boxes allow students to choose the meaningful option when a definition, a theorem,
an example, a property or an exercise is presented (see Figure 46). The students must perform the
action of choosing the correct option instead of being spectators receiving the properties that are
being presented to them in its final form.
Figure 46. Using Combo Boxes to explore the concept of conjunction.

122
The Check Boxes allow the choice of one or more items among several items. The fundamental
difference to Combo Boxes is that all possibilities are always visible and is possible to choose more
than one item.
Both, Combo Boxes and Check Boxes, allow the students to choose an answer but do not give
feedback about the correctness of the choice. It is possible and easy to implement to make that the
students get immediate feedback thought the internet. But it was not implemented in the ILDs since
this could lead students not to think about the answer but simply try all chances until they get the
correct answer and also because all questions were corrected in lessons so, after a time of reflection,
the students get the correct answers. This kind of feedback would be interesting to give the solutions
to the exercises that are to be done out of class, this will be a future work.
The Text Fields allow an open response from the student (see Figure 47).
Figure 47. Using Check Boxes and Text Fields to explore the concept of absolute value.
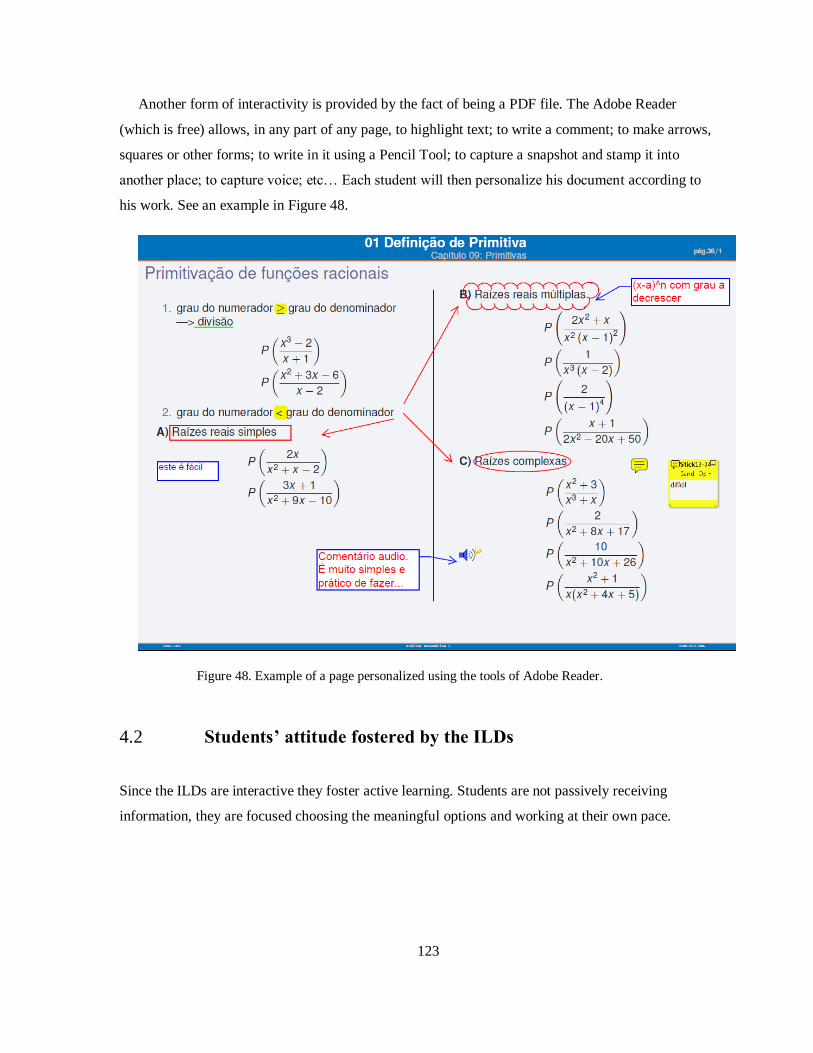
123
Another form of interactivity is provided by the fact of being a PDF file. The Adobe Reader
(which is free) allows, in any part of any page, to highlight text; to write a comment; to make arrows,
squares or other forms; to write in it using a Pencil Tool; to capture a snapshot and stamp it into
another place; to capture voice; etc… Each student will then personalize his document according to
his work. See an example in Figure 48.
Figure 48. Example of a page personalized using the tools of Adobe Reader.
Students’ attitude fostered by the ILDs 4.2
Since the ILDs are interactive they foster active learning. Students are not passively receiving
information, they are focused choosing the meaningful options and working at their own pace.

124
4.2.1 Active Learning
These documents promote active learning since they are not static and not only do they "tell" students
about what the concepts are and how to solve the exercises, but they also take the students to
distinguish what does and does not make sense for that concept, to build (in a guided and supported
way) their own knowledge, to seek for solutions to the exercise rather than following some
procedures without understanding the reason to do that.
The two previous figures (Figure 47 and Figure 48) and the next one (Figure 49) are illustrative of
how the ILDs promote active learning. Of how they support a student-centered learning, where
students learn by themselves, independently, at their own pace, with the support of the professor and
colleagues whenever necessary.
Figure 49. Construction of the Taylor polinomial by the student.
4.2.2 Learning at Each One’s Pace
Each group of exercises begins with simple exercises and ends up with more complicated ones. Each
student solves those exercises at his own pace, while those who have more easiness advance up to the
latest and face greater difficulties, those who find more difficulty overcome with calm each difficulty
encountered, gaining thereby self-confidence and being conscious that are "building up" their own
knowledge "layer by layer” (see Figure 63).

125
External support 4.3
The ILDs are made to have some external support: the use of software; links to some applets and
tutorials on the internet that may supply extra material and assessment of their performance; the ILDs
are also connected with frequent quizzes in Moodle.
4.3.1 Using Software
The ILDs suggest the use of some software: a spreadsheet, a computer algebra system, Modellus and
a mathematics editor.
The Spreadsheet is suggested mainly on the study of sequences and functions to allow beyond of
analytical, its numerical and graphical study (see Figure 50). Students should have in mind that seeing
some (or even many) terms of a sequence in a table or a graphic does not ensure its convergence or
divergence but working with sequences only from its analytical view is very weak.
Figure 50. Use of a Spreadsheet to get a plot and a table of some terms of a sequence.

126
The Computer Algebra System (CAS) is suggested to make algebraic manipulation, to all kind of
calculations like: limits, extrema, primitives, integrals, Taylor series, etc. and also to allow
visualizations of graphics (see Figure 51).
Figure 51. Creation of a graphic in a CAS to explore the composition of functions.
The software Modellus is suggested to model real life problems. Figure 52 shows how it was
possible to model, through photo, with Modellus, the front of the building of Vasco da Gama
Shopping Center in Lisbon.
Figure 52. Modelling the front of Vasco da Gama shopping center using Modellus.

127
Modellus is also suggested to deepen knowledge by providing multiple representations of the same
concept. In Figure 53 the ILD uses a Modellus file to illustrate in an algebraic, graphical and
numerical point of view, using an animation, the relationship between the sine of an angle measured
in the trigonometric circle and the trigonometric sine function.
Figure 53. Multiple representations of sin(x) using Modellus- includes animations.
A mathematical text editor is suggested to make the ILDs become the "daily diary" of students.
Since we cannot write text with mathematical symbols in Adobe Reader, we must write it in a
mathematical text editor. Some of them were tested to find a simple way to copy answers to exercises
(or other text with mathematics symbols) from the editor to the ILDs that are in PDF. The editors of
mathematics using LaTeX (TeXnicCenter, Emacs, LyX, TeX BaKoMa, ScientificWorkplace, etc.)
were automatically excluded because they do not allow us to export answers with simplicity (nor in
picture format nor in other compatible format) since it is always necessary to compile. Other
mathematics editors:

128
MathType – Professional mathematics editor - copy to PDF with copy&paste – not free (but free
for people of ISEL since ISEL have purchased a licence.).
Microsoft Equation Editor – Mathematics editor for Microsoft programs – copy to PDF by
sniping – Free for those who have Microsoft programs.
MathCast - Allow writing text but not more than one line at a time – free.
Math – mathematics editor for OpenOffice – allows to write text but does not allow to make
more than one line nor save as image – free.
Since Mathtype was the most practical and was free for the students participating in the study, it
was the program chosen to be used during the study. The students wrote in Mathtype (see Figure 54)
and then copied (in picture format) for the ILD. One problem happens when the student write a wrong
answer and wants to fix it. To avoid writing it all again, it is suggested that the student should keep
the mathematical text file saved until the correction of questions. It is not very practical, but it was the
least bad among the solutions found.
Figure 54. MathType a mathematics editor.
However, in the study, after two weeks of classes already all, teacher and students had given up
solving the exercises in the ILD. Curiously, the teacher was one of the first to give up (maybe because
she is the most concerned with the lack of time to teach an extensive program or perhaps because she
had many doubts about the effectiveness of this form of writing). The reason indicated by all is that it
is not practical to write math in the ILDs, it requires much more time than writing by hand (see Figure
55). While when writing by hand we only think about how to solve the exercise – the part of writting

129
by hand is natural, it happens automatically – when writing in the math editor we have to think about
both things. We have to spend time thinking about how to write - even for people that type quickly.
The problem of writing mathematics does not happen only to us. According to Capriotti et al.
(2007) “ this difficulty regarding expressing mathematical formulae in the virtual setting is probably
the main obstacle slowing down the spread of e-education in the sciences”.
Figure 55. Answers written with a mathematics editor (Mathtype).
During the study was, therefore, dropped the hypothesis of writing mathematical symbols in the
ILDs. We used the combo boxes, the check boxes, etc. but we only used the text boxes if the answer
did not require to write mathematical symbols. When this happened students wrote, by hand, in the
daily diary.

130
4.3.2 External Links
The ILDs suggest external links for applets that, using visual interfaces (many times with
animations), help students to understand a concept.
For example, when exploring the applet on the Taylor polynomial (Figure 56) which is on page
http://www.math.psu.edu/dlittle/java/calculus/taylorseries.html it becomes evident that the Taylor
polynomial of a function is a polynomial approximation of this function.
Figure 56. Applet of the Taylor polynomial of the function sin(x) of degree 6 at the point .
ILDs also gives links to pages where students may evaluate their own performance at topics of
basic mathematics that are important prerequisites to AM1. If the student has a weak performance, in
those sites (Figure 57 and Figure 58) he finds theory, exercises and quizzes to help him to practice
until to gets a good performance.
Figure 57. Web page of Instituto Superior Técnico to support students to get better formation in basic
mathematics. http://modulos.math.ist.utl.pt/

131
Figure 58. Web page of Faculadade de Ciências da Universidade do Porto to give support to students
about elementary mathematics. http://cmup.fc.up.pt/cmup/apoiomat/
4.3.3 Quizzes on Moodle as Complement
The ILDs are complemented with frequent quizzes on Moodle (
) with immediate feedback about the performance of the student. That feedback may be used by the
student to see if he needs to study more or not, and by the teacher to find the subjects that students
have more difficulties in and rearrange lessons to fight against it.
Figure 59. Icon thar shows that there is a quizz on Moodle.
Concepts approach 4.4
The presentation of concepts follows some principles. Its presentations starts by a problem (an
application of the concept to solve a real problem) to motivate the students and make it more concrete
(more tangible by most students) then follows it generalization and consequent abstraction. Next, the
exercises begin from the simpler until the most difficult ones, having in mind the Proximal
Development Zone to allow the student to make the exercises alone (or with small support from the
colleagues or the teacher); the exercises (specially the initial ones) pretend to focus in one objective at
a time. Whenever it makes sense multiple representations of the concepts are touched (not only the

132
analytical view but also the graphical, numerical and verbal forms). In the end of a chapter the
students are required to make a concept map “to organize in its mind” the concepts and the relations
between them… to make the “big picture” of the chapter.
4.4.1 Application Problems
The ILDs emphasize the application of concepts to real cases and preferably to cases usable by
engineers or in day-by-day life. The purpose of including many exercises of applications is to
motivate students to understand the concepts; to make students understand the importance of the use
of mathematics in the development of engineering; to solve problems in day-by-day life; and test
students' ability to find relevant data in a given context and apply it to produce knowledge. Another
important reason for the introduction of these exercises is that, generally, they allow the development
of high-level objectives of Bloom's taxonomy like: apply, analyse, evaluate and create.
Figure 60. Problem about determination of the best dimenstions of a reservatory.
The problem in Figure 60 has an abstract formulation which is “find the smallest area of a
cylinder with a volume of 1000 v.u”. In the ILD, the wording in the form of real-life problem was
consciously preferred, as with many other problems.
4.4.2 Concrete-to-Abstract Approach to Concepts
The ILDs use a concrete-to-abstract approach to concepts in opposition to the traditional calculus
approach of abstract-to-concrete. Whenever it makes sense, concepts are introduced with real world

133
problems or an example and then arrive to its generalized abstract form. This is made to motivate the
learning and to give a concrete approach that facilitates understanding.
For example, to address the definition of convergence of a series was introduced a concretization
of Zenon’s Paradox:
When you throw an arrow at a target one meter away, there is a moment when the
arrow is at halfway of that distance. There will also be a time when it is halfway
between the middle and end. There will be yet another moment it is halfway of the
remaining 25cm. And so on.
Figure 61. Usage of the series of Zenon's Paradox to show intuitively the meaning of the convergence of
a series.

134
Figure 62. Definition (abstract and formal) of convergence of a series.
With this series the intuitive notion of the meaning of the sequence of partial sums and the
meaning of convergence of a series was explored (Figure 61). Only afterwards, are these concepts
described formally and in an abstract way (Figure 62).
With concrete cases everything is explored in a natural way. After a concrete case, the abstract
definition becomes more tangible. … it is easier to make connections with previous knowledge and
get meaningful learning.
4.4.3 Proximal Development Zone (PDZ)
In the ILDs the exercises were constructed having in mind the Proximal Development Zone (PDZ) –
see Section 3.4. The exercises were designed to enable the student to progress by himself from one
exercise to the next, or at most, with the help of a teacher or a classmate.
For example, in the ILDs, to teach how to calculate primitives it does not begin by asking one of
the most difficult ones, it introduces functions more and more difficult to primitive. In the exercise of

135
Figure 63 it is much more logical to make the point k) after making j), and j) after having made i),
than to begin by k). The order in which exercises are presented is therefore crucial.
Figure 63. Exercises to introduce primitivation techniques.
4.4.4 Focus in One Objective Each Moment
In each moment one objective is focused and only that objective is explored. Only after one concept
is understood is it mixed with other concepts in exercises. Because it allows a student that missed a
previous lesson or simply that did not manage a previous concept, to understand the new concept. For
example, to teach that an antiderivative of a function like is
, there are not used unusual
functions like hyperbolic sine or even tangents, are used familiar functions like polynomials and sine;
otherwise students do not learn antiderivativing techniques simply because they do not know the
derivative of unusual functions (see Figure 63).

136
Another advantage of focusing on only one objective at a time is to save time. For example, when
dealing with the calculation of extremes of a function, we begin by showing a specific problem (such
as those of Figure 64), but only make all calculations to find their maximum (or minimum) for two or
three of these exercises (enough for students to understand the method), then teach them to extract the
function to maximize (or minimize) and not waste time on further calculations.
Figure 64. Problems of maximization (minimization).
4.4.5 Multiple Representations
In ILDs there are abundant multiple representations of concepts, whenever it makes sense, not only
the symbolic part of a concept but also the graphical, numerical and verbal parts are explored.
The example in Figure 65 addresses the concept of limit of sequences of quotients of polynomials
when n goes to + ∞. Here beyond the usually explored symbolic representation is explored its
graphical, numerical and verbal representation.

137
Figure 65. Calculation of the limit of sequences using multiple representations.
4.4.6 Concept Maps
Figure 66. Example of a concept map made by the teacher.

138
The ILDs encourage students to make concept maps (Figure 66) at the end of each chapter to
understand the relations among concepts.
Format/Appearance 4.5
The format and appearance were not neglected. It intends to be appellative, carefully structured
and concentrated in one only document. Some advantages and some disadvantages came from the fact
of the ILDs being digital.
4.5.1 All in One Document
The ILD is complete in terms of theory and practice of the course. It has all subjects, all theory and
lots of practice in order to be the single document of the students: the book, the daily diary, and the
slides… all in one document.
The structure of each chapter begins with an introduction where a motivation is presented (usually
with a real life problem) to the study of the chapter, next are presented situations in diverse
applications of that subject (to Civil Engineering, to Medicine, to Physics, to Music, to Economy,
etc.), and finally the objectives and global skills that will be developed in the chapter. Then follows
the theory and practice to be explored in the classroom. And then arrives to the concept map, where
the student is invited to remember the concepts and arrange the connections between them. Next,
comes the section called “Para praticar…” (To practice…) where there are complementary exercises
to let students get more practice on the subject. The chapter ends with bibliography that the student
may use as complement or alternative to the ILDs.
That feature of having all that is needed to the students in one single document may be more
practical to students and allows that a student that misses a lesson to know exactly what was treated in
that lesson.
4.5.2 Carefully Structured and Organized
The ILDs are very carefully structured and organized. It has 11 chapters; each one is a file with the
number and name of the chapter: CAP04-SERIES (for example). Each file has a navigation panel
with the sections as well as subsections that makes fast to find a subject.

139
Concerning the introduction of concepts, motivation, examples and exercises the aim is to use the
order that better conduces to learning; an order that allows a natural logic when teaching; and that
makes that the responses required to students be in their zone of proximal development.
Beyond this natural structure, there were some concerns: the concern that places to fill or complete
must have a different look, so that students know immediately what is to think and fill; and the
concern that where software is required, beyond the name of the software it has an icon like:
Spreadsheet: Modellus: wxMaxima: .
4.5.3 Appellative
Of course, being appellative was also taken into account.
Figure 67. Front cover of chapter 7- Diferenciability.
4.5.4 Advantages and Disadvantages of the Format
The fact that the ILDs are in digital format instead of being in paper gives it some advantages and
disadvantages.

140
The digital option has the disadvantages of requiring students to possess their own laptop and
always bring the laptop to class, moreover it is not yet very simple to write mathematical symbols on
ILDs (see section 4.3.1).
The fact that the ILDs condense the book, the slides, the daily diary, the worksheets, etc. in one
single document is, perhaps, an advantage.
The fact that the theory and the questions are already written in the ILDs assures that students do
not have to copy it to the daily diary. This frees up time that may be fully spent thinking about the
problem instead of being spent making a copy. People may think that when the student is "copying to
the daily diary” he internalizes it but if instead of “copying it to the daily diary” the student is from
that moment reflecting about it, trying to apply it to solve the exercise, or choosing the correct item to
complete a property – perhaps he does not internalize less.
It is true that, with expertise, the ILDs could be made using sheets of paper photocopied or printed.
For example, one activity that includes a Combo Box may be substituted in a sheet of paper by the
same activity with the same options written on paper and the student chooses, as well, the meaningful
option. The paper option would be, however, more expensive, less ecological and perhaps less
attractive.

141
This chapter describes the methodology of this research. It describes the research questions and the
methodology applied to get the answers to those questions. Next, it describes the features of the class
submitted to intervention (TEAM1) as well as the comparison classes. The key points of the
teaching/learning method of TEAM1 were referenced. The Interactive Learning Documents (ILD)
created as support materials for this approach were already described in the last section. In this
chapter are still described the instruments used to “measure” the variables like questionnaires and
exams, and the way they were constructed and implemented.
Research Questions 5.1
The ActivMathComp (actively learning mathematics using computer) is an approach to teach AM1
(Mathematical Analysis 1/Calculus) to engineering students, created by this study, where:
Students are active and collaborate with colleagues in classes;
Computer is embedded as a communication, interaction and computational tool;
Students use interactive digital documents;
Students have the opportunity to explore concepts in order to develop a deeper
understanding of concepts;
Students contact with mathematical applications;
Students have frequent short quizzes with immediate feedback on a Learning Management
System;
The teacher/student relationship is grounded on trust, on mutual understanding and on
students’ involvement on their own learning.
5 Methodology

142
The main research question is: Does the ActivMathComp approach improve learning (get higher
grades and higher success rate) than the traditional teaching approach?
Other research questions are: What are the differences of attitude towards AM1 among the
students of ActivMathComp and the comparison group? How is the acceptance of ActivMathComp by
its students? How students and teacher evaluate the Interactive Learning Documents; to write
mathematics on a computer; and the use of quizzes on the approach? Can ActivMathComp work with
a large number of students? Do students appreciate active learning? Do ActivMathComp generate an
agreeable and productive class atmosphere?
Research Design 5.2
The experimental design of this intervention is a quasi-experiment, not an experience since the
experimental group was not randomly assigned (Cohen, Manion, & Morrison, 2005; Muijs, 2004).
The “control group” will then be called a comparison group. That quasi-experiment was based in
eight classes of one course, one got the intervention (16 students) and the others were the comparison
group (519 students). All students were evaluated with the same final exam. There was an online
questionnaire addressed to all students. Another specific questionnaire and two focus groups were
applied to the intervention class.
This intervention took place on the first semester of the academic year of 2009/10 and addressed
Mathematical Analysis 1 (AM1) which is a course of the first semester of the graduation on Civil
Engineering of the Engineering Institute of Lisbon (ISEL) belonging to the Polytechnic Institute of
Lisbon. The subjects addressed by this course are Logic, Real Numbers, Sequences, Series, and
Differential and Integral Calculus in .
The author of this thesis, which is a usual teacher of this course, taught two classes and the
intervention class named Experimental Class of Mathematical Analysis 1 (TEAM1). Three other
teachers got the remaining five classes. The existence of this class was publicized by emails to all
AM1 students, by posters posted throughout the building, and by direct advertising in the classrooms.
The students who preferred (among those who could bring a laptop to class) attended the TEAM1
instead of their "normal" class.

143
As for the timetable of TEAM1, in this institute, the classes of the odd semesters (1st, 3
rd and 5
th)
are taught in the morning and the classes of even semesters (2nd
, 4th and 6
th) are taught in the
afternoon. Thus all classes of AM1 were taught in the morning except the two night classes and
TEAM1 that was taught in the afternoon not to overlap with other courses of the 1st semester and this
did not become an impediment to its attendance by the natural students. TEAM1 overlapped,
however, to courses of the 2nd
, 4th and 6
th semester that were frequented by some students repeating
AM1. However, for a student of the first semester to attend this class, he would get six hours of holes
in his schedule and fill two afternoons; unlike the normal schedules where the students have the
whole morning with classes and no classes in the afternoon. This way, this schedule ended up not
being very good for students of any semester but was, however, the least bad solution found.
The students of AM1 have four classes of an hour and a half, which makes six hours of classes per
week. It was decided that TEAM1 would have only two classes of three hours each with a small gap
in the middle (the same total of six hours per week) by several reasons: not to force students to carry
the laptop for four days a week; because connecting and disconnecting the laptop spends much time
at the beginning/end of class; and also having in mind that the students of the morning that decided to
attend to TEAM1 already have four holes in the schedule, and not to occupy them four afternoons but
only two.
The Experimental Class of Mathematical Analysis 1 (TEAM1) 5.3
In TEAM1 class predominated active student-centred learning: most of the time the teacher was
seeing students working, the teacher only intervened when a student claimed for support. The
students worked in collaboration with each other, autonomously from the teacher. The classroom
atmosphere was supportive and of understanding, not of criticism and indifference. In TEAM1,
computers were used with multiple functions: as a computational tool, as a communication vehicle, as
a base, where were available interactive support materials, where were implemented many quizzes (in
Moodle) with immediate feedback, where were available wikis for collaborative work, etc.
5.3.1 Active learning and collaborative work
A typical class of TEAM1 began with the teacher explaining an issue for about 5 minutes and
students exploring it during the remaining 85 minutes. The explanation of a concept usually consisted

144
in the presentation of a concrete problem involving a real-life concept. This was followed by
resolution and its generalization to the precise and abstract definition of the concept. The student then
thought about the properties of the concept answering interactive questions about it (see example in
Figure 68) in the ILDs on his personal computer.
Figure 68. Integral properties presented with combo boxes to let students choose the meaningful option.
Next the teacher presented a list of exercises of increasing difficulty (ensuring they were in the
zone of proximal development of learners) and told the students: "Now it's up to you! Solve the
exercises and when you have doubts ask to me or the fellow students". The students knew the teacher
would only solve the exercises at the end of the class, in a very quick and brief way. Thus, during the
rest of the class, students tried to solve the exercises by themselves. When the teacher realized that a
student did not work, she asked him: "Can I help?", "How can I help you?", "Are you lost in the
subject? Did you miss some classes? I may help? ..." and usually the student accepted the help and
learned to do what was required. When students had questions often asked their colleagues and, when
nobody knew in the group they called the teacher. Usually the teacher did not solve the problem but
gave them hints to help them to reach the solution by themselves.

145
As each student worked independently and at their own pace, and students had different rhythms,
at the end, each student had made a different number of exercises… some had reached complex
exercises, others had done only the simplest. But all had solved the most basic exercises by
themselves, and could master, in fact, the basis of the concept. Students with more difficulties
perceived that they actually had managed to understand these basic exercises, and with just a little
more work they would manage to understand the others. The students that have more easiness went to
the last exercise, more challenging, in which they exercised high-level skills.
The responsible for classrooms in ISEL did not allowed to permanently change the layout of a
room so it remained with the usual arrangement: with secretaries leaning side by side to form a few
rows parallel to the blackboard and at the middle a corridor perpendicular to the blackboard. All the
students were facing the blackboard, although the ideal way to facilitate interaction would be face to
face. However, even with this arrangement, students interacted with one another in order to clarify
doubts with each other.
5.3.2 Relationships in the classroom
The relationship of the teacher (me) with students was based on an empathic understanding as
proposed by Carl Rogers (Rogers, 1969) in which the facilitator of learning, the teacher, made
students feel understood and supported rather than judged or evaluated. In which the teacher values,
accepts and trusts the student.
As shown by the results of the questionnaires, students were not afraid to ask me any kind of
doubt. A rule strictly followed was: never underestimate the importance of any question asked by
students, even very basic or inappropriate ones - if a student has a question that he should not have, it
is because something is in his education system failed, it is not necessarily a fault of the student - all
we have to do is clear up this doubt and make the student to acquire that knowledge.
The atmosphere in the classroom was of work, commitment and mutual support. The teacher (me)
also fostered cooperation between students, because a very efficient way to learn is to teach, that is,
when a student teaches another are both are benefited. Furthermore, two people have always more
ideas than one… from collaboration can always come good ideas to take work forward.
Thus, during class, most students were always confirming results with their colleagues and when
these results were not coincident they discussed and tried to understand together what was wrong.

146
There were some (few) quieter students, who had no friends in class and preferred not to interact with
peers and I did not forced them. With me, however, all interacted without fear.
In order to encourage active and autonomous learning, it was often necessary to emphasize that in
these classes students were expected to "work by themselves", those were not classes where students
only had to "listen to the teacher". So, often were used by the teacher expressions like, "Get to
work!", "It ought to be you to do it!”, "If you do not do it, you will not realize the difficulty!", "I want
everyone to learn to do this ...", "Alone at home is more difficult…". To encourage students to clarify
the doubts was said, "Who needs help?", "Who has questions?", "Ask ... that’s why I'm here!", among
other statements.
5.3.3 Assessment
The TEAM1 was assessed by the normal assessment of the course, i.e., students get approval if they
obtain grade higher than 9.5 values in: the average of three tests that take place throughout the
semester, or in the first final exam, or in the second final exam.
In this class, in addition to the normal assessment of the course, students were subjected to 14
quizzes in Moodle (around one per week) that were answered during class, usually at the end, and
lasted around 20 minutes.
To the students of TEAM1, at the final normal grade was added (when the normal grade was
higher than 9.5 values) a grade between 0 and 2 values, proportional to the average of the 10 best
grades of quizzes. These extra values were only to motivate students to engage in quizzes. These
values will not be taken into account in data analysis.
At the beginning of the semester the questions of the quizzes were mostly closed-response
(multiple choice – see Figure 69, numeric answer – see Figure 70, short answer, etc.). And only one
or two open-response questions (questions with a large answer) that students answered on paper
because of being awkward to write mathematics in Moodle. The students knew immediately the grade
obtained in closed-response questions and in a maximum of 24 hours got the grade in open-response
questions.
However, near the end of the semester, the teacher began to make the tests only with open
questions to which students responded on paper, because it takes more work to design closed-answer
questions than to correct answers of 15 students - in a class with more students that would not be true.

147
The grade was obtained the first time that the student sent an answer. However, the students could
do more attempts that allowed them to re-try the quiz and practice until they got the right answer.
Figure 69. Two multiple choice questions from the Moodle test about Logic.
Figure 70. A question with numeric answer from the Moodle test of series.
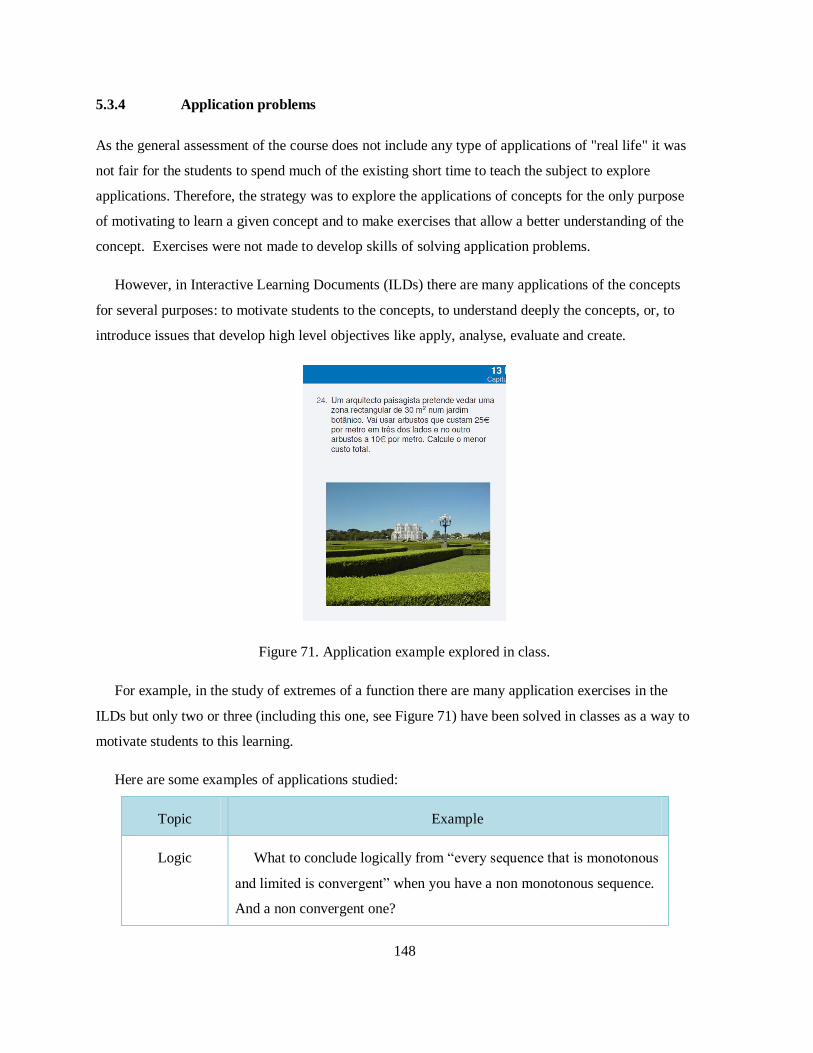
148
5.3.4 Application problems
As the general assessment of the course does not include any type of applications of "real life" it was
not fair for the students to spend much of the existing short time to teach the subject to explore
applications. Therefore, the strategy was to explore the applications of concepts for the only purpose
of motivating to learn a given concept and to make exercises that allow a better understanding of the
concept. Exercises were not made to develop skills of solving application problems.
However, in Interactive Learning Documents (ILDs) there are many applications of the concepts
for several purposes: to motivate students to the concepts, to understand deeply the concepts, or, to
introduce issues that develop high level objectives like apply, analyse, evaluate and create.
Figure 71. Application example explored in class.
For example, in the study of extremes of a function there are many application exercises in the
ILDs but only two or three (including this one, see Figure 71) have been solved in classes as a way to
motivate students to this learning.
Here are some examples of applications studied:
Topic Example
Logic What to conclude logically from “every sequence that is monotonous
and limited is convergent” when you have a non monotonous sequence.
And a non convergent one?

149
Sequences and
series
Make a model of the quantity of a medicine of regular seizure
present in the blood at the end of days or after much seizure time.
Sequences and
series
Make a model of the effect of tax downing supposing a fixed
percentage of savings.
Functions and
derivatives
Optimize areas, production costs and orders.
Antiderivatives Study a beam deformation.
Integrals Get the volume of arquitectonically special buildings.
Improper
integrals
Studying perpetual annuities and effects of epidemics of flu.
5.3.5 Software
I (the teacher) and the students took the laptop daily to classes, mainly to use the ILDs. The quizzes
were also made in the computer.
About the effective use of software in TEAM1, a problem arises: in Mathematical Analysis 1
course students cannot use any kind of software (nor computers nor calculators) during assessment.
Then, the teacher would be prejudicing TEAM1 students if make them spend a lot of time in class to
learn to work with several computer programs. Hence the usage of software was developed in order to
show the students files previously made by the teacher (me), to allow exploring the concepts (for
example in numeric and graphical form) or showing how some concepts allow to model the reality, or
showing models of concepts, or showing animations to illustrate the concepts, etc. Files were then
used in the perspective of being one more element that supports a deep understanding of the concepts
and not from the perspective of being the students themselves to create the files that allow exploring
the concepts.
This was a fundamental option on the study. This option prejudices students in the perspective of
spending time to explore files when the students will not be assessed about the exploitation of those
files. However, it is assumed that the exploitation of those files lead to a deeper understanding (since
it is richer in representations of the concepts) and has a positive influence on students’ motivation.

150
The possibility of students to create files for themselves, at home, remained open. All the files
displayed in the classroom were supplied to students. In ILDs was provided information for students
that allowed them to learn to use software, mainly the software that could serve to confirm the
calculations that students made analytically. This activity neither was regarded as essential, nor even
mandatory. The perception got was that few students used software by themselves, and even these
only did so sporadically.
The types of software used were:
Modellus to modelling mathematical entities, to explore concepts and connections between
concepts, to create and explore physical phenomena and the underlying mathematical
relationships behind the phenomena. For example, The teacher have modelled real objects
using functions, namely modelled the roof of Vasco da Gama Commercial Centre using a
parabola (see Figure 52); modelled a jet of water using a parabola, etc. Used an animation of
the trigonometric circle to introduce the sinus function, associating it at the same time with
its values in a table. Used Modellus to get an estimate of the area of a window of Batalha
Monastery to introduce Riemann sums, i.e. to introduce integrals. Used animations to
develop intuition about the concepts of sequence, monotonous sequence, etc.
Spreadsheet, the Excel (the Microsoft Office Spreadsheet), mainly to explore numerically
and graphically the concepts. Namely, explore the definition (of Cauchy) of limit of a
sequence using particular values of (see Figure 12). In a similar way, also explored the
sequence of partial sums of a series, relating it with its sum and also used the spreadsheet to
get estimates of the series sum. In both cases, the goal was to make concrete the concept of
series and develop intuition to make the understanding deeper. Showed, intuitively, that with
a spreadsheet we cannot verify if a property is valid to all natural numbers but we may do
that by induction. Used graphics and tables to make more intuitive the concept of sequence
and its properties.
As Computer Algebra System (CAS) was used wxMaxima and Wolfram|Alpha mainly to
make symbolic calculations and graphics. For example to confirm the result after making the
analytical calculation of limits of functions and sequences, sum of series (and their
convergence), derivatives, integrals, etc. It was used also to do plots of functions and then
visualize where are their maxima, minimum, asymptotes, monotony, etc. and to explore the
composition of functions. Some students of TEAM1 used CAS, in class and in mini-test, by
their own initiative, to confirm the results gathered analytically.

151
Were used the following applets:
http://www.slu.edu/classes/maymk/Applets/EpsilonDelta.html to explore the definition of
limit of a function (see Figure 72).
http://www.ies.co.jp/math/java/calc/limsec/limsec.html since it gives an animation to
explore the definition of derivative as slope of a tangent straight line.
http://www.ma.utexas.edu/cgiub/kawasaki/plain/infSeries/6.html to show visually that the
Taylor formula of a function is an approximation of that function (see Figure 35).
http://www.math.dartmouth.edu/~klbooksite/appfolder/tools/RiemannSums.html to illustrate
Riemann sums.
http://math.dartmouth.edu/~klbooksite/appfolder/403unit/MVTIntegrals.html to illustrate the
mean Theorem.
http://www.math.dartmouth.edu/~klbooksite/4.08/408.html to show how it works the method
of Disks to calculate the volume of revolution solids.
http://www.slu.edu/classes/maymk/banchoff/VolumeOfRevolution.html to illustrate the
disks and cylinder methods to calculate volumes of revolution solids.
Figure 72. Applet to study the limit of a piecewise function at .

152
Of course, to use the ILDs (in PDF) we (the teacher and the students) needed Adobe Reader. And
to write mathematics on the PDF we needed a mathematics editor (see section 4.3.1) and we used
Mathtype (not free, professional mathematics editor for Microsoft Word).
5.3.6 Moodle web page
As support to TEAM1 the teacher constructed a web page on Moodle (see Figure 73). This page
started out with a description of how the class would work, included a video on YouTube and a place
where students interested in participating in TEAM1 could subscribe to it.
Each chapter had the respective Interactive Learning Document (ILD), the files in Excel,
Modellus, wxMaxima, etc. to support the chapter and the quiz about that chapter. Before the first
chapter there was a topic: “While classes do not start…” that had links to pages that allow revisions
about basic notions of mathematics that will be needed to understand what will be taught during the
semester (see section 5.3.7).
Figure 73. Page of TEAM1 in Moodle.

153
Figure 74. Honour board with the four best students in each mini-test.
There was an honour board where the photos of the four best students (grades) in every mini-test
were placed (see Figure 74).
The page also had a wiki where the teacher and students could post tips about software utilization
(which was not very used). There was also a forum that facilitated the communication among
everyone.
5.3.7 Links
The two links of figures (Figure 75 and Figure 76) go to web pages of Portuguese universities that,
for free, enable students to get a revision of basic mathematics that are fundamental to understand
mathematical analysis. There students may test their performance by a quiz and, if it is not good, they
get theory and exercises with immediate feedback that allows them to practice until they get a good
performance.

154
Figure 75. Web page of Instituto Superior Técnico to support students to get better formation in basic
mathematics: http://modulos.math.ist.utl.pt/
Figure 76. Web page of Faculadade de Ciências da Universidade do Porto to give support to students
about elementary mathematics: http://cmup.fc.up.pt/cmup/apoiomat/
In the beginning of the semester and many times during classes these links were strongly
emphasized. Many times that a student makes a question that reveals a deficit of previous knowledge
of mathematical principles the teacher explains very carefully those principles and reminds the
student that he may get a better performance if he uses one of those links.
The teacher saw once, during a quiz, a student go to one of those sites (presumably to clarify a
doubt). That made to conclude that probably he had already used this site to make a revision of basic
mathematics.
The Other Classes 5.4
All the other classes, other than TEAM1, were taught as lectures with teacher writing on the
blackboard, explaining what he was doing and asking questions to students about what he was

155
writing. This includes the other two classes that were taught by the researcher (me), however, since
she have used, from a long time ago, a teaching method that promotes active learning, it was very
difficult for her to use the lecture method. She did not promoted active learning but the repeating
students knew my method and tried to do an active and autonomous learning, ending up by dragging
the new colleagues. In addition, she used as guiding thread her usual slides that encourage active
learning by itself. Although she do not directly encouraged active learning, not using in the classroom
expressions like: "Get to work!", "It ought to be you to do it!”, "If you do not do it, you will not
realize the difficulty!", etc., it was generated, in these lessons, an atmosphere in which learning was
much more autonomous and active than in the other traditional classes.
However, the researcher had the concern of closing the page of TEAM1 to visitors to make sure
that the other students did not have easy access to the ILDs and quizzes in Moodle. Also, neither used
applets nor files in the classroom. Did not show applications of mathematics. And avoided, as much
as possible, to circulate around the room to answer questions.
Instruments 5.5
Here are described the instruments used to evaluate the approach.
5.5.1 Focus groups
Two focus groups were organized, the first one with six students and the second one with seven. They
were combined according to the availability of students to attend in each time. Both were performed
at the beginning of the following semester. The aim was to understand what students of TEAM1 felt
about the class, its objectives and methods, to obtain interesting questions to evaluate in the TEAM1
questionnaire.
The biggest highlight of the focus group was the importance given by students to quizzes in
Moodle, because it gives immediate feedback and because it forces them to keep up to date. In
appendix B is the guide of themes to talk about in the focus groups. The videos of focus groups are in
the site that supports this PhD, https://sites.google.com/site/sandragasparmartins/.

156
5.5.2 Questionnaires
Two questionnaires were conducted online using Moodle. One was addressed to TEAM1 students
and wanted to know the way students look at the class: why they came to the class, what they think
about materials, quizzes and the teaching method; how students behave; how they relate to each
other; etc. The other questionnaire, addressed to all AM1students, allowed the comparison of TEAM1
students with the others, in terms of background and attitudes, about their past as student and about
their present as AM1 students.
The questionnaires were carefully made having in mind Cohen et al. (2005, p. 245) indications.
For example, to measure attitudes was used a Likert scale with seven points ranging from Strongly
Disagree to Strongly Agree; was made a pilot questionnaire (of AM1) to tree students, mainly to
increase the reliability, validity and practicability of the questionnaire.
As for the questionnaire of AM1: all AM1 students were invited to answer by repeated messages
sent by the forum of AM1 in Moodle during the whole following semester, and 104 of the 519
subscribed students answered.
About the questionnaire of TEAM1: all TEAM1 students answered (to this questionnaire and to
the AM1 questionnaire) after a strong pressure by email, by phone and even by Facebook.
5.5.3 Tests and exams
The assessment of AM1 students is made by three tests during the semester; or by the first final exam;
or by the second final exam. TEAM1 students were assessed in the same way (the only difference
was that if they got approval on “traditional” assessment, they got an extra maximum of two values
proportional to the average of the ten best results of quizzes). The tests/exams were created by the
course responsible without any intervention of the others teachers (in most of them, the teacher only
saw the test/exam a few hours before the examination of the students).
Those tests/exams are completely in traditional way, do not involve applications, do not allow the
use of computers nor even calculators, do not test graphical nor numeric understanding, students do
not need to interpret results, essentially they are based on following some procedures with a level of
demand that I classify as high. The tests are in Appendix A.

157
In this study the ActivMathComp approach (actively learning mathematics using computer) was
applied to a non-ordinary class: TEAM1 (Turma Experimental de Análise Matemática 1/
Experimental Class of Mathematical Analysis 1), and the results of those students were compared
with the results of the others students of AM1 (Análise Matemática 1/ Mathematical Analysis 1).
This chapter presents and analyses the data collected during this study. This chapter is divided into
four parts. In part A the formal data is used to compare grades and success rate of TEAM1 with the
other students. In part B the data, gathered at the questionnaire to all AM1 students, is analysed to
compare TEAM1 students with the other students in general characteristics, background, behaviour
and grades. In part C is presented the data of questionnaire made to TEAM1 students, to find the
evaluation that TEAM1 students make of the approach; the reasons that made students participate/not
participate in TEAM1 are studied; and the qualitative data about the teacher’s view of the class are
also presented. In part D the main research question (comparison of grades and success rate) is
discussed; the secondary questions are not discussed since they are straightforward.
Introduction 6.1
The participants of this study, which took place on the first semester of 2009/2010, were the 519
students of the regular course of AM1 at ISEL – part of the Polytechnic Institute of Lisbon –
including a class of 16 students that were subjected to the intervention and are labelled as TEAM1. Of
6 Data Analysis, Results and
Discussion

158
the original 16 subscribed students, one quit the Institute during the study, so 15 students ended up
answering the questionnaires and participating in the proposed activities (See Figure 77).
Figure 77. Distribution of AM1 students.
Of the 519 students enrolled at AM1, 295 went to one examination, around 380 went to class once
and around 200 went regularly to class. Many are called 'ghost students' due to the fact that they have
failed once or twice and now, they neither come to classes, nor to exams. Though many are formally
enrolled, they do not actually try to get approbation to the course (I think that they postpone semester
after semester until they cannot postpone anymore… until they are nearly in the last semester).
Since we do not know how many students would naturally be in TEAM1 and would not go to
assessment, it does not make sense to take into account those students (assigning to them grade 0).
Then only the students that went, at least, to one assessment will be taken into account.
The following sources were used to get data about the students (see Figure 77):
the formal records of the Institute supplied data about the students subscribed, assessed,
approved, and their final grades at AM1;
a questionnaire administered online at the end of the semester to all 519 students subscribed
to AM1, and answered by 104 of them including 15 students of TEAM1 supplied data about
students personal characteristics, background, and attitudes;
159
a questionnaire administered online at the end of the semester to the TEAM1 students and
answered by all supplied feedback about their own view of TEAM1.
Some Characteristics of the Statistical Procedures Used in the 6.2
Chapter
Statistical Package for the Social Sciences (SPSS) was the computer program used in order to
perform the statistical analysis. Below are described the statistical procedures used throughout this
chapter.
The Chi-square (two-sided) test is used in order to explore the relationship between two or more
categorical variables. Each of these variables may have two or more categories. This test compares
the observed frequencies, or proportions of cases, that occur in each of the categories, with the values
that would be expected if there was no association between the variables being measured. It is based
on a cross tabulation table, with cases classified according to the categories in each variable (e.g.
male/female; mathematics A/mathematics B) (Pallant, 2007). If the expected frequencies in the cross
table are fewer than 5 it is recommended to use the Fisher's Exact Test (2-sided) instead (Dancey &
Reidy, 2004). Both allow to study whether there is association between groups or variables.
ANOVA (Analysis of Variance) is also extensively used in this chapter. It allows comparisons
between two or more groups, analysing the different sources from which variation in the dependent
variable arises (Dancey & Reidy, 2004) . One-way ANOVA is applied to analyse the effect of one
factor (the independent variable) over the dependent variable. In order to perform one-way ANOVA
it is necessary to meet certain assumptions:
1. The values of the dependent variable must be drawn from a normally distributed
population. Shapiro-Wilk test evaluates this, and if the result is not significant the
assumption is true.
2. Homogeneity of variance. This means that the variances are similar for the different
groups. This is studied by Levene's test and if the result is not significant the assumption is
true (Dancey & Reidy, 2004).
160
According to Dancey and Reidy (2004) ANOVA is robust only for small variations in
assumptions. It is not robust if the groups are small or have a very different number of elements. In
these cases is used the equivalent non-parametric test, Mann-Whitney (for two groups).
To include one or more continuous variables that predict the outcome (or dependent variable) is
also used Analysis of covariance (ANCOVA), an extension of ANOVA that takes into consideration
these variables known as covariates that can also have an influence on the dependent variable.
To control the influence that covariates have on the dependent variable, first, a study is made
including the covariate and then another study is made without it. This allows analysing the effect that
an independent variable has after the effect of the covariate (Field, 2009).
There are two reasons to include covariates in ANOVA and thus getting ANCOVA. The first is to
reduce within-group error variance. The other reason is to eliminate confounds - variables that vary
systematically with the experimental manipulation. Once a possible confounding variable is
identified, it can be measured and entered into the analysis as a covariate. In this way the bias of that
variable is removed.
According to Tabachnick (2007, p. 218) “[SPSS GLM] perform ANCOVA with unequal sample
sizes” so it is not needed to search for an equivalent test. So the assumptions that need to be addressed
are both the same as the ones of ANOVA plus two (Field, 2009; Pallant, 2007):
1. Independence of the covariate and treatment effect. This means that the covariate should
not be different across the groups in the analysis. To meet this an ANOVA is made using
the groups as independent variable and the covariate as the dependent variable and if the
result is not significant the assumption is true (Field, 2009).
2. Homogeneity of regression slopes. This concerns the relationship between the covariate
and the dependent variable for each of the groups. What is verified is that there is no non-
interaction between the covariate and the treatment or experimental manipulation. A
procedure to test it is on Pallant (2007, p. 298). And if the result is not significant the
assumption is true.

161
Part A-Formal data
In part A the formal data will be explored. The formal data available about this course is only the
subscribed students and their grades gathered by the Institute’s office. With this data, the number of
assessed and approved students can also be obtained.
The grades of TEAM1 students will be compared with the grades of the others students (that went to
at least one assessment). Moreover will be studied the success rate, i.e., the rate of approved students
among the assessed (among the non-assessed ones comparisons do not make sense since completely
uninterested students had not subscribed to TEAM1.)
Success rate 6.3
The Table 2 shows that, at AM1, the success rate of TEAM1 almost doubled the success rate of the
others students.
Table 2. Quantity of students subscribed, assessed and approved by groups and success rate.
Subscribed Assessed Approved
TEAM1 16 14 9 64.3%
Others students (without TEAM1) 503 280 92 32.9%
Grades 6.4
This section reports the comparison of the grades of participants with the grades of the others students
of AM1, using the data of formal records. Grades mean the maximum grades rounded to one decimal
obtained by students who attended at least one assessment moment in that semester.
As Table 3 shows, the average grade of participants of the study (8.8 values) is much higher than
the average grade of the formal comparison group (5.7 values). The maximum grade also belongs to a
participant of the study (16.5 values).

162
Table 3. Comparison of AM1 grades between participants and the other students.
N Average
Std.
Dev.
Std.
Error
95% C. Interv. For Aver.
Min Max
Lower
Bound
Upper
Bound
Participants 14 8.8 4.8 1.3 6.0 11.6 0.7 16.5
Others students (without Partic.) 281 5.7 4.1 0.2 5.3 6.2 0.0 15.5
An ANOVA will be performed to study if there is a statistically significant difference between the
grades of participants and the grades of the others students of AM1. According to Dancey and Reidy
(2004, p. 291), there are two assumptions of ANOVA: grades must have a normal distribution and
must have homogeneity of variance.
Table 4 shows that grades do not have a normal distribution.
Table 4. Tests of normality of the grades of AM1 students.
Kolmogorov-Smirnov
a Shapiro-Wilk
Statistic df Sig. Statistic df Sig.
Grades at AM1 0.149 295 0.000 0.928 295 0.000
a. Lilliefors Significance Correction
Table 5 assures the homogeneity of variance of the grades of AM1 students.
Table 5. Test of homogeneity of variances of the grades of AM1 students.
Levene Statistic df1 df2 Sig.
0.404 1 293 0.526
The result of the one-way ANOVA (Table 6), is that is statistically significant the effect of the
group on the student’s grades F(1,293) = 7.35, p < 0.05.
Table 6. One-way ANOVA of the grades of AM1 students in both groups.
Sum of Squares df Mean Square F Sig.
Between Groups 124.4 1 124.4 7.302 0.007
Within Groups 4992.3 293 17.0
Total 5116.7 294

163
As the normality of the variable is not warranted (Table 4) and the number of participants is very
small and much less than the number of the “others students” so ANOVA may not be completely
robust. Then a nonparametric test equivalent to ANOVA, the Mann-Whitney test will be performed.
The result of the Independent-Samples Mann-Whitney U test is p = 0.014, leads us to reject the
null hypothesis which states that “the distribution of grades is the same across groups”. In other
words, the nonparametric test also ensures that there is a significant effect of the group on the
students’ grades, p < 0.05.
Therefore, it may be surely concluded that the grades of Participants are higher than the grades of
the others students of AM1.
Part B- Data from AM1 questionnaire
In this part the data obtained from the questionnaire presented to all 519 students of AM1 and
answered by 104 of them (including the 15 students of TEAM1) will be used. The purpose of this
questionnaire was to make a general characterization of AM1 students in order to identify some
special characteristic of TEAM1 students that may be responsible for their difference of grades
compared to the others students.
Will be studied the general characterization of students, their behaviour and results in secondary
school and in the LEC (Graduation in Civil Engineering) and their characterization as students of
AM1.
Since we are interested in grades and we do not know how many students would naturally be in
TEAM1 and would not go to assessment, we will only study assessed students. Then will be called
Comparison group (See Figure 78) to the group of students of AM1 that answered the questionnaire,
went (at least) to one assessment and did not belonged to TEAM1; will be called Participants to those
students that belonged to TEAM1 (assessed and that answered the questionnaire).

164
Figure 78. Distribution of AM1 students.
General Characterization of Students 6.5
This section shows that there are no statistically significant differences between the participants and
the comparison group in terms of gender and attitudes towards computers. But in terms of age,
participants are significantly older, and in terms of the number of working students, participants have
significantly more of them.
6.5.1 Age
Table 2 presents the differences between the participants and the comparison group students in terms
of age.
Table 7. Average of students age, by group.
Participants
(N = 13)
Comparison Group
(N = 53)
Age (average) 25.0 20.8

165
The results of the one-way ANOVA, F (1,64) = 9.935, p = 0.002 < 0.05, show a significant
difference between the ages of the participants and the ages of the comparison group. The participants
of the study were older than the students of the comparison group.
6.5.2 Gender
This section studies gender differences among participants and students of the comparison group,
see Table 8.
Table 8. Quantity of students of each gender by group.
Participants
(N = 14)
Comparison group
(N = 53)
Male 11 78.6% 37 69.8%
Female 3 21.4% 16 30.2%
Because 25% of the expected frequencies are less than 5, instead of Chi-square test the most
appropriate test is the Fisher's Exact Test (two-sided) (Dancey & Reidy, 2004) . Under this test, as
p = 0.388 > 0.05, there is no significant association between gender of the students and the group they
belong to. Thus the conclusion is that participants and students of the comparison group are equally
distributed in terms of gender.
6.5.3 Working students
This section compares students’ responses about being working students or not, in both groups. See
Table 9.
Table 9. Working students, by group.
Participants
(N = 14)
Comparison group
(N = 53)
Working students 8 57.1% 11 20.8%
Full-time students 6 42.9% 42 79.2%
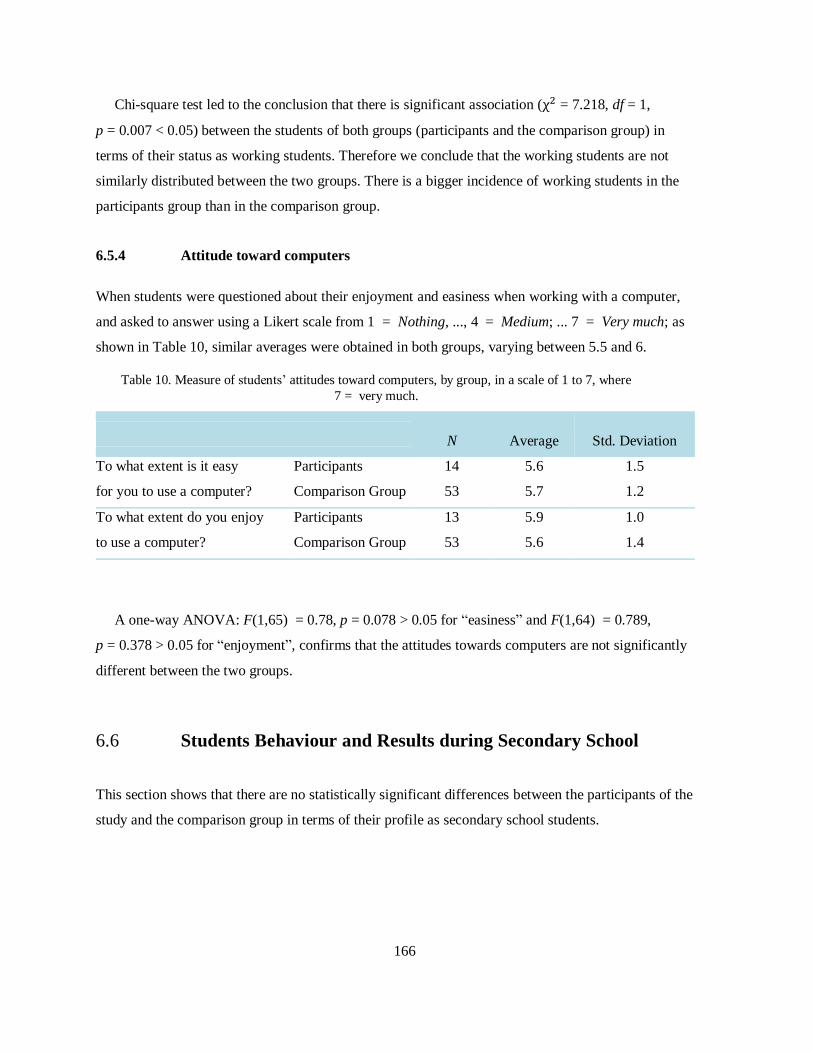
166
Chi-square test led to the conclusion that there is significant association ( = 7.218, df = 1,
p = 0.007 < 0.05) between the students of both groups (participants and the comparison group) in
terms of their status as working students. Therefore we conclude that the working students are not
similarly distributed between the two groups. There is a bigger incidence of working students in the
participants group than in the comparison group.
6.5.4 Attitude toward computers
When students were questioned about their enjoyment and easiness when working with a computer,
and asked to answer using a Likert scale from 1 = Nothing, ..., 4 = Medium; ... 7 = Very much; as
shown in Table 10, similar averages were obtained in both groups, varying between 5.5 and 6.
Table 10. Measure of students’ attitudes toward computers, by group, in a scale of 1 to 7, where
7 = very much.
N Average Std. Deviation
To what extent is it easy
for you to use a computer?
Participants 14 5.6 1.5
Comparison Group 53 5.7 1.2
To what extent do you enjoy
to use a computer?
Participants 13 5.9 1.0
Comparison Group 53 5.6 1.4
A one-way ANOVA: F(1,65) = 0.78, p = 0.078 > 0.05 for “easiness” and F(1,64) = 0.789,
p = 0.378 > 0.05 for “enjoyment”, confirms that the attitudes towards computers are not significantly
different between the two groups.
Students Behaviour and Results during Secondary School 6.6
This section shows that there are no statistically significant differences between the participants of the
study and the comparison group in terms of their profile as secondary school students.
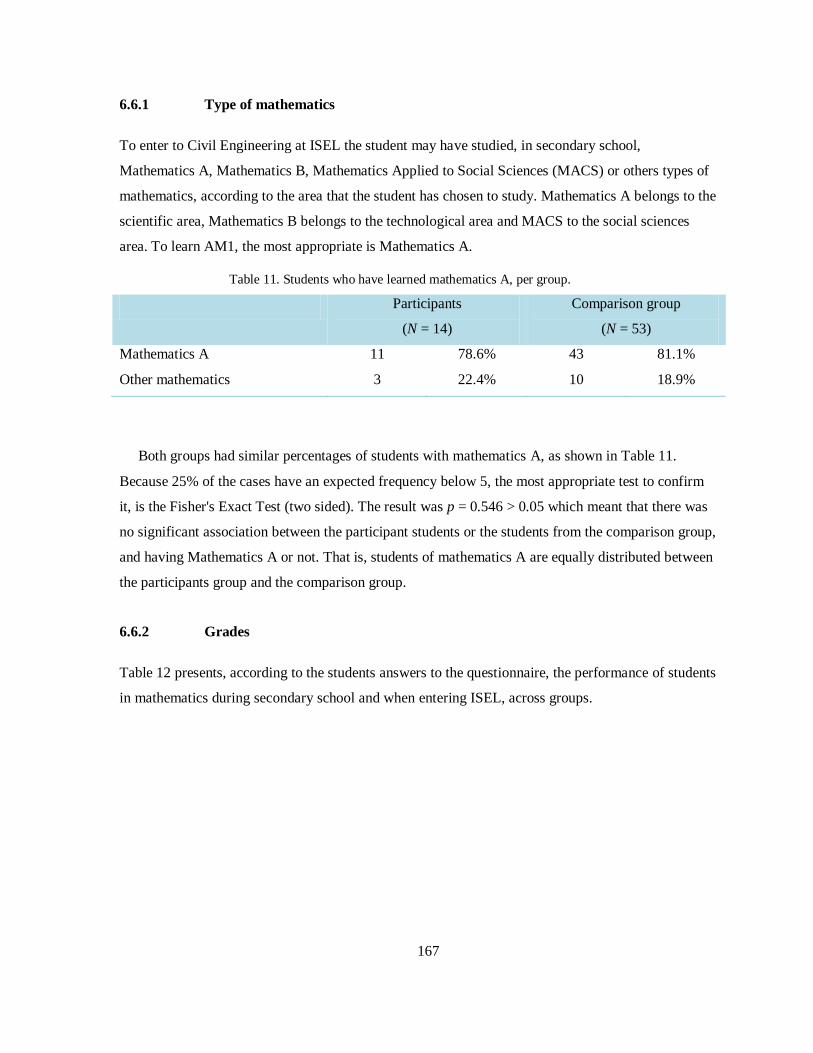
167
6.6.1 Type of mathematics
To enter to Civil Engineering at ISEL the student may have studied, in secondary school,
Mathematics A, Mathematics B, Mathematics Applied to Social Sciences (MACS) or others types of
mathematics, according to the area that the student has chosen to study. Mathematics A belongs to the
scientific area, Mathematics B belongs to the technological area and MACS to the social sciences
area. To learn AM1, the most appropriate is Mathematics A.
Table 11. Students who have learned mathematics A, per group.
Participants
(N = 14)
Comparison group
(N = 53)
Mathematics A 11 78.6% 43 81.1%
Other mathematics 3 22.4% 10 18.9%
Both groups had similar percentages of students with mathematics A, as shown in Table 11.
Because 25% of the cases have an expected frequency below 5, the most appropriate test to confirm
it, is the Fisher's Exact Test (two sided). The result was p = 0.546 > 0.05 which meant that there was
no significant association between the participant students or the students from the comparison group,
and having Mathematics A or not. That is, students of mathematics A are equally distributed between
the participants group and the comparison group.
6.6.2 Grades
Table 12 presents, according to the students answers to the questionnaire, the performance of students
in mathematics during secondary school and when entering ISEL, across groups.

168
Table 12. Students’ grades at mathematics during secondary school and entrance grade to ISEL, per
group.
N Average Std. Deviation Min Max
Math10 Participants 14 14.1 2.1 11 17
Comparison Group 51 13.1 2.3 8 18
Math11 Participants 13 14.1 2.2 10 16
Comparison Group 51 13.3 2.2 9 18
Math12 Participants 14 13.9 1.8 11 17
Comparison Group 52 13.7 2.3 10 20
GradeToISEL Participants 12 13.9 1.6 12 17
Comparison Group 50 14.0 1.4 11 18
The results of One-way ANOVA for each variable are:
F(1,63) = 2.18, with p = 0.145 to 10th grade mathematics;
F(1,62) = 1.37, with p = 0.246 to 11th grade mathematics;
F(1,64) = 0.09, with p = 0.763 to 12th grade mathematics;
F(1,60) = 0.01, with p = 0.925 to entrance grade into ISEL.
This leads one to conclude that there is no significant difference (p > 0.05) neither in the
performance of students during secondary school, nor in the entrance grade into ISEL, by groups.
6.6.3 Hours spent studying
The number of hours that students have indicated as having studied, for all subjects, during their 12th
grade (last year), per week, not counting time spent in classes, are shown in Table 13, by groups.
Table 13. Number of students spending a given number of hours studying, in the 12th grade, per group.
Participants
(N = 13)
Comparison group
(N = 51)
Hours of study during 12th grade
per week (extra classes)
0-2 hours 3 23.1% 16 31.4%
2-5 hours 8 61.5% 19 37.3%
5-40 hours 2 15.4% 16 31.4%

169
In order to ascertain whether there was an association between the groups of students and the
number of hours spent studying during 12th grade per week, a test was taken. A 2 3 chi-square (two-
sided) test ( 2.63, df = 2, p = 0.269) indicates that this association is not significant (p > 0.05).
The reliability of this study is not guaranteed since more than 20% of the cells have expected
frequency below 5.
Students Behaviour and Results at LEC 6.7
This section indicates that there are no statistically significant differences between the participants
and the comparison group when it comes to their attitudes and performance as students of the Civil
Engineering Undergraduation (Licenciatura em Engenharia Civil – LEC).
6.7.1 Profile in LEC
This section focuses on the profile of students at LEC. It focuses on how long the students have been
studying at LEC - number of semesters - that also corresponds to how long they have been enrolled at
AM1, since this is a course that is taken during their first semester; the number of courses for which
they have obtained approval; and the number of semesters for which they were still strongly
committed to obtain approval in AM1 in the middle of the semester (did not decide to give up AM1 in
the middle of the semester).
Table 14. Students profile in LEC by group.
N Average Std. Dev. Min Max
Semesters in ISEL =
semesters in AM1
Participants 13 5.2 1.4 3 9
Comparison Group 53 3.3 2.0 2 10
Number of approved
courses in ISEL
Participants 13 14.1 8.6 0 32
Comparison Group 51 6.5 4.8 1 20
Ratio: approved courses Participants 12 2.9 1.3 1.2 5.3
/semesters Comparison Group 51 2.1 1.2 0.2 6
Number of semesters with
commitment in the middle of
the semester.
Participants 13 1.9 1.0 0 3
Comparison Group 51 1.6 1.0 0 4

170
The results of a one-way ANOVA for each variable were:
F(1,64) = 10.92, p = 0.002 < 0.05 for “Semesters in ISEL”;
F(1,62) = 18.27, p = 0.000 < 0.05 for “Number of approved courses”;
F(1,61) = 3.89, p = 0.053 > 0.05 for “Ratio: Number of approved courses/semesters in
LEC”.
F(1,62) = 1.26, p = 0.266 > 0.05 for “Number of semesters with commitment at middle of
the semester.”
To conclude, participant students have spent significantly more time at LEC – and in AM1– and
have also more courses with approval, than the comparison group. However there is no statistically
significant difference on the ratio between the number of approved courses and the number of
semesters spent studying at LEC, across groups. This way, it may be concluded that their
performance in LEC is similar across groups.
As for the number of semesters during which students were still committed to pass AM1 in the
middle of the semester, there are not significant differences across groups.
6.7.2 Lessons attended in LEC
This section relates to the amount of lessons that students claim to have attended in the LEC. Table 15
shows the differences among participants of the study and students of comparison group.
Table 15. Students attending a given percentage of LEC lessons, per group.
Participants
(N = 14)
Comparison Group
(N = 53)
Lessons attended in LEC 0-70% 3 21.4% 5 9.4%
70-90% 7 50.0% 16 30.2%
90-100% 4 28.6% 32 60.4%
The result of the 2 × 3 chi-square test ( 4.686, df = 2, p = 0.096) indicates that there is no
association between the group to which students belong and the percentage of LEC lessons attended
by the students (it is not guaranteed since more than 20% of the cells have expected cell counts less
than 5).

171
6.7.3 Time spent studying in LEC when there are no exams
This section presents the amount of time that students have spent studying to all classes in LEC when
there are no exams (during non-exams period). Table 16 shows the differences of time spent studying
among students participating in the study and students of the comparison group. The time is
accounted by week and without counting the time spent in classes.
Table 16. Number of students studying a given number of hours, per week, not counting time spent in
classes, when there are no exams, per group.
Participants
(N = 14)
Comparison Group
(N = 53)
Study in LEC 0-5 hours 2 14.3% 18 34.0%
5-10 hours 5 35.7% 18 34.0%
10-60 hours 7 50.0% 17 32.0%
The result of the 2 3 chi-square test made to evaluate the relationship between the two groups,
was 2.44, df = 2, p = 0.295. The reliability of the test is not assured since there are more than
25% of the cells with expected frequency below 5 (Dancey & Reidy, 2004). Anyway, this test gives
us an indication that there is no association between the group of students and the amount of time
spent studying at LEC.
6.7.4 Time spent studying in LEC during exams period
This section is about the amount of time that students say that have spent studying during exams
period and their differences by group. Table 17 shows the differences of study habits among the
students participating in the study and the students from the comparison group.
Table 17. Number of students studying a given number of hours, per week, during exams period, per
group.
Participants
(N = 13)
Comparison Group
(N = 53)
Study in LEC
during exams period
0 - 25 hours 5 38.5% 21 39.6%
25 - 40 hours 4 30.8% 22 41.5%
40 hours or more 4 30.8% 10 18.9%

172
In order to understand the relationship between the students from the TEAM1 and the students
from the comparison group, when it comes to the amount of time they claim to study during exams
period in the LEC, a 2 × 3 chi-square test ( 1.006, df = 2, p = 0.605) was performed indicating
that there is no association between the group of students and the number of hours they have spent
studying during the exams period (there is no guaranty in this result since more than 20% of cells
have expected cell counts less than 5).
AM1 Study 6.8
This section reports the existence of statistically significant differences between the students
participating in the study and the comparison group when it comes from their profile as students of
AM1 (Mathematical Analysis 1/Análise Matemática 1) and their evaluation of AM1. Here, the reader
should have in mind that these differences may, or may not, have been generated by the intervention
itself.
6.8.1 AM1 missed lessons
This section, as well as Table 18, is about the number of AM1 lessons that students say they have
missed.
Table 18. Number of students that have missed a given amount of AM1 lessons.
Participants
(N = 14)
Comparison Group
(N = 50)
AM1 missed lessons 1 - 4 classes 9 64.2% 19 38.0%
5 - 12 classes 4 28.6% 22 44.0%
13 - all classes 1 7.1% 9 18.0%
The result of the 2 3 Chi-square test ( 3.19, df = 2, p = 0.203) indicates that there is no
association between the group that students belong to, and the number of AM1 lessons that they say
they have missed (there is no guaranty in this result since more than 20% of cells have expected cell
counts less than 5).

173
6.8.2 Amount of time spent studying for AM1
Table 19 summarizes the AM1 students’ answers when it comes to the amount of time they say they
have spent studying for AM1. The table entry: “hours of study per week” means “the average number
of hours spent studying AM1 per week, when there are no exams, and without counting the time spent
in class”. The other table entries are complete.
Table 19. Number of hours spent studying AM1, per group.
Group N Average Std. Dev.
Hours of study per week
(when there are no exams)
Participants 13 10.8 7.2
Comparison Group 48 7.1 14.3
Days of study before exam1
(if applicable)
Participants 7 9.0 4.5
Comparison Group 31 8.7 6.5
Days of study before exam2
(if applicable)
Participants 3 14.0 6.6
Comparison Group 26 7.9 5.8
The results of a one-way ANOVA for each variable were:
F(1,59) = 0.84, p = 0.365 for “Hours of study per week”;
F(1,36) = 0.02, p = 0.892 for “Days of study before exam1”;
F(1,27) = 3.01, p = 0.094 for “Days of study before exam2”.
To conclude, there are no statistically significant differences (p < 0.05) on the amount of hours
spent studying between the participants and the comparison group.
6.8.3 Students commitment towards AM1
Table 15 summarizes students commitment towards AM1 across groups when it comes from
assiduity, punctuality, attention and commitment, assessed by the students themselves, in a scale of 1
(Totally disagree) to 7 (Totally agree).

174
Table 20. Students commitment towards AM1 in a scale of 1 (Totally disagree) to 7 (Totally agree).
Group N Average Std.Dev.
“I was assiduous to classes” Participants 14 5.1 0.9
Comparison Group 52 4.7 2.1
“I was punctual to classes” Participants 14 5.9 1.0
Comparison Group 52 5.2 2.2
“I’ve paid attention to classes” Participants 14 5.7 0.7
Comparison Group 52 4.9 1.8
“I was committed” Participants 14 5.3 1.2
Comparison Group 52 4.4 1.7
The results of the five one-way ANOVAs when it came to study the differences between groups
were:
F(1,64) = 0.34, p = 0.562 for “assiduity”;
F(1,64) = 1.04, p = 0.312 for “punctuality”;
F(1,64) = 2.84, p = 0.097 for “attention”;
F(1,64) = 3.03, p = 0.087 for “commitment”.
This leads to the conclusion that there is no significant difference (p < 0.05), according to the
students self-assessment, in terms of assiduity, punctuality, attention and commitment among the
participants and the comparison group.
6.8.4 AM1 study methods
This section deals with the students study methods across groups. In Table 21 the differences between
the participants and the comparison group are addressed, when it comes to keeping up with classes,
studying a lot or not at all, using or not the support material and looking for clarifying doubts
whenever they need. The students answers are given on a scale of 1 (Totally disagree) to 7 (Totally
agree).

175
Table 21. Students study methods across groups, evaluated on a scale of 1 (Totally disagree) to 7
(Totally agree).
Group N Average Std. Dev.
“I kept up with lesson” Participants 14 5.5 0.7
Comparison Group 52 4.4 2.0
“I studied a lot” Participants 14 4.6 1.3
Comparison Group 52 3.4 1.8
“I used materials” Participants 14 5.3 1.5
Comparison Group 52 4.8 1.9
“I clarified doubts” Participants 14 4.9 1.9
Comparison Group 51 3.7 2.2
The results of four one-way ANOVAs, when it came to finding the differences between the groups
were:
F(1,64) = 3.76, p = 0.057 for “Kept up with lesson”;
F(1,64) = 5.53, p = 0.022 for “Studied a lot”;
F(1,64) = 0.68, p = 0.412 for “Used materials”;
F(1,63) = 3.61, p = 0.062 for “Clarified doubts”.
The conclusion is that, according to the students’ answers to the questionnaire, in general, there
was not a significant difference (p < 0.05) between the participants and the comparison group, when it
came to their study methods. The only significant difference between the groups was on the “I studied
a lot” answer, where the participants of the study had a bigger score than the comparison group.
6.8.5 Relationship with AM1
The differences between participants and the comparison group in terms of understanding the subject,
interest by the subject, liking teaching method, liking assessment method, and giving priority to AM1
are shown in Table 22. The students answers are given on a scale of 1 (Totally disagree) to 7 (Totally
agree).

176
Table 22. Students relationship with AM1, across groups, in a scale of 1 (Totally disagree) to 7 (Totally
agree).
Group N Average Std. Dev.
“I easily understand the subject” Participants 14 4.4 1.1
Comparison Group 52 3.4 1.7
“I’m interested in the subject” Participants 14 5.0 1.3
Comparison Group 52 4.0 1.9
“I liked the teaching method” Participants 14 5.6 1.4
Comparison Group 52 4.1 2.0
“I liked the assessment method” Participants 14 5.4 1.5
Comparison Group 52 4.4 2.0
“I gave priority to AM1” Participants 14 5.1 1.6
Comparison Group 52 4.1 2.5
The results of five one-way ANOVAs to look for differences by group are:
F(1,64) = 3.76, p = 0.057 for “I easily understand the subject”;
F(1,64) = 3.17, p =0.080 for “I’m interested in the subject”;
F(1,64) = 6.85, p = 0.011 for “I liked teaching method”;
F(1,64) = 3.44, p = 0.068 for “I liked assessment method”;
F(1,64) = 2.34, p = 0.131 for “I gave priority to AM1”.
The conclusion is that there is a statistically significant (p < 0.05) difference in the way students
like the teaching method of TEAM1 when compared with the other group. Participant students
indicate they like more the teaching method more than the students of comparison group. The other
items are not significantly different between the two groups.
6.8.6 External support to AM1
Table 23 shows the differences between participants and comparison group in terms of their
evaluation of materials utility, teacher support in class, and teacher support out of class. The students’
answers are given on a scale of 1 (Totally disagree) to 7 (Totally agree).

177
Table 23. Students’ evaluation of external support to AM1, across groups, in a scale of 1 (Totally
disagree) to 7 (Totally agree).
Group N Average Std. Dev.
“Materials were useful to me” Participants 14 5.6 1.3
Comparison Group 52 4.0 2.1
“I liked teacher support in class” Participants 14 6.1 1.7
Comparison Group 52 4.3 2.4
“I liked teacher support out of class” Participants 14 6.1 1.1
Comparison Group 51 4.1 2.5
The results of three one-way ANOVAs to look for differences between groups are:
F(1,64) = 8.08, p = 0.006 for “utility of materials”;
F(1,64) = 7.10, p = 0.010 for “support of teacher in class”;
F(1,63) = 8.35, p = 0.005 for “support of teacher outside the class”.
The conclusion is that there are statistically significant differences (p < 0.05) in external support
between participants of the study and students in the comparison group. Participants appreciated more
the external support than students of the comparison group.
Grades of AM1 6.9
This section reports the difference in grades of AM1 between participants and the comparison group.
As this is the statistical result with more relevance (the answer to the main research question), it is
treated with special attention (more statistical tests to ensure validity).
Grades mean the maximum grades (in a scale of 1 to 20) rounded to the unit, obtained by the
respondents to the questionnaire in that semester.
6.9.1 Grades by group
This section addresses the grades of students (respondents to the questionnaire); makes its comparison
across groups (the participants group and the comparison group).

178
Table 24 shows that, for the questionnaire respondents, the average grade of participants (9.1
values) is much higher than the average grade of the students belonging to the comparison group (5.5
values). The maximum grade also belongs to a participant of the study (17 values).
Table 24. Grades of students respondent to questionnaire, per group.
N Average
Std.
Dev.
Std.
Error
95% C. Interv. for Average
Min Max Lower Bound Upper Bound
Participants 14 9.1 5.0 1.3 6.2 11.9 1 17
Comparison Group 53 5.5 3.8 0.5 4.5 6.6 0 14
An ANOVA will be performed to study if there is a statistically significant difference between
grades of participants and grades of students belonging to the comparison group. According to
Dancey and Reidy (2004, p. 291) there are two assumptions of one-way ANOVA: grades should have
a normal distribution and should have homogeneity of variance.
Grades do not have a normal distribution, as can be seen in Table 25, since p < 0.05.
Table 25. Tests of normality of the grades of AM1' students.
Kolmogorov-Smirnov
a Shapiro-Wilk
Statistic df Sig. Statistic df Sig.
Grades at AM1 0.135 67 0.004 0.931 67 0.001
a. Lilliefors Significance Correction
By the analysis of Table 26, since p > 0.05, the homogeneity of variance is guaranteed.
Table 26. Test of homogeneity of variances of the grades of AM1' students.
Levene Statistic df1 df2 Sig.
1.765 1 65 0.060
According to the one-way ANOVA (Table 27), there was a significant effect of the group on the
student’s grades F(1,102) = 19.60, p < 0.05.
Table 27. One-way ANOVA of the grade of the students of AM1 in both groups
Sum of Squares df Mean Square F Sig.
Between Groups 140.5 1 140.5 8.550 0.005
Within Groups 1068.2 65 16.4
Total 1208.7 66

179
As the assumption of normality does not hold and the number of participants is small and much
smaller than the number of students of the comparison group, the ANOVA may not to be completely
robust (Dancey & Reidy, 2004) . To avoid this, a non-parametric test, the Mann-Whitney U test,
equivalent to ANOVA will be performed.
The result of the Independent-Samples Mann-Whitney U Test is p = 0.011 < 0.05 which makes to
reject the null hypothesis: “the distribution of grades is the same across groups”. In other words, the
non-parametric test also ensures that there is a significant effect of the group on student’s grades.
The conclusion is that the grades of participants are higher than those of the comparison group, for
the students that answered the questionnaire.
6.9.2 Grades by group, with background as covariate
Some topics may affect students’ performance at AM1. This section shows how student’s
performance would be if they had no difference in background, this means, if they were equal in
grade of mathematics at 12th grade of school, in grade to ISEL entrance, and in amount of time spent
studying to graduation.
An Analysis of Covariance (ANCOVA) is performed to correct the grades. This procedure adjusts
by regression the grades, matching the students to each other in their mathematics’ grade of 12th
grade of school, in their grade to ISEL entrance and in their quantity of hours spent studying to
graduation. In other words, it evaluates by regression which would be the average grades if the
individuals had no differences at the beginning.
According to Field (2009) two assumptions need to be verified to apply ANCOVA. The first
assumption is the independence of covariate and treatment effect. It is used to check that covariate is
not different across groups. To ensure that will be made ANOVAs with groups as independent
variables and covariates as outcomes.
According to Table 28 there are no significant differences in any case, so the first assumption is
verified.

180
Table 28. One-way ANOVAs of the covariates of the grade of the students of AM1 in both groups (the
participants group and the comparison group).
Sum of
Squares df
Average
Square F Sig.
Grade at Math in 12th grade
of school
Between Groups 0.4 1 0.4 0.092 0.763
Within Groups 301.2 64 4.7
Total 301.6 65
Grade to ISEL entrance Between Groups 0.0 1 0.0 0.009 0.925
Within Groups 120.8 60 2.0
Total 120.9 61
Hours of study in LEC, per
week, without counting
lessons
Between Groups 3.4 1 3.381 2.280 0.136
Within Groups 96.4 65 1.483
Total 99.8 66
Table 29. Tests of Between-Subject Effects of grades between group and the covariates.
Source Type III Sum
of Squares df
Mean
Square F Sig.
Partial Eta
Squared
Corrected Model 296.9a 7 42.4 2.770 0.016 0.264
Intercept 19.4 1 19.4 1.267 0.265 0.023
Group 8.4 1 8.4 0.552 0.461 0.010
Math12 15.7 1 15.7 1.026 0.316 0.019
Grade to ISEL 3.0 1 3.0 0.194 0.661 0.004
StudyLEC 23.9 1 23.9 1.561 0.217 0.028
Group * Math12 0.1 1 0.1 0.003 0.953 0.000
Group * Grade to ISEL 11.2 1 11.2 0.731 0.396 0.013
Group * Study LEC 8.8 1 8.8 0.574 0.452 0.011
Error 826.6 54 15.3
Total 3743.0 62
Corrected Total 1123.5 61
a. R Squared = .300 (Adjusted R Squared = .240)

181
The second assumption is the homogeneity of regression slopes and concerns the relationship
between the covariate and the dependent variable for each of the groups. It is desirable that there is no
interaction between the covariate and the treatment.
Since the interaction terms are not significant (p > 0.05), see Table 29, the second assumption is
verified (Pallant, 2007, p. 299). And, since both assumptions are verified the test of analysis of
covariance (ANCOVA) will be applied.
Table 30. ANCOVA (Tests of Between-Subject Effects) with grades as dependent variable, group as
fixed factor and grade at Mathematics in 12th grade of school; Grade to ISEL entrance; and level of
study at 12th grade of school as covariates.
Source Type III Sum
of Squares df Mean Square F Sig.
Partial Eta
Squared
Corrected Model 278.0a 4 69.5 4.686 0.002 0.247
Intercept 25.9 1 25.9 1.743 0.192 0.030
Math12 41.6 1 41.6 2.802 0.100 0.047
Grade to ISEL 17.0 1 17.0 1.147 0.289 0.020
Study LEC 14.2 1 14.2 0.954 0.333 0.016
Group 208.8 1 208.8 14.074 0.000 0.198
Error 845.5 57 14.8
Total 3743.0 62
Corrected Total 1123.5 61
a. R Squared = .259 (Adjusted R Squared = .225)
The result of ANCOVA (Table 30) is that there is a significant effect on grades of belonging at
participants after controlling for the effect of grades at mathematics of 12th grade of school, grades to
enter ISEL and on level of study in LEC, F(1,57) = 14.07, p < 0.05, partial eta squared = 0.198.
Table 31. Estimates of average grade across groups.
Group
Average Std. Error
95% Confidence Interval
Lower Bound Upper Bound
Participants 10.4 a 1.1 8.1 12.7
Comparison Group 5.6a 0.5 4.5 6.7
a. Covariates appearing in the model are evaluated at the following values: Math12 = 13.92. GradeToISEL = 13.95,
StudyLEC =3.15.

182
According to Table 31, the adjusted averages are of 10.4 values to participants and 5.6 values to
the comparison group. The difference is bigger than with the simple averages that were 9.1 values and
5.5 values, respectively.
Note: It is tempting to proceed to more ANCOVAs using as covariate some items like age, being
working students, the number of semesters at which they are in ISEL, etc. However it is not correct to
use those items as covariates since the ANOVAs that we realized to study the variation of those items
by group, in the previous sections were significant (Field, 2009, p. 398).
6.9.3 Grades by group, among students that are 19 years old or more
Participants of the study all are 19 years old or more. This section reports the comparison of the
grades of participants with all the others students of the comparison group (assessed students that
answered the questionnaire) that have 19 years old or more (according to students’ response to the
questionnaire).
Table 32. Grades of AM1’students that have 19 years old or more.
N Average Std. Deviation
TEAM1 14 9.1 1.3
Students of AM1 with 19 years old or more 40 5.9 0.6
Table 32 shows that participants have higher average than the others.
Table 33. ANOVA of grades of students with 19 years old or more, across groups.
Sum of Squares df Mean Square F Sig.
Between Groups 101.3 1 101.3 5.483 0.023
Within Groups 960.4 52 18.5
Total 1061.6 53
The conclusion of ANOVA (Table 33) is that the difference between the grades of participants and
the grades of the other students are significant (p < 0.05).

183
6.9.4 Grades by group, among students that are in ISEL for three or more semesters
Participants of the study were all in ISEL/AM1 for three or more semesters. This section reports the
comparison of the grades of participants with all the other students of the comparison group (assessed
students that answered the questionnaire) that were in ISEL for three or more semesters (according to
students’ response to the questionnaire).
Table 34. Grades of AM1’students that are in ISEL for 3 or more semesters.
N Average Std. Deviation
TEAM1 13 9.6 4.4
Students in ISEL/AM1 for 3 or more semesters 24 7.0 4.5
Table 32 shows that participants have higher average than the others.
Table 35. ANOVA of grades of students for three or more semesters in AM1, across groups.
Sum of Squares df Mean Square F Sig.
Between Groups 59.5 1 59.5 3.002 0.092
Within Groups 694.0 35 19.8
Total 753.6 36
The conclusion of ANOVA (Table 33) is that the difference between the grades of participants and
the grades of the other students is not significant (p > 0.05).
6.9.5 Grades by group, among students that are not in evening classes
As the evening classes have different characteristics, and TEAM1 was a daytime class, a comparison
with students of the comparison group only in daytime classes will be made.
Table 36. Grades of AM1' students that were not in evening classes.
N Average Std. Error
Participants 14 9.1 1.3
AM1 students in daytime classes 38 6.0 0.6

184
According to Table 38, the average of students in daytime classes (according to its response to the
AM1 questionnaire) is lower than the average of participants.
Table 37. ANOVA of grades of the students not in evening classes, across groups.
Sum of Squares df Mean Square F Sig.
Between Groups 94.9 1 94.9 5.857 0.019
Within Groups 809.9 50 16.2
Total 904.8 51
According to the analysis of variance (ANOVA) the difference between grades of the two groups
of students is statistically significant (p < 0.05), see Table 39. The participants have higher grades
than the other daytime students of AM1.
6.9.6 Grades by group, among students that were not in evening classes, who are 19
years old or more and were in ISEL/AM1 for three or more semesters.
In this section TEAM1 will be compared with a group similar to TEAM1 in many characteristics (all
characteristics that was showed that TEAM1 students were different from the comparison group- and
it was possible to find a homologous group). Pay attention that this “new group” may have different
characteristics from the TEAM1 (that were not different in the comparison between TEAM1 and the
comparison group).
This “new group” is the group of all students of the comparison group that, as well as TEAM1
students, were not in evening classes, who are 19 years old or more and were in ISEL/AM1 for three
or more semesters. Here will be compared the grades of participants with the grades of the “new
group”.
Table 38. Grades of AM1 students.
N Average Std. Error
Participants 14 9.1 1.3
“New group” 22 7.6 0.9
According to Table 38, the average of students in “new group”(according to their response to the
AM1 questionnaire) is lower than the average of participants.

185
Table 39. ANOVA of grades of the students not in evening classes, across groups.
Sum of Squares df Mean Square F Sig.
Between Groups 21.9 1 21.1 1.031 0.317
Within Groups 696.4 34 20.5
Total 717.6 35
According to the analysis of variance (ANOVA) is not statistically significant (p < 0.05) the
difference between grades of the two groups of students, see Table 39.
6.9.7 Grades by class
This section focuses on grades of AM1 students by class. Remember that are only included the
students that responded to the questionnaire and went to at least one assessment moment. Table 40
shows that TEAM1 is the class with the best average.
Table 40. Grades of AM1' students by class.
N Average Std. Dev.
Std.
Error
95% Confidence
Interval for Average
Min Max
Lower
Bound
Upper
Bound
TEAM1 14 9.1 5.0 1.3 6.2 11.9 1 17
110M 17 5.5 3.6 0.9 3.7 7.4 1 14
120M 13 6.9 4.1 1.1 4.4 9.3 1 14
130M 3 6.3 4.2 2.4 -4.0 16.7 3 11
140M 4 2.9 3.2 1.6 -0.0 10.0 2 9
150M 1 7.0 7 7
110N 2 0.1 0.7 0.5 -5.9 6.9 0 1
120N 1 4.0 4 4
No class 5 6.0 5.2 2.3 -0.6 12.5 1 13
Multiple classes 5 2.2 1.3 0.6 0.6 3.8 1 4
Total 65 6.2 4.3 0.5 5.1 7.3 0 17

186
The result of the One-way ANOVA with all these classes was F(9,55)=1.92, p = 0.069, but since
there are many and very small groups in analysis, some of them with only one student, the
homogeneous subsets could not be performed and the ANOVA may not be reliable.
Another One-way ANOVA was performed without the classes that had less than five students, the
result was significant, F(7,55)=2.41, p = 0.031 < 0.05, but produced only one homogeneous subset.
The one-way ANOVA without classes with less than five students produced significant results
(see Table 41). Remember that the classes T110M and T120M are the other two classes taught by the
teacher of TEAM1.
Table 41. ANOVA of AM1’ grades across classes (with five or more students).
Sum of Squares df Mean Square F Sig.
Between Groups 203.8 4 51.0 2.960 0.029
Within Groups 843.7 49 17.2
Total 1047.5 53
According to this ANOVA (see Table 41) there are significant (p < 0.05) differences among the
groups. According to Scheffe there are two homogeneous subsets, without significance (see Table
42).
Table 42. Homogeneous subsets of classes with five or more students, by Scheffea,b
Classes with more than five students N
Subset for alpha = 0.05
1 2
Multiple classes 5 2.2
T110M 17 5.5 5.5
No class 5 6.0 6.0
T120M 13 6.9 6.9
TEAM1 14 9.1
Sig. 0.287 0.563
Averages for groups in homogeneous subsets are displayed.
a. Uses Harmonic Average Sample Size = 8.235.
b. The group sizes are unequal. The harmonic average of the group sizes is used. Type I error levels are not guaranteed.
It is not prudent to take conclusions by this analysis.

187
6.9.8 Grades by teachers
A possible threat to the validity of this study is that the differences among grades came from teachers.
To compare grades as function of the teachers are created some groups: Prof. B, Prof C, Prof. D that
are the groups of all students that attend classes of the professor B, C, or D, respectively. The
professor A (the author of this study) teaches both TEAM1 and the other group of students named
Prof. A.
Table 43. Grades of AM1' students by groups with the same teacher.
N Average
Std.
Dev.
Std.
Error
95% Confidence Interval
for Average
Min Max
Between-
Component
Variance
Lower
Bound
Upper
Bound
TEAM1- Prof. A 14 9.1 5.0 1.3 6.2 11.9 1 17
Prof. A 30 6.1 3.8 0.7 4.7 7.5 1 14
Prof. B 3 6.3 4.2 2.4 -4.0 16.7 3 11
Prof. C 5 5.4 2.9 1.3 1.8 9.0 2 9
Prof. D 3 1.7 2.1 0.2 -3.5 6.8 0 4
Total 76 6.6 4.3 0.6 5.4 7.7 0 17
The average grades of students of TEAM1 are much higher than the average grades of the other
groups with fixed teachers. Inclusive, the group indicated as Prof. A (only), that are the other students
of the teacher of TEAM1, have lower grades than the students of TEAM1.
An ANOVA will study the differences among grades of the groups with different teachers.
Table 44. ANOVA of grades of students across groups of students with the same teacher.
Sum of Squares df Mean Square F Sig.
Between Groups 173.4 4 43.3 2.655 0.044
Within Groups 816.2 50 16.3
Total 989.5 54
The result of ANOVA (Table 44) is that (p < 0.05) the difference in grades of groups of students
with different teachers is significant.

188
According to Post Hoc Scheffee Comparisons, see Table 45, only one homogeneous subset is
formed, without statistical significance (p = 0.087).
Table 45. Homogeneous subgroups according to Post Hoc Scheffea,b,c Comparisons of grades of students
in groups with the same teacher.
Teacher
N
Subset
1
dimens ion1
Prof. D 3 1.7
Prof. C 5 5.4
Prof. A – other classes 30 6.1
Prof. B 3 6.3
Prof.A -TEAM1 14 9.1
Sig. 0.087
Averages for groups in homogeneous subsets are displayed.
a. Uses Harmonic Average Sample Size = 5.147.
b. The group sizes are unequal. The harmonic average of the group sizes is used. Type I
error levels are not guaranteed. c. Alpha = 0.05.
The conclusion is that there are significant differences among students of different teachers. It is
not possible to conclude which groups are different from each other. But, since TEAM1 average is so
much higher than the others, it is possible that TEAM1 would be the most different group.
Part C- Qualitative and quantitative data about TEAM1
In this Part C the answers of TEAM1 students to a questionnaire made to that class in order to find
their feedback about the approach will be used. The answers of all AM1 students (to their
questionnaire) about the reasons why they did not go to TEAM1 will also be used. And will also be
studied the qualitative data: the answers to open questions and the teacher’s view of the class.

189
Questionnaire of TEAM1 6.10
Fifteen students of TEAM1 responded to its questionnaire (all except a student who dropped out of
the LEC). Students used the scale below to indicate their level of agreement with the statements.
0 1 2 3 4 5 6 7
No opinion Nothing Medium A lot
6.10.1 TEAM1 why?
The next statements search the reasons that led students to participate in TEAM1.
I participated in TEAM1 because the schedule was good.
I participated in TEAM1 because of being only twice a week.
I participated in TEAM1 because I found it interesting.
I participated in TEAM1 because I thought it would improve my performance.
I participated in TEAM1 because I like to try different things.
I participated in TEAM1 because my friends also came.
I changed to TEAM1 because I have started in a class that I did not like.
I participated in TEAM1 because I knew the teacher's teaching method.
If there will be TEAM1 next semester, with a good schedule, I would attend again.
(Assuming I still had AM1 to be done.)
Error! Not a valid bookmark self-reference. shows that, concerning “participation in TEAM1
due to a good schedule”, 8 students agree, 3 disagree and 4 do not agree nor disagree.
Concerning “participation in TEAM1 due to classes being only twice a week”, 7 students agree, 6
disagree and 2 are indifferent.
Concerning “thinking that would improve the performance” this was a point of agreement of
TEAM1 students, all students agree that they hoped to improve their performance by joining the
TEAM1.
Concerning the statement "I came to TEAM1 because I like to try different things", 11 students
agree, 2 disagree, 1 is indifferent and one did not respond.

190
Eight students disagree that had “I came to TEAM1 because my friends also came”, 3 agree, 1 is
indifferent and 3 did not respond.
Three students “Changed to TEAM1 because they were in a class that they did not like”, 1 student
is indifferent, all others deny that this has happened, and 2 have no opinion.
Eight students “went to TEAM1 because they already knew the teacher's method of teaching”, 2
disagree, 1 is indifferent and 4 had no opinion.
Concerning the question if they” would return to TEAM1” there is consensus among the 12
respondents, 1 with no opinion (a student which reproved), 2 did not respond (students who have
obtained approval).
Table 46. Number of TEAM1 students that has a determined level of agreement with the statement “I
participated in TEAM1 because…”.
N.O.
0
Nothing
1 2 3
Medium
4 5 6
A lot
7
N
Average
Good schedule 1 1 1 4 3 2 3 15 4.7
Twice a week 1 1 4 2 4 3 15 4.5
Interesting 1 2 6 6 15 6.1
Improve performance 2 9 4 15 6.1
Like new experiences 1 1 1 1 5 5 1 15 4.6
Friends also 3 6 2 1 1 2 15 2.2
Change bad class 2 5 2 2 1 1 2 15 2.5
Knew teacher method 4 2 1 5 1 2 15 3.4
TEAM1 again 1 3 9 13 6.3
Here are some comments from students about “why I came to TEAM1"…
Wanted to try the teaching method used at that Class.
The innovative method aroused my interest.
I attended the TEAM1, because after I have been informed of the method, I preferred it
immediately. The class was much more alive than the others. We have more time to do the
exercises and the fact of being corrected immediately.
Forced us to study every week due to the quizzes; the subject was far more organized;

191
there were few students; I clarified doubts more often than if I were in a larger class.
In short, there is consensus among respondents that they would return to enrol in TEAM1 if they
had not got approval (and TEAM1 happened again with a good schedule for them). The most
important reasons to bring the students to belong to TEAM1 was the fact of TEAM1 being interesting
and students expectation to get a better performance. The schedule was considered good and it has
also been important as the desire to try something different and the fact that they already knew the
teacher's teaching method. Three students came to TEAM1 because friends also came and also three
have changed from a class that they did not liked.
6.10.2 Materials: Interactive Learning Documents
TEAM1 students evaluated the Interactive Learning Documents (ILDs) created specifically for
TEAM1 (for details see Chapter 0) by the indication of their degree of agreement with the following
statements:
The material was well organized.
It was easy to find a subject / formula in the PDF's.
The standardization / uniformity of material was helpful.
The fact that the material was very uniform disrupted the visual memory. This means: could
you memorize the theorem X that appeared on the right corner of that page? (as it happens
when you write on paper ...).
The initial experience of writing math on the computer tt was practical and functional.
Table 47. Number of TEAM1 students that has a determined level of agreement with statements about
the ILDs created for TEAM1.
N.O.
0
Nothing
1 2 3
Medium
4 5 6
A lot
7
N
Average
Well organized 5 3 7 15 6.1
Easy to find a subject 3 7 5 15 6.1
Uniformity was helpful 2 2 6 5 15 5.9
Bad for visual memory 2 2 2 4 3 13 4.3
Practical to write math 2 2 6 1 3 1 15 4.9

192
According to Table 47, all students agree that the materials are well organized and it is easy to find
a subject / formula in the documents. About the usefulness of the standardization of material all
students agree except 2 that nor agree nor disagree.
Most students state that the fact that the material is very uniform is bad for visual memory,
although 4 disagree and 2 are indifferent.
As to the initial experience of writing math on the computer being practical and functional, most
students, 6, did not agree nor disagree, 4 agree and 4 disagree.
6.10.3 Quizzes
This section shows students’ feedback about the 14 quizzes made online during the classes. The
grades of the quizzes allow students to improve their grade after they became approved by the
"normal” method of assessment (for details see section 5.3.3). The purpose of the quizzes was to
motivate students to regularly study the subject, and to prepare students for "normal" assessment.
Students indicated their degree of agreement with the next statements to provide feedback about
the quizzes:
The fact that the quizzes provided extra points if they had approval, seemed positive.
The quiz forced to regularly study the subject.
The quizzes were important as preparation for the three official tests of AM1.
The existence of quizzes was positive.
Table 48. Number of TEAM1 students that has a determined level of agreement with affirmations about
the quizzes of TEAM1.
N.O.
0
Nothing
1 2 3
Medium
4 5 6
A lot
7
N
Average
Give extra points 1 1 3 10 15 6.5
Force to study 1 5 9 15 6.5
Preparation to assessment 2 4 9 15 6.5
Positive 3 11 14 6.8
As to being positive the fact that the quizzes provide extra points, 14 students agreed and 1 did not
agree nor disagree, see Table 48. Everyone agrees that quizzes force students to study regularly the

193
subject and that they were important in preparing for the three official tests of AM1. The students
were unanimous in classifying the existence of quizzes as highly positive.
When questioned about why the quizzes were beneficial (or not), all students answered positively.
The whole comments are in appendix A. The most mentioned comments were that due to quizzes
they “study more often” and “get feedback” about their level of understanding of the subject. Some
students also mentioned quizzes make them “be updated on the subject” and “get preparation for the
other tests”. They also appreciated to “get extra values” for it.
In short, the quizzes get a strongly positive classification by the students (in the focus groups
students also showed that the quizzes were very important for them).
6.10.4 Two teaching methods
This section reports students’ feedback about two teaching methods that are described above.
In the Teaching Method 1 (TM1) the teacher presents the themes for a very short time and the
remaining time circulates among students helping them to solve the exercises (the students interact
with each other in order to help each other).
In the Teaching Method 2 (TM2), most of the time the teacher explains the theme and solves the
exercises on the blackboard asking questions to the students in general.
To give feedback, students indicated their degree of agreement with the following statements:
TEAM1 was taught with TM1.
I prefer to learn by TM1.
In TEAM1 I felt free to ask questions to fellow students.
In TEAM1 I felt free to ask questions to the teacher.

194
Table 49. Number of TEAM1 students that has a determined level of agreement with the statements
about teaching methods.
N.O.
0
Nothing
1 2 3
Medium
4 5 6
A lot
7
N
Average
TEAM1taught with TM1 3 1 4 6 14 5.9
Prefer TM1 1 4 3 5 13 5.8
Ask fellow students 4 4 7 15 6.2
Ask teacher 2 3 10 15 6.5
According to Table 49, eleven students agree that the teaching method of TEAM1 is TM1, 3 do
not agree nor disagree, and 1 did not respond. Twelve prefer TM1, 1 did not prefer it and 2 did not
respond. All students agreed that they “felt free to ask questions to fellow students” and agreed even
stronger that they “felt free to ask questions to the teacher”.
6.10.5 Characterization of TEAM1
TEAM1’ students indicated their degree of agreement with the following statements to provide an
evaluation/characterization of that class:
In TEAM1 there was "empathy between teacher and students so that students feel supported
and sustained rather than judged and evaluated"– Rogers.
During the lessons there was an atmosphere of concentration, work and cooperation among
students / peers / teacher.
At the beginning of the semester I was determined to work very much and therefore get
approved.
Regardless of the class in which I was enrolled I believe that the result would be the same.
It was important to have few students in the room.
With twice the number of students in the TEAM1, it seems to me that the results would be
worse.
In a TEAM1 with 60 students, it seems that the results would be worse.
In general, I had more interest in lessons of TEAM1 than other classes of AM1 which I
attended. Why?

195
Table 50. Number of TEAM1 students that has a determined level of agreement with the statements
about the characterization of TEAM1.
N.O.
0
Nothing
1 2 3
Medium
4 5 6
A lot
7
N
Average
Existed empathy 1 2 3 7 13 5.9
ConcentrationWorkCooperat 2 8 5 15 6.2
Determined to work hard 1 3 6 5 15 6.0
Other class same result 1 4 1 4 3 1 14 3.6
Few students was important 1 2 1 11 15 6.5
Twice students worse 2 1 4 3 4 14 4.3
60 students worse 2 1 1 2 6 2 14 4.1
More interest in TEAM1 1 6 8 15 6.4
According to Table 50, twelve students agreed that there was in TEAM1 " empathy between
teacher and students so that students feel supported and sustained rather than judged and evaluated”
(Rogers, 1969), 1 disagreed (I know this student’s feeling about the class and I believe that this
student misunderstood the question - he has difficulties to understand Portuguese) and 2 did not
respond.
All students considered that there was “an atmosphere of concentration, work and cooperation in
class”. With the exception of one, all students indicate that “early in the semester they were
determined to work hard to get approved”.
About the question: “Regardless of the class in which you were enrolled do you believe that the
result would be the same?” 6 students disagree, 4 agree, 4 nor agree nor disagree and 1 did not answer
(I think that some students thought they would have improved and others worsened - the question is
not well made, it should have been: “Do you think that your results have improved by being in
TEAM1?
All students indicated that “it was important to be few students in the room”, except one who was
indifferent. About “with twice the students in the class the results would be worse”, 7 agree, 3
disagree, 4 do not agree nor disagree, and one did not answer. When it is said that “with 60 students
in the class the results would be worse”, 10 students agree, 3 disagree, one did not agree nor disagree,
and 1 did not respond.

196
All students reported “having more interest in TEAM1 than in the other classes of AM1 which
they had attended”, except one who reported not having more nor less interest. The complete
comments to this answer are in Appendix C. In summary, some students mentioned that they had
“more time to practice and clarify doubts”, others mentioned the “method of teaching”, and others the
“close monitoring of student”. It was also mentioned that “by being only twice a week it does not lose
interest”, that they liked the “collective concentration” and that “quizzes” also contributed to the
interest of the class.
6.10.6 Characterization of the student
The level of agreement of students with the following statements indicates students’ auto-
evaluation/characterization:
I was always with a lot of commitment to get approval.
I worked hard.
I worked much focused during lessons.
I solved, by myself, many exercises in lessons.
I clarified all the doubts which emerged in lessons.
Table 51. Number of TEAM1 students that has a determined level of agreement with the statements
about their own characterization as TEAM1 students.
N.O.
0
Nothing
1 2 3
Medium
4 5 6
A lot
7
N
Average
I was committed 1 7 4 3 15 5.5
I worked hard 1 5 5 2 2 15 4.9
I worked focused in lessons 3 4 4 3 14 5.5
I solved exercises by myself 2 8 2 3 15 5.4
I clarified doubts in lessons 1 2 4 6 2 15 5.4
According to Table 51, regarding the statement “I was always with lot of commitment to get
approval“7 students grade it with 5 in a scale of 7, 4 students grade it with 6, and 3 with the
maximum, only one disagreed. About "I worked hard" 9 students say yes, 5 indicated that not too
much nor too little, and 1 said that he did not work much.

197
About “I worked much focused in class”, 11 say yes, 3 do not confirm nor deny it and one does
not answer. And about if “I solved, by myself, many exercises in lessons”, 13 answered yes, and 2 did
not agree nor disagree. Regarding “I clarified all doubts which emerged in lessons”, 12 replied
affirmatively, 1 negatively and 2 nor affirmative nor negatively.
In general, students say they have worked much, with great commitment and by themselves.
6.10.7 Teaching method of TEAM1
Students evaluate the teaching method of TEAM1 indicating their degree of agreement with the
following statements:
I liked the way lessons were conducted.
It seemed useful the fact of not spending time copying the theory (which was on the slides)
and using it to solve exercises.
It was important to see not only the analytical part of mathematics but also the graphical and
numerical.
It was interesting to see some applications of themes that were studied.
The fact that the subject was shown interactively and not as a presentation was useful. For
example, the teacher instead of saying that the properties are A < B and C > D, asks students
to fill with inequalities the relations between A and B and between C and D.
Table 52. Number of TEAM1 students that have a certain level of agreement with the statements about
TEAM1’ teaching method.
N.O.
0
Nothing
1 2 3
Medium
4 5 6
A lot
7
N
Average
Liked lessons 9 6 15 6.4
Useful not copying theory 1 2 5 7 15 6.2
Important Graphic/Numeric 1 4 6 4 15 5.9
Interesting Applications 2 3 7 3 15 5.7
Useful Interaction 1 3 5 6 15 5.1
All students liked very much “the way lessons were conducted”. All except one have found
“useful the fact that they do not spend time copying the theory (which was on the slides) and using it
to solve exercises”. All but one considered important “to see not only the analytical part of

198
mathematics but also the graphical and numerical”. All except two found interesting “to see some
applications of the themes that they were studying”. Three showed to be indifferent, and one indicated
that the fact that “the subject was shown in an interactive and not expositive way” was not useful.
In general, the highest average was about how much the lessons pleased, for the other items the
most important thing was not to waste time copying theory, followed by the graphical and numerical
display beyond the analytical part, then the interest in applications and finally the usefulness of
interactions.
6.10.8 Other factors
Students evaluated other factors that may influence students’ performance indicating their level of
agreement with the following statements:
I had much to study for other courses.
I have many difficulties on the basic mathematics.
Table 53. Number of TEAM1 students that has a determined level of agreement with the statements
about factors that may influence students’ performance.
N.O.
0
Nothing
1 2 3
Medium
4 5 6
A lot
7
N
Average
Much to study for other courses 3 4 6 2 15 5.5
Difficulties on basic math. 3 3 3 1 3 1 1 15 3.3
About if they had “much to study for other courses”, 12 students agree and 3 do not agree nor
disagree. About “difficulties on basic mathematics”, 9 disagree, 1 does not agree nor disagree and 5
agree.
6.10.9 Comments
This section presents the key ideas of the comments that students made in several open questions that
were included in the questionnaire. The full comments are in Appendix C.

199
Table 54. Frequency of key ideas in comments of twelve TEAM1 students to the question: What did you
expect from TEAM1? Did that existed in fact?
Key idea Frequency
Matched expectations 7
Gave more support 2
Gave more practice 2
Was different 2
With new technologies 1
Was agreeable 1
Was positive 1
Made union between classmates 1
Made understand the subject 1
Would attend again 1
Was more efficient 1
I had nothing to lose 1
I expected to stop having difficulties with basis but didn’t succeed because I stopped
attending TEAM1
1
Table 55. Frequency of key ideas in comments of twelve TEAM1’ students to the question: What did
you think about TEAM1?
Key idea Frequency
Positive experience/ excellent initiative 7
A good way to learn/understand mathematics 3
Should continue 3
Different/innovative 2
Nice atmosphere
Excellent results/ good performance
Well structured
Commitment to learn
Commitment to teach
More motivating
Force students to commitment
Great teacher performance
Allow students to find their difficulties
Help to apply concepts
Would attend TEAM1again
Hope that ideas of this experience are divulgated to other teachers and other courses.
2
2
1
1
1
1
1
1
1
1
1
1

200
Table 56. Frequency of key ideas in comments of TEAM1’ students to the question: From all that was
approached before, what had the biggest impact in your success/failure? (Specify at least 5 items.)
Key idea Frequency
Positive comments of seven success students
Quizzes 5
Few students 5
Material to keep up with lesson 4
Relationship between fellow students 3
Clear and slow explanation of the subject 2
Relationship between teacher and students 2
Availability of teacher 2
Good Timetable 2
Many practice 2
Methodology of learning imposed by TEAM1 2
More time to think and solve exercises 1
Applications 1
Facility to expose doubts 1
TEAM1 teaching method: TM1 1
Concentration of students in lesson 1
Support when solving exercises 1
Positive comments of six failed students
Solve many exercises in class 1
Teacher clear way of transmit mathematics 1
Few students 1
Quizzes 1
Being given the solutions to exercises 1
Having interested students in class 1
Lessons more practical than theoretical 1
Negative comments of six failed students
I went to TEAM1 later 2
I have little interest/motivation to learn 2
I have difficulties 2
I don’t have basis of mathematics 1
I could had more commitment 1
I had more appellative courses 1

201
TEAM1, why not? 6.11
This section seeks to clarify why only 16 students have enrolled in TEAM1. To this end, the
questionnaire included the statements that follow and students should indicate their degree of
agreement with the statements according to the scale: (this question was for all students except those
of TEAM1)
0 1 2 3 4 5 6 7
No
op
inio
n
NO
Tota
lly
dis
agre
e
TD
No
t ag
ree
no
r d
esag
ree
NA
ND
To
tall
y
agre
e
TD
I liked to have participated in TEAM1.
I did not participate in TEAM1, because the schedule was bad.
I did not participate in TEAM1, because I do not have my own laptop ... or I have but it is
unpleasant to bring it to ISEL several times a week.
I did not participate in TEAM1, because it did not interest me.
I did not participate in TEAM1, because I thought it would not change my performance.
I did not participate in TEAM1, because I was afraid of not getting along.
I did not participate in TEAM1 by inertia. (I was well in my class ... why change?)
I already knew teacher's method of teaching and preferred another experience.
If there will be TEAM1 in next semester, with a good schedule for me, I would attend to it.
(Assuming you still needed to get approbation to AM1.)
If you wish, add other reasons why you did not attend TEAM1, or something that seems
relevant. (This question had a text box to reply.)
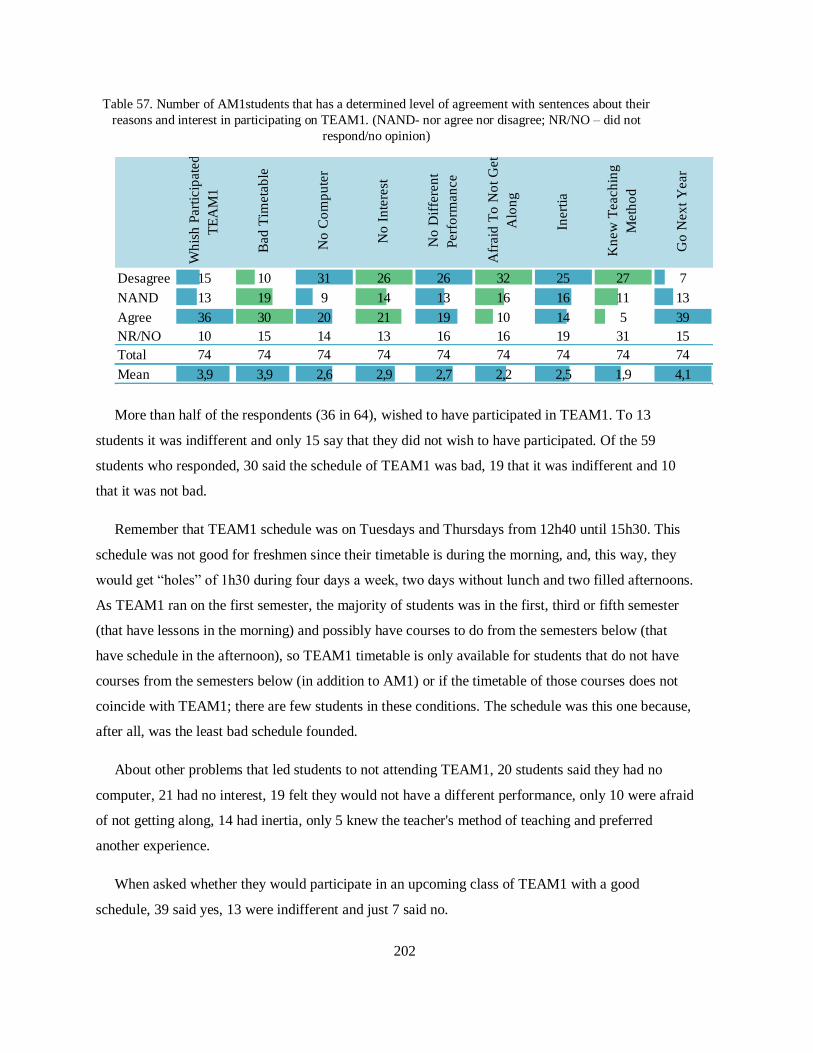
202
Table 57. Number of AM1students that has a determined level of agreement with sentences about their
reasons and interest in participating on TEAM1. (NAND- nor agree nor disagree; NR/NO – did not
respond/no opinion)
More than half of the respondents (36 in 64), wished to have participated in TEAM1. To 13
students it was indifferent and only 15 say that they did not wish to have participated. Of the 59
students who responded, 30 said the schedule of TEAM1 was bad, 19 that it was indifferent and 10
that it was not bad.
Remember that TEAM1 schedule was on Tuesdays and Thursdays from 12h40 until 15h30. This
schedule was not good for freshmen since their timetable is during the morning, and, this way, they
would get “holes” of 1h30 during four days a week, two days without lunch and two filled afternoons.
As TEAM1 ran on the first semester, the majority of students was in the first, third or fifth semester
(that have lessons in the morning) and possibly have courses to do from the semesters below (that
have schedule in the afternoon), so TEAM1 timetable is only available for students that do not have
courses from the semesters below (in addition to AM1) or if the timetable of those courses does not
coincide with TEAM1; there are few students in these conditions. The schedule was this one because,
after all, was the least bad schedule founded.
About other problems that led students to not attending TEAM1, 20 students said they had no
computer, 21 had no interest, 19 felt they would not have a different performance, only 10 were afraid
of not getting along, 14 had inertia, only 5 knew the teacher's method of teaching and preferred
another experience.
When asked whether they would participate in an upcoming class of TEAM1 with a good
schedule, 39 said yes, 13 were indifferent and just 7 said no.
Wh
ish
Part
icip
ate
d
TE
AM
1
Bad
Tim
eta
ble
No
Co
mp
ute
r
No
In
tere
st
No
Dif
fere
nt
Perf
orm
an
ce
Afr
aid
To
No
t G
et
Alo
ng
Inert
ia
Kn
ew
Teach
ing
Meth
od
Go
Nex
t Y
ear
Desagree 15 10 31 26 26 32 25 27 7
NAND 13 19 9 14 13 16 16 11 13
Agree 36 30 20 21 19 10 14 5 39
NR/NO 10 15 14 13 16 16 19 31 15
Total 74 74 74 74 74 74 74 74 74
Mean 3,9 3,9 2,6 2,9 2,7 2,2 2,5 1,9 4,1

203
In the text box provided for students to include other reasons not to attend the TEAM1, four
students repeated their impossibility due to the schedule; three said that they belong to the evening
classes, two of whom claimed that because of this they could not attend to TEAM1 and the other took
the chance to request a TEAM1 during night time. Some students said that they had no interest in
TEAM1:
I do not think that the use of a PC is crucial for the approval at AM1.
I do not belong to TEAM1 only because I liked the way of classes in regular classrooms.
I did not know how TEAM1 would be, and I did not know if I could learn more or less in
TEAM1 than in a regular class with a teacher different from those of the previous
semesters.
Others have made statements that showed some ignorance of the functioning of TEAM1 like
thinking that it was not a face-to-face learning:
I prefer face-to-face learning, I feel it's more motivating, however I think it would be good to
have a place where we could interact to clarify questions, solving problems, etc.
Or they think that it was not for all sorts of students:
Someone told me that it was only for students who were repeating AM1.
Others, because of their general lack of motivation in relation to mathematics nor even paid
attention to this new hypothesis:
I did not know that existed. I have been VERY unhappy with the requirement of
mathematics at the DEC and hence for 3 semesters Ihave not wasted time with them. I'll
waste at the end of the course because it is needed. I was not attending AM1 when there was
TEAM1.
On average, students wanted to have participated in TEAM1. The bad schedule was the most
important factor contributing to the lack of participation of students. On average, they claim that they
wished to attend it, if there is an upcoming TEAM1 class with a good schedule.
Teacher’s view – Qualitative data 6.12
This section shows my (teacher’s) view of the students of TEAM1, their personality, their effort, their
difficulties and their performance.

204
6.12.1 Description of the students of TEAM1
My characterization of the class profile/performance is that it was a class in which most students may
be called “normal students”, with normal assiduity, effort and interest and with a normal level of
difficulties. I think that none of the students could be called a “brilliant” student. A group of 5 (in 15)
students had profound difficulties.
Students without profound difficulties:
Student A: 38 years old, Mathematics A, PALOP, hard worker, without lack of mathematics basis,
came to TEAM1 from a class that he did not like. Got 8.7, 7.1 and 6.9 values on the three tests.
According to him, he studied very much to the first exam and got 16.5 values.
Student B: 29 years old, Mathematics A, hard worker, very interested, some lack of mathematics
basis, very assiduous. Got 14.1, 16.1 and 14.3 values on the three tests which made a final grade of
14.8 values.
Student C: 21 years old, Mathematics A, hard worker, very interested, without lack of mathematics
basis, very assiduous. Got 18.0 on the first test (the best grade of all AM1 students) and realized that
she did not need to study so much, got 10.3 on the second test and 8.0 on the third test (when she had
to study for many other courses), this makes a final grade of 12.1values.
Student D: 22 years old, Mathematics A, good worker, some lack of mathematics basis, very
assiduous. Got 12.9; 14.7 and 8.0 values on the tests which make a final grade of 11.9 values.
Student E: 21 years old, Mathematics A, hard worker in class (I think that he does not work at home),
without lack of mathematics basis, very assiduous and very interested. A friend of student C, always
in competition/cooperation with him. Got 12.9, 9.2 and 8.6 values on the tests which make a final
grade of 10.2 values.
Student F: 21 years old, Mathematics A, little worker, some lack of mathematics basis, with little
interest. Missed 7 of the 29 classes. Missed the first test, got 8.0 values on the second test and
3.3values on the third one. In the first exam got 10.8 values.
Student G: 22 years old, Mathematics A, very little worker, some lack of mathematics basis. Missed 8
of the 29 classes. Most of the time was talking with Student I. Got 8.6 values on the first test, 8.8 on
the second, missed the third test and did not show up in any of the exams. Failed.

205
Student H: 19 years old, Mathematics A, some lack of mathematics basis, missed 8 of the 29 classes
and, when she came, showed a total lack of interest by the subject (it looks like she did worked to got
a grade but did not want to learn anything). Got 13.6, 9.6 and 8.6values on the three tests which
makes a final grade of 10.6 values.
Student I: 19 years old, Mathematics A, some lack of mathematics basis, worked reasonably, went to
TEAM1 and other class of the same teacher, missed 9 of the 29 classes of TEAM1. Spent much time
talking to Student G. Liked to learn in the other class and came to TEAM1 “shining” (many times
without a complete understanding of what he was saying). Got 9.7, 10.1 and 5.5 values on tests,
repeated the third test and got 11.7 values. Got a final grade of 10.5 values.
Student J: 20 years old, Mathematics A, little interest, little worker, missed 6 of the 29 classes. Got
8.9 and 9.7 on the first two tests. Went to the repetition of third test and got 10 values. Got a final
grade of 9.5 values.
Student K: 19 years old, Mathematics A, many lack of mathematics basis, reasonable worker, did not
have a computer (in class). He did not interact with classmates and even with the teacher showed
some resistance. He got 1.8 values on the first test and little time after that he gave up TEAM1.
Students with profound difficulties:
Student L: 37 years old, Mathematics from 20 years ago, interested by the subject, worker student that
missed many classes. He worked a lot in class, but I imagine that he did not worked out of class. Got
4.9 values on first test and then gave up the course. He told me that he had many courses and this one
requested much work and he had no time.
Student M: Did not fill his age, I imagine he is around 40 years old, “Mathematica aplicada às
Ciências Sociais”. He is a PALOP student with very strong lack of mathematics basis and difficulties
also in Portuguese. He came to TEAM1 in the middle of the semester and, after that,he came
assiduously until the end. Hard worker and committed but with tiny results. Got 2.2 values on the first
test and did not go to any more assessment.
Student N: 33 years old, Mathematics B, is a PALOP student with strong difficulties on mathematics
basis but with no difficulties on Portuguese. He came to TEAM1 in the middle of the semester and
after that came assiduously until the end. Hard worker and committed but with tiny results. Got 3.1

206
values on the first test and 6.0 on the second. In the first exam he got 3.9 values and 5.4 on the
second.
Student O: 25 years old, Mathematics B, is a PALOP student with strong difficulties on mathematics
basis and in Portuguese. He came to TEAM1 in the middle of the semester and after that came
assiduously until the end. Hard worker and committed but with tiny results. He did not go to any
assessment.
Student P: She did not answer to the questionnaire, I imagine around 18 years old (she was a
freshman), came to TEAM1 after six classes to got out of a class that she said: “I don’t understand
anything” only attended half of the classes (by schedule incompatibility) and came later, i.e., she
always felt lost (althought the teacher tried to help her with what she did not attend). Gave up of ISEL
even before the first test.
6.12.2 Performance
In TEAM1, only two students of the 11 that did not have profound difficulties at mathematics basis
failed. This seems, to me, a good success rate since the general failure rate was of 77% of assessed
students and 86% of subscribed students. About the students with profound difficulties I think that
TEAM1 attracted many ones because it would be a different class and those students had the hope
that it was a solution for them. But, unfortunately, those students have such a lack of basis, since they
had Mathematics B in secondary school (or worse), that it is not possible to solve without exceptional
very strong actions.
6.12.3 More reflections
AM1 classes were taught by the teacher of TEAM1 and more three teachers. Two of those teachers
are considered by students (by me and by many colleagues) as “bad” teachers… however, the other
teacher is considered a top teacher: he is an excellent mathematician, young, cheerful, organized,
interesting, friendly, … a teacher considered by students (by me and by many colleagues) as an
excellent teacher… however only few of his students get approbation… the only reason that I find to
justify this… is the teaching approach… he uses the traditional method of the teacher all the time in
the blackboard solving the exercises and asking questions to the students in general (in a very
interesting way, for sure) but not giving time/forcing the students to solve the exercises by
themselves.

207
Part D- Discussion
Data analysis to study the primary hypothesis of this research is quite elaborated … here its logic will
be explained and the results discussed. Data analysis of secondary hypotheses is quite straightforward
so will not be discussed here.
The primary hypothesis of this thesis is: Does the ActivMathComp (actively learning mathematics
using computer) approach enhance learning (gets higher grades and higher success rate) relatively to
the traditional approach to teach the course of Mathematical Analysis1 (AM1)?
Formal data show, in part A, that the grades of participants were significantly higher (p < 0.05)
than the grades of the others students of AM1. Their averages were, respectively, of 8.8 and 5.7
values. Moreover, the rate of approved over assessed was nearly twice higher for participants.
However, a doubt arises: Since TEAM1 students were not arbitrarily assigned, are they a group
with different characteristics from the general students? For example: Is the proportion of males and
females different? Are they older? Do they have a bigger entrance grade? Do they have better grades
at mathematics in secondary school? Do they usually study more hours? Etc.
Since there was not formal data about those characteristics of students, a questionnaire was made
and its answers led, in part B, to the conclusion that there is not statistical significant difference
between the participants and the comparison group in:
Gender
Attitude towards computer
Type of mathematics at 12th grade of school (Mathematics A or B or…).
Grades at mathematics in secondary school (10th, 11
th and 12
th grades).
Grades to ISEL entrance.
Hours spent studying in 12th grade of school.
Number of lessons that students attended in LEC.
Number of semester with commitment at middle of semester.
Ratio: number of courses with approval/ number of semesters in LEC.
Hours spent studying in LEC.
And led to the conclusion that do exist statistically significant difference in:
Age;

208
Number of working students;
Number of semesters in LEC/AM1;
Number of courses with approval in LEC.
To investigate whether the differences in grades were derived from the differences found, the
grades were studied in homologous groups.
In the first study, students of TEAM1 showed significant differences in grades from the students
of the group of students with 19 years old or more (the homologous group in terms of age). Does not
make sense to find a homologous group in terms of number of working students, so it was not studied.
As the ratio between the number of semesters in LEC and the number of courses with approval in
LEC is not statistically different among groups so it is enough to study one of the groups. And the
students of TEAM1 showed no significant differences in grades from the group of students that are in
LEC/AM1 at three semesters or more (the homologous group in terms of number of semesters in
LEC).
Other comparisons were made between the grades of the comparison group and the participants
group:
Grades (whole comparison group).
Grades after controlling for the covariates:
Grade at mathematics in the 12th grade of school.
Grade to ISEL entrance.
Quantity of hours spent studying to LEC.
Grades of students in daytime classes.
It was found statistically significant differences in all comparisons, and the grades of participants
were higher in all.
The grades of students of TEAM1 were also compared with the grades of a group with many
similarities to TEAM1: the group of students with 19 years old or more, that were in LEC/AM1 at
three semesters or more and that were in daytime classes and TEAM1 students showed no significant
difference in grades from this group.
Motivation of participants is another source of concern, since it may be different from the
motivation of the students of the comparison group, due to their personal characteristics or because of
being in a non-ordinary class. And it cannot be measured.

209
Summarizing, the TEAM1 students got higher grades and higher success rate than the others
students of AM1. Many characteristics of this group of students may have led to this difference in
grades – many were dropped, little doubt remains if “TEAM1 grades were higher because…”:
TEAM1 had more working students (and there are not an homologous group in the
comparison group to make a comparison);
TEAM1 students were for three semesters or more in ISEL (and there is no difference in
grades when compared with the homologous group in the comparison group);
TEAM1 students were 19 years old or more, they were in LEC/AM1 for three semesters or
more and were in a daytime class (and there was no difference in grades when compared
with the homologous group in the comparison group);
TEAM1 students could be more motivated (and it cannot be measured).
But, since TEAM1 was resistant to so many tests, and it was almost impossible to be resistant to all,
we conclude that TEAM1 students had a better performance than others students of AM1.

210
Due to the worrying low success rates of the course of AM1 (Mathematical Analysis 1/Calculus 1)
for engineering students and due to the small/none use of the computer in the usual teaching of the
course it was decided to create a new approach to teach AM1 – the ActivMathComp. The approach
has some features:
Students are active in the classes and collaborate with colleagues;
Computer is embedded as a communication, interaction and computational tool;
Students use interactive digital learning documents;
Students explore concepts in order to develop a deep understanding of them;
Students contact with mathematical applications;
Students have frequent short quizzes with immediate feedback on a Learning Management
System;
The teacher/student relationship is grounded on trust, on mutual understanding and on
students’ involvement with their own learning.
The interactive digital documents were created assuming principles such as the zone of proximal
development (L. Vygotsky, 1978) and multiple representations.
After the conception of ActivMathComp, a quasi-experiment was made to evaluate it. This
approach was tested in a non-ordinary class and the grades of students of this class were compared
with the grades of the other students, having in consideration their background and attitudes.
The reflection provided by this study led to some theoretical, practical and empirical contributions
to the teaching/learning of AM1 that will be reported next.
7 Conclusions

211
Theoretical Contributions 7.1
This study supports theoretical contributions not always consensual in literature. This section
highlights the main theoretical contributions supported by this thesis.
Use of Computers
Several institutions recommend taking advantage of computer to enhance mathematics learning. The
National Council of Teachers of Mathematics (NCTM) of the USA has the principle: “Technology is
essential in teaching and learning mathematics; it influences the mathematics that is taught and
enhances students’ learning” (NCTM, 2000, p. 12). The Mathematical Association of America
(MAA) also states that calculators should be used to teach Calculus (Gordon et al., 1994, p. 56).
According to Lang (1999) in China all Calculus textbooks were changed to embody computer-
assisted education. A more defensive attitude has the Association of Teachers of Mathematics
(ATM) of the United Kingdom that argues that “it is important to examine critically approaches to
teaching and to explore new possibilities, whether deriving from research, from technological
developments or…” (Laurence, 2010).
Moreover, teaching cannot stay indifferent to the fact that computers flood our lives. Computers
are everywhere in our daily routine. Computers are used to do research in mathematics, science and
engineering. The National Research Council states that "scientific computation has become so much
a part of everyday experience of scientific and engineering practice that it can be considered a third
fundamental methodology of science- parallel to the more established paradigms of experimental and
theoretical science" (Borovik, 2011). Would be very strange if the computers, that gave a new
dimension to our lives, had no place in our learning. As Machado (2007) states, the question is no
longer “whether” but “how” to use computers to enhance learning.
Researchers try to find the best way of enhance Calculus teaching using computers. Computers
can be used for communication by the usage of email, chat or forums, for display of materials
(interactive or not), for assessment by quizzes, for calculations using Computer Algebra Systems, for
modelling using Modellus or Dynamic Geometry Software and for exploration of concepts using
spreadsheets. Many issues can also be found online: applets, documents, presentations, courses,
interactive courses, materials of courses, tutorials, quizzes, repositories, etc. A problem, that probably
prevents the boom of materials to the study of mathematics from being even bigger, is the present

212
difficulty to write mathematics’ symbols using computers. We may write mathematics by learning
codes (LaTeX, MathML) or using programs with menus but this is not so practical as to handwrite…
This is a problem for the professionals of mathematics, like teachers and mathematicians, but it is
even worse for the students since they make a more sporadic use of that material. This is the opinion
of Caprotti et al. (2007) to whom the “difficulty regarding expressing mathematical formulae in the
virtual setting is probably the main obstacle slowing down the spread of e-education in the sciences.”
Active Learning
Students learn more if they work actively on concepts than if they were simply attending to an
exposition of the concepts by the teacher (even if the teacher sometimes asked questions to the
students in general). This active learning has been advocated for several centuries and it keeps on
being advocated, due to its good results in terms of students’ performance, by Rubin (1999), Bonwell
and Eison (1991), Prince (2004), Ruhl (1987), Hake (1998), Redish, et al. (1997), Crato (2009),
among others.
In the last decades, in the USA and other countries, has been held the Calculus Reform- a complete
rethought of Calculus teaching in terms of curriculum and teaching methods. The Calculus Reform
advocates that “students should learn through active engagement with the material” ("Toward a lean
and lively calculus," 1986). With a similar point of view, NCTM state that “students must learn
mathematics with understanding, actively building new knowledge from experience and prior
knowledge” (NCTM, 2000). One of the main projects of that reform: Calculus Consortium based in
Harvard University (but spread to all the USA and other countries) advocate that “students learn more
when they are more active” (Hughes-Hallett et al., 2005).
Other approaches to the teaching of undergraduate courses advocate active learning. One example
is SCALE-UP (Student-Centered Active Learning Environment for Undergraduate Programs). As its
name states it does not intend to be passive, it intends to create a “highly collaborative, hands-on, (…)
learning environment”. And, in fact, it is strongly active and has great results. Another example, also
with excellent results, is a project to find a new way to make big classes more active, Mazur (1997),
from Harvard University, created Peer Instruction: a method where the teacher asks conceptual
questions (ConcepTests), the students discuss it with colleagues and (by an electronic device named
Clicker) each one gives his own answer. In this way the student it is not only passively hearing and
the teacher gets immediate feedback of what students, in fact, learned. Another example is IMPULSE

213
a course integrating Mathematics, Physics, Undergraduate Laboratory Science, English and
Engineering (Pendergrass et al., 1999) that uses “active and cooperative learning methods”.
Chickering and Gameson (1987) indicate as one of their seven principles for good practice in
undergraduate education: “encourage active learning: learning is not a spectator sport”. Rosenthal
(1995) also used techniques to make students participate more and interact more in the University of
Toronto. The Carnegie Learning Math Series has collaborative tasks designed to “encourage active
dialog centered on structured activities” (Rogers, 1969).
After so many studies indicating that active learning is more effective than traditional learning,
one cannot keep solving exercises on the blackboard, asking questions to the generality of students
and getting an answer from two or three students. The student only understands, in fact, the subject
when he reflects about it by himself. By copying theory from the blackboard the student internalizes
much less than if he reads it on a projection and tries to give it a meaning with the purpose of solving
an exercise. Without trying to solve an exercise by himself, the student does not even know where the
difficulty is.
Mathematics Applications
Giving more emphasis to mathematics applications seems to be a current trend. In PISA study nearly
all questions are “problems in context of real life” (OECD, 2009). The MAA trends suggest that AM1
teaching should “place less emphasis on computer manipulative skills and emphasize modelling the
real world” (Gordon et al., 1994).
There are many successful projects using applications (see Chapter 2). Different wording is used
but the essential idea is the same. Gravemeijer and Doorman (1999) use “situations experientially real
to students”; Hughes-Hallett, et al. (2005) include “open ended real world problems”; Moore and
Smith (1992) work with “real-world problem with real data”; Seltzel and al. (1996) use “content-rich
problems”; Juan et al. (2008) performs “real-life calculations” that illustrate applications of
mathematics to computer science problems.
For example, according to Uhl (1995) Calculus might be seen as the first course in scientific
measurement, and with Callahan et al. (1995) “the role of modelling becomes much more central to
the subject”. In the study of Kent and Noss (2003) to find “what and how” should Calculus be taught
to civil engineers, mathematics benefit from being pulled in context. According to Teodoro (2002)
computer modelling software may lead to better understanding of scientific ideas and processes.

214
Another motivation to the use of mathematics applications has to do with the fact that, usually,
those applications allow us to develop high level objectives of Bloom’s taxonomy like: apply,
analyse, evaluate and create.
Learning styles
People have different learning styles. There are some different categorizations on learning styles
according to its subjacent theory. Some dual categories are: verbal and visual; active and reflexive;
sequential and global; sensing and intuitive; concrete and abstract; extroverted and introverted, etc.
Students have different learning styles from each other and different learning styles from the
teachers. So the teacher must have in mind that teaching the way he prefers to learn, probably, it is
not the most efficient way of teaching. And if the teacher is not balanced on the use of styles, for
example if his transmission of knowledge is usually Verbal and not Visual: Verbal students are
always comfortable but never develop their visual skills; on the other hand: Visual students are
mainly uncomfortable, having big difficulties to understand the subject.
According to Felder and Brent (2005) the more diverse the form of teaching the more efficient the
transmission of knowledge will be, teachers must teach in both ways: verbal and visual; active and
reflexive; sequential and global; sensing and intuitive; concrete and abstract; extroverted and
introverted, etc.
Multiple Representations
Multiple representations of mathematical concepts allow the creation of more connections between
the previous knowledge and the “new concept” taking into a more meaningful learning of the concept
(Moreira & Masini, 1982). It also allows that more students, with different learning styles, to
understand the concept.
The mathematicians (and other participants) of the Calculus Consortium based at Harvard
University also uses multiple representations in its “rule of four” where they state that the concepts
should be presented, whenever it makes sense, in their verbal, analytical, numerical and graphical
forms. Not only its analytical form should be explored as it happens in traditional teaching (Hughes-
Hallett et al., 2005).
Teodoro (2002) also classifies as crucial the use of multiple representations, in such a way that he
made of it one of the essential features of his software: Modellus.

215
Several researchers of mathematics teaching as Dagher (1993), Duval (1988), Machado (2006),
Domingos (2003), Tall (1993) advocate the importance of making the correlation between the
graphics of functions and their analytical treatment. It means that they give importance to the use of
(at least) two representations.
Proximal Development Zone
When the teacher wants students to work autonomously around a group of exercises, he must have in
mind that those exercises must have an order/difficulty that makes them to be in students’ proximal
development zone (i.e. it must be possible for the student to evolve from one exercise to another
alone, or with little support from the teacher or the classmates).
Collaborative work
Students working together enhances learning and allows the development of other skills (Bonwell &
Eison, 1991; Prince, 2004). A review of more than 90 years of research found that cooperation
improved learning outcomes relative to individual work (Johnson et al., 1998).
Peer involvement and teacher/student interaction have high influence on student learning in higher
education is stated by Astin (1993) as a conclusion of a huge study in the USA. Beichner (2008)
arrived to a similar conclusion in SCALE-UP project.
Also in mathematics it is often recommended that students do not work alone. Many projects of
Calculus Reform utilized cooperative learning (Ganter, 1999). According to the Association of
Teachers of Mathematics from the United Kingdom “teaching and learning are cooperative activities”
(Laurence, 2010). “Teamwork” among students and faculty is used in IMPULSE project (Pendergrass
et al., 1999) and also in CALC project (Moore & Smith, 1992). The project Calculus in Context
encourages “collaborative work” (Callahan et al., 1995).
Working memory
Working memory cannot to deal with many processes at the same time so to avoid the over request
of working memory, students should exercise some procedures to make them immediate and free
space in the working memory (Albuquerque, 2011; John Sweller et al., 1998). At the same time,
teachers should have in mind that restriction of “space” and should not use, at the same time, too
many new concepts. Even in terms of language: the simple fact of using an unusual terminology

216
makes the student to use his working memory do decode it. So, for example, the use of the simplest
language as possible frees “space” to other contents.
Assessment
Traditional assessment is not an accurate measure of learning effectiveness in AM1since it is possible
that students with success on the traditional assessment only have an understanding based in
processes and a low level of concepts image (Domingos, 2003). To do regularly cumulative tests with
feedback, if possible of open response, increases students learning (Roediger & Karpicke, 2006).
Concept Maps
The use of concept maps created by the students or by the teacher is a helpful strategy to get
meaningful learning (Moreira, 1980, 2005; Moreira & Masini, 1982). The concept maps allow to
recognize connections between contents and to get the “big picture” of a concept.
Practical contributions 7.2
This research lead to two practical contributions: the construction of the ILDs (Interactive Learning
Documents) and the implementation of Moodle, a Learning management System, in ISEL.
7.2.1 Interactive Learning Documents (ILDs)
As support to the ActivMathComp approach this researcher created a set of interactive digital
documents to support learning. The ILDs are all the material that students need for the course: the
slides of the teacher, the support book (with interactive theory, exercises, links to useful sites, etc.) the
"daily diary" where students solve the exercises and take their notes, etc. The ILDs are interactive;
they drive students to answer questions, to complete the settings, to select the properties that make
sense, to choose the meaningful options, etc. That interactivity is enabled by the use of Combo Boxes,
Check Boxes, Text Fields, etc. (see Figure 79).

217
Figure 79. Example of a page from a ILD with Combo Boxes and Check Boxes.
Those documents were conceived with the purpose of foster active learning, of allow students to
study at his own pace (having in mind the Proximal Development Zone of the students), of take
students to use software and to follow useful external links many of them with applets or tutorials
about the concept in study. The ILDs are connected to short quizzes in Moodle that allow students to
verify their level of understanding of a concept.
The approach of a concept starts by concrete and only next goes to its abstract formulation, or at
most approach both formulations side to side, never does, as is usual, first the abstract and then the
concrete formulation (see Figure 80). Application problems are emphasized. In each moment one
objective is focused and only that objective is explored (except in final exercises) because many times
a student cannot conclude an exercise because he does not understood/ got proficiency in the previous
concept. So, as far as possible, the concepts are explored independently. Multiple representations of a
concept, like graphical, verbal, analytical and numerical, are always explored in order to deepen the
apprehension of the concept. Students are encouraged to make Concept Maps of every chapter to

218
understand the relations among concepts and get the “reconciliação integradora” that allows
meaningful learning.
Figure 80. Example of a page from a ILD where the approach of a concept goes from concrete to abstract
and where are used multiple representations of a concept.
The appearance of the ILDs was not neglected. It intends to be appellative, carefully structured
and concentrated in one only document that belong to the student and he may manipulate and
comment at his own way. It may be keep forever by the student with his personalization.
Some advantages and some disadvantages came from the fact of the ILDs being digital or in
paper; stay online or being downloaded to the student; etc. The digital option has the disadvantages of
requiring students to possess their own laptop and always bring the laptop to class; moreover it is not
yet very simple to write mathematical symbols on computers. It is true that, with expertise, the ILDs
could be made using sheets of paper photocopied or printed. For example, one activity that includes a

219
Combo Box may be substituted in a sheet of paper by the same activity with the same options written
on paper and the student chooses, as well, the meaningful option. The paper option would be,
however, more expensive, less ecological and perhaps less attractive.
The fact that the theory and the questions are already written in the ILDs assures that students do
not have to copy it to the daily diary. This frees up time that may be fully spent thinking about the
problem instead of being spent making a copy. People may think that when the student is "copying to
the daily diary” he internalizes it but if instead of “copying it to the daily diary” the student is from
that moment reflecting about it, trying to apply it to solve the exercise, or choosing the correct item to
complete a property – perhaps he does not internalize less (see Figure 81.).
Figure 81. Example of a page from a ILD where the student only have to think about the properties of
integrals, does not have to copy it.
7.2.2 The implementation of Moodle
Since the beginning of this research, the researcher took contact with Learning Management Systems
and understood that it was missing in ISEL. After some research about the various possibilities
available got to the conclusion that the best solution for ISEL was to implement Moodle. It was
already implemented in ISEL but only to the Informatics Department. After many conversations,
reunions and pressures the Mooodle was implemented in the whole ISEL and is now its Learning

220
Management System adopted in all departments. The researcher was responsible for its divulgation
and formation of the teachers in the departments of Civil Engineering and Mathematics where it is
widely used.
Empirical Contributions 7.3
The ActivMathComp was implemented in a non-ordinary class. Its evaluation shows a positive
tendency. It achieved a higher average and higher grades, with statistical significance, than the
traditional approach. It also got a much higher success rate. Since the group was not randomly
assigned there is a doubt: do those higher grades come from some special characteristics of those
students? Many differences in characteristics of students were discarded, tiny doubts remain.
The ActivMathComp had an overwhelmingly positive evaluation by students in nearly all items.
7.3.1 Primary hypothesis
The primary hypothesis of this thesis is: Does the ActivMathComp (actively learning mathematics
using computer) approach enhance learning (gets higher grades and higher success rate) relatively to
the traditional approach to teach the course of Mathematical Analysis1 (AM1)?
TEAM1 students get higher grades and higher success rate than the other students of AM1. Their
average was 8.8 values against 5.7 values for the others students. Moreover, the rate of approved over
assessed was nearly twice higher for TEAM1 students.
Many characteristics of TEAM1 students may have led to this difference in grades – many were
dropped (see Discussion), the doubt remains if “TEAM1 grades were higher because…”:
TEAM1 had more working students (and there is not an homologous group in the
comparison group to make a comparison);
TEAM1 students were in ISEL for three semesters or more in ISEL (and there was no
difference in grades when compared with the homologous group in the comparison group);
TEAM1 students were 19 years old or more, were in LEC/AM1 for three semesters or more
and were in a daytime class (and there was no difference in grades when compared with the
homologous group in the comparison group);
TEAM1 students could be more motivated (and it cannot be measured).

221
But, since TEAM1 was resistant to so many tests, and it was almost impossible to be resistant to
all, we conclude that TEAM1 students had a better performance than others students of AM1 and
therefore the ActivMathComp is a more effective approach than the traditional.
7.3.2 Secondary hypotheses
Attitude to AM1
As far as students’ attitude towards AM1 is concerned, the studies indicate (although it is not possible
to guarantee, nor assign a cause) that TEAM1 students were not different from the comparison group
in terms of number of classes missed, number of hours spent studying, commitment, study methods,
relationship to AM1 nor in satisfaction with external support; TEAM1 students only scored higher
than the comparison group in terms of quantity of study, liking teaching method, usefulness of
materials, liking teacher support in class and out of class.
Acceptance of TEAM1
As for acceptance of TEAM1, the result is positive. All TEAM1 students state that they would return
to participate in TEAM1 and most students that did not participate state that it was because the
schedule was bad or because they did not have a laptop; they state that they would participate if there
were a TEAM1 again (with a good schedule for them).
Interactive Learning Documents
The Interactive Learning Documents (ILDs) get a strongly positive evaluation by the students.
According to them, the ILDs were useful, well organized and it was easy to find a subject and/or a
formula within them. Their uniformity was helpful, although it may disrupt visual memory for some
students.
Write mathematics
The experience of writing mathematics on the computer was not valuable. Students and teacher got to
the conclusion that it takes much more time to write mathematics on the computer than handwriting;
and that time could be better used to think about the subject itself.

222
Quizzes
The quizzes were considered by students (and the teacher agreed) as one of the fundamental elements
of the approach. Their utility has to do with the fact of forcing students to study continuously, and by
the fact of giving feedback to students about their performance which allows them to adequate the
level of study needed to reach their goals. To me (the teacher) the quizzes were also useful since they
allow me to realize in which concepts students have more difficulties and review it. All of this
without much effort from the teacher since the quizzes were automatically graded in Moodle.
Number of students
According to students it was very important to have few students in class. The teacher disagree:
believe that with until 45 students it would be acceptable to use the ActivMathComp approach
because with those 15 students most of the time the teacher was doing nothing, so had time to give
support to many more students (beyond that it is supposed that students help each other).
Active learning
All but one student of TEAM1 said that prefer active learning to expositive learning. All students
strongly liked the way lessons were conducted. Nearly all, have found useful “the fact that they do not
spend time copying the theory (which was on the ILDs) and using it to solve exercises”, “to see not
only the analytical part of mathematics but also the graphical and numerical” and “to see some
applications of the themes that they were studying”. The fact that “the subject was shown in an
interactive and not expositive way” was useful to the biggest part of them.
Class atmosphere
We cannot know what is the cause, if it is the approach, the students or the teacher but the atmosphere
in class was, as is confirmed by the students and the teacher, the expected in the approach: "empathy
between teacher and students so that students feel supported and sustained rather than judged and
evaluated" (Rogers, 1969) ; an atmosphere of concentration, work and cooperation among
students/peers/teacher; in class, the students (nearly all) were committed, worked hard and focused,
solved exercises by themselves and clarified doubts.

223
Threats to validity 7.4
In addition to all the threats that were attempted to study with questionnaires and that have already
been discussed above, there are some limitations that have not been addressed yet.
After the questionnaire of AM1 had been experienced in some students, another group of
questions was added to it (as a request of the Scientific Area of Mathematics of the ISEL-to study the
reasons of the high dropout to AM1 in LEC) that made the questionnaire become too long. Maybe
that is why there were a small number of respondents compared to the number of students of AM1
and taking into account the insistence of the publicity of the questionnaire. Perhaps, this was also the
cause of the inaccuracy of the answers (was found many meaningless answers). Because of getting
few answers, the teacher left the questionnaire online until the end of the semester that followed. For
that reason some of the answers referred to the semester in progress at that time rather than the
semester that was assessed – however, these responses were not dismissed because the important was
that respondents belonged to AM1, regardless of which semester.
Generality 7.5
Since TEAM1 students and the students from the comparison group had no differences in easiness
and enjoyment to use the computer, this is not an obstacle to the application of ActivMathComp.
Since AM1 students from LEC-ISEL are students without any specific characteristic (for example:
entrance grade is not very high nor very low; the students are not only girls nor only boys) it is natural
that the conclusions about this approach (with its limitations) could be generalized to any student of
graduation in engineering at the Portuguese higher education (or similar).
Future work 7.6
The natural future work is to implement the ActivMathComp approach in other classes of AM1 in
ISEL and other institutes and study the results.

224
This approach, ActivMathComp, may also be improved. The ILDs may be improved in order to
enable students to get solutions of exercises on the internet just by pushing a button (this will be made
only for exercises that are to be solved out of class – since to the other exercises it is not a good
strategy).This may be made, as all the interaction was made, using the package eForms that is part of
AcroTeX (http://www.acrotex.net/) that is used to create interaction in LaTeX.
In the alignment of PISA, exercises will be included in the ILDs that, in addition to being from
real life, have superfluous data to make the students choose what is relevant to solve the problem.
This approach will include a questionnaire to class, in the middle of the semester, where it is
asked: “What do you prefer in this approach and must be kept?” and “What don’t you like in this
approach and must be changed?” as recommended by Rosenthal (1995), to get feedback about the
approach without spending much time.
In the future it might be studied if TEAM1students get more success to AM2/mathematics/other
graduation courses than the other students, but it is not interesting since they were not randomly
assigned to TEAM1 so it is not possible to determine if they were different a priori.
Another direction points towards a creation of a site similar to http://www.slideshare.net but
allowing to share slides in many formats including LaTeX (a software that allows to easily introduce
mathematical notations and that are largely used by college mathematics teachers). It does not exist
anywhere on the web (as far as I could search). It will allow to share the ILDs.
In a different direction, is natural to study if interactive documents allow a deeper understanding
of concepts and how to improve the documents in order to get deeper understanding and a kind of
understanding where the student do not forget in a few months.

225
Abramovich, S., & Levin, I. (1994). Spreadsheets in teaching and learning topics in calculus
International Journal of Mathematical Education in Science and Technology, 25(2),
263-275.
Albuquerque, P. B. (2011). É preciso levar a memória de trabalho para a escola? Contributo
de uma memória limitada para o sucesso académico Em causa: aprender a aprender.
Lisboa: Fundação Francisco Manuel dos Santos.
Anderson, R. D., & Loftsgaarden, D. (Eds.). (1987). A special calculus survey: preliminary
report (Vol. No. 8). Washington, DC: Mathematical Association of America.
Araujo, I. S., Veit, E. A., & Moreira, M. A. (2006). Physics students' performance using
computational modelling activities to improve kinematics graphs interpretation.
Computers & Education, 50(2008), 1128-1140.
Artigue, M. (1990). Enseigner autrement les mathématiques en deug: A Premiere Année,
Principes et Realisations: IREM de Lille, 59655 Villeneuve d’Ascq Cedex, France.
Astin, A. (1993). What Matters in College? Four Critical Years Revisited San Francisco:
Jossey-Bass, Inc.
Ausubel, D. P., Novak, J. D., & Hanesian, H. (1978). Educational psycology. New York:
Holt, Rinehart and Winston.
Aydin, C. C., & Tirkes, G. (2010). Open source learning management systems in e-learning
and moodle. Paper presented at the IEEE EDUCON Education Engineering- The
future of global learning engineering education, Madid.
Banchoff, T. (2005). Interactive Geometry and Multivariable Calculus on the Internet. Paper
presented at the KAIST International Symposium on Enhancing University
Mathematics Teaching, Korea.
Becerra, F. (2005). Aprendizaje en colaboración mediado por simulación en compuador.
Efectos en el aprendizaje de procesos termodinâmicos. Revista de Estudios Sociales,
20(Junio), 13-26.
References

226
Beichner, R. J. (2008). The SCALE-UP Project: A Student-Centered Active Learning
Environment for Undergraduate Programs. Paper presented at the BOSE Conference
on Promising Practices-Innovation in Undergraduate STEM Education, Washington,
DC.
Beichner, R. J., & Saul, J. M. (2003). Introduction to the SCALE-UP Project Paper presented
at the International School of Physics "Enrico Fermi", Varenna, Italy.
Beichner, R. J., Saul, J. M., Abbott, D. S., Morse, J. J., Deardorff, D. L., Allain, R. J., . . .
Risley, J. S. (2007). The Student-Centered Activities for Large Enrollment
Undergraduate Programs (SCALE-UP) Project Research-Based Reform of University
Physics (Vol. 2): Physics Education Research.
Benson, S. B. L., Moss, W., Ohland, M., & Schiff, S. (2007). Adapting and implementing the
SCALE-UP approach in statics, dynamics and multivariable calculus. Paper
presented at the ASEE Anual Conference and Exposition, Honolulu, HI.
Blackwell, L. S., Trzesniewski, K. H., & Dweck, C. S. (2007). Implicit Theories of
Intelligence Predict Achievement Across an Adolescent Transition: A Longitudinal
Study and an Intervention. . Child Development, 78(1), 246-263.
Blakemore, S.-J., & Frith, U. (2005). O cérebro que aprende: Lições para a educação.
Lisboa: Gradiva.
Bonwell, C. C., & Eison, J. A. (1991). Active learning: Creating Excitement in Classroom.
(W. George Washington Univ., DC. School of Education and Human
Development., Trans.): ASHE- ERIC.
Borchelt, N. (2007). Cognitive Computer Tools in the Teaching and Learning of
Undergraduate Calculus. International Journal for the Scholarship of Teaching and
Learning, 1(2), 1-17.
Borovik, A. (2011). Information technology in university-level mathematics teaching and
learning: a mathematician’s point of view. Research in Learning Technology, 19(1),
73-85.
Bremer, D., & Bryant, R. (2005). A comparison of two learning management systems:
Moodle vs. Blackboard. Paper presented at the 18th anual conference of the national
advisory committee on computing qualifications.
Butler, M., Pyzdrowski, L., Goodykoontz, A., & Walker, V. (2008). The Effects of Feedback
on Online Quizzes. International Journal for Technology in Mathematics Education,
15(4), 131-136.
Callahan, J., Cox, D. A., Hoffman, K. R., O'Shea, D., Pollatsek, H., & Senechal, L. (1995).
Calculus in Context: The Five College Calculus Project. New York: W. H. Freeman
and Company.

227
Caprotti, O., Seppala, M., & Xambó, S. (2007). Novel Aspects of the Use of ICT in
Mathematics Education. Innovations in E-learning, Instruction Technology,
Assessment, and Engineering Education, 295-299.
Carneiro, P. (2011). Promovendo a aprendizagem através dos testes Em causa: Aprender a
aprender. Lisboa: Fundação Francisco Manuel dos Santos.
Carvalho e Silva, J. (1997). A formação de professores em novas tecnologias da informação
e comunicação no contexto dos novos programas de Matemática do Ensino
Secundário. Paper presented at the 2º Simpósio: Investigação e Desenvolvimento de
Software Educativo, Coimbra.
Carvalho e Silva, J. (2003). A Matemática, a Tecnologia e a Escola. Educação e Matemática,
71.
Chickering, A. W., & Gameson, Z. F. (1987). Seven Principles for good practice. A. A. H. E.
Bulletin, 39, 3-7.
Christou, C., Mousoulides, N., Pittalis, M., & Pitta-Pantazi, D. (2004). Proofs through
exploration in dynamic geometry environments. International Journal of Science and
Mathematics Education, 2, 339-352.
Cohen, L., Manion, L., & Morrison, K. (2005). Research Methods in Education (5th ed.):
Routledge Falmer.
Collins, A. (1991). The role of computer technology in restructuring schools. Phi Delta
Kappan, 73, 28-36.
Computer History Museum. (2011) Retrieved 23-11-2011, from
http://www.computerhistory.org/revolution/personal-computers/
Corich, S. (2005). Is it time to Moodle? Paper presented at the 18th anual NACCQ
conference, New Zealand.
Crato, N. (2004, 4/12/2004). A tabuada e a máquina de calcular. Expresso.
Crato, N. (2005, 11-05-2005). Paradoxos da Pedagogia. Jornal de Letras, Artes e Ideias.
Crato, N. (2009). Melhorar o ensino da matemática com ferramentas do século XXI.
Seminário. Retrieved from
http://alfaebeto.org.br/profissaoprofessor/administrator/pdf/artigo_seminario_2009_n
uno_crato.pdf
Crouch, C. H., & Mazur, E. (2001). Peer Instrucction: Ten years of experience and results.
American Journal of Physics, 69(9), 970-977.
Cummins, K. (1960). A Student Experience-Discovery Approach to the Teaching of
Calculus. Mathematics Teacher, 31-39.

228
Dagher, A. (1993). A environnement informatique et apprentissage de l’articulation entre
registres, graphique et algébrique de représentation des fonctions. . PhD, Universite
Paris VII, France.
Dancey, C., & Reidy, J. (2004). Statistics without Maths for Psychology: Using SPSS for
Windows: Pearson Education Limited.
Davis, B., Porta, H., & Uhl, J. (1994). CALCULUS&Mathematica. USA: Addison- Wesley
Publishing Company.
Dickey, E. (1998). (A review of) Modellus: interactive Modeling with Mathematics. The
Mathematics Teacher, 91(6), 528-530.
Domingos, A. (2003). Compreensão de concetos matemáticos avançados- a matemática no
início do superior. PhD, Universidade Nova de Lisboa, Lisboa.
Dori, Y. J., & Belcher, J. (2004). Improving student's understanding of electomagnetism
throught visualizations- A large scale study. Paper presented at the 2004 NARST-
Annual meeting- National Association for Research in Science Teaching Conference,
Vancouver.
Duval, R. (1988). Graphiques et Equations: L’Articulation de deux registres. . Annales de
Didactique et de Sciences Cognitives.
Engle, R. W. (2010). Role of working memory capacity in cognitive control. Current
Anthropology, 51(S1).
Erfle, S. (2000). Using Excel to teach Managerial Economics: the Experience at Dickinson
College. Paper presented at the 28th Annual Conference of the International Business
School Computing Association, Pennsylvania.
Felder, R. M. (1996a). Matters of Style. ASEE Prism, 6(4), 18-23.
Felder, R. M. (1996b). Matters of style. ASEE, 6(4), 18-23.
Felder, R. M., & Brent, R. (2005). Understanding student differences. Journal of engineering
education, 94(1), 57-72.
Felder, R. M., & Silverman, L. K. (1988). Learning and Teaching Styles: In Engineering
Education. [2002]. Engineering Education, 78(7), 674-681.
Felder, R. M., & Silvermann, L. K. (1988). Learning and teaching styles in engineering
education. Engineering Education, 78(7), 674-681.
Felder, R. M., & Spurlin, J. (2005). Applications, reliability and validity of the index of
learning styles. International Journal of Engineering Education, 21(1), 103-112.

229
Ferrini-Mundy, J., & Guçler, B. (2009). Discipline-based efforts to enhance undergraduate
STEM education. New directions for teaching and learning, 117, 55-67. Retrieved
from http://www3.interscience.wiley.com/cgi-bin/home?CRETRY=1&SRETRY=0
Field, A. (2009). Discovering statistics using SPSS (3rd ed.): Sage.
Frith, V., Jaftha, J., & Prince, R. (2002). Integration of interactive excel tutorials into
bridging (pre-calculus) course. Paper presented at the 2nd International Conference
on the Teaching of Mathematics, Greece.
Ganter, S. L. (1999). An evaluation of calculus reform: a preliminary report of a national
study. In B. Gold, S. Keith & W. Marion (Eds.), Assessment practices in
undergraduate matematics. USA: The Mathematical Association of America.
Gleason, A. M., & Hughes-Hallett, D. (1992). The calculus consortium based at Harvard
University, Focus on calculus: A newsletter for the calculus consortium based at
Harvard University.
Good, C., Aronson, J., & Inzlicht, M. (2003). Improving Adolescents’ Standardized Test
Performance: An Intervention to Reduce the Effects of Stereotype Threat. Journal of
Applied Developmental Psychology, 24(645-662).
Gordon, S. P., Hughes-Hallett, D., Ostebee, A., & Usiskin, Z. (1994). Report of the content
workshops. Paper presented at the Preparing for a new calculus: Conference
Proceedings, Washington, D.C.
Gravemeijer, K., & Doorman, M. (1999). Context Problems in Realistic Mathematics
Education: A Calculus Course as an Example. Educational Studies in Mathematics,
39(1), 111-129.
Grolnick, W. S., & Ryan, R. M. (1987). Autonomy in children’s learning: An experimental
and individual difference investigation. Journal of Personality and Social
Psychology, 52(5), 890-898.
Gustafsson, J.-E., & Balke, G. (1993). General and Specific Abilities as Predictors of School
Achievement. [Article]. Multivariate Behavioral Research, 28(4), 407.
Hake, R. (1998). Interactive-Engagement vs. Traditional Methods: A Six-Thousand-Student
Survey of Mechanics Test Data for Introductory Physics Courses. American Journal
of Physics, 66(1), 64.
Hartley, J., & Davies, I. (1978). Note Taking: A Critical Review. Programmed Learning and
Educational Technology, 15, 207-224.
Heid, M. (1988). Resequencing skills and concepts in applied calculus using the computer as
a tool. Journal for Research in Mathematics Education, 19(1), 3-25.

230
Hughes-Hallett, Gleason, McCallum, Flath, Lock, Lomen, . . . Tecosky-Feldman. (2005).
Calculus: Single Variable (4th ed.). USA: John Wiley & Sons, Inc.
Hughes-Hallett, D., & Gleason, A. (1992). The Calculus Consortium based at Harvard.
Focus on Calculus, 1, 1. Retrieved from http://he-
cda.wiley.com/WileyCDA/Section/id-100326.html
Hughes-Hallett, D., Gleason, A., Callum, W. M., Osgood, B., Flath, D., Quinney, D., . . .
Tucker, T. (2005). Calculus: single variable (4th ed.). USA: John Wiley & Sons, Inc.
Hughes-Hallett, D., Gleason, A., Callum, W. M., Pilzer, S., Robinson, M., Lomen, D., . . .
Thrash, J. (2003). ConcepTests:Calculus (3rd ed.). New Jersey: John Wiley & Sons,
Inc.
Hughes-Hallett, D., Lock, P., Gleason, A., Flath, D., Lomen, D., Lovelock, D., . . . Thrash.
(2006). Applied Calculus (3rd ed.): John Wiley & Sons, Inc.
Husch, D. S. (2001). An Investigation of the Relationships between Learning Styles,
Personality Temperaments, Mathematics Self-Efficacy, and Post-Secondary Calculus
Achievement. PhD, The University of Tennessee, Knoxville.
Husch, L. S. (2002). Visual calculus - Development and tools Paper presented at the
Multimedia Tools for communicating mathematics, Berlin.
Johnson, D., Johnson, R., & Smith, K. (1998). Active Learning: Cooperation in the College
Classroom (2nd ed.). Edina, MN: Interaction Book Co.
Joiner, K. F., Malone, J. A., & Haimes, D. H. (2002). Assessment of classroom environments
in reformed calculus education. Learning Environments Research, 5(51–76).
Juan, A., Huertas, A., Steegmann, C., Corcoles, C., & Serrat, C. (2008). Mathematical e-
Learning: State of the Art and Experiences at the Open University of Catalonia.
International Journal of Mathematical Education in Science and Technology, 39(4),
455-471.
Kaput, J. J. (1994). The representational roles of technology in connecting mathematics
with authentic experience. In R. Biehler, R. W. Scholz, R. Sträßer & B. Winkelmann (Eds.),
Didactics of Mathematics as a Scientific Discipline (pp. 379-397). Dordrecht: Kluwer
Academic Publishers.
Karpicke, J. D., & Roediger, H. L. (2007). Repeated retrieval during learning is the key to
long-term retention. Journal of Memory and Language, 57, 151-162.
Kayes, D. C. (2002). Experiential learning and its critics: Preserving the role of experience in
management education. Academy of Management Learning and Education, 1(2), 137-
149.

231
Keefe, J. W. (1979). Learning Style: An Overview. In J. W. Keefe (Ed.), Student Learning
Styles: Diagnosing and Prescribing Programs. Reston, Va.: National Association of
Secondary School Principals.
Kent, P., & Noss, R. (2003). Mathematics in the University Education of Engineers. London:
The Ove Arup Foundation.
Kolb, A. Y., & Kolb, D. A. (2005a). The Kolb Learning Style Inventory—Version 3.1:
Technical Specifications
Kolb, A. Y., & Kolb, D. A. (2005b). Learning Styles and Learning Spaces: Enhancing
Experiential Learning in Higher Education. Academy of Management Learning &
Education, 4(2), 193-212.
Kolb, D. A. (1984). Experiential learning: experience as the source of learning and
development. Englewood Cliffs, NJ: Prentice Hall.
Kuhn, J. R. D. (1999). An interactive workbook for internet and classroom students. Purdue
University North Central. Retrieved from
http://faculty.pnc.edu/jkuhn/research/research.html
Kulik, C.-L. C., & Kulik, J. A. (1985). Effectiveness of computer-based education in
colleges. Paper presented at the Annual Meeting of the American Educational
Research Association, Chicago.
Kuri, N. P., & Truzzi, O. M. S. (2002). Learning Styles of Freshmen Engineering Students.
Paper presented at the International Conference on Engineering Education, Arlington,
Va.
Lang, X. (1999). CAl and the reform of calculus education in China. International Journal of
Mathematics Education on Science and Technology, 30(3), 399-404.
Lasry, N., Mazur, E., & Watkins, J. (2008). Peer instruction: From Harvard to the two-year
college. American Journal of Physics, 76(11), 1066-1069.
Laurence, D. (2010, September). A short route to General Council of ATM. Matematics
teaching, 15.
Lavicza, Z. (2007). Mathematicians’ uses of Computer Algebra Systems in mathematics
teaching in the UK, US, and Hungary. Paper presented at the CETL-MSOR
Conference, Birmingham.
Lavicza, Z. (2010). Integrating technology into mathematics teaching at university level.
ZDM Mathematics Education, 42, 105-119.
Liang, J., & Martin, L. (2008). An Excel-aided method for teaching calculus-based business
mathematics. College Teaching Methods & Styles Journal, 4(11), 11-24.

232
Lyman, F. T. (Ed.). (1981). The responsive classroom discussion: The inclusion of all
students.: University of Maryland Press.
MAA. (1986). Toward a lean and lively calculus. In R. G. Douglas (Ed.), Report of the
conference/workshop to develop curriculum and teaching methods for calculus at the
college level Washington, DC: Matematical Association of America.
Machado, E. (2006). Os computadores na facilitação da aprendizagem: estudo tomando o
conceito de função. PhD, Universidade do Minho.
Machado, M., & Tao, E. (2007). Blackboard vs. Moodle: Comparing user experience of
learning management systems. Paper presented at the 37th ASEE/IEEE Frontiers in
education conference, Milwaukee, WI.
Maxima. (n.d.). Maxima, a Computer Algebra System Retrieved 18/02, 2013, from
http://maxima.sourceforge.net/
Mayer, R. E., Heiser, J., & Lonn, S. (2001). Cognitive constraints on multimedia learning:
When presenting more material results in less understanding. Journal of Educational
Psychology, 93, 187-198.
Mazur, E. (1997). Peer Instruction. A user's manual. New Jersey: Prentice Hall.
McCallum, W. G., Hughes-Hallett, D., Gleason, A. M., Flath, D. E., Osgood, B. G., Quinney,
D., . . . Mumford, D. (2005). Calculus: multivariable (4th ed.): John Wiley & Sons,
Inc.
Melacon, J. G., & Thompson, B. (Eds.). (1994) Anual meeting of the mid-south educational
research association. Nashville.
Montgomery, S. M. (1995). Addressing diverse learning styles through the use of
multimedia. Paper presented at the Fronteers in Education Conference.
Moore, L., & Smith, D. (1992). Project CALC: Calculus as a laboratory course Computer
Assisited Learning (pp. 16-20). Berlin/Heidelberg: Springer
Moreira, M. A. (1980). Mapas conceituais como instrumentos para promover a diferenciação
conceitual progressiva e a reconciliação integrativa. Ciência e cultura, 32(4), 474-
479.
Moreira, M. A. (2005). Mapas conceptuales y aprendizaje significativo. Revista Chilena de
Educação Científica, 4(2), 38-44.
Moreira, M. A., & Masini, E. F. S. (1982). Aprendizagem significativa: a teoria de
aprendizagem de David Ausubel. São Paulo: Editora Moraes.
Morgan, P., & Ritter, S. (2002). An experimental study of the effects of Cognitive Tutor®
Algebra I on student knowledge and attitude. Pittsburgh, PA: Carnegie Learning Inc.

233
Muijs, D. (2004). Doing Quantitative Research in Education with SPSS: Sage Publications.
Mullis, I. V. S., Martin, M. O., Robitaille, D. F., & Foy, P. (2009). TIMSS Advanced 2008
International Report: Findings from IEA's Study of Achievement in Advanced
Mathematics and Physics in the Final Year of Secondary School: International
Association for Evaluation of Educational Achievement.
Mumford, D. (1997). Calculus Reform - For the Millions. Notices of the AMS, 44, 559-563.
NCTM. (2000). Principles and standards for school mathematics (pp. 12).
Nelson, C. E. (1996). Student diversity requires different approaches to college teaching,
even in math and science. American behavioral scientist, 40(2), 165-175.
Neves, R., Silva, J., & Teodoro, V. (2009). Computational modelling with Modellus: An
enhancement vector for the general university physics course. Paper presented at the
Frontiers in Science Education Research Conference (FISER09), North Cyprus.
Novak, J. D. (1984). Learning how to learn. Ithaca, NY.: Cornell University Press.
NSF. (1986). Undergraduate Science, Mathematics and Engineering Education: Role for the
National Science Foundation and Recommendations for Action by Other Sectors to
Strengthen Collegiate Education and Pursue Excellence in the Next Generation of
U.S. Leadership in Science and Technology. Washington: National Science Board.
Ochoa, J. A. V. (2012). La Comprensión de la Tasa de Variación para una Aproximación al
Concepto de Derivada. Un Análisis desde la Teoría de Pirie y Kieren. PhD,
University of Antioquia.
OECD. (2003). First results from PISA 2003: Executive summary PISA Publications. Paris:
OECD
OECD. (2009). PISA 2009: Assessment framework: Key competencies in reading,
mathematics and science PISA Publications: OECD.
Oldknow, A., Taylor, R., & Tetlow, L. (2010). Teaching Mathematics Using ICT (3rd ed.):
Continuum International Publishing Group.
Pallant, J. (2007). SPSS Survival Manual (3rd ed.): McGraw-Hill.
Palmiter, J. R. (1991). Effects of computer algebra systems on concept and skill acquisition
in calculus Journal for Research in Mathematics Education, 22(2), 151-156.
Papert, S. (1991). Situating constructionism: In constructionism Norwood, NJ: Ablex
Publishing.
Pendergrass, N. A., Kowalczyk, R. E., & Dowd, J. P. (1999). Improving First-year
Engineering Education. Paper presented at the 29th ASEE/IEEE Frontiers in
Education Conference, Puerto Rico.

234
Pierce, R., & Atkinson, L. (2003). Interactive Animation Provides a Vehicle for Exploring
Students’ Understandings of Derivatives. Mathematics Education Research Group of
Australasia.
Plano, G. S. (2004). Kent School District. Washington: Carnegie Learning.
Ponte, J. P., & Serrazina, L. (2004). As práticas de professores de Matemática em Portugal.
Educação e Matemática, 80, 8-12.
Prince, M. (2004). Does Active Learning Work? A review of the research. J.Engr.
Education, 93(3), 223-231.
Pyc, M. A., & Rawson, K. A. (2009). Testing the retrieval effort hypothesis: Does greater
difficulty correctly recalling information lead to higher levels of memory? Journal of
Memory and Language, 60(4), 437-447. doi: 10.1016/j.jml.2009.01.004
Redish, E., Saul, J., & Steinberg, R. (1997). On the Effectiveness of Active-Engagement
Microcomputer-Based Laboratories. American Journal of Physics, 65(1), 45.
Roedel, R., Kawski, M., Doak, B., Politano, M., Duerden, S., Green, M., . . . Evans, D.
(1995). An integrated, project-based, introductory course in calculus, physics,
English, and engineering. Paper presented at the Frontiers in Education Conference.
Roediger, H. L., & Karpicke, J. D. (2006). Test enhanced learning: Taking memory tests
improves long-term retention. Psychological Science, 17, 249-255.
Rogers, C. (1969). Freedom to Learn: A View of What Education Might Become. (1st ed.).
Columbus ,OH: Charles E. Merrill.
Rosenthal, J. S. (1995). Active learning strategies in advanced mathematics classes.
Studies in Higher Education, 20(2), 223-228.
Ross, S. (1993). Computers and physics teaching. Physics Education, 28(2), 69.
Rubin, A. (1999). Technology meets math education: Envisioning a practical future Paper
presented at the Forum on the future of technology in education.
Rubin, L., & Hebert, C. (1998). Model for active learning. College Teaching, 46(1), 26.
Ruhl, K., Hughes, C., & Schloss, P. (1987). Using the Pause Procedure to Enhance Lecture
Recall. Teacher Education and Special Education, 10, 14-18.
Rule, D. L., & Grippin, P. C. (1988). A Critical Comparison of Learlling Style Instruments
Frequently Used with Adult Learners. Paper presented at the Annual Conference of
the Eastern Educational Research Association, Miami Beach, FL.
Santos, A., Vargas, A., Mendizabal, O., & Madsen, C. (2003). O ModelCiências – um portal
para o projeto Modelagem Semiquantitativa e Quantitativa na Educação em Ciências.
Educar, 217-235.

235
Sarkis, H. (2004). Cognitive Tutor Algebra I Program Evaluation: Miami-Dade County
Public Schools. Lighthouse Point, FL: The Reliability Group.
Schaubhut, N. A., Herk, N. A., & Thompson, R. C. (2009). MBTI Form M Manual
supplement Retrieved from https://www.cpp.com/pdfs/MBTI_FormM_Supp.pdf
Seltzel, S., Hilbert, S., MaceIi, J., Eric Robinson, & Schwartz, D. (1996). An Active
Approach to Calculus: Jossey-Bass Publishers.
Smith, D. A., & Moore, L. C. (1996). Calculus: Modelling and Application.
Massachusetts/Toronto D.C. Heat and Company.
Sweller, J., & Cooper, G. A. (1985). The use of worked examples as a substitute for problem
solving in learning algebra. Cognition and Instruction, 2, 59-89.
Sweller, J., van Merrienboer, J., & Paas, F. (1998). Cognitive Architecture and Instructional
Design. Educational Psychology Review, 10(3), 251-296. doi:
10.1023/a:1022193728205
Tabachnick, B., & Fidell, L. (2007). Using Multivariate Statistics (5th ed.): Pearson.
Tall, D., Smith, D., & Piez, C. (2008). Technology and Calculus. In M. K. Heid & G. M.
Blume (Eds.), Research on Technology and the Teaching and Learning of
Mathematics (Vol. I, pp. 207-258): Research Syntheses.
Tall, D. O. (1992). The transition to advanced mathematical thinking: functions, limits,
infinity and proof. In D. A. Grows (Ed.), Handbook of Research on mathematics
teaching and learning (a project of the N.C.T.M.) (pp. 495-511). New York:
Macmillan.
Tall, D. O. (1993). Students Difficulties in Calculus. Paper presented at the ICME-7, Québec,
Canada.
Tall, D. O. (Ed.). (1991). Advanced Mathematical Thinking. Dordrecht: Kluwer Academic
Publishers.
Tall, D. O., & Schwarzenberger, R. L. E. (1978). Conflicts in the Learning of Real Numbers
and Limits. Mathematics Teaching, 82, 44-49.
Teodoro, V. D. (2002). Modellus: Learning Physics with Mathematical Modelling PhD,
Universidade Nova de Lisboa, Lisboa.
Thielens, & Wagner. (1987). The Disciplines and Undergraduate Lecturing Paper presented
at the annual meeting of the American Educational Research Association,
Washington, D.C.
Timmerman, C. E., & Kruepke, K. A. (2006). Computer-Assisted Instruction, Media
Richness, and College Student Performance. Communication Education, 55(1), 73-
104.

236
Tokpah, C. L. (2008). The effects of computter algebra systems on students' achievement in
mathematics. Kent State University College and Graduate School of Education,
Health and Human Services.
. Toward a lean and lively calculus. (1986). In R. G. Douglas (Ed.), Report of the
conference/workshop to develop curriculum and teaching methods for calculus at the
college level Washington, DC: The Matematical Association of America.
Treisman, U. (1992). Studying students studying calculus: A look at the lives of minority
mathematics students in college. The college mathematics journal, 23(5), 362-373.
Uhl, J. (1995). Interactive calculus at a distance. T H E Journal, 22(11), 67.
Valadares, J., Fonseca, F., & Soares, M. T. (2004). Using Conceptual Maps in physics
classes. Paper presented at the Concept Maps: Theory, Methodology, Technology -
First Int. Conference on Concept Mapping, Pamplona, Spain.
Vygotsky, L. (1978). Mind in society.
Vygotsky, L. S. (1978). Mind in Society: Development of Higher Psychological Processes.
Cambridge, MA: Harvard University Press.
Wilson, B. G., Teslow, J. R., & Taylor, L. (1993). Instructional design perspectives on
mathematics education with reference to Vygotsky's theory of social cognition. Focus
on Learning Problems in Mathematics Teaching, 15(2 & 3), 65-86.
Zerr, R. J. (2010). Promoting Students' Ability to Think Conceptually in Calculus. PRIMUS,
20(1), 1-20.

237
Appendix A – Tests and exams

238

239

240

241

242

243

244
Questionário apenas para os alunos que frequentaram a TEAM1:
Questionário para os alunos que frequentaram a TEAM1:
[nomes dos alunos]
Agradeço a sua colaboração ao responder a este questionário dirigido a TODOS os alunos que frequentaram a
TEAM1 no semestre de inverno de 2009/10.
Este questionário destina-se a analisar a TEAM1, bem como a fazer a comparação entre a
TEAM1 e as turmas tradicionais.
A sua participação é, portanto, muito importante para este estudo.
O tempo estimado para o preenchimento deste questionário é de 10 minutos.
Este questionário é confidencial. Não servirá para prejudicar nem beneficiar os questionados. As respostas não
serão utilizadas para nenhum outro propósito.
Se pretender algum esclarecimento adicional, não hesite em contactar:
Sandra Gaspar Martins
Appendix B – Questionários e Focus
Groups

245
Docente da Área Científica de Matemática do DEC-ISEL
Doutoramento em Ciências da Educação
Unidade de Investigação Educação e Desenvolvimento Faculdade de Ciências e Tecnologia
Universidade Nova de Lisboa
Assinale o seu grau de acordo/desacordo com as afirmações abaixo, utilizando a escala
seguinte.
0 1 2 3 4 5 6 7
Sem
opinião
Nada Médio Muitíssimo
TEAM1 (Turma Experimental de Análise Matemática 1)
1.) Participou na TEAM1 porque o horário era bom?
2.) Participou na TEAM1 por ser apenas duas vezes por semana?
3.) Participou na TEAM1 porque achou interessante?
4.) Participou na TEAM1 porque achou que íria melhorar o seu desempenho?
5.) Participou na TEAM1 porque gosta de experimentar coisas diferentes?
6.) Participou na TEAM1 porque os amigos também vinham?
7.) Passou para a TEAM1 porque começou numa turma de que não gostou?
8.) Participou na TEAM1 porque já conhecia o método de ensino da professora?
9.) Se existisse TEAM1 no próximo semestre, com um bom horário para si, iría
assistir? (Supondo que ainda tinha AM1 por fazer.)
10.) Antes da TEAM1 já era amigo de: [Nomes dos alunos da TEAM1]
11.) Se quiser, acrescente outros motivos porque assistiu à TEAM1, ou algo que lhe
pareça pertinente.

246
Materiais (Documentos Interactivos em PDF)
12.) Os materiais estavam bem organizados?
13.) Era simples encontrar uma dada matéria/fórmula nos PDF's?
14.) Pareceu-lhe útil a standardização/uniformidade dos materiais?
15.) O facto de os materiais serem muito uniformes atrapalhou a memória visual? Ou
seja, conseguia memorizar que o teorema X era o que aparecia no canto direito
daquela certa página? (como acontece quando escrevemos em papel?)
16.) Achou prático e funcional a experiência inicial de escrever matemática no
computador?
Mini-testes
17.) O facto dos mini-testes fornecerem pontos extra, se tivesse aprovação, pareceu-lhe
positivo?
18.) Os mini-testes forçaram-no a não deixar "arrastar" a matéria?
19.) Os mini-testes foram importantes na preparação para os 3 testes oficiais de AM1?
20.) A existência dos mini-testes foi benéfica?
21.) Porquê?
Dois tipos de ensino:
_________________________________________________________________________
Resumidamente, no ensino de tipo 1 o professor expõe a matéria durante muito pouco tempo
e o resto do tempo circula entre os alunos auxiliando-os na resolução dos exercícios (os
próprios alunos também interagem no sentido de se entre-ajudarem).
No ensino de tipo2, grande parte do tempo o professor expõe a matéria e resolve os
exercícios no quadro fazendo perguntas aos alunos.
22.) O ensino na TEAM foi do "tipo 1"?
23.) Prefere o ensino de "tipo1"?

247
24.) Na TEAM1 sentia-se à vontade para fazer perguntas aos colegas?
25.) Na TEAM1 sentia-se à vontade para fazer perguntas à professora?
Caracterização da turma
26.) Existia na TEAM1 um "Clima de empatia entre a docente e os alunos de modo a
que estes se sintam suportados e apoiados ao invés de julgados e avaliados”
Rogers.
27.) Durante as aulas havia um clima de concentração, trabalho e cooperação entre
alunos/colegas/professora.
28.) No início do semestre estava decidido a trabalhar muito e portanto a obter
aprovação.
29.) Independentemente da turma em que estivesse inscrito acha que o resultado seria
o mesmo.
30.) Foi importante termos poucos alunos na sala?
31.) Com o dobro dos alunos na TEAM1, parece-lhe que os resultados seriam piores?
32.) Numa turma TEAM1 com 60 alunos, parece-lhe que os resultados seriam piores?
33.) Em geral, teve mais interesse pelas aulas da TEAM1 do que por outras aulas de
AM1 a que tenha assistido?
34.) Porque lhe parece que isso tenha acontecido?
Caracterização do aluno
35.) Esteve sempre com muito empenho para obter aprovação?
36.) Trabalhou muito?
37.) Trabalhou muito concentrado durante as aulas?
38.) Resolveu, por si, muitos exercícios nas aulas?
39.) Esclareceu todas as dúvidas que lhe iam surgindo nas aulas?
40.) Agradou-lhe a forma como as aulas foram conduzidas?
41.) Pareceu-lhe útil o facto de não gastar tempo a passar a teoria (que estava nos
slides) utilizando-o para resolver exercícios?

248
42.) Foi interessante o facto de ver algumas aplicações das matérias que estava a
estudar?
43.) Foi importante o facto de se ver não só a parte analítica da matemática mas
também a parte gráfica e numérica?
44.) Foi-lhe útil o facto de a matéria ser dada de forma interactiva e não expositiva.
Por exemplo em vez de a professora afirmar que as propriedades são A< B e C>D.
Pedir aos alunos para preencher com desigualdades as relações entre A e B, e
entre C e D.
45.) Teve muito que estudar para outras Unidades Curriculares?
46.) Tem muitas dificuldades nas bases da matemática?
47.) O que esperava da TEAM1? Houve de facto?
48.) O que achou em geral da TEAM1?
49.) De TUDO o que vimos atrás, o que é que considera que teve maior impacto no
seu sucesso/insucesso? (Indique pelo menos 5 items.)
50.) Parece-lhe que, se em vez deste grupo, se tivesse escolhido um grupo aleatório de
alunos de AM1, os resultados teriam sido piores?

249
Questionário para todos os alunos de AM1:
Nota: Este questionário, para além das perguntas necessárias para este estudo, inclui as perguntas
para o estudo das razões que levam ao insucesso/absentismo dos alunos a AM1 que foi realizado pela
Área Científica de Matemática do ISEL (e que tornou o questionário extenso).
Questionário: Análise Matemática 1
Agradeço a sua colaboração ao responder a este questionário dirigido a TODOS os alunos de Análise
Matemática 1 do ISEL do semestre de Inverno de 2009/10.
Este questionário destina-se a compreender os motivos que levam à reprovação/absentismo em AM1
bem como a fazer a comparação entre a Turma Experimental de Análise Matemática 1 e as turmas
tradicionais. A sua participação é, portanto, muito importante para este estudo e portanto para melhorar a
Unidade Curricular de AM1.
(Existe um inquérito semelhante para ALGA que agradecemos que também responda.)
O tempo estimado para o preenchimento deste questionário é de 10 a 15 minutos.
Este questionário é confidencial. Não servirá para prejudicar nem beneficiar os questionados. As respostas não
serão utilizadas para nenhum outro propósito.
Se pretender algum esclarecimento adicional, não hesite em contactar:
José Alberto Rodrigues
Responsável de Análise Matemática 1
Docente da Área Científica de Matemática do DEC-ISEL
e
Sandra Gaspar Martins
Docente da Área Científica de Matemática do DEC-ISEL

250
Caracterização do aluno
Geral
1) Sexo:
2) Idade:
3) Trabalhador/estudante:
Assinale o seu grau de acordo/desacordo com as afirmações seguintes, utilizando esta escala:
0 1 2 3 4 5 6 7
Sem opinião Nada Médio Muitíssimo
4) Até que ponto tem facilidade em utilizar o computador?
5) Até que ponto gosta de utilizar o computador?
Ensino Secundário
6) Disciplina de Matemática que frequentou no ensino Secundário.
7) No caso de ter escolhido "outra" na pergunta anterior, indique qual.
8) Nota a matemática no 12º ano. Nota a matemática no 11º ano.
Nota a matemática no 10º ano. Média das notas de todas as disciplinas de 12º
ano (ou equivalente).

251
12) Número de horas dedicadas ao estudo no 12º ano, em média, POR SEMANA, excluindo o
tempo de aulas.
Licenciatura em Engenharia Civil no ISEL
13) Número de semestres a que está inscrito no curso, incluindo o semestre de Inverno de
2009/10. Número de Unidades Curriculares da LEC a que obteve aprovação.
Percentagem de aulas a que assiste de entre as aulas de todas as unidades
curriculares a que está inscrito (aproximadamente). Número de horas que dedica à LEC
(trabalhos, estudo, etc...excluindo as aulas), em média, POR SEMANA, durante o semestre.
20) Número de horas que dedica à LEC, em média, POR SEMANA, durante a época de exames.
21) Número de semestres em que, a meio do semestre, estava ainda com muito empenho a tentar
obter aprovação a AM1.
22) Neste espaço pode acrescentar algo que lhe pareça pertinente sobre estes assuntos.
AM1
1º Semestre 2009/10
Turma
23) Assistiu às aulas da turma de AM1: (Atenção: não indique a turma a estava inscrito mas sim a
que ASSISTIU.)
T110M (Profª Sandra Martins)
T120M (Profª Sandra Martins)

252
T130M (Prof. Ricardo Enguiça)
T140M (Prof. José Alberto Rodrigues)
T150M (Prof. José Alberto Rodrigues)
T110N (Profª Noémia Simões)
T120N (Profª Noémia Simões)
Não assisti a nenhuma.
Outra situação…
24) No caso de ter respondido "outra situação", explique... (Por exemplo: "assisti durante 2
semanas à turma X e depois mudei para a turma Y" ou, "só fui às aulas às últimas 3 semanas à
turma X".)
25) Número de aulas de AM1 a que faltou (aproximadamente):
Quantidade de estudo / Nota
26) Nº médio de horas que estudei AM1 por semana (extra aulas) durante o período lectivo.
27) Nº de dias que estudei AM1 antes do 1º exame (se aplicável).
28) Nº de dias que estudei AM1 antes do 2º exame (se aplicável).
29) Nota mais alta a AM1 este semestre (Média dos testes, 1º exame ou 2º exame).
Assinale o seu grau de acordo/desacordo com as afirmações abaixo, utilizando a escala seguinte.
0 1 2 3 4 5 6 7
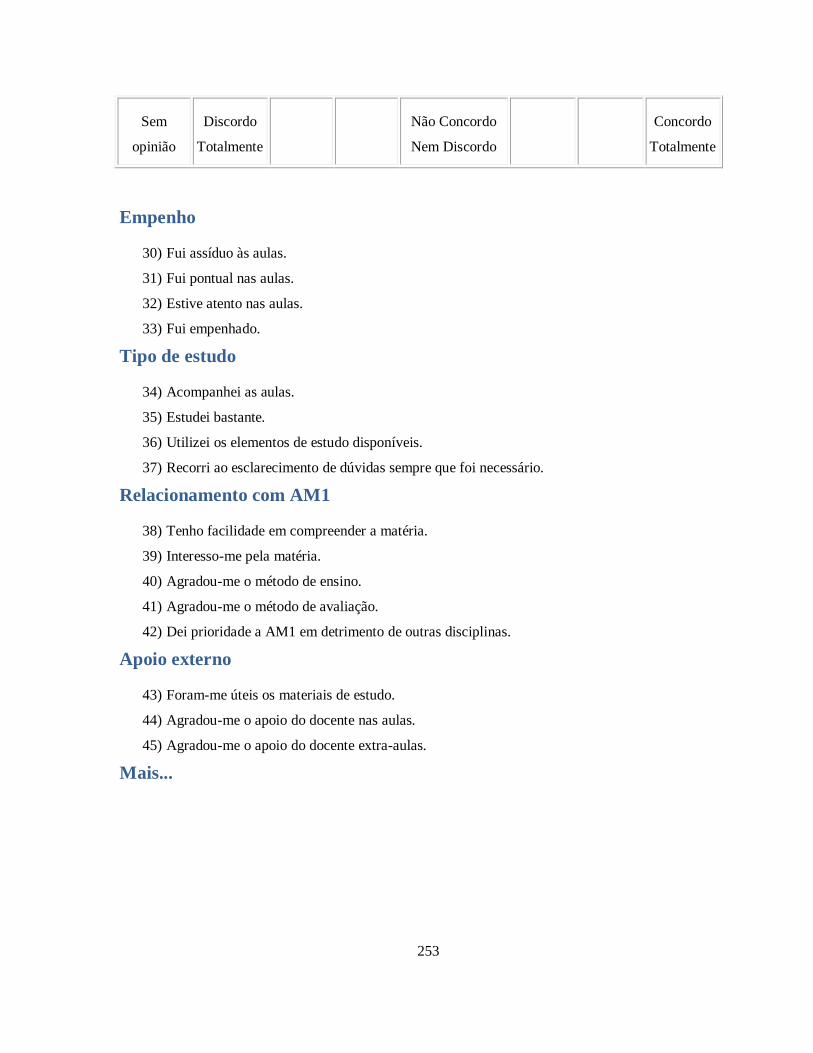
253
Sem
opinião
Discordo
Totalmente
Não Concordo
Nem Discordo
Concordo
Totalmente
Empenho
30) Fui assíduo às aulas.
31) Fui pontual nas aulas.
32) Estive atento nas aulas.
33) Fui empenhado.
Tipo de estudo
34) Acompanhei as aulas.
35) Estudei bastante.
36) Utilizei os elementos de estudo disponíveis.
37) Recorri ao esclarecimento de dúvidas sempre que foi necessário.
Relacionamento com AM1
38) Tenho facilidade em compreender a matéria.
39) Interesso-me pela matéria.
40) Agradou-me o método de ensino.
41) Agradou-me o método de avaliação.
42) Dei prioridade a AM1 em detrimento de outras disciplinas.
Apoio externo
43) Foram-me úteis os materiais de estudo.
44) Agradou-me o apoio do docente nas aulas.
45) Agradou-me o apoio do docente extra-aulas.
Mais...

254
46) Indique outros factores que tenham contribuído para o seu sucesso/insucesso a AM1 este
semestre. Ou algo que lhe pareça relevante sobre estes assuntos. .
Caso tenha obtido aprovação a AM1 este semestre siga para a página seguinte, senão
continue a responder...
47) Desistiu de tentar obter aprovação a AM1:
Razões para a reprovação/desistência a AM1
no 1º semestre de 2009/10
Assinale o seu grau de acordo/desacordo com as afirmações abaixo, utilizando a escala
seguinte.
0 1 2 3 4 5 6 7
Sem
opinião
Discordo
Totalmente
Não
Concordo
Nem
Discordo
Concordo
Totalmente
48) Não gosto de matemática. Estudei pouco.
50) Dei prioridade a outras unidades curriculares. AM1 não me interessa. Tenho muitas
dificuldades em compreender a matéria. AM1 é muito exigente em termos de trabalho. Não
me adaptei ao método de ensino do docente. Não me adaptei ao método de avaliação. Tive
pouco apoio por parte do docente.
57) O material de apoio/estudo não me foi útil.

255
58) A matéria parecia fácil... parecia-me que sabia...mas chegava aos testes e corria mal. Indique
outros factores que tenham contribuído para o seu insucesso a AM1 este semestre. Ou algo
que lhe pareça relevante.
Previsão do efeito de possíveis alterações
Indique o impacto que as seguintes medidas teriam em si, no sentido de o levarem a ter mais
sucesso a AM1, usando a escala que se segue:
0 1 2 3 4 5 6 7
Sem
opinião
Muito
impacto no
sentido
inverso
Sem
impacto
Muito
impacto
1) Ser obrigado a ir às aulas.
2) Ter aulas com menos alunos.
3) Poder escolher o docente cujo ensino mais se adapta a mim.
4) Existir uma "sala de estudo de matemática" onde está sempre um docente para dar "apoio".
5) Um novo programa de AM1 com mais aplicações.
6) AM1 passar a ser menos exigente em termos de trabalho.
7) Ter que pagar a 2ª inscrição a AM1 (e mais para a 3ª, e ainda mais para a 4ª, etc).
8) Existirem precedências entre AM1, AM2, etc.
9) Só existir AM1 nos 1ºs semestres (deixar de existir nos 2ºs semestres).

256
10) Que mais lhe parece que poderia contribuir para melhorar o seu sucesso a AM1.
Caracterização do docente/turma
Assinale o seu grau de acordo ou desacordo com as afirmações que se seguem, utilizando a escala seguinte:
0 1 2 3 4 5 6 7
Sem
Opinião
Discordo
Totalmente
Não Concordo
Nem Discordo
Concordo
Totalmente
Assiduidade e pontualidade
1.) O docente foi assíduo.
2.) O docente foi pontual.
Organização e clareza
3.) O docente explicou os temas com clareza.
4.) As aulas estavam bem organizadas.
5.) Os slides de apoio às aulas foram úteis (quando aplicável).
6.) Os conteúdos do programa correspondem aos efectivamente leccionados, de tal modo que os
alunos conheciam o rumo das aulas.
Empenho do docente
7.) O docente mostrou-se empenhado na leccionação das aulas.
8.) O docente imprimiu dinamismo às aulas.

257
9.) O docente expôs a matéria de forma atractiva.
10.) O modo como o docente organizou as aulas cativou o interesse.
Interacção da turma
11.) Os alunos foram encorajados a resolver os exercícios por si durante a aula.
12.) Os alunos foram estimulados a interagir com os colegas.
13.) Os alunos foram encorajados a fazer perguntas e obtiveram respostas adequadas.
14.) Os alunos foram encorajados a participar na discussão das matérias.
Relação docente-aluno
15.) O docente mostrou-se cordial na relação com os alunos.
16.) O docente mostrou preocupação e interesse pelos alunos.
17.) O docente fez com que os alunos se sentissem à vontade para lhe pedir ajuda e conselhos
dentro e fora das aulas.
18.) O docente mostrou-se disponível para tirar dúvidas no final da aula ou no horário de
atendimento.
Abordagem dos temas
19.) O docente revelou segurança na exposição dos temas.
20.) O docente apresentou os temas segundo múltiplas perspectivas.
21.) O docente apresentou o contexto em que apareceram as ideias e conceitos desenvolvidos nas
aulas.
22.) O docente mostrou aplicações dos conceitos abordados.
Relevância da aprendizagem
23.) As aulas foram estimulantes intelectualmente.
24.) Aprendi algo útil.
25.) Compreendi e assimilei os temas das aulas.

258
26.) A frequência das aulas aumentou o interesse pelos temas estudados.
27.) Neste espaço pode indicar algo que lhe pareça relevante sobre estes assuntos.
Caracterização de AM1
Responda às seguintes questões utilizando a escala:
0 1 2 3 4 5 6 7
Sem
opinião.
Discordo
totalmente.
Não concordo
nem discordo.
Concordo
totalmente.
1) AM1 é importante no curso.
2) Os objectivos e o programa de AM1 são adequados.
3) AM1 tem maior grau de dificuldade do que as outras UCs.
4) AM1 exige maior carga de trabalho que as outras UCs.
5) A carga de trabalho e o nº de créditos de AM1 estão ajustados.
6) O ritmo/velocidade de ensino é maior em AM1 do que nas outras UCs.
7) Os materiais de apoio (Livro, tarefas, listas de exercícios...) são adequados.
8) O método de avaliação é adequado.
9) As notas atribuídas aos alunos foram justas.
Caracterização global de AM1, do docente e do aluno
Responda às duas questões seguintes utilizando a escala:

259
0 1 2 3 4 5 6 7
Sem
Opinião
Péssimo/a Médio Excelente
1) Classificação GLOBAL de AM1 em comparação com as outras UCs:
2) Classificação GLOBAL do DOCENTE em comparação com os outros docentes:
3) Que aspectos de AM1 decorreram muito bem e devem ser REFORÇADOS?
Que aspectos de AM1 não decorreram de modo
adequado e devem ser REFORMULADOS? Que
características do DOCENTE foram mais importantes para a aprendizagem em
AM1?
6) Que características do DOCENTE foram mais negativas para a
aprendizagem em AM1?
7) Como JUSTIFICA, numa frase, o seu desempenho a AM1 este semestre?

260
TEAM1 (Turma Experimental de Análise Matemática 1)
Caso não tenha sido aluno da TEAM1 responda às questões seguintes utilizando a seguinte escala:
0 1 2 3 4 5 6 7
Sem
Opinião
Discordo
Totalmente
Não Concordo
Nem Discordo
Concordo
Totalmente
1) Gostava de ter participado na TEAM1.
2) Não participei na TEAM1 porque o horário era mau.
3) Não participei na TEAM1 porque não possuo computador portátil…ou possuo
mas é desagradável trazê-lo para o ISEL várias vezes por semana.
4) Não participei da TEAM1 porque não me interessou.
5) Não participei na TEAM1 porque achei que não iria alterar o meu desempenho.
6) Não participei na TEAM1 porque tive medo de não me dar bem.
7) Não participei na TEAM1 por inércia. (Estava numa turma onde me dava bem...
para quê mudar?)
8) Já conhecia o método de ensino da professora e preferi experimentar outro.
9) Se existisse TEAM1 no próximo semestre, com um bom horário para mim,
iria assistir. (Supondo que ainda tinha AM1 por fazer.)
10) Se quiser, acrescente outros motivos porque não assistiu à TEAM1, ou algo
que lhe pareça pertinente.

261
Guião do Focus Group
Porque vieram para a TEAM1?
Grande parte é do mesmo ano... porque será?
Já se conheciam antes? Eram amigos?
Já conheciam a prof?
Aprendizagem activa, que lhe parece? Preferem ensino expositivo ou aprendizagem activa?
Relacionamento com colegas? Sentiam-se à vontade para perguntar aos colegas? E à prof?
Foi importante ter poucos alunos? Se tivéssemos do dobro dos alunos que tinhamos acha que
teria sido mais motivador ou menos? Melhor ou pior? (em vez de um máximo de 16 alunos
tivéssemos tido um máximo de 30 alunos acha que teria sido diferente?)
O q achou da experiência inicial de escrever matemática em comput?
Materiais: críticas/ sugestões?
Uniformidade dos materiais: bom ou mau? + difícil memorizar??
Fez mapa conceptual? Em papel ou a comput? Pq?
Após 2º teste começei a dar menos aplicações, interpretações físicas, explorações no
computador... (pq tinha menos tempo) isso teve influência negativa?
Mini-testes?
Avaliação?
Os alunos mostravam mais interesse pelas aulas? porquê?
Qual o principal factor q fez com q tivesse sucesso ou insucesso?
Como é que vos parece que aconteceu:
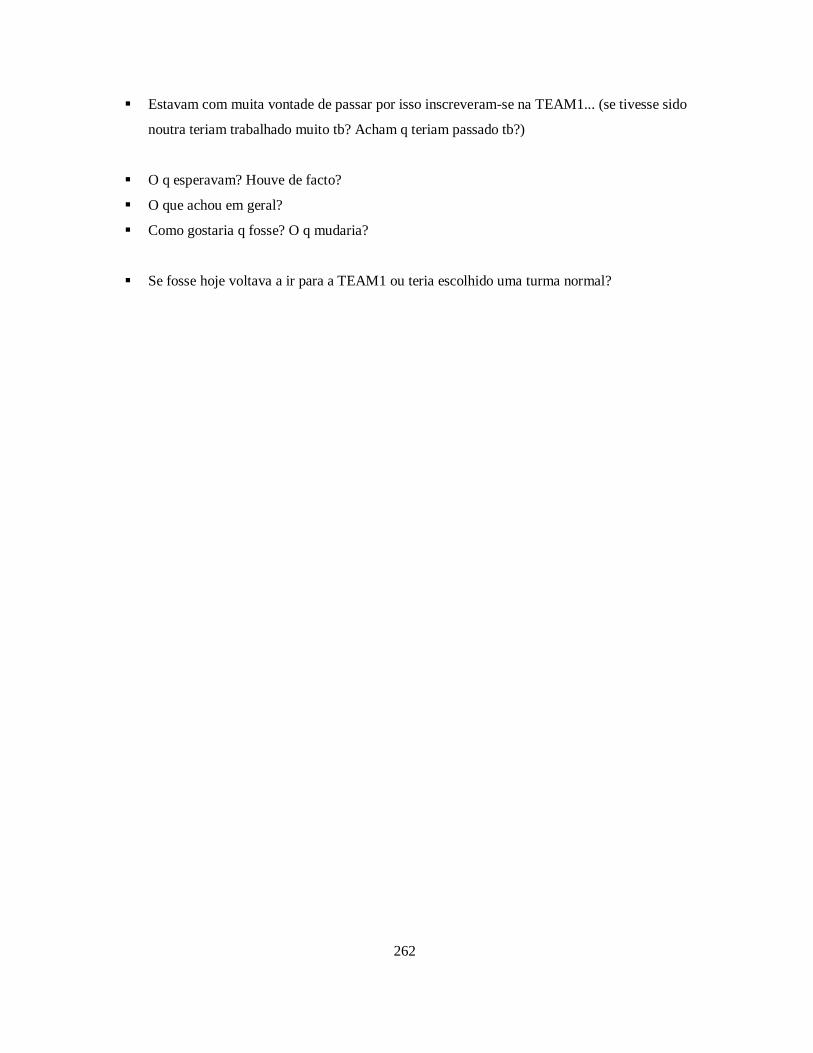
262
Estavam com muita vontade de passar por isso inscreveram-se na TEAM1... (se tivesse sido
noutra teriam trabalhado muito tb? Acham q teriam passado tb?)
O q esperavam? Houve de facto?
O que achou em geral?
Como gostaria q fosse? O q mudaria?
Se fosse hoje voltava a ir para a TEAM1 ou teria escolhido uma turma normal?

263
Os alunos da TEAM1 responderam a um questionário (ver Apêndice B) destinado a compreender
a sua visão sobre a TEAM1. Este questionário incluía algum espaço para comentários. Em seguida
transcrevem-se os comentários obtidos:
Comentários sobre “A existência dos mini-testes foi benéfica? Porquê?”
Fez com que nos fossemos adaptando gradualmente à matéria, e assim, mantendo-nos
sempre em
Mantinha-nos sempre a par da matéria e permitia-nos somar alguma cotação à média dos
testes
Porque ajudaram-me a estar mais preparada para os testes e são uma forma de estudo.
Acompanhamento mais próximo da matéria leccionada...
Ao sermos "obrigados" a estudar para os mini-testes, que a dada altura aconteciam
semanalmente, não deixava-mos a matéria acumular. Por outro lado os mini-testes serviam
também para detectar-mos partes da matéria em que ainda não tinhamos a sedimentação
necessária
Os mini-testes foram benéficos a obragava a ter uma preparação diária da matéria
ajudaram a perceber onde tinha mais dificuldades e por sua vez era a matéria que ia estudar
mais em casa
"porque enquanto se estuda para os mini-testes estuda-se para os testes gerais de AM-1
pois os mini-testes eram muitos logo o contacto com a materia era maior"
Appendix C – Comments of TEAM1
students

264
estudavamos mais frequentemente.
Ajudavam a manter-me actualizado na matéria e, claro, porque aumentavam a nota final
Por todas as razões já apresentadas anteriormente e porque é uma maneira de verificarmos o
nosso desempenho, não só em termos de estudo, mas em termos de concretização do que
estudámos.
porque ajudou a acompanhar a materia e a entender melhor o que poderia ser pedido nos
testes
Embora não aprovei,mas posso dizer que assimilava melhor a matéria.
Comentários sobre “Em geral, teve mais interesse pelas aulas da TEAM1
do que por outras aulas de AM1 a que tenha assistido? Porque lhe parece
que isso tenha acontecido?”
Pelo método de ensino aplicado, que obrigava os alunos a fazer os exercícios em vez de se
limitarem a passa-los do quadro
Por causa de ter sido apenas 2 vezes por semana então dificilmente desinteressava.
Método de aprendizagem diferente e mais próximo do aluno... acompanhamento
personalizado
Aconteceu essencialmente porque o método de expor a matéria foi diferente daquele mais
"tradicional" onde o professor expõe toda a teoria com pouco exercícios práticos na aula.
Uma passagem adequada da teoria para a prática é fundamental
A TEAM tinha poucos alunos para mim foi vantajoso porque a professora tinha mais tempo
para esclarecer as dúvidas que os alunos tinham
o facto de sermos poucos, o método de termos o pc para ver a teoria( nao perdendo tempo a
escrever) e dedicarmos mais tempo a realização de ezercicios foi muito bom. os mini-testes
também ajudaram muito.
As aulas tinham um número reduzido de alunos (em comparação às de AM1), e isso fez com
que os alunos que frequentavam essas aulas (alunos interessados em aprender a matéria)
tivessem um melhor aproveitamento.
"na TEAM eram poucos alunos, logo havia maior disponibilidade da professoar em se dispor
a ensinar no lugar do aluno. E facilidade de interagir com a professora.”

265
Devido ao facto de ser do tipo de ensino 1
Porque como referi anteriormente eramos poucos alunos e todos bastante interessados em
fazer a cadeira, o que contribui bastante para uma concentração colectiva!
maior contacto aluno colegas e aluno professor
Infelizmente decubri essa turma um pouco tarde, mas o TEAM1 por meu género, acho que é
o ideal. Existe dinamismo e pouca timidez na aula. Não se sentia remorsos em expor a
dúvida.
Comentários sobre “O que esperava da TEAM1? Houve de facto?”
Esperava uma turma onde o método de ensino fosse diferente, apoiado de novas tecnologias
e métodos diferentes dos mais convencionais, o que se verificou na integra.
Houve. Esperava uma turma diferente, que acabou por exceder as expectativas de todos,
resultado disso foi as excelentes notas que os alunos obtiveram.
O que encontrei na TEAM foi agradável e bastante positivo
"Esperava mesmo aquilo que obtive: Mais ajuda em certas matérias que não percebia, talvez
por estar a estudar de uma forma menos correcta.O enorme empenho por parte dos alunos e
professora que se via era outra expectativa que tinha da TEAM1."
A TEAM sendo turma experimental na minha opinião foi uma de união entre colegas
"esperava acabar com meus problemas de base. Não houve por cuilpa propria, pois devido as
outras unidades curriculares, deixei de frequentar."
superou as minhas espectativas.
esperava uma aula mais prática o que se veio a verificar, e sendo menos alunos as duvidas
eram todas esclarecidas.
Não sabia bem como ia funcionar. Como não estava a resultar o outro tipo de aulas, decidi
experimentar este, já que só tinha a ganhar.
Eu acho que sim, e se existe voltaria a frequentar
Não tinha grandes espectativas porque não sabia do que se tratava até frequêntar uma
aula e devo dizer que superou e bastante as minhas espectativas. Não há duvida, de facto
que as aulas com menos teoria e mais prática têm muito mais rendimento e ajudam muito
mais os alunos a entenderem as matérias.

266
Eperava que fosse melhor que as outras turmas, e, nisso a mim correspondeu e até posso
dizer que ultrapassou a minha espectativa
Comentários sobre “O que achou da TEAM1?”
"Achei uma novidade/experiência positiva, bem estruturada, onde os alunos e a professora
mostraram um grande desempenho e empenho em aprender e ensinar. Penso que seria uma
boa aposta para ajudar os alunos, portanto a TEAM1 devia continuar."
Um método de ensino diferente, que obteve um resultado excelente.
Um bom caminho para a aprendizagem da matemática
Achei que foi uma turma onde todos trabalharam bastante. A maior parte dos alunos
pareceram-me bastante empenhados na obtenção de boa nota na unidade currricular. O
ambiente foi sempre bom entre colegas o que também ajuda ao melhor desempenho de cada
aluno. Os metodos utilizados são mais vantajosos do que os tradicionalmente utilizados
porque permitem qualquer aluno ficar mais motivado para uma unidade curicular que nem
sempre é fácil.
Em termos geral a TEAM foi uma uma turma que força o aluno a se empenhar
Boa iniciativa e que devia ser para ficar
foi importante para perceber onde estao as nossas dificuldades, o ambientes era bom. Tudo
isto ajudou ao sucesso de cada aluno que frequentou a team1
uma disciplica com um método muito bom para se entender a matematica.
Ajudou na compreensão e aplicação dos conceitos da disciplina
Achai um programa interesante e bom, na minha opinião deveria se implementar mais vezes.
Excelente iniciativa dos docentes responsáveis e esperemos que transmitam os
conhecimentos e resultados assimilados aos colegas de outras cadeiras e matérias!
É um método que devia fazer parte da escolha, poque acho que pode dar ou trazer resultados
positivos, que no fundo o objectivo de todos NÒS (alunos e professores)e volto a repetir, de
que, se houvesse de novo essa turma, não pensaria duas vezes.era logo o que escolheria.

267
Comentários sobre “De TUDO o que vimos atrás, o que é que considera
que teve maior impacto no seu sucesso/insucesso? (Indique pelo menos 5
itens.)”
Respostas de alunos aprovados:
"- Os mini-testes ajudaram a acompanhar a matéria, e alguns exercícios até eram mais
difíceis do que aqueles feitos nas aulas, o que nos fez puxar ainda mais pela cabeça :)
- A concentração geral da turma em estar ali para aprender e passar à cadeira, vista por
muitos como ""difícil"" (e de facto é, quando não se trabalha).
- A explicação/exposição da matéria era, em geral, mais lenta e mais esclarecedora do que
nas aulas de AM1, deixando mais tempo para pensar e resolver o exercício mentalmente."
"Poucos alunos na sala.
Enorme disponibilidade da docente.
Realização dos mini-testes.
Aulas de 3h duas vezes por semana.
Material fornecido para acompanhamento das aulas."
"-Mini testes
-Metodologia de estudo
-Exposição da matéria
-Relação Docente/Discente
-Relação Discente/Colegas"
"1º número de alunos ser reduzido
2º horario ser favoravel
3º metodo de ensino que a TEAM impõe
4º os teoremas serem fornecidos nos acetatos
5º ver a utilidade da matemática no dia-a-dia
6º ensino do tipo1"
"- os materiais estavam bem organizados;
- os mini-testes faziam nos acompanhar a materia semanalmente;
- existia um clima de empatia entre os colegas;
- era uma turma pequena;
- exponhamos mais as nossas duvidas do quye numa turma com mais alunos."

268
"- mini-testes
- sermos poucos alunos
- não perdemos tempo com a teoria
- praticámos mais do que na aulas de AM1
- grande disponibilidade por parte da docente."
"contacto entre alunos
contacto entre professor e alunos
slides
resoluçao de exercicios com um maior apoio
dimensao da turma"
Respostas de alunos não aprovados:
"INSUCESSO:
- Ter iniciado tarde;
- Falta de uma boa Base;
- Não ter provado nos esâmes seguintes;"
O facto de se resolver muitos exercícios durante as aulas, de serem dadas as soluções dos
exercícios,a forma clara da professora transmitir a matéria, pena ter começado um pouco
tarde na turma da team1 mais valeu a esperiência.
Na minha opinião exitiam dois níveis de alunos:o 1º os alunos que têm algumas bases com
aquele tipo de ensino se empenhavam cada vez mais e o 2º os alunos com muitas
dificuldades e pouco interesse de aprendizagem e o resultado é o insucesso.
"Poucos alunos(positivo)
Tipo de ensino 1(positivo)
Poderia ter-me empenhado mais(negativo)
Mini-testes (positivo)"
Sem dúvida alguma 2 pontos chave: O primeiro haver pessoas interessadas dentro da sala de
aula (independentemente de serem poucas ou muitas), o segundo as aulas serem dadas de
forma mais prática e menos teórica.
O meu insucesso não se deve á TEAM 1 mas sim ao trabalho em si (sou trabalhador
estudante) conciliado com a dificuldade/falta de motivação/gosto pela matéria e pelo facto de
ter outras unidades curriculares (mais apelativas) com necessidade de obtenção de nota
positiva

269
Comentários sobre “Indique outros factores que tenham contribuído para
o seu sucesso/insucesso a AM1 este semestre. Ou algo que lhe pareça
relevante sobre estes assuntos”
os mini testes realizados foram muito bons para ver onde tinha mais dificuldades.
O método de estudo com a realização de váris mini testes durante o semestre permitiu ir
estudando a matéria não sendo necessário grande carga de estudo antes de cada teste.
Acho que os métodos de ensino implementados na Turma Experimental de Análise
Matemática (uso de computador por parte do professor, projecção da parte teórica e em
seguida explicação dada pelo professor escrita no quadro e de 90% da aula ser prática)
deviam ser utilizados pelas restantes turmas de Análise Matemática (à excepção do uso dos
computadores por parte dos alunos, pois atrasa um pouco o bom funcionamento das aulas)
As aulas da TEAM1 foram bastante produtivas (ao contrário das restantes) só lamento o
facto de não poder ter dado mais tempo para estudar AM1.
Tive possibilidade de assistir algumas aulas de TEAM1, e acho que havia mais estímulos e
muito mais tempo para se exercitar na aula (A aproximação entre Professor e aluno é mais
presente) Infelizmente na altura não tinha um computador á minha disponibilidade.
COM TEAM1, A AM1 É MENOS ABSTRACTO...
…Todos estes assuntos foram melhor abordados nas aulas da TEAM1. 79- Ricardo Tavares
há muita matéria num período muito curto (para pouco tempo) POR ISSO O TEAM1 É
IDEAL PARA POUPAR O TEMPO.
fazer com que se exercita mais e melhor Ex.:TEAM1
Appendix D – Comments of AM1 students

270
Comentários sobre a AM1
Matéria dada muito depressa. Deviamos de ter testes quase todas as semanas
para melhor despertar o interesse, acho que em conjunto com a matéria, sempre que possível
deviam ser dados exemplos práticos do dia a dia do engenheism onde essa matéria fosse
aplicável.
acho que deviam dar exemplos de aplicações de AM1 na Engenharia Civil motiva mais os
alunos.
Aplicações práticas da matéria leccionada, pois muitas vezes não se percebe para o que
serve.
Matéria acompanhada de demonstrações de aplicções prácticas. Maior motivação para a
disciplina.
metodo de avaliação continua devia ser por cada capitulo um teste.
em meu entender, penso que se deveria dar uma noção da aplicação dos conceitos abordados.
Tornar os conceitos aplicáveis a determinadas situações do dia-a-dia .
Motivação para as matérias, mais pratica, menos abstrata..
Era interessante vermos aplicações das matérias aprendidas nesta cadeira! .
Comentários sobre “Se quiser, acrescente outros motivos porque não
assistiu à TEAM1, ou algo que lhe pareça pertinente.”
Horário:
horario da Team1 a sobrepor outras UC's
Questão de horário
não tinha possibilidade de horário.
O horário não era compatível!
Noite:
comecei a trabalhar e vou as aulas da noite e o horario nao se adequava a mim, e depois à
noite nao existe ou nao temos horas vagas.
Parece que a TEAM1 existe apenas para alunos de dia, não vejo problema em existir
TEAM1 na hora das outras aulas de am1 teóricas, deveria ser uma opção livre para os
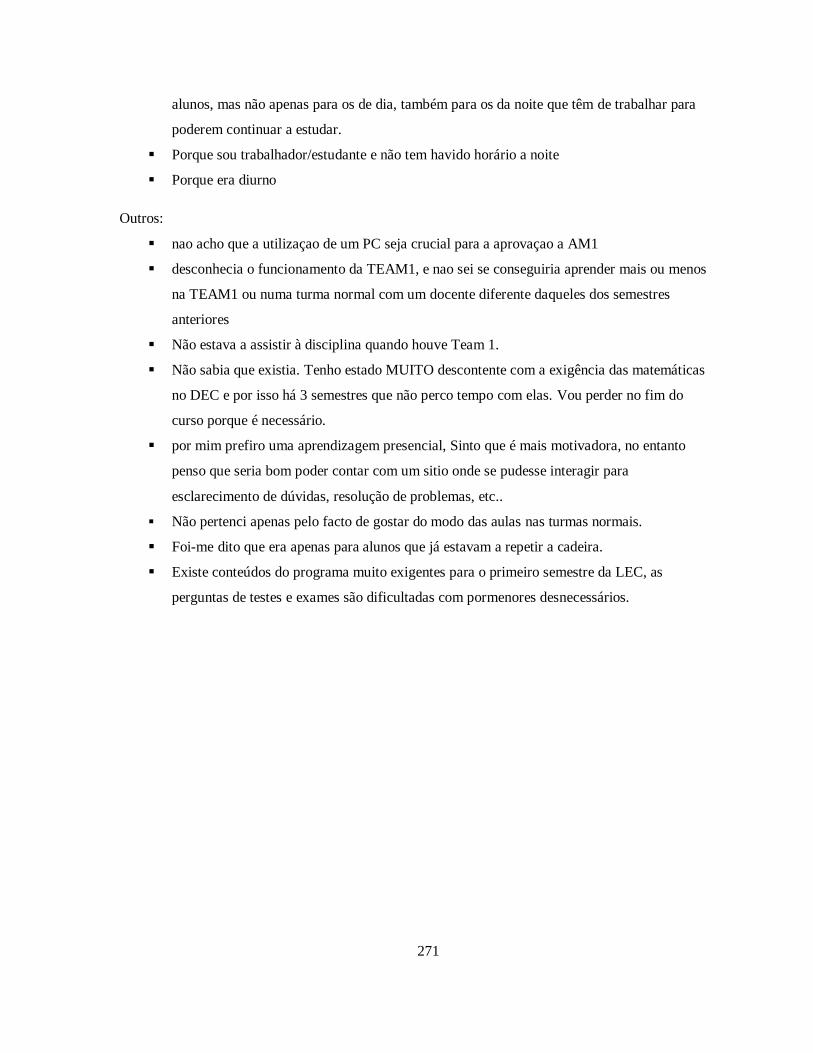
271
alunos, mas não apenas para os de dia, também para os da noite que têm de trabalhar para
poderem continuar a estudar.
Porque sou trabalhador/estudante e não tem havido horário a noite
Porque era diurno
Outros:
nao acho que a utilizaçao de um PC seja crucial para a aprovaçao a AM1
desconhecia o funcionamento da TEAM1, e nao sei se conseguiria aprender mais ou menos
na TEAM1 ou numa turma normal com um docente diferente daqueles dos semestres
anteriores
Não estava a assistir à disciplina quando houve Team 1.
Não sabia que existia. Tenho estado MUITO descontente com a exigência das matemáticas
no DEC e por isso há 3 semestres que não perco tempo com elas. Vou perder no fim do
curso porque é necessário.
por mim prefiro uma aprendizagem presencial, Sinto que é mais motivadora, no entanto
penso que seria bom poder contar com um sitio onde se pudesse interagir para
esclarecimento de dúvidas, resolução de problemas, etc..
Não pertenci apenas pelo facto de gostar do modo das aulas nas turmas normais.
Foi-me dito que era apenas para alunos que já estavam a repetir a cadeira.
Existe conteúdos do programa muito exigentes para o primeiro semestre da LEC, as
perguntas de testes e exames são dificultadas com pormenores desnecessários.


