download - we couldn't find the page you were looking for
TRANSCRIPT

Tableau 2008 Users Conference July 22, 2008
© 2008 Stephen Few, Perceptual Edge 1
It is not enough to mine the meanings that exist in your data. The value of information is not realized until\ you use it to do something. Used properly, it can make the world a better place.

Tableau 2008 Users Conference July 22, 2008
© 2008 Stephen Few, Perceptual Edge 2
This poem by Edna St. Vincent Millay eloquently and poignantly describes our situation today. Our problem is not a lack of data, but rather our inability to make sense and use of what we have.

Tableau 2008 Users Conference July 22, 2008
© 2008 Stephen Few, Perceptual Edge 3
Information cannot speak for itself. It needs our help. It relies on us to give it a voice. When we do, information can tell its story, and will thus become knowledge. The
when it is used to do something good. Only when we use what we know to make the world a better place has information served its purpose and we have done our job.
Our networks are awash in data. A little of it is information. A smidgen of this shows up as knowledge. Combined with ideas, some of that is actually useful. Mix in experience, context, compassion, discipline, humor, tolerance, and humility, and perhaps knowledge becomes wisdom. Turning Numbers into Knowledge, Jonathan G. Koomey, 2001, Analytics Press: Oakland, CA page 5, quoting Clifford Stoll.

Tableau 2008 Users Conference July 22, 2008
© 2008 Stephen Few, Perceptual Edge 4
The amount of information that is available to us has grown much faster than our ability to make use of it. We lack both skills in data analysis and tools that can be used to productively support the process.

Tableau 2008 Users Conference July 22, 2008
© 2008 Stephen Few, Perceptual Edge 5
To date, business intelligence has mostly focused on technology and project methodology, resulting in great advances. As a result, we have huge and fast warehouses of information. It is now time to focus on the true essence of business intelligence important, meaningful, and actionable information and the most powerful resources for tapping into its value are those that engage the tremendous capacities of human perception and intelligence to make sense of and communicate information.
Many organizations aren't effectively analyzing the data they do have to improve their business.What's more troubling, perhaps, is many companies that purchase powerful analysis and business-intelligence tools don't use them effectively. Users of these products often generate the most basic and obvious reports and never get their hands dirty with the deep-analysis tools.By ignoring these products' deep-analysis capabilities, organizations could be missing important trends information that might show, for example, where a company is losing business.Companies might also see that business decisions that were made based on basic information were wrong and ended up costing money in the long run.(eWeek, Rapoza, Ziff Davis Media Incorporated, June 7, 2004)
Today much of science and engineering takes a machine-centered view of the design of machines and, for that matter, the understanding of people. As a result, the technology that is intended to aid human cognition and enjoyment more often interferes and confuses than aids and clarifies.It will take extra effort do design systems that complement human processing needs. It will not
Somehow, we have learned to accept the machine-dominated world. If a system is to accommodate human needs, it has to be designed by people who are sensitive to and understand human needs. I would have hoped such a statement was an unnecessary truism. Alas, it is not.(Things That Make Us Smart, Donald A. Norman, Basic Books, New York, 1993, page s 9 and 227)

Tableau 2008 Users Conference July 22, 2008
© 2008 Stephen Few, Perceptual Edge 6
Data visualization has the potential to help business intelligence fulfill its promise of helping organizations function intelligently.

Tableau 2008 Users Conference July 22, 2008
© 2008 Stephen Few, Perceptual Edge 7
Data visualization is the loom that will weave the data that we collect into the fabric of understanding. Pictures of data can make visible the meanings that might forever otherwise remain hidden.

Tableau 2008 Users Conference July 22, 2008
© 2008 Stephen Few, Perceptual Edge 8
Though data visualization has become a popular tool of business intelligence only recently, people have been using graphs to display data visually for a long time. In 1786, a roguish Scot William Playfair published a small atlas that introduced or greatly improved most of the quantitative graphs that we use today. Prior to this, graphs of quantitative data were little known.

Tableau 2008 Users Conference July 22, 2008
© 2008 Stephen Few, Perceptual Edge 9
Today, 220 years later, graphs are commonplace, fully integrated into the fabric of modern communication. Surprisingly, however, innovative effortsspring from meager precedent are superior to most of the graphs produced today.

Tableau 2008 Users Conference July 22, 2008
© 2008 Stephen Few, Perceptual Edge 10

Tableau 2008 Users Conference July 22, 2008
© 2008 Stephen Few, Perceptual Edge 11
[When] we visualize the data effectively and suddenly, there is what Joseph Berkson interoculareyes.
(Visualizing Data, William S. Cleveland, Hobart Press, 1993, page 12)

Tableau 2008 Users Conference July 22, 2008
© 2008 Stephen Few, Perceptual Edge 12
Hans Rosling of Gapminder.org has become one of the real stars of information visualization in the last couple of years. When Rosling took the stage at the TED conference for the first time in 2006, he managed to get people up on the edges of their seats to watch believe it or not a bubble plot that used animation (motion) to show change through time. When he finished, the crowd rose to their feet to give Rosling a standing ovation. For most of the people there, data presentation had never been so compelling.
Rosling has used relatively simple visualization techniques, featuring animated plots, to tell statistical stories that are compelling, not only because they are told with great charisma, but because they reveal important truths about the world, such as the changing relationship between wealth and child mortality. I applaud his success, in part because it is success that we can share in, for it illustrates to the world at large what infovis can do when it is done well and it is used for worthwhile purposes.
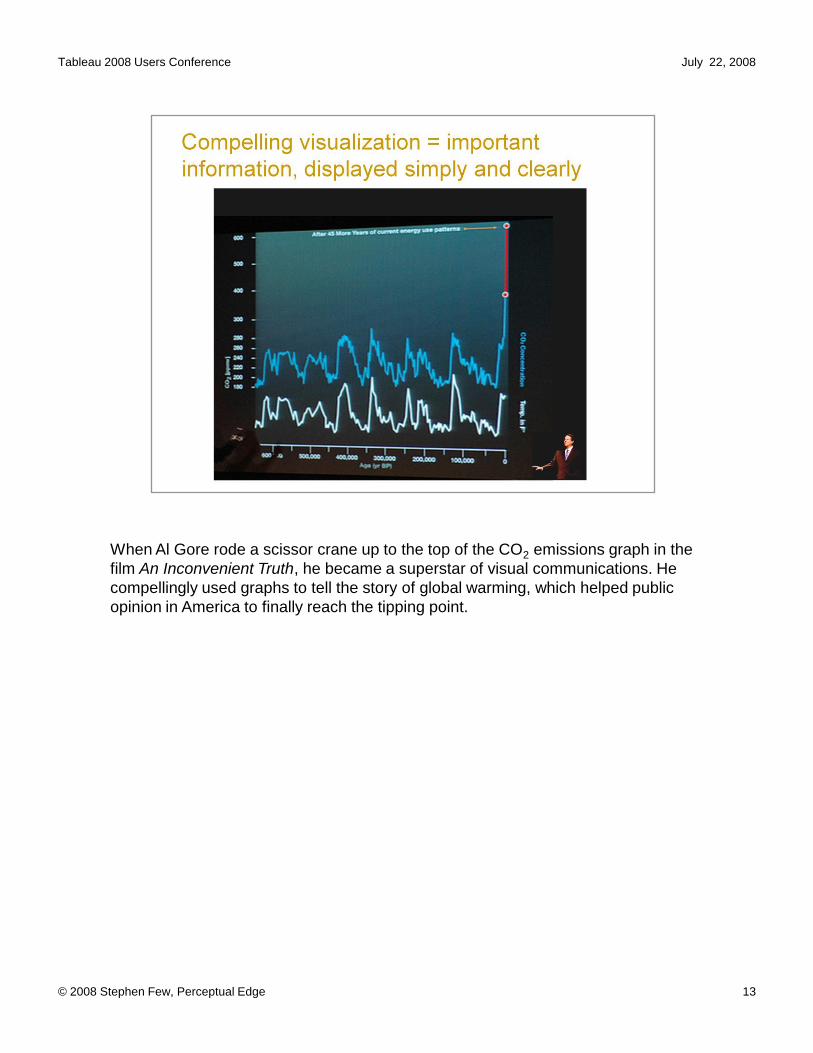
Tableau 2008 Users Conference July 22, 2008
© 2008 Stephen Few, Perceptual Edge 13
When Al Gore rode a scissor crane up to the top of the CO2 emissions graph in the film An Inconvenient Truth, he became a superstar of visual communications. He compellingly used graphs to tell the story of global warming, which helped public opinion in America to finally reach the tipping point.

Tableau 2008 Users Conference July 22, 2008
© 2008 Stephen Few, Perceptual Edge 14
Often, the simplest form of display is the most powerful.
(The original version of this display was created by Dr. Robert Kosara of the University of North Carolina.)

Tableau 2008 Users Conference July 22, 2008
© 2008 Stephen Few, Perceptual Edge 15
displaying with cute and flashy effects. Eye candy might be fun to look at, and understanding that
leads to good decisions is. When cuteness or flashiness undermines the clear, accurate, and comprehensive presentation of information, it becomes worse than useless it becomes the enemy of truth.
eyes so they can clearly see and perceived by our minds so they can clearly understand the meanings that live in the data.
indicate a preference for data displays that are least effective for presenting that data clearly, resulting in understanding.
that provides ways to find out what works. Data displays must be based on the findings of science, not on whim. Designers of all types, not just those who focus on data visualization, value simplicity for one reason it works.

Tableau 2008 Users Conference July 22, 2008
© 2008 Stephen Few, Perceptual Edge 16
The Oxford English Dictionary includes among its many definitions of the word
Why force people to rely on a legend to figure out what each slice of the pie chart represents, causing them to jump constantly between the chart and the legend to read the data.
Even if you label the slices directly, however, it is still difficult to compare each slices percentage of the whole. Which is greater, Slovakia or Saudi Arabia, and by how much?
You could solve this problem by including percentages on the chart, but if you must
it in a graph? You might as well give them a table, which would be easier to read.

Tableau 2008 Users Conference July 22, 2008
© 2008 Stephen Few, Perceptual Edge 17
Or, how about presenting the data graphically in a way that actually supports comparisons, such as this simple bar graph. When we decide how to display data, the choice should be arbitrary it should be based on the type of display that presents the data most clearly and accurately for the task at hand.

Tableau 2008 Users Conference July 22, 2008
© 2008 Stephen Few, Perceptual Edge 18
Another Oxford English Dictionary
3-D rarely adds value to business graphs. In fact, it almost always makes it harder to see and comprehend the data. The bar graph on the left demonstrates a common problem with 3-
able to see other bars. One of the great benefits of a graph is the ability to see all the values and compare them at once. The data in the particular bar graph could have been easily and clearly displayed in a line graph, which would have revealed the shape of change from quarter to quarter. A 3-how difficult it is to see and compare the patterns formed by the lines.

Tableau 2008 Users Conference July 22, 2008
© 2008 Stephen Few, Perceptual Edge 19
One more Oxford English Dictionary
Simplicity is achieved when information is displayed for what it is, neither more complicated than it is nor over simplified resulting in the loss of complexity that is really there.
The words of Henry David Thoreau, which I quote in my titlemust be balanced by the words of Alfred North Whitehead when he said
Tableau 2008 Users Conference July 22, 2008
© 2008 Stephen Few, Perceptual Edge 20
confusion about what it is, how it works, and what can be accomplished when it is properly done.

Tableau 2008 Users Conference July 22, 2008
© 2008 Stephen Few, Perceptual Edge 21
Software vendors are competing to out dazzle one another with silly visual effects

Tableau 2008 Users Conference July 22, 2008
© 2008 Stephen Few, Perceptual Edge 22
This notion of data visualization is not about understandingabout bling.
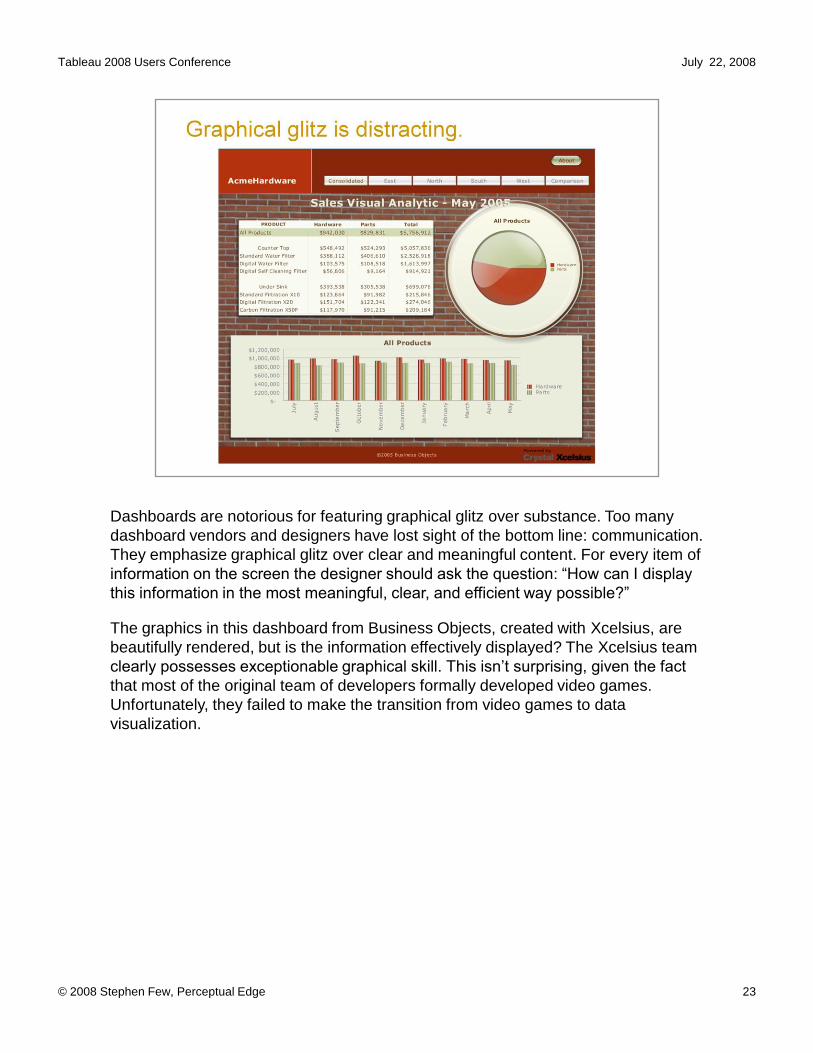
Tableau 2008 Users Conference July 22, 2008
© 2008 Stephen Few, Perceptual Edge 23
Dashboards are notorious for featuring graphical glitz over substance. Too many dashboard vendors and designers have lost sight of the bottom line: communication. They emphasize graphical glitz over clear and meaningful content. For every item of
The graphics in this dashboard from Business Objects, created with Xcelsius, are beautifully rendered, but is the information effectively displayed? The Xcelsius team
that most of the original team of developers formally developed video games. Unfortunately, they failed to make the transition from video games to data visualization.

Tableau 2008 Users Conference July 22, 2008
© 2008 Stephen Few, Perceptual Edge 24
examples of data presentations that were submitted by graphing specialists to a competition sponsored by DM Review magazine.In this particular part of the competition, contestants were asked to design a display that could be used by the VP of Human Resources to compare salaries of
divided between exempt and non-exempt employees.

Tableau 2008 Users Conference July 22, 2008
© 2008 Stephen Few, Perceptual Edge 25
Every charting software vendor out there, with almost no exceptions, feature 3-D graphs. They look so impressive, but do they work? Users fall prey to the notion that 2-D displays are old-school, and that they must advance to displays like the one shown above to be taken seriously. The problem with 3-D displays of abstract business data, however, is that they are almost impossible to read.

Tableau 2008 Users Conference July 22, 2008
© 2008 Stephen Few, Perceptual Edge 26
Vendors introduce display methods that are absurd, that show a complete ignorance of visual perception. Trends cannot be discerned by examining a series of pie charts and quantitative values cannot be effectively encoded as differing hues.

Tableau 2008 Users Conference July 22, 2008
© 2008 Stephen Few, Perceptual Edge 27
Based on the example set by the vendors, users attempt to dazzle their audience with bright colors and pretty pictures, often resulting in displays like this that completely obscure a relatively simple message. I challenge you to make sense of this graph.

Tableau 2008 Users Conference July 22, 2008
© 2008 Stephen Few, Perceptual Edge 28
This example features software that uses a visual object called a glyph, which is meant to simultaneously encode multiple variables about an entity. In this case a
and each of the individual small rectangles encodes the expenses in dollars of a single department for a given month. Glyphs are meant to do something quite different from this example. They are not meant and are not able to effectively encode departmental expenses as they vary through time. Why has this user applied this software so absurdly? Because the vendor itself promotes such use.

Tableau 2008 Users Conference July 22, 2008
© 2008 Stephen Few, Perceptual Edge 29
Finally, we see a visual display that works. Departmental expenses are encoded as simple line graphs, which beautifully present the overall trend and individual ups and downs of the values through time. This arrangement of eight graphs within eye span, one per department, sorted from the greatest to least expenses,
and thoughtful examples encouraged users to communicate effectively.
doing things right. That well-designed visualizations and functionality can pack
without sacrificing substance.

Tableau 2008 Users Conference July 22, 2008
© 2008 Stephen Few, Perceptual Edge 30
Over a year ago it occurred to me that I could use the juxtaposition of bad and good examples in an entertaining way to expose people to effective visualization practices
that walks people through a series of questions that ask them to choose the better of two visualizations. Thousands have taken this test and passed it on to their colleagues.

Tableau 2008 Users Conference July 22, 2008
© 2008 Stephen Few, Perceptual Edge 31
Everyone, even without any training in graph design, scores highly when they take
generally easy to see when a bad visualization and an effective alternative are
encouraged to seek out resources for learning these skills. When they do happen to get a question wrong, I use the opportunity to educate them a little, explaining why

Tableau 2008 Users Conference July 22, 2008
© 2008 Stephen Few, Perceptual Edge 32
Most of the data analysis that is needed in the normal course of business requires relatively simple data visualization techniques, leaving little that requires the sophisticated techniques of statistical and financial analysis. If you search for
present the sophisticated techniques needed by the few, but few resources if any that teach the simple techniques that most of us need to make sense of business data. The skills that most of us need to infuse our businesses with needed insights
naturally they must be learned. You must develop expertise, but it is expertise that can be easily learned with the proper direction and practice. You must learn to see particular patterns in data that are meaningful.
People can learn pattern-detection skills, although the ease of gaining these skills will depend on the specific nature of the patterns involved. Experts do indeed have special expertise. The radiologist interpreting an X-ray, the meteorologist interpreting radar, and the statistician interpreting a scatter plot will each bring a differently tuned visual system to bear on his or her particular problem. People who work with visualizations must learn the skill of seeing patterns in data. (Information Visualization, Second Edition, Colin Ware, Morgan Kaufmann Publishers, 2004, page 209)

Tableau 2008 Users Conference July 22, 2008
© 2008 Stephen Few, Perceptual Edge 33
Data sense-making begins with (1) searching through data to discover potentially meaningful facts, (2) examining those facts more closely to understand them so we
good decisions. Most of what we need to recognize and understand in our business data is not all that complicated.
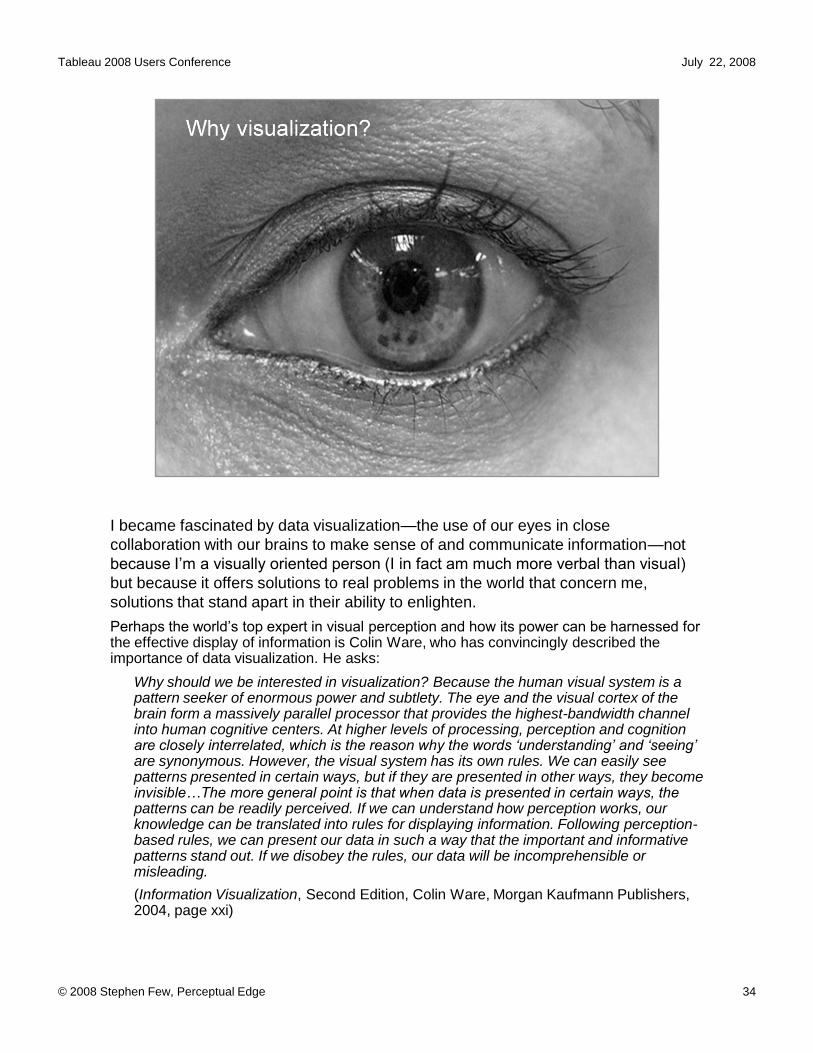
Tableau 2008 Users Conference July 22, 2008
© 2008 Stephen Few, Perceptual Edge 34
I became fascinated by data visualization the use of our eyes in close collaboration with our brains to make sense of and communicate information not
but because it offers solutions to real problems in the world that concern me, solutions that stand apart in their ability to enlighten.
the effective display of information is Colin Ware, who has convincingly described the importance of data visualization. He asks:
Why should we be interested in visualization? Because the human visual system is a pattern seeker of enormous power and subtlety. The eye and the visual cortex of the brain form a massively parallel processor that provides the highest-bandwidth channel into human cognitive centers. At higher levels of processing, perception and cognition
are synonymous. However, the visual system has its own rules. We can easily see patterns presented in certain ways, but if they are presented in other ways, they become
patterns can be readily perceived. If we can understand how perception works, our knowledge can be translated into rules for displaying information. Following perception-based rules, we can present our data in such a way that the important and informative patterns stand out. If we disobey the rules, our data will be incomprehensible or misleading.(Information Visualization, Second Edition, Colin Ware, Morgan Kaufmann Publishers, 2004, page xxi)

Tableau 2008 Users Conference July 22, 2008
© 2008 Stephen Few, Perceptual Edge 35
Human perception is amazing. I cherish all five of the senses that connect us to the world, that allow us to experience beauty and an inexhaustible and diverse wealth of sensation. But of all the senses, one stands out dramatically as our primary and most powerful channel
sense receptors reside in the eye.Perhaps the best known expert in data visualization, Edward Tufte
Visual Explanations, Edward R. Tufte, Graphics Press: Cheshire, CT.1997, page 53)

Tableau 2008 Users Conference July 22, 2008
© 2008 Stephen Few, Perceptual Edge 36
The presentation of quantitative data as text, such as you see in this table, is perfect when you need precise values or when the purpose is to look up or compare individual values, but not when you wish to see patterns, trends, and exceptions, to make broader
visualizations work best.
When data is presented visually, it is made visible, and from this picture we can easily glean insights that would take far longer to piece together from the same data presented textually, if ever. This graph of the same data that appears in the table makes brings to light
instantly.

Tableau 2008 Users Conference July 22, 2008
© 2008 Stephen Few, Perceptual Edge 37
This small table contains only eight quantitative values, yet a clear pattern that exists in the data is difficult to discern. One group of employees exhibit job satisfaction that is much different from the other groups.The fact that job satisfaction for employees without a college degree decreases
table, but it is immediately obvious when you examine the graph.
Modern data graphics can do much more than simply substitute for small statistical tables. At their best, graphics are instruments for reasoning about quantitative information. Often the most effective way to describe, explore, and summarize a set of numbers even a very large set is to look at pictures of those numbers. Furthermore, of all methods for analyzing and communicating statistical information, well-designed data graphics are usually the simplest and at the same time the most powerful.(The Visual Display of Quantitative Information, Edward R. Tufte, Graphics Press: Cheshire, CT 1983, Introduction)
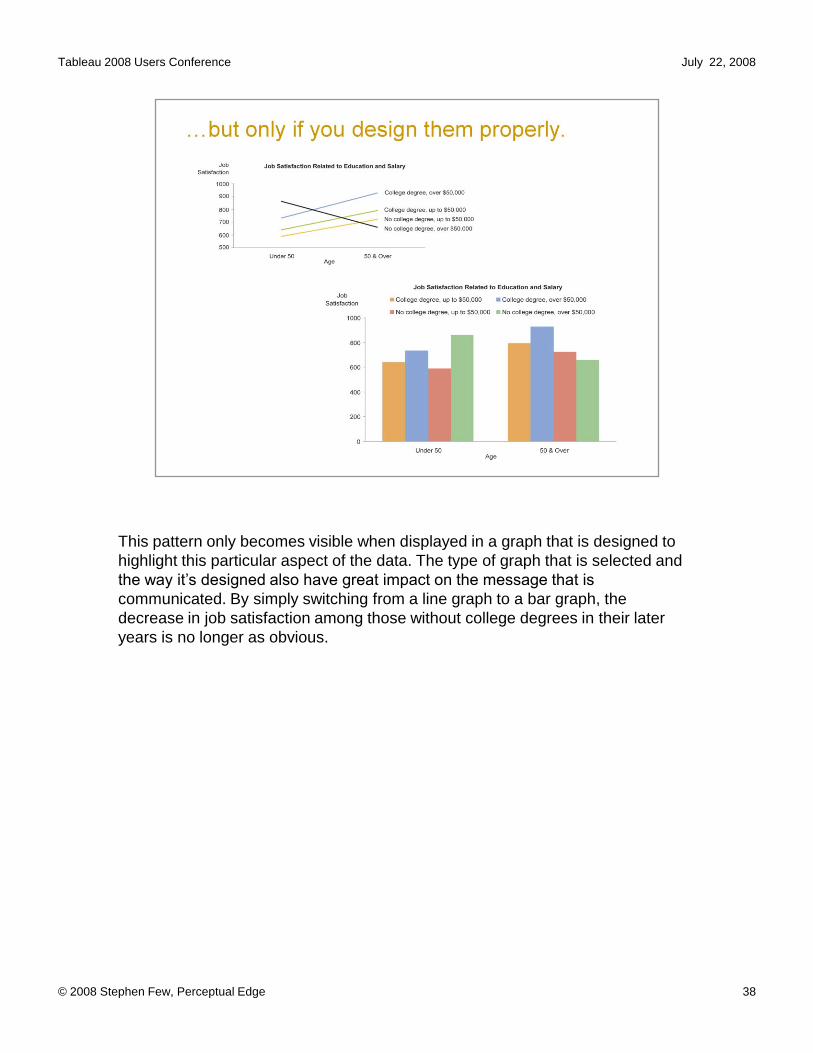
Tableau 2008 Users Conference July 22, 2008
© 2008 Stephen Few, Perceptual Edge 38
This pattern only becomes visible when displayed in a graph that is designed to highlight this particular aspect of the data. The type of graph that is selected and
communicated. By simply switching from a line graph to a bar graph, the decrease in job satisfaction among those without college degrees in their later years is no longer as obvious.

Tableau 2008 Users Conference July 22, 2008
39© 2008 Stephen Few, Perceptual Edge

Tableau 2008 Users Conference July 22, 2008
40© 2008 Stephen Few, Perceptual Edge

Tableau 2008 Users Conference July 22, 2008
41
Despite how differently they look in the original image, squares A and B are exactly the same color. What we see is not a simple recording of what is actually out there. Seeing is an active process that involves interpretations by our brains of data that is sensed by our eyes in an effort to make sense of it in context. The presence of the cylinder and its shadow in the image of the checkerboard triggers an adjustment in our minds to perceive the square labeled B as lighter than it actually is. The illusion is also created by the fact that the sensors in our eyes do not register actual color but rather the difference in color between something and
it and square B and the dark squares that surround it cause us to perceive squares A and B quite differently, even though they are actually the same color, as you can clearly see above after all of the surrounding context has been removed.
The ability to use graphs effectively requires a basic understanding of how we unconsciously interpret what we see.
© 2008 Stephen Few, Perceptual Edge

Tableau 2008 Users Conference July 22, 2008
42
This image illustrates the surprising effect that a simple change in the lightness of the background alone has on our perception of color. The large rectangle displays a simple color gradient of a gray-scale from fully light to fully dark. The small
way because our brains perceive visual differences rather than absolute values, in this case between the color of the small rectangle and the color that immediately surrounds it.
Among other things, understanding this should tell us that using a color gradient as the background of a graph should be avoided.
© 2008 Stephen Few, Perceptual Edge

Tableau 2008 Users Conference July 22, 2008
43
We do not pay attention to everything in our field of vision. Visual perception is selective and must be, for an awareness of everything out there would overwhelm us. Attention tends to be drawn contrasts to the norm. For this reason, to successfully see meaning in the data, we must visually encode data in ways that
In the image above, the two sections of texture that stand out: one left of center and
exactly the same. They differ from what surrounds them because the lines that form the texture on the left are smaller than those that surround them, and those that form the texture on the right are larger than those that surround them.
Because our eyes are drawn to things that stand out as different, data visualizations
(Note: This image appears in Information Visualization: Perception for Design, Second Edition, Colin Ware, Morgan Kaufmann Publishers: San Francisco, CA, 2004.)
© 2008 Stephen Few, Perceptual Edge

Tableau 2008 Users Conference July 22, 2008
44
There is a distinct image that has been worked into the picture of the rose, which
dolphin, however, we can easily spot it in the rose.Data visualizations must encode meaningful information as patterns that we can learn to spot and understand.
(Note: The image of the rose was found at www.coolbubble.com.)
© 2008 Stephen Few, Perceptual Edge

Tableau 2008 Users Conference July 22, 2008
45
From this set of six playing cards, select one and remember it. I will now identify and
© 2008 Stephen Few, Perceptual Edge

Tableau 2008 Users Conference July 22, 2008
46
Amazing. And I can do this again and again. If you go back to the previous slide and
eliminated it.
limitations of short-term memory. None of the cards on the second screen are the
you only remembered the card that you selected, not the others.
© 2008 Stephen Few, Perceptual Edge

Tableau 2008 Users Conference July 22, 2008
47
In addition to understanding visual perception, visual analysis tools must also be rooted in an understanding of how people think. Only then can they recognize and support the cognitive operations that are necessary to make sense of information.
Memory plays an important role in human cognition. Because memory suffers from certain limitations, visual analysis tools must be able to augment memory.
The example above illustrates one of the limitations of working memory. We only remember that to which we attend. Any part of this image that never gets our attention will not be missed when we shift to another version of the image that lacks
version of the image to the next, but only if the transition shift immediately from one to another, without even a split second of blank space between them.
focus. To see something clearly, we must focus on it, for only a small area of receptors on the retinas of our eyes are designed for high-resolution vision.
(Source: This demonstration of change blindness was prepared by Ronald A. Rensink of the University of British Columbia. Several other examples of this visual phenomenon can be found at http://www.psych.ubc.ca/%7erensink/flicker/download/index.html.)
© 2008 Stephen Few, Perceptual Edge

Tableau 2008 Users Conference July 22, 2008
48
Memories are stored as chunks of information. A chunk can be as small as a single tiny fact (for example, revenue equals $56,384 for the quarter) or a
(for example, a trend line on a time-series graph that shows revenue increasing from month to month throughout the year.) The better you get at seeing and understanding meaningful patterns and relationships in data, the better able you are to store more data as a single chunk. Working memory is where information is stored while we are thinking about something. It is like the working memory, or RAM, in a computer. Our brains are constantly swapping chunks of information in and out of working memory from either what we perceive in the outside world or from the more permanent storage of long-term memory. There is a limit to the amount of information that can be held in working memory at any one time, which is estimated by researchers to be about three chunks. By using graphs, rather than tables of text, working memory is augmented by storing more information into the same limited amount of space.
© 2008 Stephen Few, Perceptual Edge

Tableau 2008 Users Conference July 22, 2008
© 2008 Stephen Few, Perceptual Edge 49
It is very difficult with most software to combine all of the information that you want to see together on a single screen without needing to scroll. You often end up bouncing from screen to screen to see separately what you would ideally like to see together in order to make comparisons and get a sense of the big picture.

Tableau 2008 Users Conference July 22, 2008
50
Now, however, with expenses for 15 separate departments visible at the same time, this display serves as an external aid to working memory, making it easy to make comparisons.When exploring and examining data, it is important to place as much as possible within eye span. If you see patterns in a graph and then try to
bouncing back and forth between displays, wasting time and getting very frustrated in the process.
© 2008 Stephen Few, Perceptual Edge

Tableau 2008 Users Conference July 22, 2008
© 2008 Stephen Few, Perceptual Edge 51
Data visualization is much more than just graphical reporting, more than dashboards. Beyond its use for communicating information that cannot be communicated with tabular data, its greatest potential is exhibited in its use for analysis. The best techniques for making sense of business data are visual techniques, which extend our ability to find and understand meaningful patterns in data by offloading much of the work traditionally performed by the conscious mind to
provide some graphical functionality in their software, but few actually support visual analysis in more than rudimentary ways.

Tableau 2008 Users Conference July 22, 2008
© 2008 Stephen Few, Perceptual Edge 52
The traditional BI approach to analyzing data using tables of text, including crosstabs or pivot tables, is severely limited and discouraging. It is so time consuming and cumbersome, people are discouraged from exploration.

Tableau 2008 Users Conference July 22, 2008
© 2008 Stephen Few, Perceptual Edge 53
The tabular model forces us to view small slices of information one piece at a time, which cannot possibly be stitched together in our brains to tell the whole story.

Tableau 2008 Users Conference July 22, 2008
© 2008 Stephen Few, Perceptual Edge 54
When new recruits by intelligence organizations are trained in spy craft, they are taught a method of observation that begins by getting an overview of the scene around them while being sensitive to things that appear abnormal, not quite right, which they should then focus in on for close observation and analysis.
A visual information-filter, then details-on-(Readings in Information Visualization: Using Vision to Think, Stuart K. Card, Jock D. Mackinlay, and Ben Shneiderman, Academic Press, San Diego, California, 1999, page 625)Having an overview is very important. It reduces search, allows the detection of overall patterns, and aids the user in choosing the next move. A general heuristic of visualization design, therefore, is to start with an overview. But it is also necessary for the user to access details rapidly. One solution is overview + detail: to provide multiple views, an overview for orientation, and a detailed view for further work.(Ibid., page 285)
i.e. they first try to reduce the data set to a smaller, more manageable size. After some iterations, it is easier to make the final selection(s) from the reduced data set. This iterative refinement or progressive querying of data sets is sometimes known as hierarchical decision-making.(Ibid., page 295)
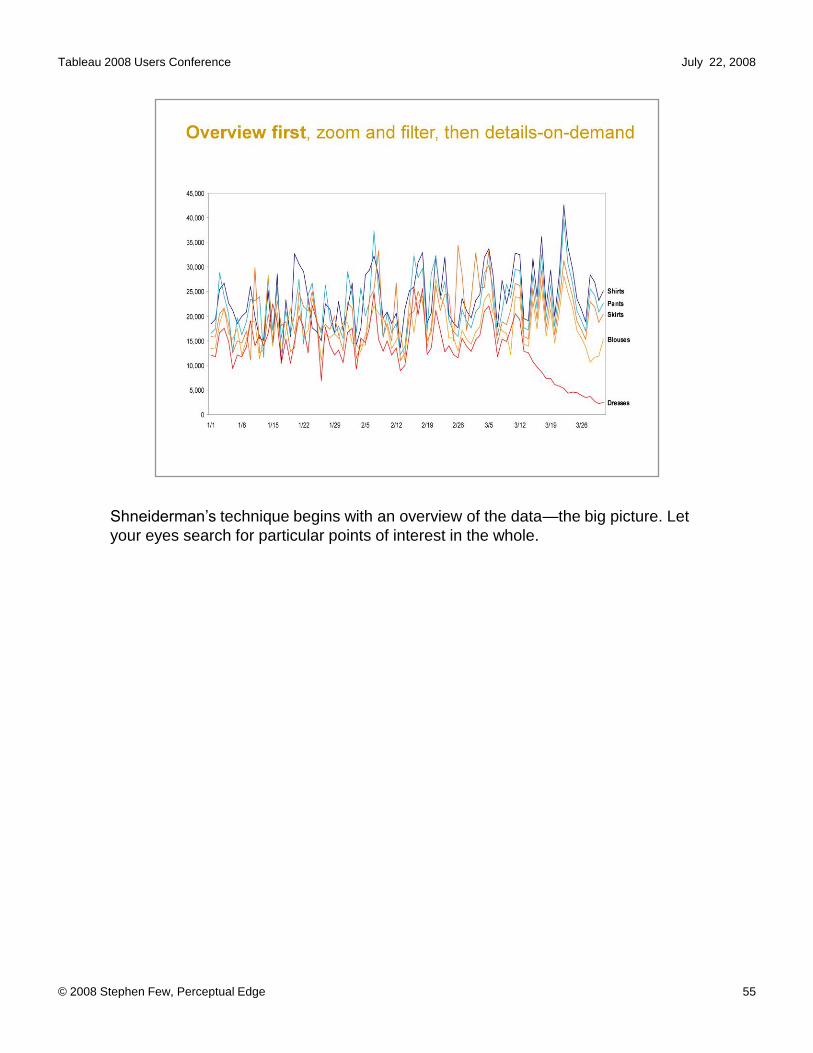
Tableau 2008 Users Conference July 22, 2008
© 2008 Stephen Few, Perceptual Edge 55
technique begins with an overview of the data the big picture. Let your eyes search for particular points of interest in the whole.

Tableau 2008 Users Conference July 22, 2008
© 2008 Stephen Few, Perceptual Edge 56
When you see a particular point of interest, then zoom in on it.

Tableau 2008 Users Conference July 22, 2008
© 2008 Stephen Few, Perceptual Edge 57
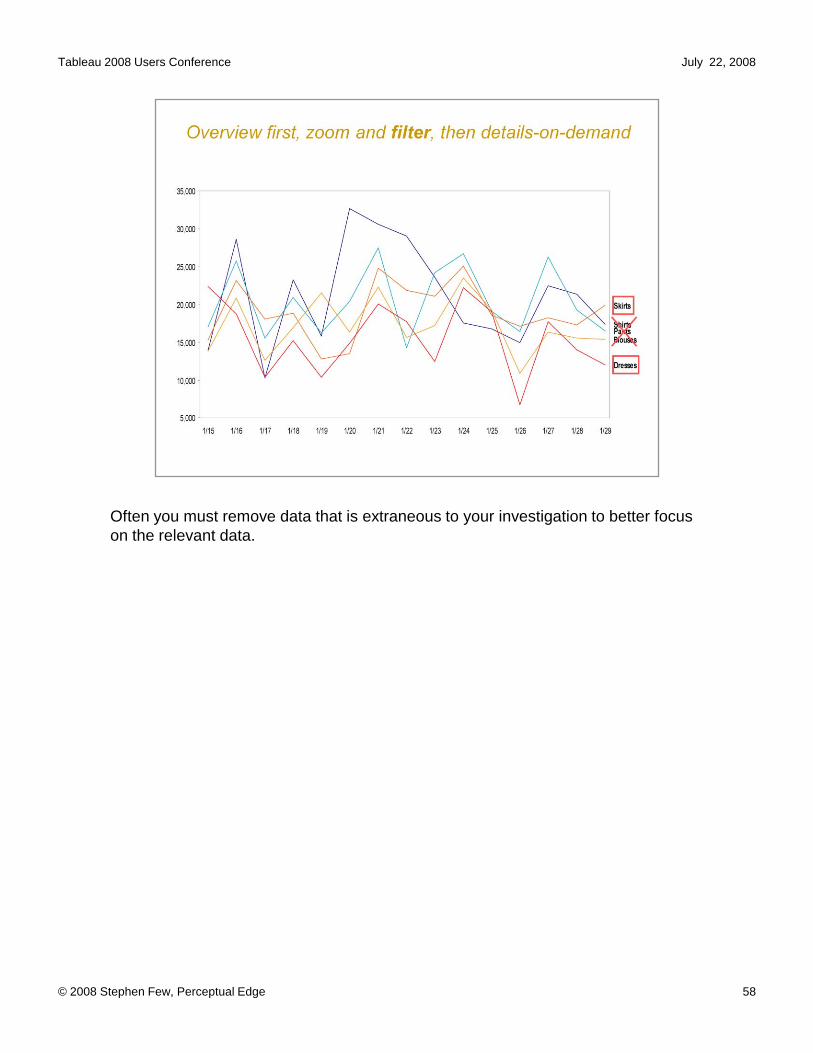
Tableau 2008 Users Conference July 22, 2008
© 2008 Stephen Few, Perceptual Edge 58
Often you must remove data that is extraneous to your investigation to better focus on the relevant data.

Tableau 2008 Users Conference July 22, 2008
© 2008 Stephen Few, Perceptual Edge 59
Filtering out extraneous data removes distractions from the data under investigation.

Tableau 2008 Users Conference July 22, 2008
© 2008 Stephen Few, Perceptual Edge 60
Visual data analysis relies mostly on the shape of the data to provide needed insights, but there are still times when you need to see the details behind the shape of the data. Having a means to easily see the details when you need them, without

Tableau 2008 Users Conference July 22, 2008
© 2008 Stephen Few, Perceptual Edge 61
Direct dynamic interaction with the properly visualized data allows us to see discover meaningful patterns, trends, and exceptions in the display and to interact
variables for comparison, etc., in ways that promote a smooth flow between seeing something, thinking about it, and manipulating it, with no distracting lags in between.
Great analysts, like great scientists, great artists, great people of all sorts, accept the call to serve as a voice for data. Important stories can be found in data. We can learn to discern the meanings that live in information and to unravel the stories that
fight against those who try to hide or alter the truth. I believe that the truth really can set us free.

Tableau 2008 Users Conference July 22, 2008
© 2008 Stephen Few, Perceptual Edge 62
multiple ways simultaneously, which provides several perspectives at once and supports comparisons that could not be made otherwise.

Tableau 2008 Users Conference July 22, 2008
© 2008 Stephen Few, Perceptual Edge 63
Tools like Tableau will help you transform information into knowledge, but only you can make the next step happen by putting that knowledge to good use.
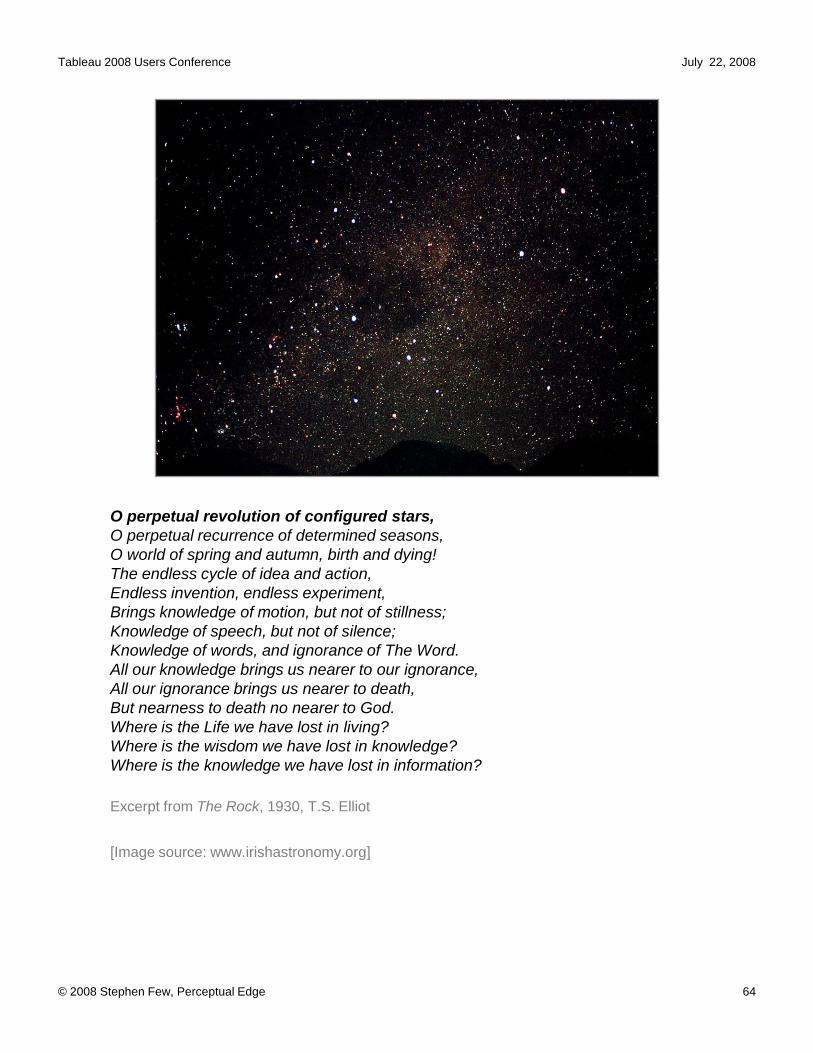
Tableau 2008 Users Conference July 22, 2008
64© 2008 Stephen Few, Perceptual Edge
O perpetual revolution of configured stars,O perpetual recurrence of determined seasons,O world of spring and autumn, birth and dying!The endless cycle of idea and action,Endless invention, endless experiment,Brings knowledge of motion, but not of stillness;Knowledge of speech, but not of silence;Knowledge of words, and ignorance of The Word.All our knowledge brings us nearer to our ignorance,All our ignorance brings us nearer to death,But nearness to death no nearer to God.Where is the Life we have lost in living?Where is the wisdom we have lost in knowledge?Where is the knowledge we have lost in information?
Excerpt from The Rock, 1930, T.S. Elliot
[Image source: www.irishastronomy.org]
Tableau 2008 Users Conference July 22, 2008
65© 2008 Stephen Few, Perceptual Edge
O perpetual revolution of configured stars,O perpetual recurrence of determined seasons,O world of spring and autumn, birth and dying!The endless cycle of idea and action,Endless invention, endless experiment,Brings knowledge of motion, but not of stillness;Knowledge of speech, but not of silence;Knowledge of words, and ignorance of The Word.All our knowledge brings us nearer to our ignorance,All our ignorance brings us nearer to death,But nearness to death no nearer to God.Where is the Life we have lost in living?Where is the wisdom we have lost in knowledge?Where is the knowledge we have lost in information?
Excerpt from The Rock, 1930, T.S. Elliot
[Image source: www.trekvisual.com]

Tableau 2008 Users Conference July 22, 2008
66© 2008 Stephen Few, Perceptual Edge
O perpetual revolution of configured stars,O perpetual recurrence of determined seasons,O world of spring and autumn, birth and dying!The endless cycle of idea and action,Endless invention, endless experiment,Brings knowledge of motion, but not of stillness;Knowledge of speech, but not of silence;Knowledge of words, and ignorance of The Word.All our knowledge brings us nearer to our ignorance,All our ignorance brings us nearer to death,But nearness to death no nearer to God.Where is the Life we have lost in living?Where is the wisdom we have lost in knowledge?Where is the knowledge we have lost in information?
Excerpt from The Rock, 1930, T.S. Elliot
[Image source: www.i.pbase.com]

Tableau 2008 Users Conference July 22, 2008
67© 2008 Stephen Few, Perceptual Edge
O perpetual revolution of configured stars,O perpetual recurrence of determined seasons,O world of spring and autumn, birth and dying!The endless cycle of idea and action,Endless invention, endless experiment,Brings knowledge of motion, but not of stillness;Knowledge of speech, but not of silence;Knowledge of words, and ignorance of The Word.All our knowledge brings us nearer to our ignorance,All our ignorance brings us nearer to death,But nearness to death no nearer to God.Where is the Life we have lost in living?Where is the wisdom we have lost in knowledge?Where is the knowledge we have lost in information?
Excerpt from The Rock, 1930, T.S. Elliot
[Image source: www.]

Tableau 2008 Users Conference July 22, 2008
68© 2008 Stephen Few, Perceptual Edge
O perpetual revolution of configured stars,O perpetual recurrence of determined seasons,O world of spring and autumn, birth and dying!The endless cycle of idea and action,Endless invention, endless experiment,Brings knowledge of motion, but not of stillness;Knowledge of speech, but not of silence;Knowledge of words, and ignorance of The Word.All our knowledge brings us nearer to our ignorance,All our ignorance brings us nearer to death,But nearness to death no nearer to God.Where is the Life we have lost in living?Where is the wisdom we have lost in knowledge?Where is the knowledge we have lost in information?
Excerpt from The Rock, 1930, T.S. Elliot
[Image source: www.shepherdpics.com]

Tableau 2008 Users Conference July 22, 2008
69© 2008 Stephen Few, Perceptual Edge
O perpetual revolution of configured stars,O perpetual recurrence of determined seasons,O world of spring and autumn, birth and dying!The endless cycle of idea and action,Endless invention, endless experiment,Brings knowledge of motion, but not of stillness;Knowledge of speech, but not of silence;Knowledge of words, and ignorance of The Word.All our knowledge brings us nearer to our ignorance,All our ignorance brings us nearer to death,But nearness to death no nearer to God.Where is the Life we have lost in living?Where is the wisdom we have lost in knowledge?Where is the knowledge we have lost in information?
Excerpt from The Rock, 1930, T.S. Elliot
[Image source: www.i163.photobucket.com]
Tableau 2008 Users Conference July 22, 2008
70© 2008 Stephen Few, Perceptual Edge
O perpetual revolution of configured stars,O perpetual recurrence of determined seasons,O world of spring and autumn, birth and dying!The endless cycle of idea and action,Endless invention, endless experiment,Brings knowledge of motion, but not of stillness;Knowledge of speech, but not of silence;Knowledge of words, and ignorance of The Word.All our knowledge brings us nearer to our ignorance,All our ignorance brings us nearer to death,But nearness to death no nearer to God.Where is the Life we have lost in living?Where is the wisdom we have lost in knowledge?Where is the knowledge we have lost in information?
Excerpt from The Rock, 1930, T.S. Elliot
[Image source: www.jamin.org]

Tableau 2008 Users Conference July 22, 2008
71© 2008 Stephen Few, Perceptual Edge
Good tools, from stones for crushing or cutting to computers for augmenting cognition, when used properly, set us free and make the world a better place. When misused, they make us lazy, dumb, slaves. The choice is ours.
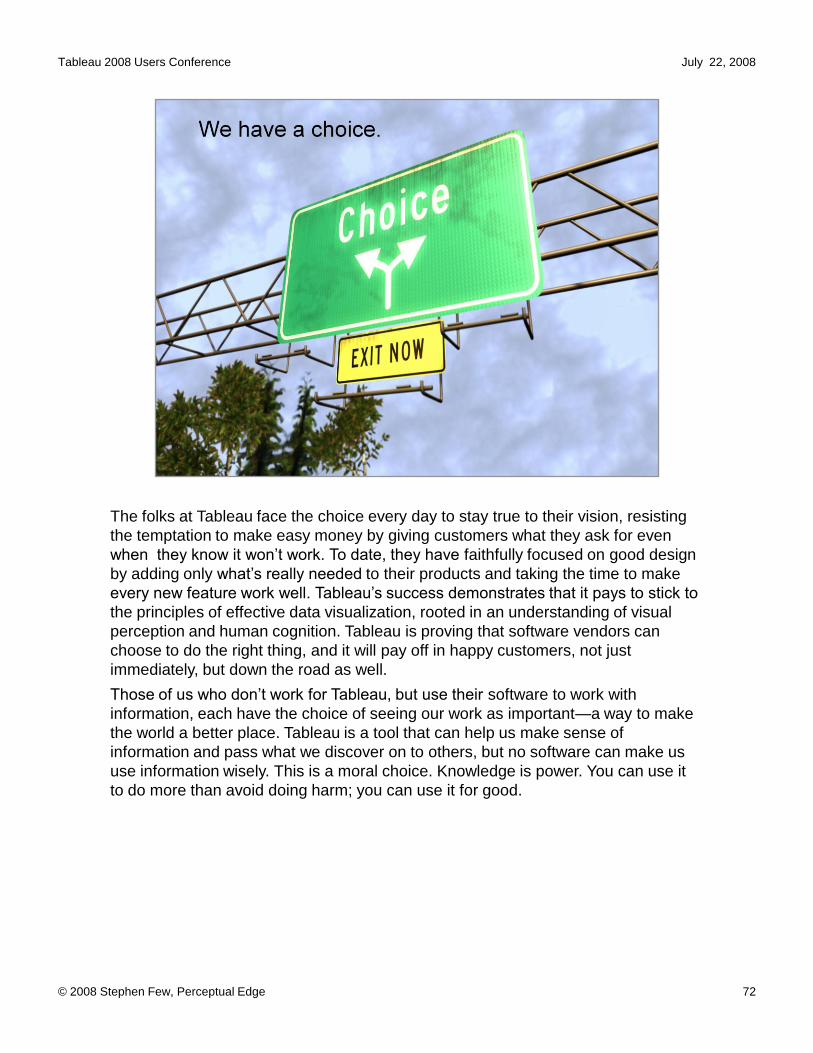
Tableau 2008 Users Conference July 22, 2008
72
The folks at Tableau face the choice every day to stay true to their vision, resisting the temptation to make easy money by giving customers what they ask for even
faithfully focused on good design by adding only to their products and taking the time to make
the principles of effective data visualization, rooted in an understanding of visual perception and human cognition. Tableau is proving that software vendors can choose to do the right thing, and it will pay off in happy customers, not just immediately, but down the road as well.
software to work with information, each have the choice of seeing our work as important a way to make the world a better place. Tableau is a tool that can help us make sense of information and pass what we discover on to others, but no software can make us use information wisely. This is a moral choice. Knowledge is power. You can use it to do more than avoid doing harm; you can use it for good.
© 2008 Stephen Few, Perceptual Edge