download proceedings te-re-rd 2014
TRANSCRIPT
3nd International Conference on Thermal Equipment,
Renewable Energy and Rural Development
TE-RE-RD 2014

I
3nd International Conference of Thermal Equipment,
Renewable Energy and Rural Development
TE-RE-RD 2014
ORGANIZERS:
University “POLITEHNICA” of Bucharest Faculty of Mechanical Engineering and Mechatronics -
Faculty of Biotechnical Systems Engineering -
Hydraulics & Pneumatics Research Institute
(INOE 2000 - IHP), Bucharest
Chamber of Commerce, Industry, Shipping and Agriculture Constanta – ROMANIA
Editors:
Prof.dr.ing. Lucian MIHĂESCU Assoc. Prof.dr.ing. Gabriel-Paul NEGREANU
Mamaia – Romania 12-14 June 2014

II
ISSN 2359-7941
ISSN-L 2359-7941
Editura POLITEHNICA PRESS COVER: Valentin Miroiu
HONORARY COMMITTEE Prof. Mihnea COSTOIU ROMANIA Prof. Ecaterina ANDRONESCU ROMANIA Prof. Tudor PRISECARU ROMANIA Prof. Gigel PARASCHIV ROMANIA Prof. George DARIE ROMANIA Dr. Petrin DRUMEA Prof. Viorel BADESCU
ROMANIA ROMANIA
Dipl. Eng. Mihai DARABAN ROMANIA SCIENTIFIC COMMITTEE Dr. Atanas ATANASOV Prof. Alexandru DOBROVICESCU
BULGARIA ROMANIA
Prof. Ion DONA ROMANIA Dr. Cătălin DUMITRESCU Prof. Nicolae ENESCU
ROMANIA ROMANIA
Prof. Iliya Iliev Dr. Ion V. ION Prof. Milan MARTINOV
BULGARIA ROMANIA SERBIA
Dr. Gabriela MATACHE Prof. Nicolay MIHAILOV
ROMANIA BULGARIA
Prof. Constantin PANA ROMANIA Dr. Ion PIRNA ROMANIA Prof. Marija TODOROVIC SERBIA Prof. Tanay Sidki UYAR TURKEY Dr. Valentin VL ĂDUŢ ROMANIA Prof. Gheorghe VOICU ROMANIA Prof. Lubomir SOOS SLOVAKIA
III
ORGANIZING COMMITTEE Chairman Prof. Lucian MIHAESCU ROMANIA Co-Chairmen Dr. Sorin-Stefan BIRIS ROMANIA Dr. Gabriel NEGREANU ROMANIA Dr. Iulian DUTU ROMANIA
Members
Dr. Valentin APOSTOL ROMANIA Prof. Mircea BĂDESCU ROMANIA Dipl.Eng. Viorel BERBECE ROMANIA Dr. Cr ăiţa CARP-CIOCÂRDIA Dr. Mihaela DUŢU Prof. Ionel PÎŞĂ
ROMANIA ROMANIA ROMANIA
Dr. Elena POP ROMANIA
Secretary
Dipl. ing. Adriana BAROTHI ROMANIA Dipl.ing. Cristina CIOBANU Dipl. Valentin MIROIU
ROMANIA ROMANIA

IV
CONFERENCE SPONSORS
Sos. Bucuresti - Magurele nr. 232
051434 Bucuresti 5, Romania
Tel: +40 21 255 31 32
Fax: +40 21 255 30 66
Mobil 0722229638
e-mail: [email protected]
Str. Av. Vasile Fuica, Nr. 26, Sector 1
RO11795620 Bucuresti, Romania
Tel: (++40-21) 6654069
Fax: (++40-21) 2247212
Agromec Stefanesti

V
CONFERENCE PROFRAMME
Thursday, June 12 Friday, June 13 Saturday, June 14
Breakfast Breakfast
14.00-15.00 Registration of participants
08.30-09.30 Registration of participants
09.00-13.00 Visit to Ancient City of Histria
15.00-15.30 Opening ceremony
09.30-11.00 Oral presentations "Sections 1 and 2"
13.00- Participants departure
15.30-18.00 Plenary session
11.00-11.30 Coffee break
18.00-20.00 Welcome cocktail
11.30-13.00 Oral presentations
Section 1 and 2"
13.00-14.30
Lunch
14.30-16.00
Oral presentations "Sections 1 and 2
16.00-16.30 Coffee break
16.30-17.30 Workshop
Efficiecy increase of the solid biomas combustion under hidrogen
flow
19.30-22.00
Conference dinner

VI

VII
CONTENTS
SECTION 1: THERMAL EQUIPMENT AND RENEWABLE ENERGY
Nr.
crt
Paper Authors Page
1 Opportunities, challenges and future prospects
of using biogas as road transport fuel in
Pakistan
F. U. M. Allah 1
2 Primary resources of energy M. Bică, M. S. Sofronie, C. D. Cernăianu,
D. Muscalagiu
5
3 Experimental research on the combustion of the
gases in low-power burners
M. Bică, M. S. Sofronie, C. D. Cernăianu,
D. Muscalagiu
11
4 Heat measure unit for cetralized heat supply of
direct subscriber stations
V. Bobilov, P. Zlatev, Z. Kolev, P.
Mushakov
17
5 Increasing the energy efficiency of thermal
power plant
V. Bobilov, V. Kamburova, Z. Kolev, P.
Zlatev, P. Mushakov
21
6 Some aspects of cycle variability at an LPG
fuelled diesel engine
Al. Cernat, C. Pana, N. Negurescu 27
7 Hot air distribution through main bustle pipe on
the tuyeres of a blast furnace
E. Dimofte, Fl. Popescu, I. V. Ion 33
8 Results of operations for the storage and
handling of willow energy crops
A. Domokos, L. Mihăescu, I. Pîşă, E. Pop 39
9 Analogy in processes of destruction of fragile
capillary - porous coverings and metallic steam-
generating surfaces in power installations
Al. Genbach, K. Olzhabayeva, I. Iliev 43
10 Study of the conditions of fragile fracture of
capillary-porous coatings in thermal power
plants
Al. A. Genbach, V. O. Baibekova, I. Iliev 49
11 Case of study regarding the energy
requirements for a medium rural household
Al. Gruia 55
12 Simplified methodology for monitoring and
assessment of the effect of energy saving
measures in public buildings
V. Kamburova , I. Iliev , A. Terziev 59
13 Schemes for project financing of combined heat
and power production trough biomass
gasification
V. Kamburova , I. Iliev , A. Terziev 65
14 Parametric investigation study of counter-flow
evaporator for waste heat recovery
M. H. K. Aboaltabooq, H. Pop, V. Badescu,
V. Apostol, M. Prisecaru, C. Petcu, C.
Ciobanu
71
15 Air quality in Romania. dispersion of pollutant in
a urban area using CFD simulation
O. Mărunţelu, Gh. Lăzăroiu 77
16 Results on the 18 t/h boiler operation in S.C.
Vrancart S.A.
L. Mihăescu, I. Pîşă, I. Oprea,
G. Negreanu, A. Adam, C. Mândrean,
I. Bărbieru, R. Rusu, R.Sava
83
17 Research and experimental analyses concerning
the increase efficiency of solid biomass
combustion in hydrogen jet
L. Mihăescu, Gh. Lăzăroiu, I. Pîşă, E. Pop,
G. Negreanu,
87
18 Theoretical analysis of impact of the solid
biomass combustion in hydrogen jet in
developing new innovative technologies
L. Mihăescu, T. Prisecaru, Gh. Lăzăroiu, I.
Pîşă, E. Pop, G. Negreanu, M.E.
Georgescu, V. Berbece, M. Prisecaru
91

VIII
19 The experimental analysis on the influence of
air filter, oil filter and oil on the performance of
the internal combustion engine
M. D. Muscalagiu, Al.M. Dima, C. G.
Muscalagiu
95
20 Design conception of a pilot burner that
simulates the retrofitted burners from CHP
Işalniţa
G. Negreanu, L. Mihăescu, I. Pîşă, I.
Oprea, V. Berbece, A. Adam, C.
Mândrean, I. Bărbieru, V. Gherghina, Al.
Moga
101
21 Thermal power plant for energy willow use:
design, performances
G. Negreanu, V. Berbece, L. Mihăescu, I.
Oprea, I. Pîşă, D. Andreescu
105
22 The analysis of the dynamics of vegetable oils
burning in power plants
B. Niculescu 109
23 Efficient use of natural gas for a medium size
district heating system
I.Oprea, G. Negreanu, V. Berbece, I. Pîşă,
L. Mihăescu
113
24 Pollutant emissions of a heat treating furnace D. Pană, I. V. Ion 119
25 Hydraulic fracturing in the United States of
America
D. Parascin 125
26 The effects of dimensions of combustion
chamber on the heat transfer process in CFB
boilers
W. Pospolita, K. Jesionek, A.Wierciak, I.
Iliev
131
27 Performance analysis of a hybrid water and air
solar collector with rectangular fins
Q. A. Abed, V. Badescu, I. Soriga 137
28 Cogeneration system modeling for isolated
buildings
B. Radu, Al. Racovitză 141
29 Very high gas temperature turboengine C. Sandu, I. Vladucă, B. Sacuiu, D.
Amariutei, R. Cârlănescu, R. Bimbasa
145
30 Practical psychomanagerial application in order
to build a behavioral holistic model of eco-
awareness based on order psychology-quantum
psychology® (POPQ®)
C. Sofronie, R. Zubcov 151
31 Study on combustion efficiency, technology,
main factors and corrosive chemicals for the
furnace
A.G. Ştefan, T. Prisecaru 157
32 Study of the PV modules inclination angle on
the energy production
A. Terziev, V. Kamburova, I. Iliev, K.
Mavrov, D. Deltchev
163
33 Development and testing of a solution for NOx
emission reduction based on the SNCR process
for high capacity steam generators
Z. Teuber, I. Bolma 169
34 Analysis on the combustion dynamics of the
straw briquettes for boilers with mobile grate
M. Toader 175
35 Comfort in passive house – an adaptive
approach
I. Udrea,, I. Nastase,, R. Crutescu, C.
Croitoru, V. Badescu
179
IX
SECTION 2 : BYOTECHNICAL SYSTEMS, RENEWABLE ENERGY AND RURAL DEVELOPMENT
Nr.
crt
Paper Authors Page
1 Determination permeability of transparent
covers for solar collectors
D. G. Atanasov, M. S. Minchev, A. I.
Tashev
183
2 Research on valuable recovery of oil from grape
seeds
S.Șt. Biriș, C.I. Covaliu, G. Paraschiv, V.
Vlăduț, A. Atanasov
187
3 Elimination of parasitic weed seeds from the
mass of seeds of agricultural crops through wet
magnetic separation
V. G. Ciobanu, A. Paun 193
4 Influence of cinematic regime and quantity of
material on efficiency of sifting process
G.Al. Constantin, Gh. Voicu, M.E. Ştefan 199
5 Heavy metals removal from wastewater using
magnetic nanomaterials based adsorption
strategies
C.I. Covaliu, G. Paraschiv, S.Șt. Biriș, E.
Matei, I. Filip, M. Ionescu
205
6 Structural analysis of the reciprocating rod in
the driving mechanism of the mas-220 machine
A.D. David, E. Maican, Gh. Voicu, M.F. Duţu 209
7 The common agricultural policy in the European
Union and Romania: past, present and future
O. David, S. Maiduc (Osiceanu) 215
8 The influence of heavy metals on biogas
production during the anaerobic digestion
process
M. Dincă,, G. Moiceanu, G. Paraschiv, Gh.
Voicu, N. Ungureanu, L. Toma, M. Ionescu
219
9 Mathematical modeling of vertical oscillation of
a tractor for a model with four degrees of
freedom when traveling on an agricultural land
and an unpaved road
M.F. Duţu, G. Simion, I. Duţa, A.D. David, S.
Osiceanu (Maiduc)
225
10 Antimicrobial action of some essential oils from
indigenous flora against fungal contaminants in
food
M. Ferdes, A. Pruteanu 231
11 Convection dryers with increased energy
independence
I. C. Gîrleanu, Gh. Sovăială, G. Matache 237
12 Parameters influencing the screw pressing
process of oilseed materials
M. Ionescu, Gh. Voicu, S.-Şt. Biriş C.
Covaliu, M. Dincă, N. Ungureanu
243
13 Micro greenhouse climate management based
on the Arduino
G. Ipate, Gh. Voicu, E. M. Stefan, N.
Ungureanu, C. Nutescu
249
14 The use of electric field for pollutant removal
from contaminated soils
I.A. Istrate, T. M. Oprea 255
15 Current state of fuel cells and hydrogen for
European road transport sector
E. Maican 261
16 The potential of biomass from agricultural
activities available for energy purposes
Gr. Marian, Al. Muntean, A. Gudîma, A.
Pavlenco
267
17 Biogas, the future of modern society G. Moiceanu, M. Dincă, G. Paraschiv, Gh.
Voicu, M. Chiţoiu
273
18 Experimental research regarding chamomile
inflorescences mechanized harvesting process
A. Muscalu, A. Pruteanu, L. David 279
19 Research on optimization of parameters of
plows with variable working width
C. Nuţescu 285
20 The shredding of soft-textured food materials
by means of unheated metal wire cutting
C. Olaru, V. Nedeff, M. Panainte -
Lehăduș, I. Olaru, E. Ciobanu
291

X
21 Efficiently extraction of bioactive compounds
from medicinal plants using organic and
sustainable techniques
A. Pruteanu, A. Muscalu, M. Ferdes 297
22 Results from implementation of energy saving
measures in the educational buildings of
university of food technologies. Block 4
V. Rasheva, N. Kalojanov, S. Tasheva, М.
Мinchev, G. Valtchev
303
23 Characterization of rainfall with rainfall indices
in the city of Bucharest in (2009-2012)
C. O. Rusănescu 307
24 Lagoon systems for extensive wastewater
treatment plants from the rural agglomerations
V.V. Safta, M. Dincă, G.A. Constantin, A.
Boureci
311
25 HACCP approach to pastry products G.C. Simion, M. F. Duţu 317
26 Study on the specific energy consumption for
drying blueberries in convective solar dryer
D. Stoev, A. Tashev, N. Penov 321
27 Special construction autonomous station for the
dynamic monitoring of surface water quality
indicators
C. Vîlcu, Gh. Voicu, G. Paraschiv, A. Petcu,
A. Nedea
325
28 Experimental research on the determination of
the lower calorific power of the Miscanthus
briquettes compared with that of the sawdust
briquettes
I. Voicea., Gh. Voicu, V. Vladut, G.
Găgeanu, P Cârdei
331
29 The study of Miscanthus rhizomes distribution
at the semiautomatic planters
Gh. Voicu, G. Paraschiv, P. Cârdei, M.
Dincă, I..C. Poenaru
337
SECTION 3 :HYDRAULICS, PNEUMATICS, ELECTRONICS, MISCELLANEOUS
Nr.
crt
Paper Authors Page
1 Biodegradability of hydraulic fluids S. Anghel, A. I. Popescu, C. I. Garleanu 343
2 Study of optical fiber sensors regarding
corrosion detection for building efficiency
improvement
A. Badea, Fl. Dragan, L. Fara, P. Sterian 347
3 An innovative technique of car noise analysis
based on multiresolution algorithms
L. M. Caligiuri, F. Lamonaca, A. Nastro, M.
Vasile
353
4 Combined systems using renewable sources – a
solution for increased energetic autonomy
C. Dumitrescu, H. Sundt, P. Drumea, L.
Dumitrescu C. Cristescu
359
5 Analysis of charge transport in Dye-sensitized
solar cells (DSSC) using a Monte Carlo
simulation
C. Dumitru, Vl. Muscurel, L. Fara, P.
Sterian
365
6 Hydrothermal treatment for the production of
calcium phosphate biomaterials
D. Grimaldi, D. L. Carnì, F. Lamonaca,
A. Nastro, M. Vasile
371
7 Medium and high pressure actuators pneumatic
system
G. Matache, Gh. Sovaiala, R. Radoi,
I. Pavel
377
8 Electro hydraulic system for speed control of a
hydraulic motor using a PI controller
R. I. Rădoi, I. C. Duţu 383
9 Impact of noise and vibrations on the ship
microclimate
K. Uzuneanu, I. V. Ion 387

1
OPPORTUNITIES, CHALLENGES AND FUTURE PROSPECTS OF USING BIOGAS AS ROAD TRANSPORT FUEL IN PAKISTAN
Fazal Um Min Allah1 University of Craiova
ABSTRACT
Fossil fuels are depleting and causing more global warming. To decrease dependency on fossil fuels we will analyze potential, possible outcomes and challenges of using biogas as road transport fuel in Pakistan. It has potential of producing biogas from animal, food and household waste by using anaerobic digestion process. We will analyze implications of distribution and economics scenarios of producing biogas and to compare it with existing natural gas usage. This paper aims to make recommendations and to draw a conclusion on the basis of studying existing practices regarding waste to wheel approach.
1. INTRODUCTION For its energy needs, primarily, Pakistan is dependent on fossil fuels. It has to import fossil fuels to fulfill its energy demands. Main cause of environment pollution is usage of fossil fuels in Pakistan. To make itself less dependent on conventional energy resources, Pakistan should use renewable energy resources. Transport sector in Pakistan is heavily dependent on compressed natural gas (CNG). Due to the shortage of CNG transport sector has to face supply cuts for several days in a month. It will face even worse situation in the future. Prices for CNG fuel are also increasing as demand is growing. This demand can be fulfilled by alternative energy resource like biogas because country has the huge potential to produce it
[5]. Biogas is being used as vehicle fuel in Sweden and its consumption is increased over the years. Number of filling stations for biogas is increased from 6 to 122. Biogas can also be used as fuel in modified diesel engines. This experiment is done in Ireland and it has reduced dependency on fossil fuels and caused 12% decrease in green house gas emissions. Main source for biogas production in UK is animal waste. To make it usable for engines, it should be upgraded to increase the percentage of methane. Studies show that by using biogas as transport fuel, GHG emissions can be reduced up to 200%. It's an environmental friendly fuel compared to other fossil fuels. As a fuel, biogas offers fewer prices than fossil fuels. Sweden, France and Switzerland are already using biogas fuel for road transport. UK has limited potential to replace natural gas with biogas as transport fuel but in Pakistan it can play a huge role as transport industry is heavily dependent on CNG [1-5]. This paper aims to evaluate opportunities, future prospects and challenges of using biogas as road transport fuel in Pakistan keeping in view the experience gained from its usage in developed countries.
2. METHODOLOGY
2.1. CNG status in Pakistan
In Pakistan CNG as vehicle fuel was introduced in 1982 and in 2010 it became world's largest CNG user in transport sector. Competitive price and government policies played an important role in growth of its consumption in transport sector. 89% of the registered vehicles
1 Craiova, Str. Libertății, Căminul 3, Ap. 306, 0721737661, [email protected]
2
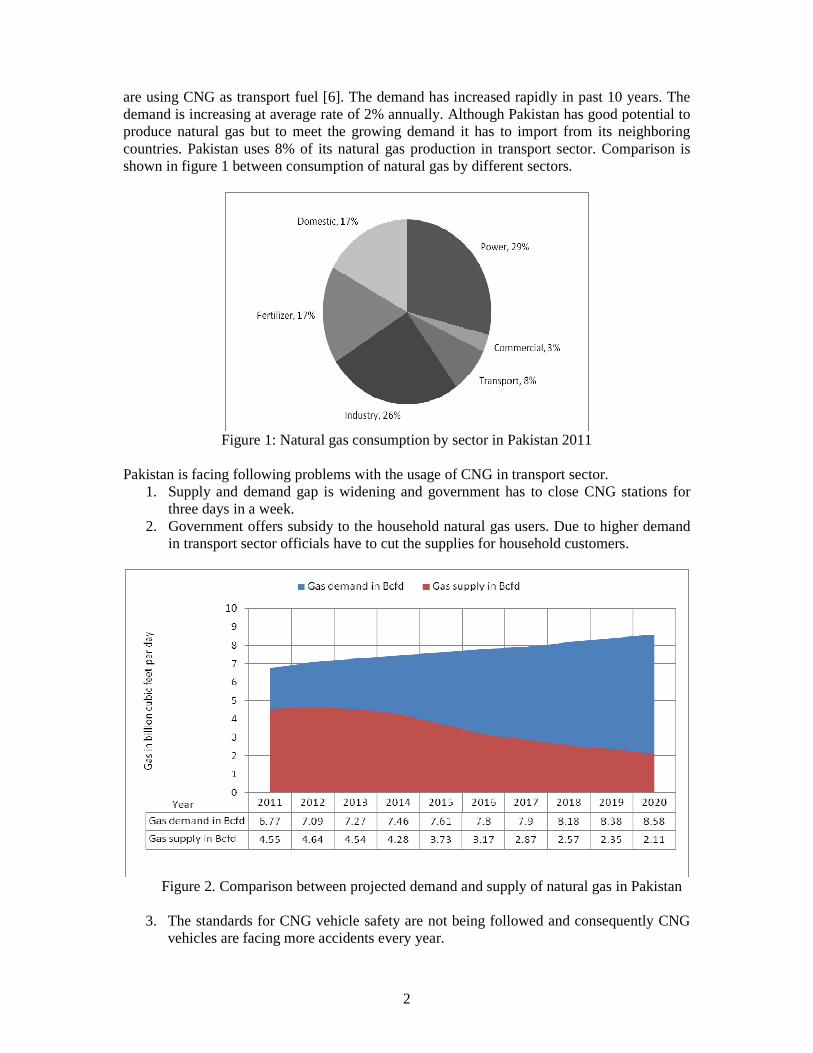
are using CNG as transport fuel [6]. The demand has increased rapidly in past 10 years. The demand is increasing at average rate of 2% annually. Although Pakistan has good potential to produce natural gas but to meet the growing demand it has to import from its neighboring countries. Pakistan uses 8% of its natural gas production in transport sector. Comparison is shown in figure 1 between consumption of natural gas by different sectors.
Figure 1: Natural gas consumption by sector in Pakistan 2011
Pakistan is facing following problems with the usage of CNG in transport sector.
1. Supply and demand gap is widening and government has to close CNG stations for three days in a week.
2. Government offers subsidy to the household natural gas users. Due to higher demand in transport sector officials have to cut the supplies for household customers.
Figure 2. Comparison between projected demand and supply of natural gas in Pakistan
3. The standards for CNG vehicle safety are not being followed and consequently CNG
vehicles are facing more accidents every year.
3
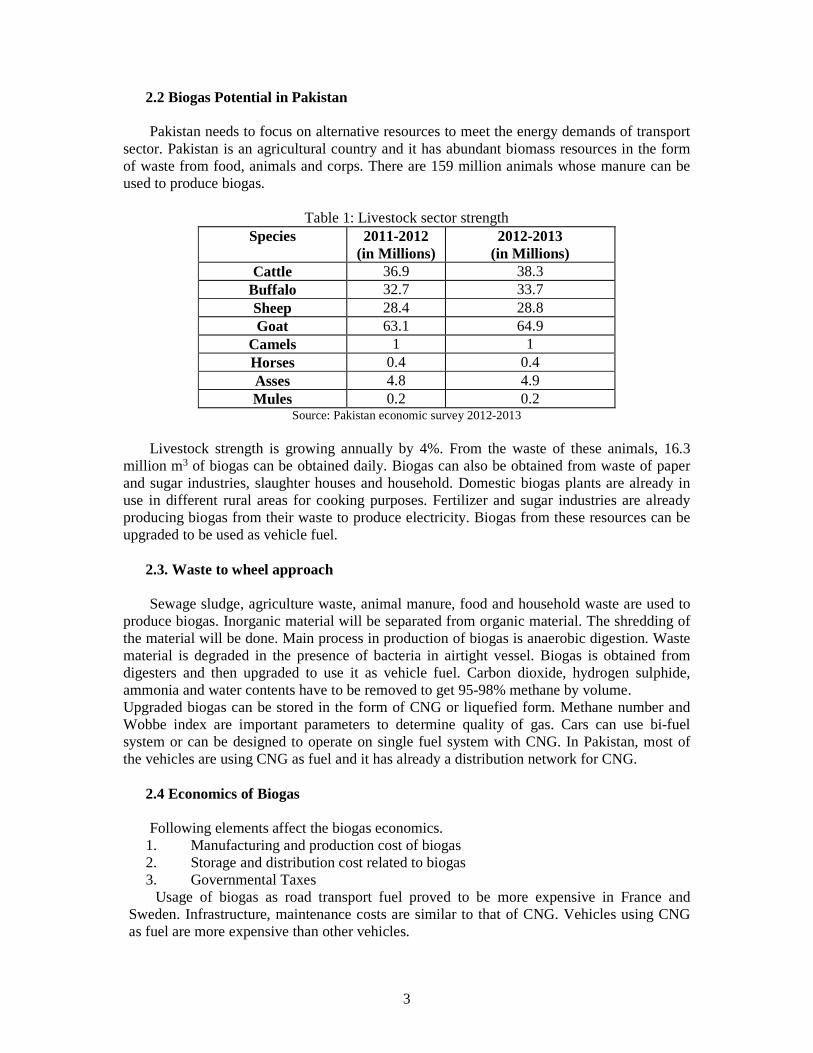
2.2 Biogas Potential in Pakistan Pakistan needs to focus on alternative resources to meet the energy demands of transport
sector. Pakistan is an agricultural country and it has abundant biomass resources in the form of waste from food, animals and corps. There are 159 million animals whose manure can be used to produce biogas.
Table 1: Livestock sector strength
Species 2011-2012 (in Millions)
2012-2013 (in Millions)
Cattle 36.9 38.3 Buffalo 32.7 33.7 Sheep 28.4 28.8 Goat 63.1 64.9
Camels 1 1 Horses 0.4 0.4 Asses 4.8 4.9 Mules 0.2 0.2
Source: Pakistan economic survey 2012-2013
Livestock strength is growing annually by 4%. From the waste of these animals, 16.3 million m3 of biogas can be obtained daily. Biogas can also be obtained from waste of paper and sugar industries, slaughter houses and household. Domestic biogas plants are already in use in different rural areas for cooking purposes. Fertilizer and sugar industries are already producing biogas from their waste to produce electricity. Biogas from these resources can be upgraded to be used as vehicle fuel.
2.3. Waste to wheel approach Sewage sludge, agriculture waste, animal manure, food and household waste are used to
produce biogas. Inorganic material will be separated from organic material. The shredding of the material will be done. Main process in production of biogas is anaerobic digestion. Waste material is degraded in the presence of bacteria in airtight vessel. Biogas is obtained from digesters and then upgraded to use it as vehicle fuel. Carbon dioxide, hydrogen sulphide, ammonia and water contents have to be removed to get 95-98% methane by volume. Upgraded biogas can be stored in the form of CNG or liquefied form. Methane number and Wobbe index are important parameters to determine quality of gas. Cars can use bi-fuel system or can be designed to operate on single fuel system with CNG. In Pakistan, most of the vehicles are using CNG as fuel and it has already a distribution network for CNG.
2.4 Economics of Biogas
Following elements affect the biogas economics. 1. Manufacturing and production cost of biogas 2. Storage and distribution cost related to biogas 3. Governmental Taxes
Usage of biogas as road transport fuel proved to be more expensive in France and Sweden. Infrastructure, maintenance costs are similar to that of CNG. Vehicles using CNG as fuel are more expensive than other vehicles.
4
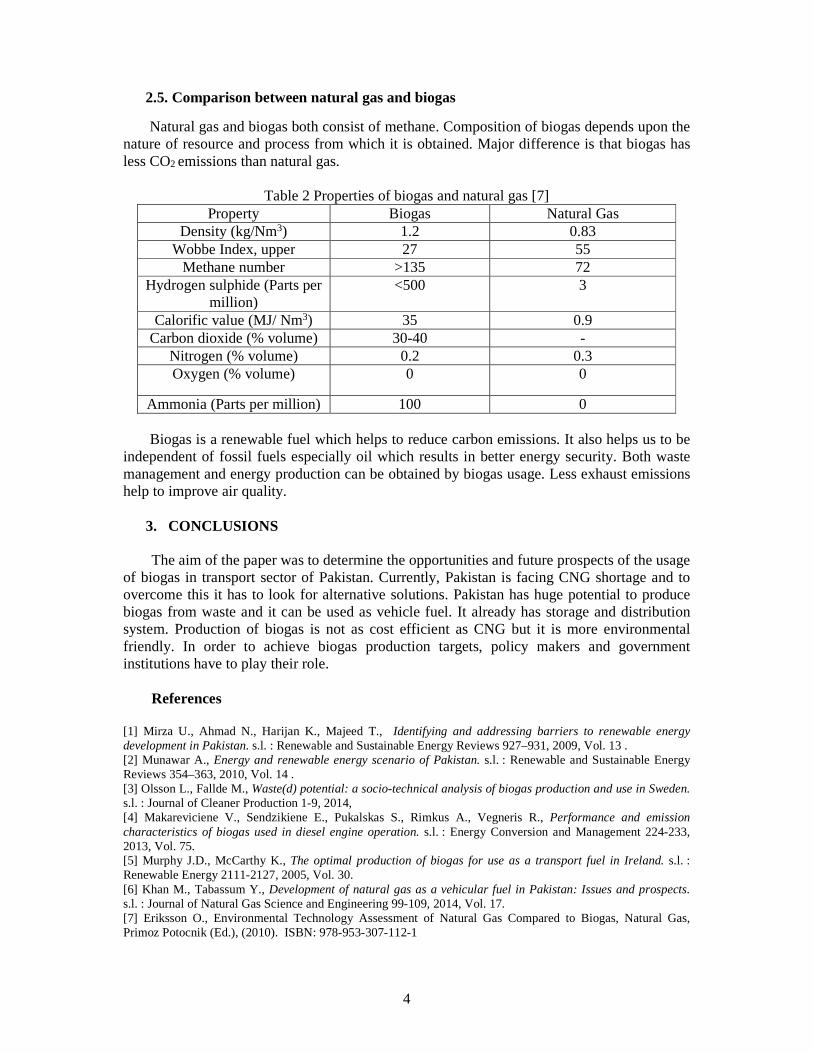
2.5. Comparison between natural gas and biogas
Natural gas and biogas both consist of methane. Composition of biogas depends upon the nature of resource and process from which it is obtained. Major difference is that biogas has less CO2 emissions than natural gas.
Table 2 Properties of biogas and natural gas [7] Property Biogas Natural Gas
Density (kg/Nm3) 1.2 0.83 Wobbe Index, upper 27 55
Methane number >135 72 Hydrogen sulphide (Parts per
million) <500 3
Calorific value (MJ/ Nm3) 35 0.9 Carbon dioxide (% volume) 30-40 -
Nitrogen (% volume) 0.2 0.3 Oxygen (% volume) 0 0
Ammonia (Parts per million) 100 0
Biogas is a renewable fuel which helps to reduce carbon emissions. It also helps us to be independent of fossil fuels especially oil which results in better energy security. Both waste management and energy production can be obtained by biogas usage. Less exhaust emissions help to improve air quality.
3. CONCLUSIONS
The aim of the paper was to determine the opportunities and future prospects of the usage of biogas in transport sector of Pakistan. Currently, Pakistan is facing CNG shortage and to overcome this it has to look for alternative solutions. Pakistan has huge potential to produce biogas from waste and it can be used as vehicle fuel. It already has storage and distribution system. Production of biogas is not as cost efficient as CNG but it is more environmental friendly. In order to achieve biogas production targets, policy makers and government institutions have to play their role. References [1] Mirza U., Ahmad N., Harijan K., Majeed T., Identifying and addressing barriers to renewable energy development in Pakistan. s.l. : Renewable and Sustainable Energy Reviews 927–931, 2009, Vol. 13 . [2] Munawar A., Energy and renewable energy scenario of Pakistan. s.l. : Renewable and Sustainable Energy Reviews 354–363, 2010, Vol. 14 . [3] Olsson L., Fallde M., Waste(d) potential: a socio-technical analysis of biogas production and use in Sweden. s.l. : Journal of Cleaner Production 1-9, 2014, [4] Makareviciene V., Sendzikiene E., Pukalskas S., Rimkus A., Vegneris R., Performance and emission characteristics of biogas used in diesel engine operation. s.l. : Energy Conversion and Management 224-233, 2013, Vol. 75. [5] Murphy J.D., McCarthy K., The optimal production of biogas for use as a transport fuel in Ireland. s.l. : Renewable Energy 2111-2127, 2005, Vol. 30. [6] Khan M., Tabassum Y., Development of natural gas as a vehicular fuel in Pakistan: Issues and prospects. s.l. : Journal of Natural Gas Science and Engineering 99-109, 2014, Vol. 17. [7] Eriksson O., Environmental Technology Assessment of Natural Gas Compared to Biogas, Natural Gas, Primoz Potocnik (Ed.), (2010). ISBN: 978-953-307-112-1
5
PRIMARY RESOURCES OF ENERGY
Marin BICĂa , Marius Sorin SOFRONIEb Corina DanaCERNĂIANU c
, Daniel MUSCALAGIUd
1University of Craiova, Faculty of Mechanics, Calea Bucuresti,107, Romania a [email protected], [email protected], [email protected]
ABSTRACT
The paper presented is a bibliographical study of primary energy resources and global trends in this area. The increase of the oil prices caused a special attention to the burning installation of solid fuels and the production of energy from renewable sources. The use of solid fuels in power plants is treated with interest by all countries.
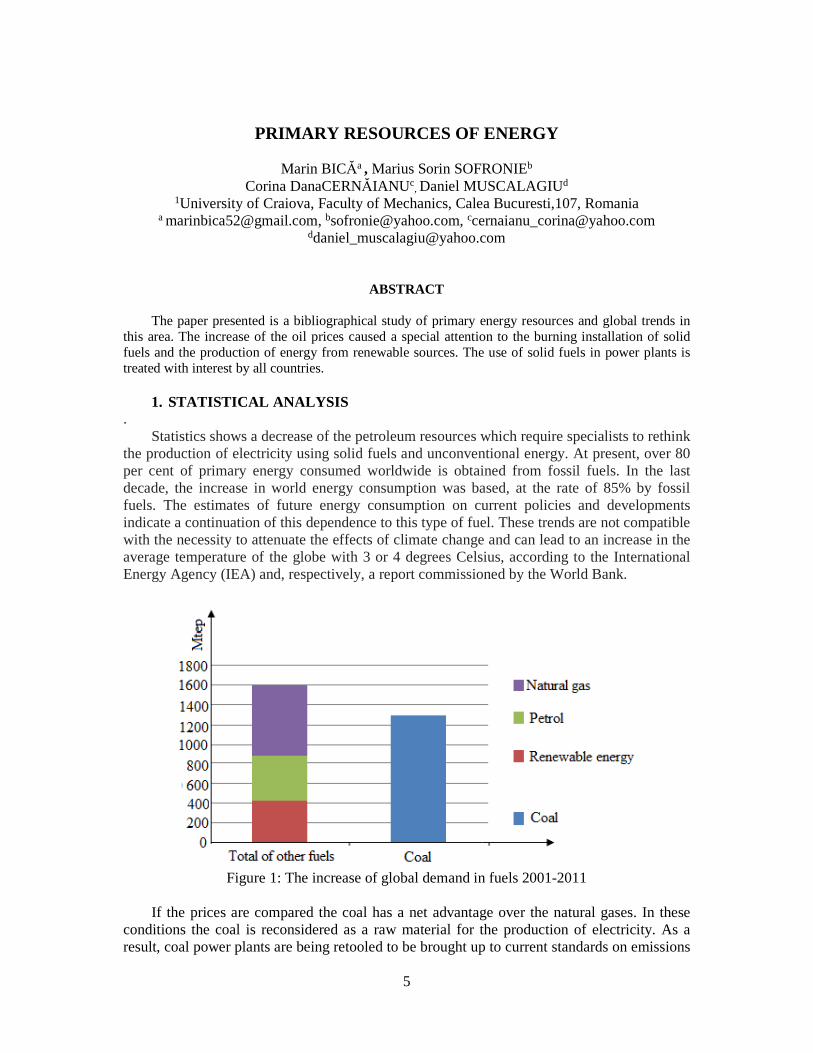
1. STATISTICAL ANALYSIS . Statistics shows a decrease of the petroleum resources which require specialists to rethink the production of electricity using solid fuels and unconventional energy. At present, over 80 per cent of primary energy consumed worldwide is obtained from fossil fuels. In the last decade, the increase in world energy consumption was based, at the rate of 85% by fossil fuels. The estimates of future energy consumption on current policies and developments indicate a continuation of this dependence to this type of fuel. These trends are not compatible with the necessity to attenuate the effects of climate change and can lead to an increase in the average temperature of the globe with 3 or 4 degrees Celsius, according to the International Energy Agency (IEA) and, respectively, a report commissioned by the World Bank.
Figure 1: The increase of global demand in fuels 2001-2011
If the prices are compared the coal has a net advantage over the natural gases. In these conditions the coal is reconsidered as a raw material for the production of electricity. As a result, coal power plants are being retooled to be brought up to current standards on emissions
6
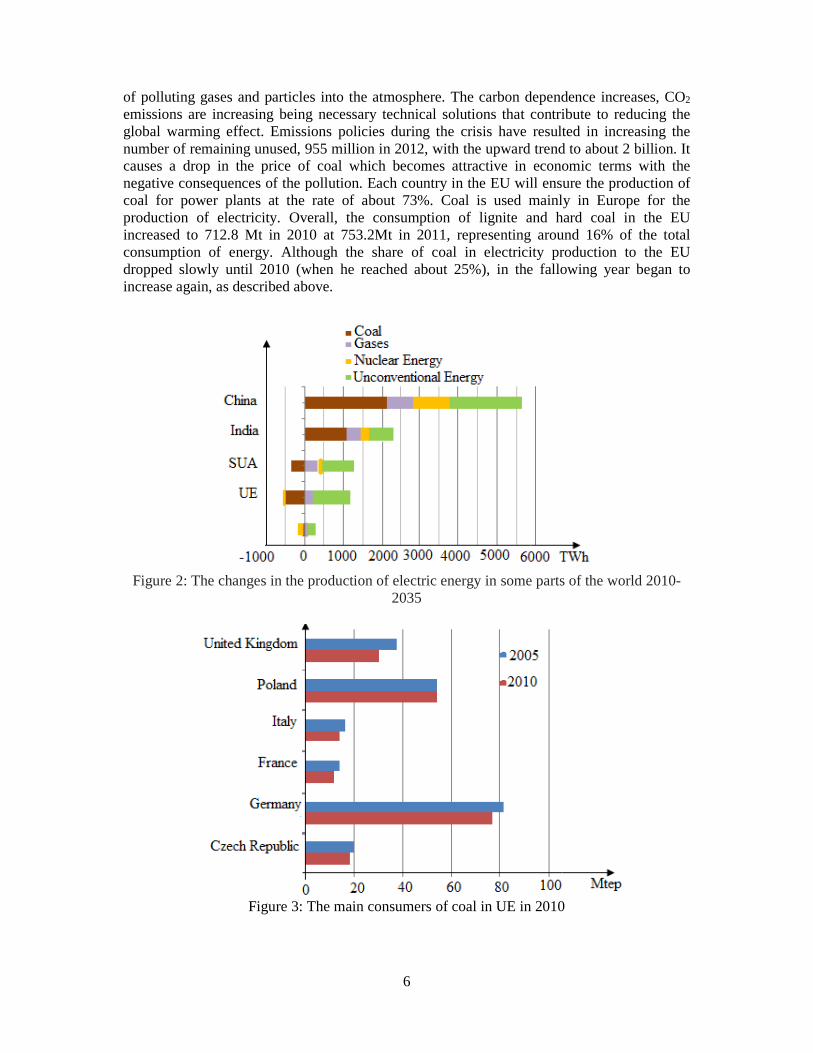
of polluting gases and particles into the atmosphere. The carbon dependence increases, CO2 emissions are increasing being necessary technical solutions that contribute to reducing the global warming effect. Emissions policies during the crisis have resulted in increasing the number of remaining unused, 955 million in 2012, with the upward trend to about 2 billion. It causes a drop in the price of coal which becomes attractive in economic terms with the negative consequences of the pollution. Each country in the EU will ensure the production of coal for power plants at the rate of about 73%. Coal is used mainly in Europe for the production of electricity. Overall, the consumption of lignite and hard coal in the EU increased to 712.8 Mt in 2010 at 753.2Mt in 2011, representing around 16% of the total consumption of energy. Although the share of coal in electricity production to the EU dropped slowly until 2010 (when he reached about 25%), in the fallowing year began to increase again, as described above.
Figure 2: The changes in the production of electric energy in some parts of the world 2010-
2035
Figure 3: The main consumers of coal in UE in 2010

7
In Europe there are significant regional differences. While the share of coal in energy production in some member states (for example, Sweden, France, Spain and Italy) are well below 20%, other member states such as Poland (88%), Greece (56%), Czech Republic (56%), Denmark (49%), Bulgaria (49%), Germany (42%) and the United Kingdom (28%), is based largely on coal. The yield increase in combustion plants necessitated the design of new processes, particularly in the case of coal. The fluidized bed combustion has proved his efficiency and with small amounts of particulate matter. For high-capacity energy installations the burning of solid fuels is realized in pulverized state.
2. PRIMARY ENERGY RESOURCES The deficit of primary energy in the global energy balance has imposed the burning of
solid waste resulting from industrial or technological processes in agriculture. The main types of waste that can be used for energy purposes or for heating can be categorized as follows:
- Combustible wood waste. These waste results from the exploitation of forestry, different kind of sawmill and furniture. They are used in particular for heating of houses in the countryside while being a source of fires:
- Combustible vegetal waste. Are obtained from the processing of plants grown from what is called big culture: straw, corn cob, remnants of sunflower, waste from the processing of sugar cane. These wastes have a high moisture content (40 ...60) %. If the temperature in the heating stove is high at the burn of straws occurs large desposits on the surfaces of heat exchangers. Burning the vegetal waste must be avoided on crop fields for several reasons:
- the air pollution due to the resulted smoke - the impoverishment of the soil in-organic matter; - earthworms and other soil creatures are destroyed - the water is evaporated from the upper layer of the soil and through cracks resulted the
depth water is lost. - the arable land is harder to cultivate and the fuel consumption increases. - Waste from the industry. These materials come from hemp, flax, cotton and leather. It
has been observed from these wastes special problems regarding burning due to diffusion of oxygen on difficult surfaces.
- Combustible waste from chemical processes. These are obtained from the processing of crude oil in order to obtain superior fuel.
- petroleum coke characterized by low volatile matter and moisture. The absence of volatile materials generates problems to ignition.
- celolignina is a powdery waste obtained from the extraction of furfulol from vegetal products (seed husks, corn). These waste have a good behavior in burning but the ash has tendency of slug and the burning gases contain compounds that adheres to the heat exchange surfaces.
- Household waste. These waste results in significant quantities, especially in the city. The preparation for burning often involves briquetting and selecting on categories of materials (paper, plastics, e.g.). They have a high content of ash with characteristics very different due to varied composition of these types of wastes.
Negative impacts on the environment should not be attributed only to fuel-burning process. As well as these other polluting industries are radioactive materials, other non-metallic substances, minerals and rocks. The exploitation of non-renewable or renewable resources or lead to unpredictable developments with consequences difficult to removed.
The highest consumption of primary energy resource is recorded from coal. In 2011, the highest coal consumption was registered in China-1,839 billion tons of oil equivalent (tons),

8
USA-501.9 million toe and India-295.6 million tons. In the European Union consumption was 285,9 million tons and represented 7.7% of world consumption.
Table 1: Production of coal in the world
Operation expressed in thousands of tones
Nr. Country 1970 1980 1990 2000 2004
1. Germany 406.034 387.930 356.524 167.724 181.926
2. USA 5.963 42.300 82.608 77.620 75.750
3. Greece 8.703 23.207 49.909 63.948 71.237
4. Russia 128.100 141.500 138.500 86.200 70.300
5. Australia 25.648 32.895 47.725 67.363 66.343
6. Poland 36.118 36.866 67.584 59.505 61.198
7. China 16.960 26.288 44.520 42.774 50.000
8. Czech Republic 84.894 90.145 80.205 51.063 48.290
9. Turkey 4.400 16.967 46.892 61.315 43.754
10. Serbia 18.341 27.921 45.376 34.037 35.620
11. India 3.908 4.548 14.110 22.947 30.341
12. Romania 15.575 28.128 34.897 26.882 28.648
13. Bulgaria 31.806 29.946 31.532 26.183 26.455
14. Thailand 441 1.427 12.421 17.714 20.060
15. Hungary 26.102 22.636 15.842 13.532 12.730
16. Canada 3.919 5.971 9.407 11.190 11.600
17. Bosnia 7.340 11.174 18.160 7.441 9.000
18. Macedonia 4.940 7.519 6.640 7.516 8.500
19. Spain 3.121 15.390 20.870 8.524 8.147
20. North Korea 5.700 10.000 12.500 6.500 6.500
21. Austria 4.045 2.865 2.448 1.255 235
... World 869.626 1.080.335 1.153.970 877.417 915.789

9
Table 2: The classification of coal in Romania Class Group
Peat -
Brown coal
Brown coal earthy
Brown coal woody Lignite
Mat Brown coal
Brown coal with gloss
Brown coal -
Coal (H)
Coal with long flame
Coal gas
Fat coal
Coal coke
Coal lean
Anthracite coal
Anthracite -
3. OBJECTIVES The general objectives of the researches in energy resources consist in: - research on the physical properties of the fuels and energy characteristics; - research on the processes of combustion and flame propagation; In addition to the objectives mentioned the aim is to develop and implement an experimental base to meet the requirements imposed by the regulations in the field of combustion of solid fuels. Given the new european approach, which imposes stringent rules on emissions of pollutants is necessary the modification of the conception regarding the design, verification and monitoring in exploitation of energy and combustion installations of low power. At the same time, the paper proposes the realization of analyses of the cases when fire are generated, the propagation mode, the thermodynamic study, considering the blaze as a complex process of combustion, with indeterminate growth, and other phenomena including physical, chemical, biological (heat transfer, the exchange of gases with the environment, the formation of flames, structural transformations). The energy sector, which uses solid fuel, has to be a dynamic sector, actively to support the economic development of the country, for the purpose of reducing gaps regarding the European Union. In this way, the general objective of the energy sector is to meet the energy needs both in present and for medium term and long at a low price appropriate to a modern market economy and a standard of civilized life, in terms of quality, food safety, while respecting the principles of sustainable development. The main direction of action of energy policy of Romania converging with those of the European Union’s energy policy is: - the increase of safety in energy supply. - the increase of energy efficiency.

10
- the achievement of the objectives of protecting the environment and reducing CO2 emissions; Considering these main directions of action, the objectives of the development of the energy sector in Romania, are: - the improvement of energy efficiency throughout the production chain:-resources-transport-distribution-consumption; - reducing the negative impact of the energy sector on the environment.
4. SPECIFIC MEASURES IN THE FIELD OF ENERGY The energy production will follow a process of restructuring and renewal of energy capacities through the rehabilitation of existing viable units, closing non-viable units and the construction of new production capacities. The investment effort will be supported mainly by privatization. In order to ensure balanced energy productions, priority will be given to investments in units of energy production that uses: - renewable sources of energy; - charcoal by clean technologies; - nuclear energy technologies through secure and with low environmental impact. - the use of wood for heating in households; - use plant debris.
5. CONCLUSION Research conducted in the field of production, transport and consumption of energy are focused on new energy sources, renewable sources, reducing the quantities of triatomic gases emitted into the atmosphere. The development of energy consumption determined the return to the production of coal-based energy. References [1] Comisia europeana pentru energie, Bruxelles 2013. [2] Eurostat, Comisia Europeană. [3] AIE, World Energy Outlook 2012. [4] Barbu, I. ș.a. A doua tinerețe a cărbunilor, Editura Albatros, București, 1986. [5] Bejan M., Rusu T. (2007), O sursa de energie regenerabila – biogazul din deșeurile organice, Buletin AGIR nr. 1, ianuarie-martie, pp. 13-19.
11
EXPERIMENTAL RESEARCH ON THE COMBUSTION OF THE GASES IN LOW-POWER BURNERS
Marin BICĂa , Marius Sorin SOFRONIEb ,
Corina Dana CERNĂIANU c, Daniel MUSCALAGIUd
1University of Craiova, Faculty of Mechanics, Calea Bucuresti,107, Romania a [email protected], [email protected], [email protected]
ABSTRACT
Gaseous fuels have a physical-chemical characteristic, which recommends them for use in medical applications, research labs, but also in the industrial field. The present paper aims to highlight the advantages of using gaseous fuels, especially in small power plants, but also issues which arise with regard to the burning with stable flame. We propose to analyze burners used in low-power applications with the possibility to ease the ignition and stabilizing combustion. Gases used in combustion plants have chemical compositions specific to each area, which involves different burning speeds and propagation of the flame. Adjusting these installations must be made in such a way to not cause the interruption of the flame.
1. PHYSICAL-CHEMICAL CHARACTERISTICS OF GASEOUS FUELS The composition of these fuels is different from area to area. In all situations they contain combustible gases, nitrogen and oxygen in small or very small proportion and other gases. In Romania methane (CH4), is found in higher proportion in the composition of combustible gas. The composition of a fuel gas is expressed in percentages and is reported to the anhydrous state: COanh + CO2
anh + H2anh + H2Sanh + CH4
anh + ΣCmHnanh + O2
anh + N2anh + .... = 100% (1)
In combustion plants the gaseous fuel is used to the flow through the pipeline. The calculation of the burn is made at wet condition, written in the form: COi +CO2
i + H2i + H2Si + CH4
i + ΣCmHni + O2
i + N2i + wt
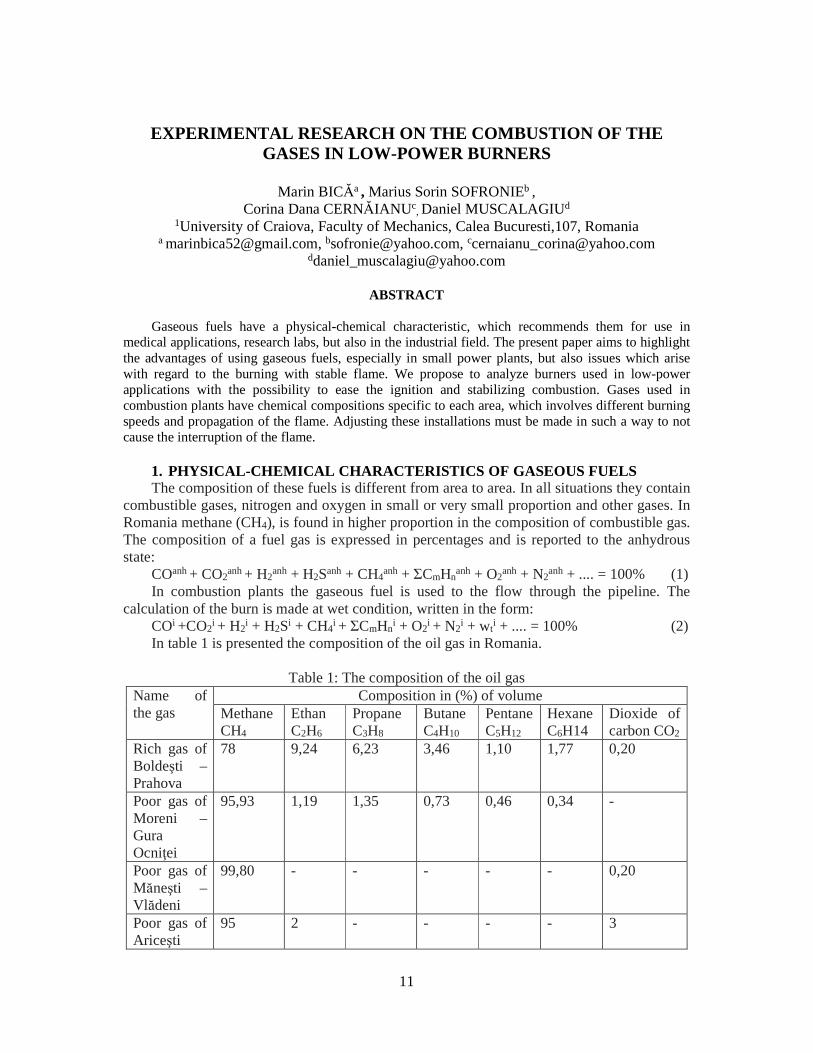
i + .... = 100% (2) In table 1 is presented the composition of the oil gas in Romania.
Table 1: The composition of the oil gas Name of the gas
Composition in (%) of volume Methane CH4
Ethan C2H6
Propane C3H8
Butane C4H10
Pentane C5H12
Hexane C6H14
Dioxide of carbon CO2
Rich gas of Boldeşti – Prahova
78 9,24 6,23 3,46 1,10 1,77 0,20
Poor gas of Moreni – Gura Ocniţei
95,93 1,19 1,35 0,73 0,46 0,34 -
Poor gas of Măneşti – Vlădeni
99,80 - - - - - 0,20
Poor gas of Ariceşti
95 2 - - - - 3
12
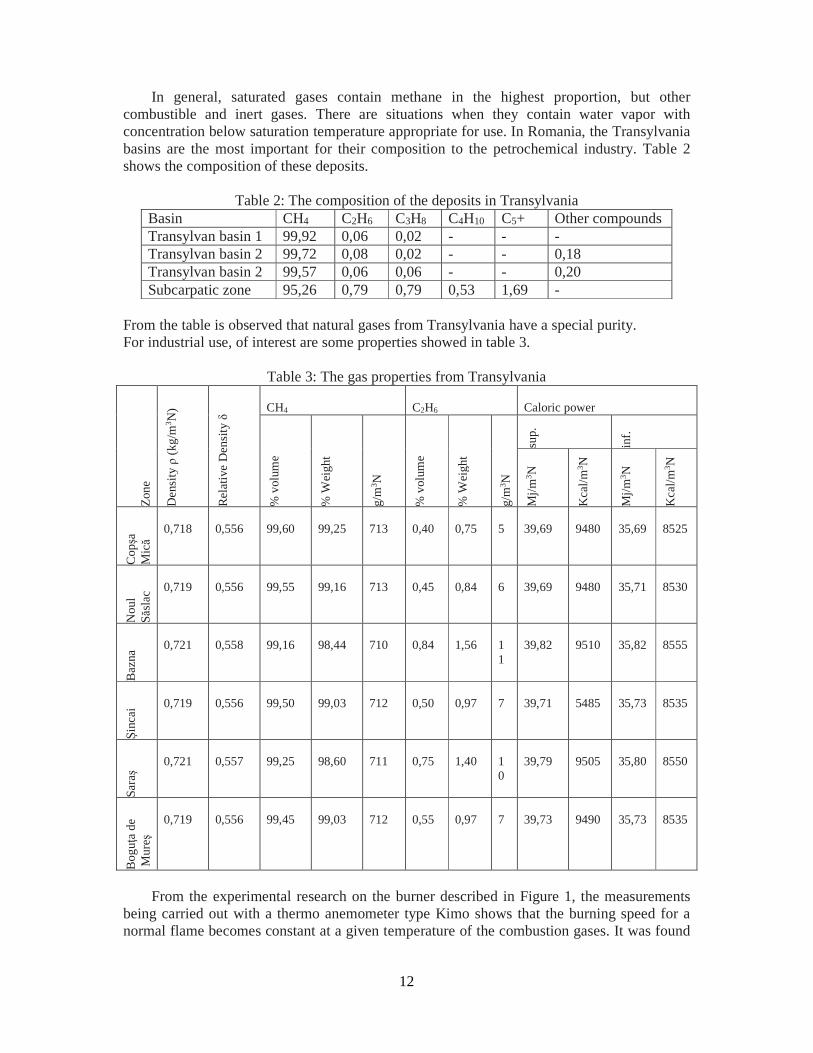
In general, saturated gases contain methane in the highest proportion, but other combustible and inert gases. There are situations when they contain water vapor with concentration below saturation temperature appropriate for use. In Romania, the Transylvania basins are the most important for their composition to the petrochemical industry. Table 2 shows the composition of these deposits.
Table 2: The composition of the deposits in Transylvania Basin CH4 C2H6 C3H8 C4H10 C5+ Other compounds Transylvan basin 1 99,92 0,06 0,02 - - - Transylvan basin 2 99,72 0,08 0,02 - - 0,18 Transylvan basin 2 99,57 0,06 0,06 - - 0,20 Subcarpatic zone 95,26 0,79 0,79 0,53 1,69 -
From the table is observed that natural gases from Transylvania have a special purity. For industrial use, of interest are some properties showed in table 3.
Table 3: The gas properties from Transylvania
Zon
e
De
nsity
ρ (k
g/m
3 N)
Re
lativ
e D
ens
ity δ
CH4
C2H6
Caloric power
% v
olum
e
% W
eigh
t
g/m
3 N
% v
olum
e
% W
eigh
t
g/m
3 N
sup.
inf.
Mj/m
3 N
Kca
l/m3 N
Mj/m
3 N
Kca
l/m3 N
Copşa
M
ică
0,718
0,556
99,60
99,25
713
0,40
0,75
5
39,69
9480
35,69
8525
Nou
l Să
sla
c
0,719
0,556
99,55
99,16
713
0,45
0,84
6
39,69
9480
35,71
8530
Ba
zna
0,721
0,558
99,16
98,44
710
0,84
1,56
11
39,82
9510
35,82
8555
Şin
cai
0,719
0,556
99,50
99,03
712
0,50
0,97
7
39,71
5485
35,73
8535
Sa
raş
0,721
0,557
99,25
98,60
711
0,75
1,40
10
39,79
9505
35,80
8550
Bog
uţa
de
Mur
eş
0,719
0,556
99,45
99,03
712
0,55
0,97
7
39,73
9490
35,73
8535
From the experimental research on the burner described in Figure 1, the measurements being carried out with a thermo anemometer type Kimo shows that the burning speed for a normal flame becomes constant at a given temperature of the combustion gases. It was found

13
that the temperature of the combustion gases increases in a transitional regime by order of seconds (from laboratory determinations about 30 seconds)
Figure 1: The burner used tor experimental determination
Table 4: The limits of ignition
Fuel Symbol
The minimum concentration of ignition [%] volume of gas in oxygen
Stoichiometric blend
Blend in which the speed of the flame is maximum
The minimum concentration of ignition [%] volume of gas in oxygen
min max [%] vol. gas
un [cm/s]
[%] vol. gas
un max, [cm/s]
min max
Hydrogen H2 4 74.2 29.5 160 42 267 4.65 93.9
Carbon oxide
CO 12.5 74.2 29.5 30 43 42 15.5 93.9
Methane CH4 5 15 9.5 28 10.5 37 5.4 59.2 Ethan C2H6 3.22 12.45 5.64 - 6.3 40 4.1 50.5 Propane C3H8 2.37 9.5 4.02 - 4.3 38 2.3 55 Butane C4H10 1.86 8.41 3.12 - 3.3 37 1.8 49 Pentane C5H12 1.4 7.8 2.55 - 2.92 38.5 - - Hexane C6H14 1.25 6.9 2.16 - 2.52 38.5 - - Heptane C7H16 1.00 6.0 1.87 - - - - - Octane C8H18 0.95 - 1.65 - - - - - Ethylene C2H4 3.75 29.6 6.5 50 7 63 2.9 79.9 Acetylene C2H2 2.5 80 7.7 100 10 135 3.5 89.4 Benzene C6H6 1.41 6.75 2.71 - 3.34 40.7 2.6 30 Methyl alcohol
CH3OH 6.72 36.5 12.44 - - - - -
Ethyl Alcohol
C2H5OH
3.28 18.95 6.52 - - - - -
Carbon sulphur
CS 1.25 50 6.52 - 8.2 48.5 - -
Water gas 6.0 70 - - - - - - Coke gas 5.6 28-30.8 - - - - - - Natural gas 5.1 12.1-25 - - - - - - Furnace gas 35 65-73.9 - - - - - -
14
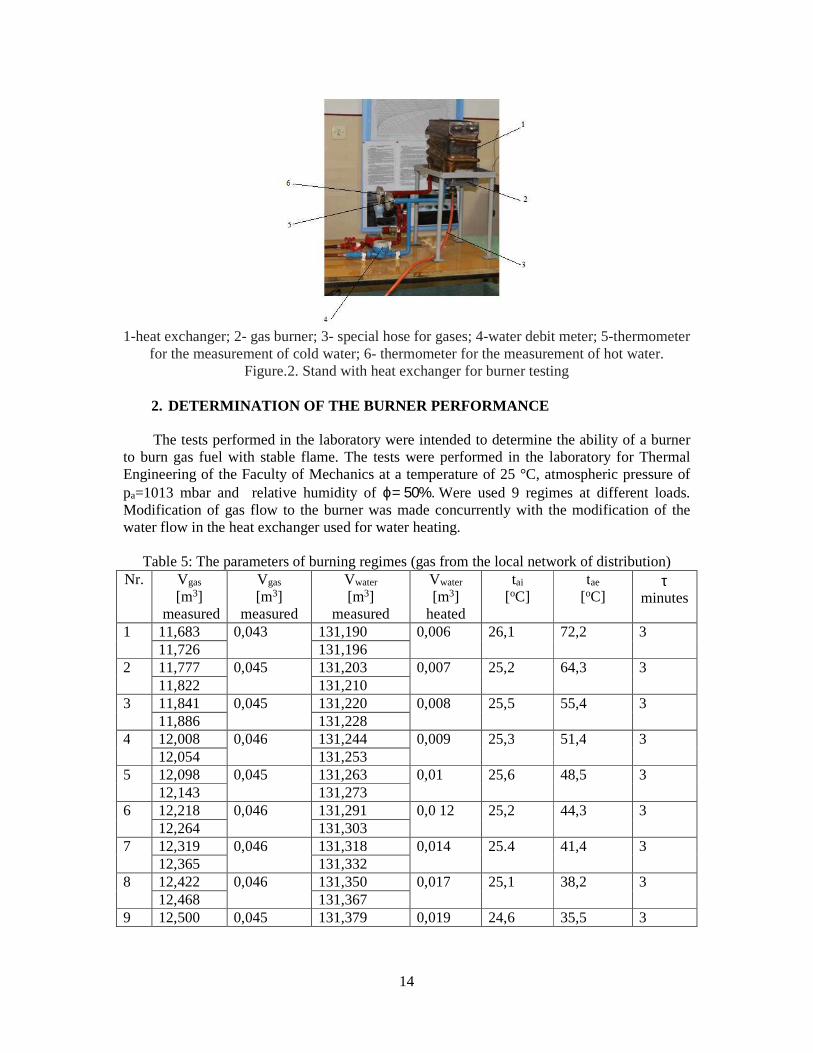
1-heat exchanger; 2- gas burner; 3- special hose for gases; 4-water debit meter; 5-thermometer
for the measurement of cold water; 6- thermometer for the measurement of hot water. Figure.2. Stand with heat exchanger for burner testing
2. DETERMINATION OF THE BURNER PERFORMANCE
The tests performed in the laboratory were intended to determine the ability of a burner to burn gas fuel with stable flame. The tests were performed in the laboratory for Thermal Engineering of the Faculty of Mechanics at a temperature of 25 °C, atmospheric pressure of pa=1013 mbar and relative humidity of ϕ= 50%. Were used 9 regimes at different loads. Modification of gas flow to the burner was made concurrently with the modification of the water flow in the heat exchanger used for water heating.
Table 5: The parameters of burning regimes (gas from the local network of distribution) Nr. Vgas
[m3] measured
Vgas
[m3] measured
Vwater
[m3] measured
Vwater
[m3] heated
tai
[oC] tae
[oC] τ
minutes
1 11,683 0,043 131,190 0,006 26,1 72,2 3 11,726 131,196
2 11,777 0,045 131,203 0,007 25,2 64,3 3 11,822 131,210
3 11,841 0,045 131,220 0,008 25,5 55,4 3 11,886 131,228
4 12,008 0,046 131,244 0,009 25,3 51,4 3 12,054 131,253
5 12,098 0,045 131,263 0,01 25,6 48,5 3 12,143 131,273
6 12,218 0,046 131,291 0,0 12 25,2 44,3 3 12,264 131,303
7 12,319 0,046 131,318 0,014 25.4 41,4 3 12,365 131,332
8 12,422 0,046 131,350 0,017 25,1 38,2 3 12,468 131,367
9 12,500 0,045 131,379 0,019 24,6 35,5 3

15
The flame was stable during experimental determinations. The stand used is presented in figure 2. For the combustion process in the mixture must be a minimum concentration of oxygen and the temperature to be higher than the temperature of oxidation for the reaction to start. During the test these conditions are met because the burn is atmospheric and the temperature of the front flame measured is greater than that required to start combustion. For the flame to not interrupt the gas flow the speed of gas is adjusted in such a way that the gas flow velocity is equal to the speed of propagation of the flame front. The concentration limits of ignition for different gases are presented in table 4. The values refer to the atmospheric pressure and a temperature of 20 ° C. For the burner tested measurements were carried out for gases from the local network of distribution and gases obtained from a gas cylinder fueled at a station with GPL alimentation. For this type of burner, with multiple slits, used in low-power heating plants of family type shows a bigger yield to the burn of liquefied gas and this performance is due to the liquid gas qualities, the lack of impurities, and a higher calorific value.
Table 6: The parameters of burning regimes. Liquefied gas (Cylinder stove) Nr. Vgas
[m3] measured
Vgas
[m3] consumed
Vwater
[m3] measured
Vwater
[m3] heated
tai
[oC] tae
[oC] τ
minutes
1 12.632 0,050 132,342 0,0082 21 68,2 3 12.682 132,350
2 12,720 0,052 133,411 0,007 22 72,3 3 12,772 133,418
3 12,775 0,053 133,622 0,006 23 75,1 3 12,828 133,628
4 12,311 0,047 133,802 0,006 21 67,4 3 12,358 133,808
5 12,911 0,043 133,902 0,0092 22 47,5 3 12,954 133,9112
6 12,962 0,046 133,950 0,0 11 22 51,2 3 13,008 133,961
7 13,121 0,048 133,982 0,012 21 49,3 3 13,169 133.994
8 13,172 0,051 134,012 0,013 22 43,6 3 13,223 134.025
9 13,228 0,049 134,500 0,007 23 58,7 3 13,277 134,507
The heat lost in the surrounding atmosphere has a significant share in the total efficiency of the installation. To limit these losses the inside of the heat exchanger was shielded.
Table 7: The parameters of burning regimes (gas from the local network of distribution) Nr. Vgas
[m3] measured
Vgas
[m3] consumed
Vwater
[m3] measured
Vwater
[m3] heated
tai
[oC] tae
[oC] τ
minutes
1 13,412 0,062 134,600 0,008 22,5 72,2 3 13,474 134,608
2 13,480 0,065 134,700 0,0084 23,2 75,1 3 13,545 134,784

16
3 13,560 0,053 134,800 0,0086 24,1 71,4 3 13,613 134,086
4 13,650 0,059 134,900 0,0079 22,6 71,4 3 13,709 134,9079
5 13,750 0,062 134,910 0,009 23,2 69,2 3 13,812 134,919
6 13,815 0,054 134,920 0,011 22,4 62,5 3 13,869 134,931
7 13,870 0,063 134,940 0,012 21,3 57,3 3 13,933 134,952
8 13,950 0,055 134,960 0,013 23,2 52,4 3 14,005 134,973
9 14,010 0,058 134,980 0,007 23,4 73,2 3 Obtaining very good performance of this type of burner has been reduced by difficulties in adjusting the gas flows for a stable burn. The apparition of the lateral flame is explained by an uneven distribution of gas in the burner.
Figure 3 The apparition of the carburate flame and the interruption of the flame
At the increase of the flow the interruption trend appears to the flame. At the power installations for heating the gas flow is adjusting in combustion regimes. In the laboratory we forced the limits of normal combustion to obtain these undesirable regimes. From the observation of several power installations of low power results that each type has a predefined normal regimes, the adjustment being made automatically.
3. CONCLUSIONS The combustion of gaseous fuels requires heightened security measures to prevent the extinguishment or interruption of the flame. The burner studied in laboratory has a good stability of the flame when is fueled with liquefied gas and the gas from distribution network. References [1] Alexandru, D., Nagi, M., Utilizarea gazelor petroliere lichefiate in sisteme autonome ISBN (10) 973-661-933-8, (13)978- 973-661-933-5, Mirton, Timisoara 2006 [2] Iordache, I., Mihăescu, L., Cercetări privind lungimea flăcărilor difuzive de ardere a combustibililor gazoşi în jeturi libere turbulente cu secţiune dreptunghiulară, A V-a Conferinţă Naţională de Echipament Termomecanic Clasic şi Nuclear şi Energetică Urbană şi Rurală,., Bucureşti, 2006, pp. 95-98. [3] Stambuleanu, A., Flacăra Industrială, Editura Tehnică, Bucureşti, 1971. [4] Bică,M., Nagi, M., Cernăianu, C.D., Bara, N., Transfer de căldură, Editura Universitaria, Craiova, 2011.

17
HEAT MEASURE UNIT FOR CETRALIZED HEAT SUPPLY OF DIRECT SUBSCRIBER STATIONS
Valentin Bobilov1, Pencho Zlatev1, Zhivko Kolev1, Plamen Mushakov1
University of Ruse
ABSTRACT
This article provides an analysis of heat consumption of University of Ruse at different regimes of operation including work and holyday time and the increase of energy consumption as result of adding new energy efficient buildings. It was found that the temperature schedule of distribution network differs from standardized and established a possible reason for this discrepancy. Identification of possibilities to improve the accuracy of measuring of the heat energy consumption was done and proposed new scheme of central heat measuring unit. The new scheme of central heat measuring unit will make it possible to control the mixing ratio and to maintain adequate parameters of the heat transfer medium for the direct connection scheme
1. INTRODUCTION Aim of this report is study the possibility of using direct heating substations in centralized district network at University of Ruse. Changing the type of substations implies the compilation of statistics of the parameters of the heat carrier in the external heat transmission network under various operating conditions and ambient temperatures including both periods of full load of buildings and periods in which buildings are used only partially. The report presents statistics on the thermal power in Ruse University for the past four heating seasons. Also has been analyzed heat consumption at University when connected to a distribution network of new buildings. An analysis of data from instrumentation and measures have been outlined for improving the accuracy when measuring the consumed thermal energy. The heating of the university includes 20 separate buildings with a total heating area of 45607m2. Campus has a heat transmission network in impassable collectors as individual buildings are connected differently. There are buildings in which heating is a direct and indirect type of such heating substations with fast water heaters and several new buildings with plate heat exchangers.
2. METHODOLOGY 2.1. Statistics of heat meter readings Compile statistics of the meter readings cover a period of four years from the beginning
of the heating season in 2010. By the end of the heating season in 2014, the total number of the data amounts to 377 as the period during which the measurements were performed is different. Weekdays measurements were performed every day at 09:00 am and at weekends Saturday and Sunday measurements were not performed, and then the amount of the energy consumed covers a period of three days from Friday to Monday at 9:00 am
Measurements of heat consumption are carried out in the beginning of the campus heat networks by using heat meter Kamstrup [1], which is a device for commercial accounting of the thermal energy and is owned by the University.
Besides readings of the consumed thermal energy measurements were carried out of the pressure and temperature of the heat carrier in the transmission network as well as meteorological data were collected on campus using a Davis Weather Station Model Vantage 2 Pro Plus

18
The main weather information is speed and wind direction, minimum, maximum and average daily temperature and quantity of solar energy on a horizontal surface.
The results with the ambient temperatures and the temperature of the heat carrier in transmission network are shown in Figure 1. for each heating season.
-20
0
20
40
60
80
100
02.
11.
201
0
16.
11.
201
0
30.
11.
201
0
14.
12.
201
0
28.
12.
201
0
11.
01.
201
1
25.
01.
201
1
08.
02.
201
1
22.
02.
201
1
08.
03.
201
1
22.
03.
201
1
T1 (°C)
T2 (°C)
Air temperature -average (°C)
Air temperature -minimum (°C)
Air temperature -maximum (°C)
Heating season 2010/2011
-30
-10
10
30
50
70
90
110
03.11.2011
24.11.2011
15.12.2011
05.01.2012
26.01.2012
16.02.2012
08.03.2012
T1 (°C)
T2 (°C)
Air temperature -average (°C)
Air temperature -minimum (°C)
Air temperature -maximum (°C)
Heating season 2011/2012
-20
0
20
40
60
80
100
12.
11.
201
2
26.
11.
201
2
10.
12.
201
2
24.
12.
201
2
07.
01.
201
3
21.
01.
201
3
04.
02.
201
3
18.
02.
201
3
04.
03.
201
3
18.
03.
201
3
01.
04.
201
3
T1 (°C)
T2 (°C)
Air temperature -average (°C)
Air temperature -minimum (°C)
Air temperature -maximum (°C)
Heating season 2012/2013
-20
0
20
40
60
80
100
18.11.2013
02.12.2013
16.12.2013
30.12.2013
13.01.2014
27.01.2014
10.02.2014
24.02.2014
10.03.2014
24.03.2014
T1 (°C)
T2 (°C)
Air temperature -average (°C)
Air temperature -minimum (°C)
Air temperature -maximum (°C)
Heating season 2013/2014
Figure 1: Statistics of temperatures
In Figure 1 with T1 is represented heat carrier temperature in the supply pipe of the network and with T2 is represented the temperature of the return heat carrier pipe. Statistics of heat consumption over the last four years are shown in Figure 2.
0
50
100
150
200
250
300
350
2.11.2010 2.11.2011 2.11.2012 2.11.2013
MW
h
Date
Energy, MWh
Figure 2: Statistics of energy consumption for heating
Summary data for the heat consumption during the last four heating seasons are presented in Table 1.
Table 1 Summary data for heating seasons Heating season Duration, Days Energy for the period,
MWh Heating degree-days at 12.0°C
2010/2011 150 5017.3 1322.05 2011/2012 152 6508.5 1700.82 202/2013 151 5131.38 1242.52 2013/2014 145 5426.4 1130.45
2.2. Analysis of experimental data From the data for the change in temperature of the heat carrier and the environment
during the heating season is apparent that the temperature of the heat carrier in the supply heat

19
pipeline varying from 70 ° C to 100 ° C depending on the climate outside temperature. The change in temperature of the heat carrier in the return pipeline varying from 40 °C to 70 °C.
Standardized scheduling of the heat carrier temperature in the district network for Ruse is 120 °/70 °C [2]. The change of the temperature of the hot heat transfer medium should be in the range from 120 ° C to 70 ° C depending on the climatic conditions and the change of the temperature of the cold heat transfer medium should be in the range from 70 ° C to 40 ° C.
Therefore, the temperature schedule of transmission network in the city does not meet the standard. Possible reason for this is outdated heat transmission network and in order to reduce accidents in the expansion joints is reduced medium temperature. Covering the heating load is done by increasing the volume flow of the heat transfer medium.
Heat consumed by the group of buildings is calculated by month and then is determined the average thermal power of the complex.
The average thermal power of the buildings as a function of the average temperature of the environment is shown in Figure 3
0
0.5
1
1.5
2
2.5
3
-6 -4 -2 0 2 4 6 8 10 12 14 16 18 20
Hea
ting
pow
er Q
, MW
Ambient air temperature ta, °C
2010/20112011/20122012/20132013/2014Linear 2010/2011Linear (2011/2012)Linear 2012/2013Linear (2013/2014)
Figure 3 Average heating power
It has been done a regression analysis of the average thermal power of the buildings over the years. The regression equations are shown in Table 2.
The data shows that during the heating season 2011/2012 and in 2012/2013 slope of the straight line decreases due to the commissioning of the new building with high energy efficiency. During the heating season 2013/2014 was put into operation another such building as seen from the slope of the strait line.
Logically connection of new buildings to the district network leads to increased energy consumption. Dissipated the less heating degree-days during the heating season 2013/2014 compared to the previous season.
Table 2 Linear regression of heating power Heating period Equation R-squared value 2010/2014 Q=-0.111*ta+1.9336 R2=0.9254 2010/2011 Q=-0.1346*ta+1.9113 R2=0.9365 2011/2012 Q=-0.1058*ta+1.9415 R2=0.8947 2012/2013 Q=-0.1066*ta+1.9797 R2=0.9752 2013/2014 Q=-0.101*ta+2.0726 R2=0.8652
2.3. Identify possibilities to improve accuracy of measuring of the heat energy consumption In some of the buildings attempts have been made using hybrid heating substations /
combination of the direct and indirect substation/ and the results are optimistic. The remaining heating substations are based on outdated indirect water heaters "pipe in
pipe" or plate heat exchangers, Bulgarian production that are morally and physically outdated. Also in the most of substation is missing equipment and measurement systems.
20
Possible measures to improve the accuracy of the measured amount of heating energy are:
• Construction of a monitoring system which covers all buildings irrespective of the manner their connection to the district heating network;
• Installation of second flow meter in the heat measure unit at entrance of University district heating network and connecting of present heat meter and new flow meter with monitoring system;
• Reconstruction of old substations including replacement of the heating equipment and allows for connection of the building to the district heating network in direct scheme.
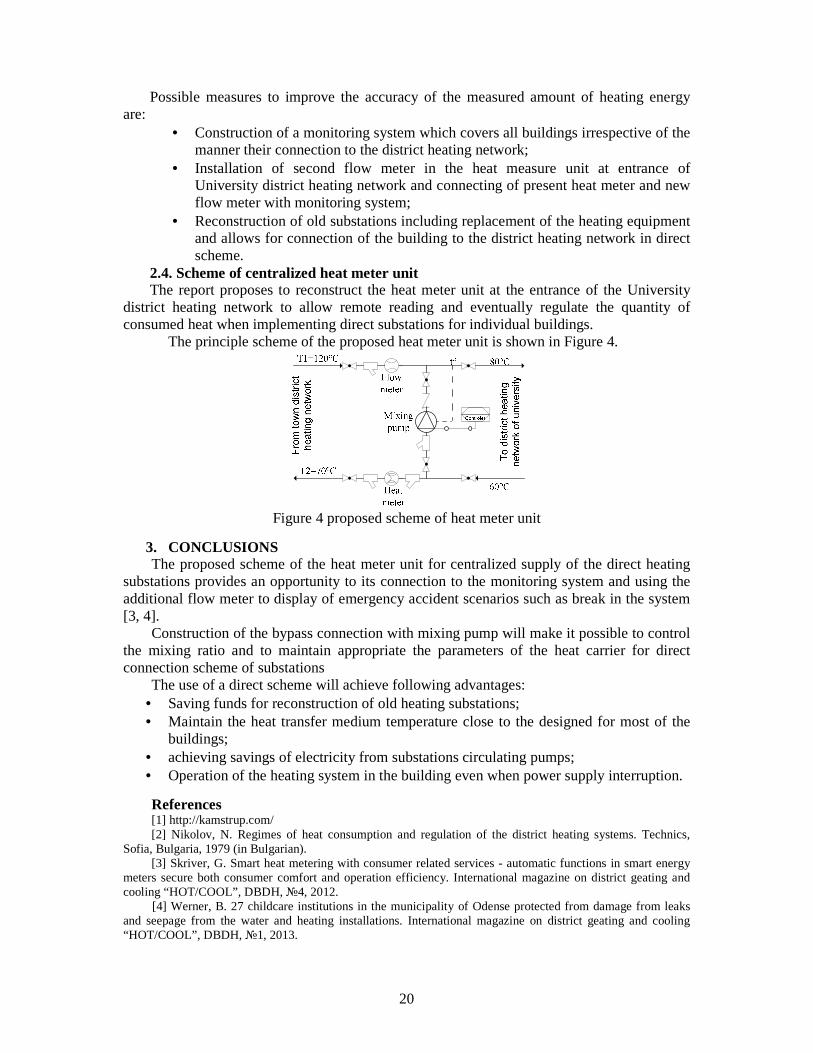
2.4. Scheme of centralized heat meter unit The report proposes to reconstruct the heat meter unit at the entrance of the University
district heating network to allow remote reading and eventually regulate the quantity of consumed heat when implementing direct substations for individual buildings.
The principle scheme of the proposed heat meter unit is shown in Figure 4.
Figure 4 proposed scheme of heat meter unit
3. CONCLUSIONS The proposed scheme of the heat meter unit for centralized supply of the direct heating substations provides an opportunity to its connection to the monitoring system and using the additional flow meter to display of emergency accident scenarios such as break in the system [3, 4]. Construction of the bypass connection with mixing pump will make it possible to control the mixing ratio and to maintain appropriate the parameters of the heat carrier for direct connection scheme of substations The use of a direct scheme will achieve following advantages:
• Saving funds for reconstruction of old heating substations; • Maintain the heat transfer medium temperature close to the designed for most of the
buildings; • achieving savings of electricity from substations circulating pumps; • Operation of the heating system in the building even when power supply interruption.
References [1] http://kamstrup.com/ [2] Nikolov, N. Regimes of heat consumption and regulation of the district heating systems. Technics, Sofia, Bulgaria, 1979 (in Bulgarian). [3] Skriver, G. Smart heat metering with consumer related services - automatic functions in smart energy meters secure both consumer comfort and operation efficiency. International magazine on district geating and cooling “HOT/COOL”, DBDH, №4, 2012.
[4] Werner, B. 27 childcare institutions in the municipality of Odense protected from damage from leaks and seepage from the water and heating installations. International magazine on district geating and cooling “HOT/COOL”, DBDH, №1, 2013.

21
INCREASING THE ENERGY EFFICIENCY OF THERMAL POWER PLANT
Valentin Bobilov1, Veselka Kamburova2, Zhivko Kolev1, Pencho Zlatev1, Plamen Mushakov1
1Department of Thermotechnics, Hydraulics and Ecology, University of Ruse, Ruse 7017, Bulgaria
2University of Ruse - Branch Razgrad, Razgrad 7200, Bulgaria
ABSTRACT The purpose of the work is to analyze the activities taken to increase the energy efficiency of the Thermal Power Plant which is a part of the overall Sugar Plants facility located in the industrial zone of the city of Gorna Oriahovitsa, Bulgaria.
1. INTRODUCTION The Thermal Power Plant (TPP) is a part of the overall Sugar Plants facility located in the industrial zone of the city of Gorna Oriahovitsa [2, 4, 5]. TPP has been constructed for the combined production of electric and thermal energy.
The thermal energy sent to the steam turbine installation has been divided in two components: - thermal energy to consumers; - thermal energy for electric energy production. To increase the energy efficiency of TPP the following reconstructions have been carried out: - one of the steam turbines has been replaced in the scheme; - heat exchanger station in TPP has been built; - heat supply system for overheated water steam has been replaced with such for hot water.
2. METHODOLOGY
2.1. DESCRIPTION AND ENERGY BALANCE OF TPP The total area of the plant is 11,500 m2. The TPP includes four steam boilers - two
Russian made BKZ-75-39 boilers produced by the Barnaul boiler works, one PK–35-39 boiler and one КМ-12 both of Bulgarian origin produced by the G. Kirkov boiler works in Sofia. The two BKZ-75-39 boilers and the PK–35-39 boiler are coal fired and the KM-12 boiler is heavy fuel oil fired.
The combined cycle has been realized with backpressure turbines. The technological structure of the TPP at Sugar Plants is centralized: all steam generators send steam to a single collector, which in its turn distributes it and sends it to the steam turbines.
Three independent branches of the heat supply system structurally form the steam transfer network of the company have served the main technologic capacities – the Sugar Refinery, the Ethanol Factory and the Confectionery Plant. The basic branch has been Branch №2, which has served the units TPP – Repair-Mechanical Works – Sugar Refinery – 1 Department of Thermotechnics, Hydraulics and Ecology, University of Ruse, “Studentska” St., 7017 Ruse, Bulgaria, +359 82 888 304, [email protected]
22
Administration (Company Management) – Greenhouse. This branch is subject to the present research. Branch №2 has been fed with heat carrier from collector 0.6 MPa of the TPP.
During 2004 (the last year before the made reconstructions) TPP has produced 236,571 tons of steam, which has been distributed as follows:
- steam from the TPP 160,218 tons; - auxiliary needs of the TPP 76,353 tons; - steam passed through turbines 207,678 tons; - steam from steam reducing and cooling unit 28,893 tons. The total heat production of TPP Sugar Plants for 2004 year has been177,507 MWh,
which has been distributed for: - electricity production 19,041 MWh; - heating purposes of TPP and losses 32,790 MWh; - consumers of heat energy 125,675 MWh. The thermal energy balance of the TPP has been made in accordance with the structural
equation 1 [1, 3]. QTPP = PEL + PMT + PG + QBPT+ QRD + Qpl + ∆QSG, (1) where: QTPP is total thermal consumption of the power plant, MWh;
PEL - produced electric energy from the generators, MWh; PMT - mechanical losses of the turbine, MWh; PG - generator losses, MWh; QBPT - heat from the backpressure turbine; QRD - heat from the steam pressure reducing device; Qpl - losses in pipelines; ∆QSG - losses in the steam generator. In the concrete case the components of equation (1) for 2004 had the following values: QTPP = 177,507 MWh; PEL = 9,265 MWh; PMT + PG = 32,790 MWh; QBPT + QRD = 125,676 MWh; ∆QSG = 52,675 MWh. 2.2. DESCRIPTION OF THE SYSTEM – AN OBJECT OF RESEARCH In figure 1 a principal scheme of the system from TPP which has been an object of
research is shown. As is shown in the principal scheme, the steam turbine 1 has worked with backpressure 8 ÷ 13 bar. In this case, the thermal energy required for heating, ventilation and domestic hot water (DHW) to the consumers included in the heat supply system Branch № 2 has been provided from overheated water steam.

23
GeneratorSteam
Generator
(Boiler)
Reduction
Unit
Turbine-1
Steam
Preheater
Economizer
Condensate
Heater High
Pressure
Deaerator
Regenerative
Heat Exchanger
Medium Pressure
Ste
am
Co
nsu
me
rs
an
d
He
at
En
erg
y f
or
He
ati
ng
, V
en
tila
tio
n
an
d D
HW
fro
m H
ea
t Su
pp
ly N
etw
ork
(fo
r o
ve
rhe
ate
d s
tea
m)
“Bra
nch
-2”
Regenerative
Heat Exchanger
Low Pressure
8 ÷
13
ba
r
Own needs of TPP
Figure 1: Principal scheme of the system from TPP - an object of reconstructions
The heat balance for 2004 of the overheated steam consumers, connected to Branch №2 is presented in тable 1.
Table 1: Energy balance of the heating capacities of the consumers connected to Branch №2
№
Heating Ventilation DHW Total- t/h t/h t/h t/h
1 Thermal Power Plant 798 112 726 1,6362 Repair Mechanical Factory-RMF 1,815 173 294 2,2823 Sugar Plant 3,436 98 980 4,5145 Block№6 (Institute for sugar production) 845 0 251 1,0964 Administrative building (Company management) 747 0 225 9726 Block №15 394 0 133 5277 Block №16 233 0 74 3078 Block №9 184 0 55 2399 Block №10 184 0 55 23910 Greenhouse 429 0 0 429
Total for branch №2: 9,065 383 2,793 12,241
Heating capacity of the branch №2 (calculation regime)The name of the consumer
The specific characteristics of the heat supply system of Branch №2 have been as
follows: A. The steam line has been designed for heating capacities considerably exceeding the
present needs. This fact has led to occurring of two serious issues related to decrease of the heat carrier flow rate and change in the degree of the simultaneous exploitation of the consumers. The effect from this is negative and regarded the following:
A.1. reduction of the steam velocity, which leaded to increase of the steam line heat losses;
24
A.2. the transportation in saturated state required a compulsory blow-down of the pipe network, which leaded to additional energy losses of heat and condensate;
A.3. in order to reduce the length of the heat network sections, working at regime of saturated water steam, the TPP has forced to enhance the temperature of the output overheated water steam from a collector of 0.6 MPa, which has reflected negatively on the electricity production and on the total heat losses from the heat feeding system.
B. Condensate from the consumers, included in the studied Branch №2 has not returned. This peculiarity has formed the substantial part of the energy inefficiency of the existing heat supply system.
C. The general state of the heat insulation of the steam line, especially in the section between the Sugar Refinery and the Administration has been unsatisfactory. The state of the underground sections, between Administrative building and the connected to it end consumers – units No. 6, 15, 16, 9, 10 and Greenhouse, has been similar.
D. The pipelines and the supporting elements of the pipelines have required additional investments for preventive maintenance and repair.
E. The steam line has been type III category in accordance with the Ordinance №15 and has been subject to technical supervision.
As is seen from the listed disadvantages of heat supply system Branch №2, there has been an objective need to change the scheme in accordance to increase the energy efficiency of TPP.
2.3. RECONSTRUTIONS IN THE SCHEME IN ACCORDANCE TO INCREASE THE
ENERGY EFFICIENCY OF TPP To increase the energy efficiency of TPP in accordance with the listed disadvantages of
heat supply system Branch №2 the following reconstructions in the scheme have been proposed and implemented:
► The steam turbine 1 has been replaced in the scheme with a steam turbine 2 which has two adjustable steam extractions (one for overheated steam at a pressure of 8 ÷ 13 bar and one for saturated steam at a pressure of 1.2 ÷ 2.5 bar). Thus, on the one hand achieves an increase in the quantity of electricity output from the turbine with the same amount of steam supplied from the steam generators (turbine 2 has a bigger work surface). On the other hand concerning the reduction of thermal energy consumption for heating, ventilation and DHW it enables this heat to be provided from steam to a lower pressure (1.2 ÷ 2.5 bar).
► In order to reduce the heat losses from the transportation of the heat energy required for heating, ventilation and DHW, a Heat Exchanger Station in the TPP has been built.
► The heat supply system Branch №2 has been reconstructed from heat supply system for overheated steam (p = 5 bar, t = 240 °C) in heat supply system of hot water (t = 95/70 °C), supplied by the built Heat Exchanger Station.
In figure 2 a principal scheme of the reconstructed system is shown.

25
Figure 2: Principal scheme of the reconstructed system 2.4. RESULTS FROM THE MADE RECONSTRUTIONS Table 2 shows a comparative analysis of the annual energy losses for one calendar year of
the steam heat transfer network and the hot water transfer network of Branch №2 as a result of the made reconstructions in the scheme. The parameters have been estimated on the base of the individual network subbranches’ characteristics and the working regime of the heat energy consumers.
Table 2: Energy losses before and after replacement of the heat supply network
Summer regime
Winter regime
Total Dimension
Heat transfer losses 1,174 1,492 2,666 MWh/yrWarming losses 101 MWh/yrBlow down losses 476 605 1,081 MWh/yrLosses from nonreturn condensate 537 2,305 2,842MWh/yrTotal annual losses before reconstruction 6,690 MWh/yr
Heat transfer losses 285 362 646MWh/yrElectricity consumption for pumps 163 207 371 MWh/yrTotal annual losses after reconstruction 1,017 MWh/yr
Losses
The results in table 2 shows that the reconstruction of the heat supply system Branch-2 leads to significant reduce of the energy losses and this is a reason for increasing of the TPP energy efficiency.
26
3. CONCLUSION The new technical solution – replacement of the heat network from overheated steam to
hot water 95/70°С has leaded to the following results: � the expenses from not returned condensate have been eliminated; � the losses from heating up and blow through of the pipes have been eliminated; � the heat losses from the steam transfer have been reduced significantly; � new opportunities have appeared for more efficient regulation of the heat power of
the consumers, this has leaded to additional energy savings; � the generated by the TPP electricity has increased due to the replacement of the steam
turbine; � increased operational reliability of the heat supply system; � the category of the heat supply network has changed from ІІІ to ІV according to
Ordinance №15, which allows the supervision to be performed by company or authorised person. References [1] Simões-Moreira, J. Fundamentals of Thermodynamics Applied to Thermal Power Plants. http://www.springer.com/978-1-4471-2308-8. [2] www.chambersz.org [3] www.iipnetwork.org [4] www.zaharnizavodi.com [5] www05.abb.com

27
SOME ASPECTS OF CYCLE VARIABILITY AT AN LPG FUELLED DIESEL ENGINE
Alexandru Cernat1, Constantin Pana, Niculae Negurescu
University Politehnica of Bucharest
ABSTRACT Liquid Petroleum Gas fuel can be a viable fuel due to its ability of diesel emissions and fuel consumption reduction. Its special physic-chemical properties, which make is suitable for spark ignition engines, lead to specific aspects of the in-cylinder combustion and engine mechanical running for diesel engines. The main aspects of LPG combustion variability in the diesel engine are analysed from the point of view of maximum pressure rate, maximum pressure timing, maximum heat release rate, following the criteria of reduction of combustion variability in terms of indicated main effective pressure and maximum pressure. Comparative to the classic diesel engine fuelled only with diesel fuel, the cycle variability increases for dual fuelling. The cycle variability is influenced in a direct way by the increase of LPG cycle dose which will lead to the increasing of the cycle variability coefficients values, maximum pressure, maximum pressure rate, heat release rate and cycle angle points of burn mass fractions. The calculated values of these parameters are bigger comparative to the normal values of diesel engines, but don’t exceed the maximum admitted values that provide engine reliability. From the analysis of COV values of the engine parameters, the maximum admitted values of LPG cycle dosage are also established.
1. INTRODUCTION Nowadays, Liquid Petroleum Gas is a worldwide alternative fuel used on a large scale for internal combustion engines. The mixture forming, the heat release, the energetically and pollution performance of the engine are influenced by different vaporization and burning properties of the LPG comparative to diesel fuel. Higher combustion rate of air-LPG mixtures leads to the increase of maximum pressure and maximum pressure rate rise, with consequences on cycle variability. Thus, the maximum LPG cycle quantity admitted inside the cylinder can be limited for efficiency, mechanical reliability, noise, smooth running reasons. The higher auto ignition temperature of the LPG, in the field of 481...544°C versus 225°C for diesel fuel, can allow the use of excessive values for the compression ratio and may required the use of additives for CN improvement or of the diesel fuel pilot injection for air-LPG mixture ignition. The use of LPG at diesel engine, operating on diesel cycle, will required the use of diesel fuel pilot for LPG ignition. LPG raised vapour pressure assures forming of air-LPG mixtures of higher homogeneity. Higher octane number (ON propane = 111, ON n-butane = 102 and ON i-butane = 94), a burning laminar velocity comparable with the one of gasoline (0.46 m/s) [1], [2] makes the LPG a suitable fuel for SI engines. Starting the combustion into a relative lean high homogeneity air-LPG mixture influences the combustion process and cycle variability. Also, wide inflamabillity limits of the liquid petroleum gas 2,1…10,4 % versus 0,6 … 5,5 % for diesel fuel, smaller combustion temperature and the its lower carbon content will influence the combustion cycle variability and may lead to an improvement of the combustion process and of the pollutant emissions, [1], [2], [3], [5], [6]. The cycle variability for air-LPG mixtures is analyzed comparative to diesel fuel fuelling for a 1,5 litre direct injection supercharged engine, type K9K from Dacia Logan. _____________________________
University Politehnica of Bucharest, Splaiul Independentei no. 313, 0723470021, [email protected]
28
The engine is fuelled with diesel fuel and liquid petroleum gas by diesel gas method, the LPG cycle dose is injected inside the inlet manifold and electronic controlled by a secondary ECU connected with the main engine ECU.
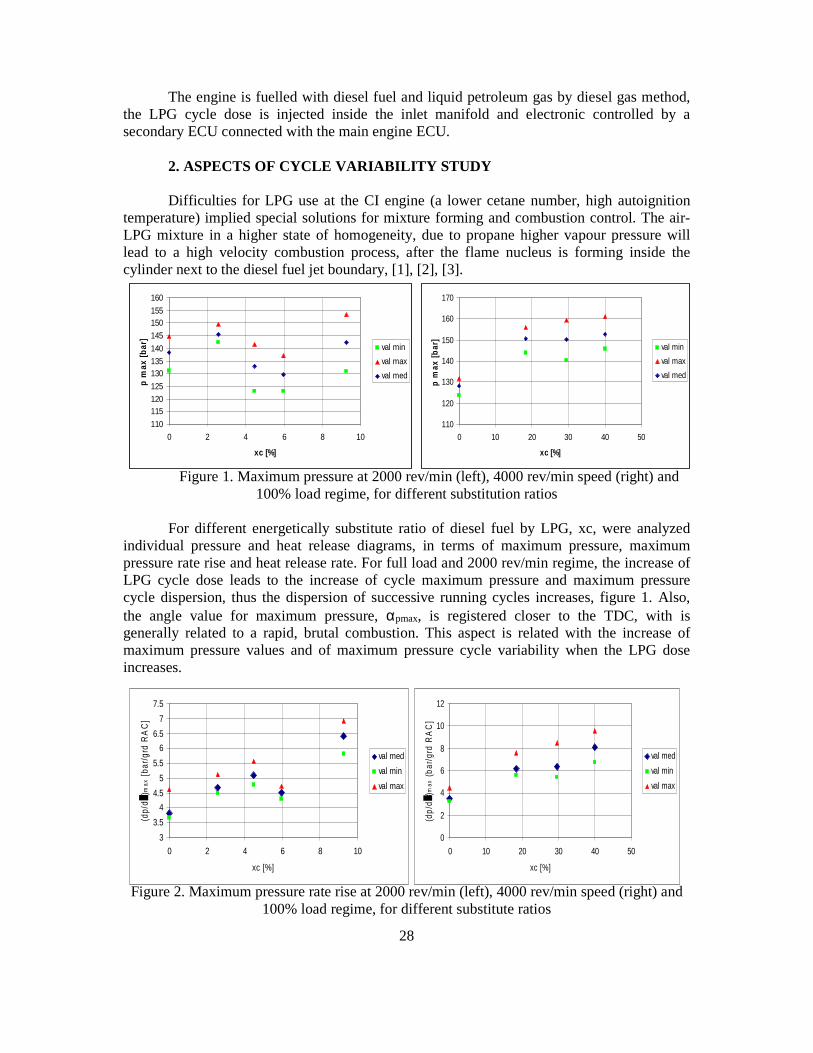
2. ASPECTS OF CYCLE VARIABILITY STUDY Difficulties for LPG use at the CI engine (a lower cetane number, high autoignition temperature) implied special solutions for mixture forming and combustion control. The air-LPG mixture in a higher state of homogeneity, due to propane higher vapour pressure will lead to a high velocity combustion process, after the flame nucleus is forming inside the cylinder next to the diesel fuel jet boundary, [1], [2], [3].
Figure 1. Maximum pressure at 2000 rev/min (left), 4000 rev/min speed (right) and 100% load regime, for different substitution ratios
For different energetically substitute ratio of diesel fuel by LPG, xc, were analyzed
individual pressure and heat release diagrams, in terms of maximum pressure, maximum pressure rate rise and heat release rate. For full load and 2000 rev/min regime, the increase of LPG cycle dose leads to the increase of cycle maximum pressure and maximum pressure cycle dispersion, thus the dispersion of successive running cycles increases, figure 1. Also, the angle value for maximum pressure, αpmax, is registered closer to the TDC, with is generally related to a rapid, brutal combustion. This aspect is related with the increase of maximum pressure values and of maximum pressure cycle variability when the LPG dose increases.
Figure 2. Maximum pressure rate rise at 2000 rev/min (left), 4000 rev/min speed (right) and 100% load regime, for different substitute ratios
110
115120
125
130135
140
145
150155
160
0 2 4 6 8 10
xc [%]
p m
ax [
bar
]
val min
val max
val med
110
120
130
140
150
160
170
0 10 20 30 40 50
xc [%]
p m
ax [
bar
]
val min
val max
val med
3
3.5
4
4.5
5
5.5
6
6.5
7
7.5
0 2 4 6 8 10
xc [%]
(dp/
d)m
ax [
bar/
grd
RA
C]
val med
val min
val max
0
2
4
6
8
10
12
0 10 20 30 40 50
xc [%]
(dp/
d)m
ax (
bar/
grd
RA
C]
val med
val min
val max
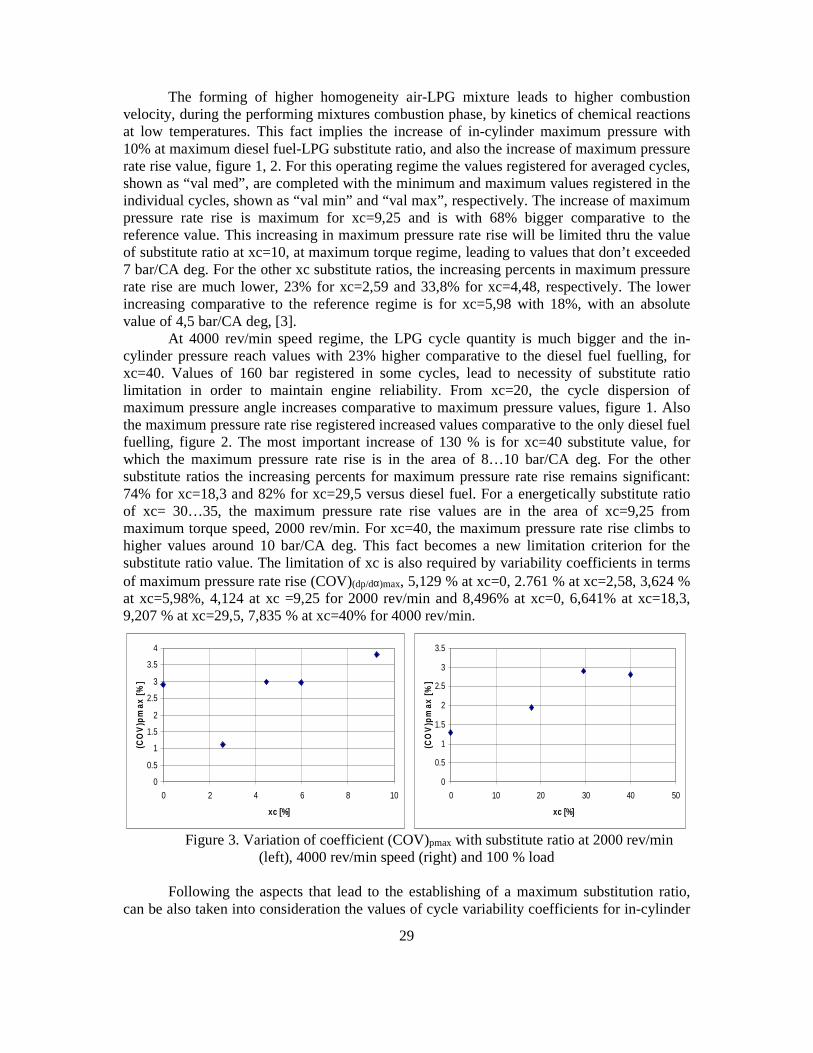
29
The forming of higher homogeneity air-LPG mixture leads to higher combustion velocity, during the performing mixtures combustion phase, by kinetics of chemical reactions at low temperatures. This fact implies the increase of in-cylinder maximum pressure with 10% at maximum diesel fuel-LPG substitute ratio, and also the increase of maximum pressure rate rise value, figure 1, 2. For this operating regime the values registered for averaged cycles, shown as “val med”, are completed with the minimum and maximum values registered in the individual cycles, shown as “val min” and “val max”, respectively. The increase of maximum pressure rate rise is maximum for xc=9,25 and is with 68% bigger comparative to the reference value. This increasing in maximum pressure rate rise will be limited thru the value of substitute ratio at xc=10, at maximum torque regime, leading to values that don’t exceeded 7 bar/CA deg. For the other xc substitute ratios, the increasing percents in maximum pressure rate rise are much lower, 23% for xc=2,59 and 33,8% for xc=4,48, respectively. The lower increasing comparative to the reference regime is for xc=5,98 with 18%, with an absolute value of 4,5 bar/CA deg, [3].
At 4000 rev/min speed regime, the LPG cycle quantity is much bigger and the in-cylinder pressure reach values with 23% higher comparative to the diesel fuel fuelling, for xc=40. Values of 160 bar registered in some cycles, lead to necessity of substitute ratio limitation in order to maintain engine reliability. From xc=20, the cycle dispersion of maximum pressure angle increases comparative to maximum pressure values, figure 1. Also the maximum pressure rate rise registered increased values comparative to the only diesel fuel fuelling, figure 2. The most important increase of 130 % is for xc=40 substitute value, for which the maximum pressure rate rise is in the area of 8…10 bar/CA deg. For the other substitute ratios the increasing percents for maximum pressure rate rise remains significant: 74% for xc=18,3 and 82% for xc=29,5 versus diesel fuel. For a energetically substitute ratio of xc= 30…35, the maximum pressure rate rise values are in the area of xc=9,25 from maximum torque speed, 2000 rev/min. For xc=40, the maximum pressure rate rise climbs to higher values around 10 bar/CA deg. This fact becomes a new limitation criterion for the substitute ratio value. The limitation of xc is also required by variability coefficients in terms of maximum pressure rate rise (COV)(dp/dα)max, 5,129 % at xc=0, 2.761 % at xc=2,58, 3,624 % at xc=5,98%, 4,124 at xc =9,25 for 2000 rev/min and 8,496% at xc=0, 6,641% at xc=18,3, 9,207 % at xc=29,5, 7,835 % at xc=40% for 4000 rev/min.
Figure 3. Variation of coefficient (COV)pmax with substitute ratio at 2000 rev/min (left), 4000 rev/min speed (right) and 100 % load
Following the aspects that lead to the establishing of a maximum substitution ratio,
can be also taken into consideration the values of cycle variability coefficients for in-cylinder
0
0.5
1
1.5
2
2.5
3
3.5
4
0 2 4 6 8 10
xc [%]
(CO
V)p
max
[%
]
0
0.5
1
1.5
2
2.5
3
3.5
0 10 20 30 40 50
xc [%]
(CO
V)p
max
[%
]

30
maximum pressure and IMEP, (COV)pmax and (COV)pi, respectively. The cycle variability can be very well appreciated by the values of these two coefficients, and they are related with the engine adaptability for traction. The normal automotive manoeuvrability is assured if (COV)pmax, respectively (COV)pi , don’t exceeded 10 %. [8]. The coefficient (COV)pmax don’t exceed values of 4 % at 2000 rev/min speed and full load, figure 3, being registered a slightly increase of the coefficient value with the LPG dose. At 4000 rev/min speed regime, the higher dose of LPG leads to a much segnificant continuously increase of (COV)pmax. Even the maximum value doesn’t exceed 3%, with no reason for xc limitation, the further increase tendency of (COV)pmax with xc, especially for xc>30%, can be take into consideration, figure 3. For MTB speed regime, IMEP cycle variability (COV)pi is 3 times higher for maximum LPG cycle dose comparative to diesel fuelling, figure 4. From this point of view the substitute ratio limitation at xc = 9.25 % obvious. If is admitted as limit value [(COV)pi ]max = 10 %, a limit value in substitute ratio of xc = 8 % results, [3].
Figure 4. Variation of coefficient (COV)pi with substitute ratio at 2000 rev/min (left), 4000
rev/min speed (right) and 100 % load
For xc=40% the value of coefficient (COV)pi is 14 times bigger comparative to reference value, figure 4. Thus, become necessary the limitation of the LPG dose at 40 % in order to maintain the normal engine running for dual fuelling.
Figure 5. Maximum heat release at 2000 rev/min (left), 4000 rev/min speed (right) and 100 % load
If the admitted limit is [(COV)pi]max = 10 %, then the substitute ratio will be limited to
xc = 25 %. Thus, the maximum pressure and maximum pressure rate rise are limited at pmax =
0
2
4
6
8
10
12
14
0 2 4 6 8 10
xc [%]
CO
V p
i [%
]
0
2
4
6
8
10
12
14
0 10 20 30 40 50
xc [%]
CO
V p
i [%
]
0
50
100
150
200
250
300
350
400
0 2 4 6 8 10
xc [%]
(dξξ ξξ/
d) m
ax [
J/g
rd R
AC
]
val med
val min
val max
20
70
120
170
220
270
320
370
420
0 10 20 30 40 50
xc [%]
(dξξ ξξ/
dαα αα
)max
[J/
grd
RA
C]
val med
val min
val max
31
150 bar and (dp/dα)max = 6 bar/CA deg, respectively. At 4000 rev/min, the significant increase in LPG cycle dose leads to the increasing of in-cylinder maximum pressure rate due to the increase of cycle heat release, seeing that is no variation for the medium values of maximum cycle heat release (dξ/dα)max, in the investigated rage of xc, figure 5. The maximum values of the heat release rate, from the individual cycles, continuously increase. The maximum heat release obtained values are according with the variation of the maximum pressure and with the variation of the maximum pressure rate rise at the same operating regime. The maximum heat release rate diagrams present beside values from the averaged cycles, “val med”, also the minimum and maximum values from the individual cycles, “val min” and “val max”, respectively. The most important increase of 160% is registered for the maximum LPG dose, for the other quantities the increasing percent being 39% at xc=18.3 and 28 % at xc=29.5. Thus, the higher values lead to the limitation of the LPG dose at 40%. The calculated values for maximum heat release rate cycle variability coefficients, (COV)(dξ/dα)max, are 34,1% at xc=0%, 86,22% at xc=2,58, 56,54% at xc=5,98, 52,01% at xc=9,25 for 2000 rev/min and 35,35% at xc=0, 22,85% at xc=18,3, 62,73% at xc=29,5 and 32,66% at xc=40 for 4000 rev/min. The position of the burned mass fractions of 5, 10, 50 and 90% versus TDC is directly influenced by these phenomena’s. For 2000 rev/min, the conventional 5% and 10% of heat release appears much earlier comparative to diesel fuel, for all substitute ratios, in a direct proportional dependence with the increase of LPG dose. The 90% burned mass fraction is archived later on cycle comparative to diesel fuel, because of a lower heat release quantity during the main phase, 50%. The increase tendency of combustion process variability, reflected in the variability of the angles α5, α10 and α50, with the increasing of the LPG cycle dose is also remarked. Thus, only for diesel fuelling the values of the cyclic variability coefficients increases from (COV)α5=28.3 %, (COV)α10=33 %, (COV)α50=30 %, (COV) α90=29.9 %, to values of (COV)α5=49.4 %, (COV)α10 =80 %, (COV)α50 =31.3 %, (COV) α90 =34.7 % for the maximum LPG dose, xc= 9.25, [3]. For 4000 rev/min appear the same phenomena of an earlier release of 5% and 10% of burned mass fraction for dual fuelling. The increasing of LPG dose leads to the acceleration of the heat release during combustion, the acceleration of the combustion process and of the sooner achieving on cycle of the 50% and 90% burned mass fractions, comparative to diesel fuelling. Also the amplification of the combustion cycle variability, explained by α5, α10, α50 angles variability is present when the LPG cycle dose increases. For diesel fuel fuelling the values of coefficient (COV)α5=45.5 %, (COV)α10 =29.5 %, (COV)α50 =4.5 %, (COV) α90 =6.1 %, are much lower comparative to the values registered for diesel fuel -LPG fuelling: (COV)α5=89.5 %, (COV)α10 =64.1 %, (COV)α50 =84.6 %, (COV) α90 =46.8 %, values calculated for maximum LPG dose, xc= 40, [3]. Also this phenomenon is related with a combustion process closer to TDC and leads to the increasing of the maximum pressure rate rise during the combustion process.
3. CONCLUSIONS
The experimental study shows the main characteristics of the engine running for diesel fuel and diesel fuel-LPG fuelling. Thus, the main conclusions can be formulated:
1. The diesel fuel and LPG engine fuelling leads, comparative to classic diesel fuel fuelling to an increase tendency for maximum pressure rate rise (dp/dα)max and cycle variability (COV)pi increasing.

32
2. The diesel fuel substitute ratio by LPG, xc, is limited by the maximum values or by the maximum variation interval of same running characteristic parameters of the engine, as is follows: if the maximum admissible level of the cycle variability is (COV)pi = 10 %, for IMEP, then the substitute ratio will be limited to xc = 8 % for 2000 rev/min and to xc = 25 % at 4000 rev/min, respectively; if the maximum pressure rate rise is limited to the value (dp/dα)max = 8 bar/CA deg, then the LPG substitute ratio will be limited to xc = 10 % at 2000 rev/min and to xc = 40 % at 4000 rev/min, values that will lead to a maximum acceptable in-cylinder pressure level of 160 bar; 3. The partial substitution of diesel fuel by liquid petroleum gas leads to the increasing of the heat release rate during the rapid combustion phase, showed by the raised level of the maximum heat release rate (dξ/dα)max and earlier achievement per engine cycle of 5% and 10% of burn mass fractions from the heat release (decreasing of α5 and α10 angles values). This influence is correlated with the increasing tendency for maximum pressure rate rise values and for in-cylinder maximum pressure values; 4. The partial substitution of the diesel fuel by LPG leads to the increase of cycle variability for the beginning of the combustion process, shown by the variability of the angles α5 and α10 with a direct influence on cycle variability for indicated main effective pressure IMEP, (COV)pi and maximum pressure, (COV)pmax. References [1] Popa M. G., Negurescu N., Pana C., “Motoare Diesel. Procese.” volum I si II, Editura MatrixRom, Bucuresti, 2003. [2] Pana C., Negurescu N., Popa M. G., Cernat A., Experimental Aspects of the Use of LPG at Diesel Engine, Buletinul stiintific UPB, Seria D nr. 1, Bucuresti, 2010. [3] Cernat A., “Contributii la studiul functionarii unui motor diesel la alimentarea cu motorina si gaz petrolier lichefiat” , Universitatea Politehnica Bucuresti, teza de doctorat, Bucuresti, 2010. [4] Negurescu N., Panǎ C., Popa M.G., G.Boboc, Cernat A, “Performance of a Diesel Engine Fueled by LPG,” 5th International Colloquium FUELS 2005”, Technische Akademie Esslingen, Germania, ISBN 3-924813-59-0, pp.143-148, 6 pag. January 12-13, 2005 [5]Pana C., Negurescu N, Popa M.G., Cernat A, Bujgoi Fl, Sistem dual de alimentare cu combustibili alternativi pentru ecologizarea motoarelor diesel de automobil – DGPL, contract de cercetare nr. X2C10, proiect CEEX/2006, 2006-2008 [6] Pană C., Negurescu N., Popa M., G., Boboc G., Cernat A, „Reduction of NOx, Smoke and BSFC in a Diesel Engine Fueled with LPG”, MECCA, Journal of Midle European Construction and Design of Cars, Vol III, No. 4, December 2005, Praha, Czech Republic, ISSN 1214-0821, pp37- 43, 7 pag., ..2005 indexata in baza de date internationala MECCA: http://www.bozek.cvut.cz/mecca/2005/4_05-pana-en.pdf, cod CNCSIS 500) Tomul L (IV), Fasc. 6D, , pp 89-97, 9 [7] Negurescu N., Pana C., Popa M.G., Cernat A., Boboc G., Soare D., „GPL – combustibil alternativ pentru motorul diesel”, ZILELE ACADEMICE TIMISENE, Editia a IX-a, Simpozionul OMUL SI MEDIUL, Editia a IV-a, Politehnica din Timisoara, ISBN973-625-225-6, Editura Politehnica, 2005 [8] Heywood J. B.,” Internal Combustion Engines Fundamentals.” McGraw-Hill Book Company, New York, 1988 [9] Goto S., Lee. D., Wakao Y. Honma H., Moiri M., Akasaka Y., Hashimoto k., Motohashi M., Konno M., Development of an LPG DI Diesel Engine Using Cetane Numbet Enhancing Additives, SAE Paper 1999-01-3602, in Alternative Fuels 1999, SP-1482 [10] Goto S., Shakal J., Daigo H., LPG engine research and development in Japan, Int’l Congress on Transportation Electronics, 1996 [11] Goto S., Lee. D., Shakal J., Harayama H., Honjyo F., Ueno H., Performance and emissions of an LPG lean-burn engine for heavy duty vehicles, SAE Paper 1999-01-1513, 1999 [12] Goto S., Lee. D., Harayama H., Honjyo F., Ueno H., Honma H., Wakan Y., Mori M., Development of LPG SI and CI Engines for Heavy Duty Vehicles, F2000A171, Seoul 2000 FISITA World Automotive Congress, 15-20 iunie 2000, Seul, Coreea
33
HOT AIR DISTRIBUTION THROUGH MAIN BUSTLE PIPE ON THE TUYERES OF A BLAST FURNACE
Eugen Dimofte1, Florin Popescu, Ion V. Ion
“Dunărea de Jos” University of Galati
ABSTRACT The paper consists in the numerical modelling of the hot air distribution in the tuyeres based on the air flow intake into the main bustle pipe of a blast furnace. As a result of the analysis, the minimum hot blast air flow can be determined that must enter the main bustle pipe in order to ensure a uniform distribution of the air in each tuyere. Key words: Numerical modelling, discretization web, main bustle pipe, tuyeres, blast furnace.
1. INTRODUCTION
The accomplish of physical and chemical processes that occur in a blast furnace
requires a high temperature, temperature that is obtained by hot air coming from cowpers and reaching the furnace by blowing hot air installation. Air from blowers is introduced in cowpers and heated to a temperature of about 1200°C. From cowpers, the hot air is introduced into the annular duct to the furnace at a pressure of 3.5 bar. From ring pipe, the warm air enters through elbows in the tuyeres of furnace. For proper development of physicochemical processes, the distribution of warm air inside the furnace must be uniform. This uniform distribution is achieved through the installation of hot air blowing into the furnace, which is composed of annular pipe, elbows and tuyeres. The number of elbows and tuyeres varies depending on the size of the blast furnace. The analyzed air feeding plant has 32 elbows and tuyeres.
2. PURPOSE OF THE WORK AND APPROACH
This paper consists of the numerical modeling of the pressure distribution of hot air inside the tuyeres depending on the inlet pressure of the hot air in the annular pipe of a furnace. To solve this problem it was used the Ansys CFD (Fluent).
The purpose of this paper is to determine the optimal input pressure in annular pipe so that to obtain an uniform outlet pressure for all the 32 wind holes. In this respect, three simulations were performed varying the inlet pressure in annular pipe.
3. DATA PREPROCESSING
Whatever the numerical methods used in solving a certain flow problems, the simulation is done in the same sequential stages, namely: 1. Setting the simulation goals, step in which the problem is analyzed and the parameters of
interest are set up, i.e. the unknown quantities to be calculated, which are significant for the studied problem;
1 Galati, 47 Domneasca St., E-mail: [email protected]

34
2. Defining of domain analysis, stage in which it is determined the geometrical shape of the domain that provides both spatial framing of the studied problem and the possibility of correct setting of boundary conditions. At this stage, the domain is drawn also.
3. Meshing of analysis area, step in which the analysis is divided into finite elements, also known as cells.
4. Definition of mathematical models, stage in which the set of equations that models the phenomena characteristic of the studied problem is chose. The set of equations includes the constitutive equations describing the physical properties of substances.
5. Introducing of boundary conditions. A number of parameters required for numerical calculation are defined, parameters usually known at the limits of the analysis domain.
6. Numerically solving of problem. The unknown quantities are calculated. 7. Graphical post-processing of results. Derived parameters from those obtained in the
numerically solving stage are calculated and are drawn a number of graphical representations of the results.
The first five stages of simulation represent preprocessing and are essential in defining a problem that is solved numerically. Usually, a good part of the time required by a numerically solving of a problem is assigned to this stage.
3.1 Drawing of model
The model drawing can be achieved by using any CAD/CAE package. In fact this is
just the calculation domain for the established problem. In this respect, the refractories inside the ring pipe, elbows and hot air feeding pipe will not be plotted, but actually just the calculating domain for the given flow problem.
The graphical representation was made using the CATIA software by respecting the size of components of hot air blowing plant into the blast furnace as they result from the technical documentation of the blast furnace. The Figure 1 shows the facility of hot air blowing into the furnace.
Fig. 1. Plant of hot air blowing into the furnace.
3.2 Meshing of analysis domain
After the drawing of analysis domain this must be discretized. Ansys CFD (FLUENT) has a solver for unstructured networks, so there is no limit for the meshing of domain, the
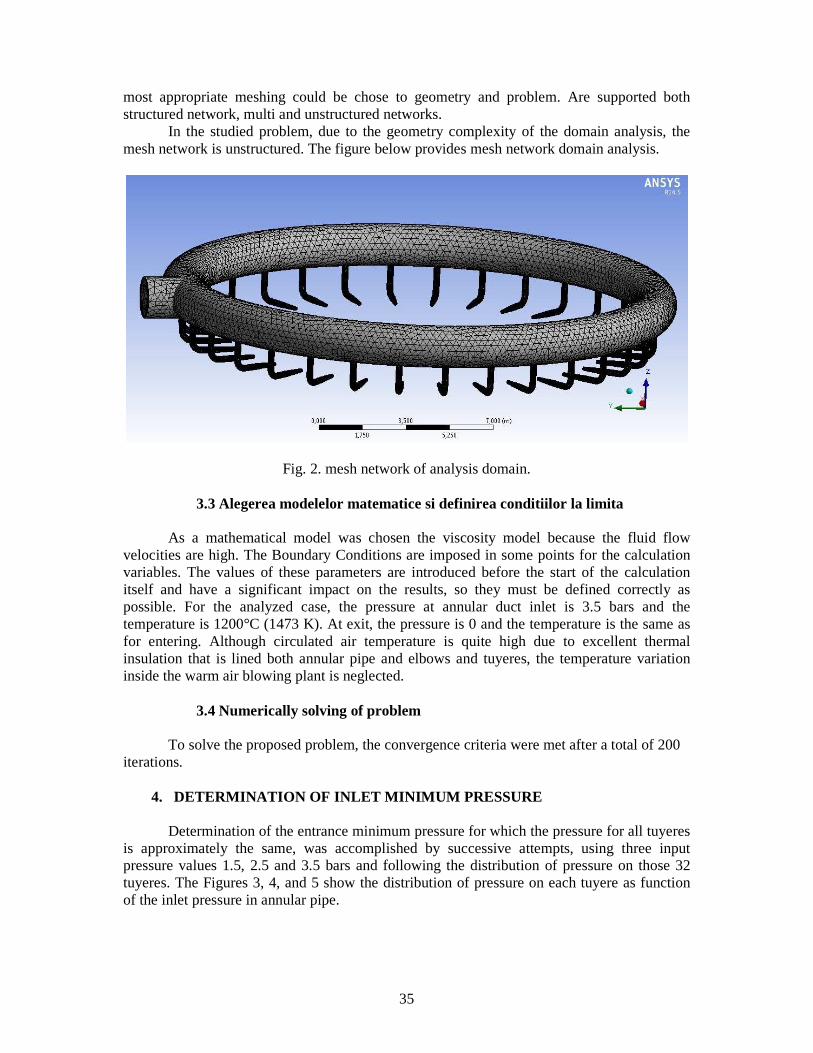
35
most appropriate meshing could be chose to geometry and problem. Are supported both structured network, multi and unstructured networks.
In the studied problem, due to the geometry complexity of the domain analysis, the mesh network is unstructured. The figure below provides mesh network domain analysis.
Fig. 2. mesh network of analysis domain.
3.3 Alegerea modelelor matematice si definirea conditiilor la limita
As a mathematical model was chosen the viscosity model because the fluid flow velocities are high. The Boundary Conditions are imposed in some points for the calculation variables. The values of these parameters are introduced before the start of the calculation itself and have a significant impact on the results, so they must be defined correctly as possible. For the analyzed case, the pressure at annular duct inlet is 3.5 bars and the temperature is 1200°C (1473 K). At exit, the pressure is 0 and the temperature is the same as for entering. Although circulated air temperature is quite high due to excellent thermal insulation that is lined both annular pipe and elbows and tuyeres, the temperature variation inside the warm air blowing plant is neglected.
3.4 Numerically solving of problem To solve the proposed problem, the convergence criteria were met after a total of 200 iterations.
4. DETERMINATION OF INLET MINIMUM PRESSURE
Determination of the entrance minimum pressure for which the pressure for all tuyeres is approximately the same, was accomplished by successive attempts, using three input pressure values 1.5, 2.5 and 3.5 bars and following the distribution of pressure on those 32 tuyeres. The Figures 3, 4, and 5 show the distribution of pressure on each tuyere as function of the inlet pressure in annular pipe.
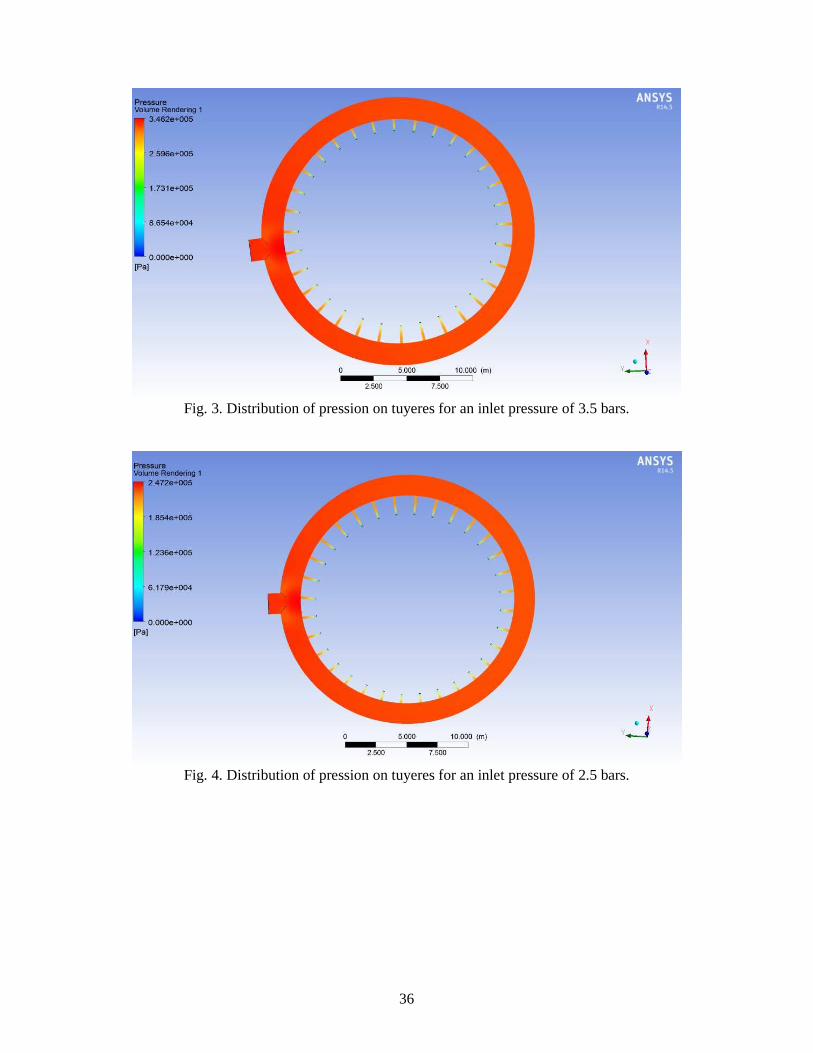
36
Fig. 3. Distribution of pression on tuyeres for an inlet pressure of 3.5 bars.
Fig. 4. Distribution of pression on tuyeres for an inlet pressure of 2.5 bars.

37
Fig. 5. Distribution of pression on tuyeres for an inlet pressure of 1.5 bars.
5. RESULTS ANALYSIS
As seen from the distribution of pressure on the tuyeres for the three values of inlet
pressure for which the analysis of the proposed problem was made, the inlet minimum pressure for each tuyere is approximately equal to 3.5 bars. In the Figure 6 is shown a longitudinal section of ring pipe at the value of inlet pressure of 3.5 bars.
Fig. 6. Pressure distribution in longitudinal section of ring pipe at the inlet pressure of 3.5 bars.
In Figure 6 can be noted an approximately equal distribution of pressure in the analysed
section and therefore an even distribution of pressure on all tuyeres.

38
6. CONCLUSIONS
According to the obtained results the minimum value of the pressure of warm air at blowing facility inlet for which a uniform distribution of pressure was obtained on the 32 tuyeres is 3.5 bars. For an inlet pressure less than this value the pressure distribution becomes non-uniform with negative implications on physical and chemical processes taking place in the blast furnace.
Due to the large gap between the annular pipe section in relation to the amount of the exit sections of tuyères, the annular pipe stores a considerable amount of air playing the role of an air tank.
Playing the role of air reservoir, the annular pipe ensures an uniform distribution of pressure on tuyeres when the inlet pressure is adequate.
References 1. Popescu F., Modelare si validare experimentala in curgerea fluidelor, Editura Fundatiei Universitare
“Dunarea de Jos” Galati, 2004. 2. *** CATIA V5-6R2013 software 3. *** ANSYS Fluent software

39
RESULTS OF OPERATIONS FOR THE STORAGE AND HANDLING OF WILLOW ENERGY CROPS
Arpad Domokos1, Lucian Mihăescu2, Ionel Pîşă2, Elena Pop2
ABSTRACT Energy willow cultivation began, at European level, in the 1970s. Today, renewable energy production,
captures the interest of more and more. Is the aim of achieving some hybrids (today there is about 300, of which 12 have excellent results), with
a long period of recovery, up to 25-30 years. Romania has integrated this trend by cultures made according to possibilities of the investors. There is no centralized actions, the area has a wide range of estimates, from 600 ha to 2000 ha. It is estimated, however, that there is propitious surface culture of about 500 000 ha, represented by land with high humidity. At the moment there is no legislation that actually support crops, but is to be expected of such a legal framework.
The current stage, however, needs to respond to opportunities to exploit the willow harvested. For these answers depend further development of future crops. It is noted that the theoretical research, experimental and applied even on combustion technologies are in advanced stage, with certain achievements. For this purpose it is noted, thermal power boilers (designed and built) for willow chips between 20-1000 kW. There are still problems to solve, related to the dynamics of harvest, transport and storage. Regarding storage is mentioned that energy willow represents an agricultural plant, already registered in the Official Catalogue of Plant Varieties of Culture in Romania, which has a number of features of positive energy. These features give it a prominent place on the level of energy plants cultivated in Europe. Compared to the rest of the plant, salicin content represents an undeniable advantage.
Salicin as a material preservative ensures willow (as chips) the opportunity to be stored for long periods (even years), only on a concrete platform and without a roof. The experiments carried out have confirmed this. Harvesting energy willow is made with different machines, in most cases combine the cut, chop and throw the resulting product in a trailer.
The town Poieni, Miercurea Ciuc, but also in Sweden, Hungary, Slovakia, samples were made samples storage with willow chips for different periods of two months, one year, two years and three years, making in parallel determinations for moisture and calorific power.
In Poienile - Covasna were initially grown in 22 hectares, the first mechanical harvesting is carried in February 2012 with a Jonh Deere machine. Harvesting speed was about an hour to hectare.
Chips willow transportation can be done with walking floor semitrailer for longer distances and with trailers (30-40 cubic meter) or special container for smaller distance. The trailer and container loading is made by front loader. After harvesting in February 2012, has revealed the importance of binomial harvesting, transport and storage.
If the storage platform is channeled (or drain water), so that chopped willow does not sit in water and chopped willow dumps is 2-3 m tall, were found the following:
1 Association Green Energy, Sfantu Gheorghe, Covasna County, Romania, email: [email protected] 2 University Politehnica of Bucharest, Faculty of Mechanical Engineering and Mechatronics, tel. +40214029158.

40
- moisture at harvest is 53-55%; after two months was reduced to 20-21% and after approx. 3 months was stabilized at 15-16%; - the waste dump surface to a depth of 10-15 cm has been observed water intrusion resulting from rain or melting snow layer that has changed color, becoming darker. After some time (a few days) without precipitation, this layer dries in the hot season. Winter wet layer freezes, forming a hard shell, but below this layer material kept at 15-16% humidity; - analysis of calorific power revealed that the calorific value increased with of the decreasing of the humidity, and this was the same (close) at different points of the heap, including the top layer; - the willow dump condition after different periods is not damaged, with few exceptions, when for various reasons, rainwater could not drain and chopped willow stayed long time in water. In these cases found no visible damage, but after drying, was found minor deviations of calorific values. Figure 1 and 2 present aspects of open and closed storage activity at the base of Poienile.
Figure 1. Open storage of the energy willow. Poienile Village
Figure 2. Aspects of closed storage activity at the base of Poienile.
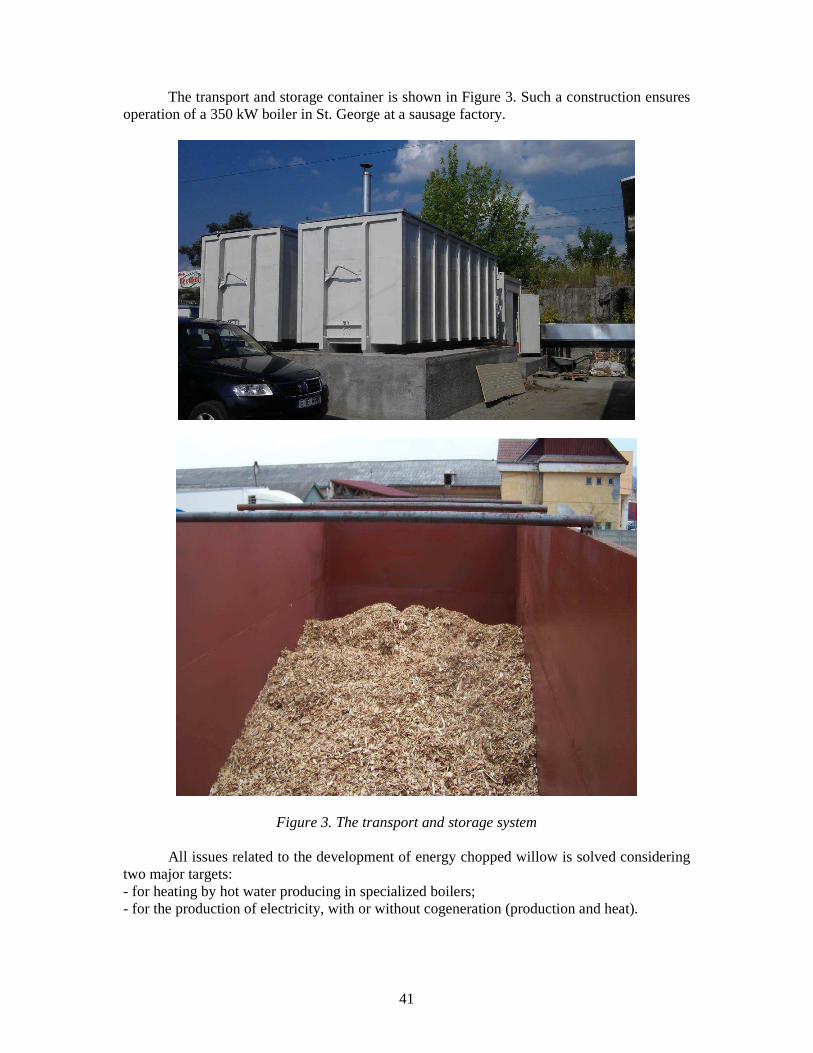
41
The transport and storage container is shown in Figure 3. Such a construction ensures operation of a 350 kW boiler in St. George at a sausage factory.
Figure 3. The transport and storage system
All issues related to the development of energy chopped willow is solved considering two major targets: - for heating by hot water producing in specialized boilers; - for the production of electricity, with or without cogeneration (production and heat).

42
If the first possibility of recovery, are somewhat lower consumption and local storage can be accepted at a distance from the harvesting area in the second case it is obvious that the power plant location to be in the vicinity of the plantation.
For heating, especially for those in urban areas, was developed the transport and storage in high volume containers. Containers replaced deposit being changed after consumption.
Case studies and feasibility studies have indicated that power plants less than 250 kW are the most economical. This implies a plantation size about of 100 ha. The power plant is higher, the energy production is more efficient, but increases exponentially issues of storage and handling of energy willow.
This work was supported by a grant of the Romanian Authority for Scientific Research, CNCS-UEFISCDI, project number PN-II-ID-PCE-2011-3-0698.

43
ANALOGY IN PROCESSES OF DESTRUCTION OF FRAGILE
CAPILLARY - POROUS COVERINGS AND METALLIC STEAM-GENERATING SURFACES IN POWER INSTALLATIONS
Alexander Genbach1, Karlygash Olzhabayeva2, Iliya Iliev3
ABSTRACT In the given article the analogy in the processes of a limit condition of weak capillary-porous
coverings and a metal heating surface is drawn. It was considered that real factors of development of concentrators of tension are revealed on the basis of the physical model of development of a steam phase in capillary and porous coverings. The role of thermal tension of compression and stretching, depending on brought thermal streams, is shown, at the time of their coming, the sizes of coming-off particles of a destroyed material and depth of penetration of thermal waves in studied materials.
1. INTRODUCTION
The inner thermohydraulical characteristics of boiling liquids inside, as well as on the surfaces of capillary-pore structures [1] are examined in order to create reliable cooling systems for the heat-loaded units in heat and power installations. Capillary and porous structures can be made of mesh, fibrous, ceramic, felt materials. It is possible to use fragile capillary and porous coverings for their modeling. In this connection, we’ll draw an analogy in destruction processes of the fragile coverings with metal protecting construction that differ in small porosity and heat conductivity.
2. METHODOLOGY
The dynamics of tension in steam bubbles existing in capillary and porous structures is
presented in figure 1. Rapid shooting allows to observe and generalize internal characteristics of boiling liquids [2-4].
Both the tension of compression waves and the expansions of steam bubbles that extend into a steam-generating surface, or in steam volume, can be destructive ("deadly") – i.e. death of a steam bubble, or creative ("viable") – i.e. the birth explosion of a steam germ, which will have a number of stages in its development (a critical stage and a silence stage) when relaxation, rest, stability of phases, structure, order, balance and symmetry are observed.
The model of the generation process, development and the separation of a steam bubble in an active stage of the steam-generating wall,covered by porous structure, is presented in figure 2.
The model of tension representation of the dynamics and "life" of a steam phase allows to model and draw analogies in processes «bank of a crack disclosures», and to reveal the main components of thermal tension in the destruction mechanism of capillary-porous coverings.
1 Professor Dr.Sc., AUES, Kasachstan, [email protected]; cell phone: +78727 2630601
2 Ph.D. Student, AUES, Kasachstan, [email protected]; cell phone: +78771 415 35 71
3 Professor, PhD, Ruse University, Ruse, Bulgaria, e-mail: [email protected]; cell phone: +359 887306898
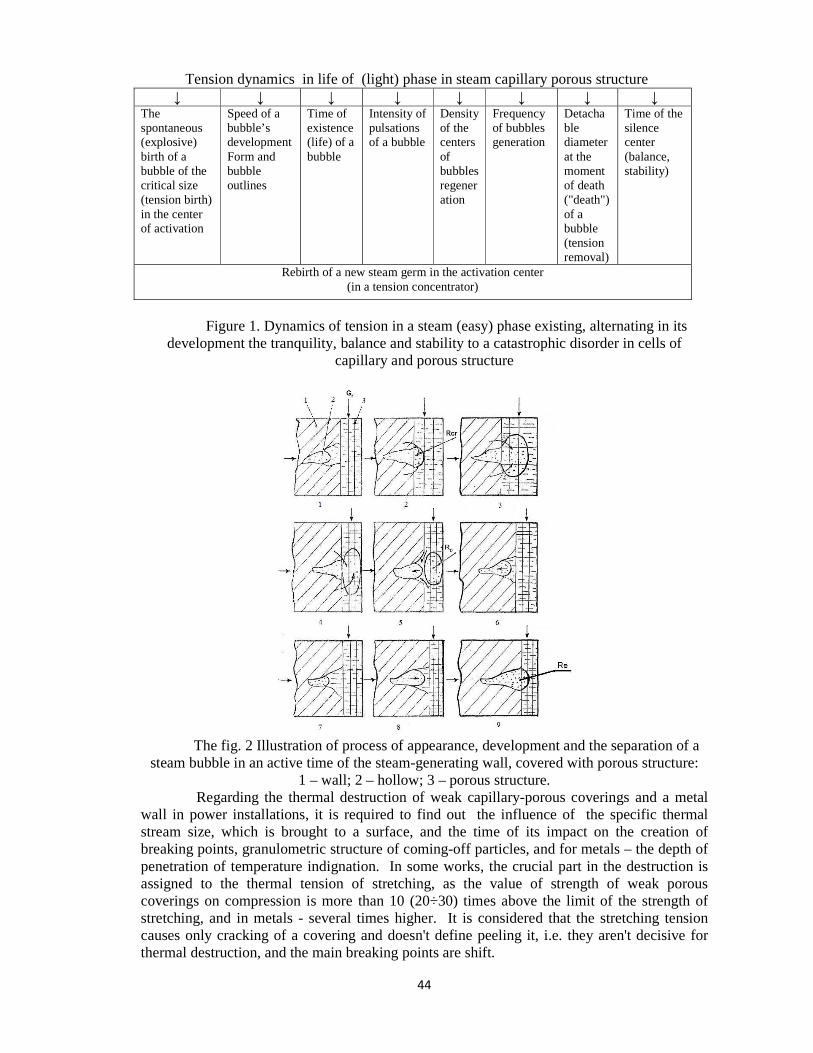
44
Тension dynamics in life of (light) phase in steam capillary porous structure ↓ ↓ ↓ ↓ ↓ ↓ ↓ ↓
The spontaneous (explosive) birth of a bubble of the critical size (tension birth) in the center of activation
Speed of a bubble’s development Form and bubble outlines
Time of existence (life) of a bubble
Intensity of pulsations of a bubble
Density of the centers of bubbles regeneration
Frequency of bubbles generation
Detachable diameter at the moment of death ("death") of a bubble (tension removal)
Time of the silence center (balance, stability)
Rebirth of a new steam germ in the activation center (in a tension concentrator)
Figure 1. Dynamics of tension in a steam (easy) phase existing, alternating in its
development the tranquility, balance and stability to a catastrophic disorder in cells of capillary and porous structure
The fig. 2 Illustration of process of appearance, development and the separation of a
steam bubble in an active time of the steam-generating wall, covered with porous structure: 1 – wall; 2 – hollow; 3 – porous structure.
Regarding the thermal destruction of weak capillary-porous coverings and a metal wall in power installations, it is required to find out the influence of the specific thermal stream size, which is brought to a surface, and the time of its impact on the creation of breaking points, granulometric structure of coming-off particles, and for metals – the depth of penetration of temperature indignation. In some works, the crucial part in the destruction is assigned to the thermal tension of stretching, as the value of strength of weak porous coverings on compression is more than 10 (20÷30) times above the limit of the strength of stretching, and in metals - several times higher. It is considered that the stretching tension causes only cracking of a covering and doesn't define peeling it, i.e. they aren't decisive for thermal destruction, and the main breaking points are shift.

45
According to the estimates of tension compression size, with the increase of circumstance’s temperature in very short periods, the dynamic effects become quite considerable, and tension compression reaches high values as well, often exceeding the strength of a material on compression by several times. Therefore, it is necessary to consider this tension in the mechanism of thermal destruction of a porous material. It is required to find out what type of tension reaches its limit values for brought thermal streams earlier.
We will consider a plate, free in all its aspects, and of 2h thickness. To Z surface = + h, since the moment of τ = 0, here, it a constant specific thermal stream of q is brought. The bottom surface of Z = - h and lateral edges of a plate – heat-insulated [2].
The heat conductivity equation with boundary conditions will register as follows: 2
2,w
T Ta
z τ∂ ∂=∂ ∂
(1)
, ,w
Тq z h
zλ ∂ = = +
∂ (2)
0, .w
Тz h
zλ ∂ = = −
∂ (3)
Temperature distribution on thickness depends on the heat-physical properties of a material, the size of a thermal stream and the time of its appearance:
0, .w
Тz h
zλ ∂ = = −
∂ (4)
where ;wh
λµ = n – whole positive numbers.
Having been informed about the temperature distribution in a plate, it is possible to calculate the thermal tension of stretching and the compression, appearing at some moments τ at various depth from a surface δi (h=zi) at this value of a thermal stream of q.
The plate from a variable on thickness temperature is in plain tension. Tension is defined with accordance to the following equation:
∫+
−
−+
−−==
h
hyyххdz
h
zET
hh
zT
E,;
2)1(
1);(
1'
'
ταν
τν
ασσ (5)
Where the first member – making compression tension, and the second – stretchings; α' – coefficient of linear expansion; Е – Jung's module. Work (α' E) doesn't depend on the temperature, therefore the expression for tension of
stretching becomes simpler. Setting the limit values of tension of compression, stretching for each covering and
metal, a functional dependence on time and penetration depth of the thermal stream demanded for destruction arises. Besides, when equating plate surface temperatures to temperature of melting of both the covering and the metal, the values of the specific thermal streams, necessary for the melting of of the top layer in various period of their action, are determined Thus, in each specific case present are functional dependences of a thermal stream from the time of its influence on the covering and metal surface:
- melting of a plate surface -
( )( ) ( ) ( )[ ]
;
cos4/exp1
4
3
2
2/
1
2
2
2
1
−−×
×−+=
∑∞
=nCT
n
CT
пл
ncnn
cТq
πρλτπµ
µπµτ
ρλµ
(6)
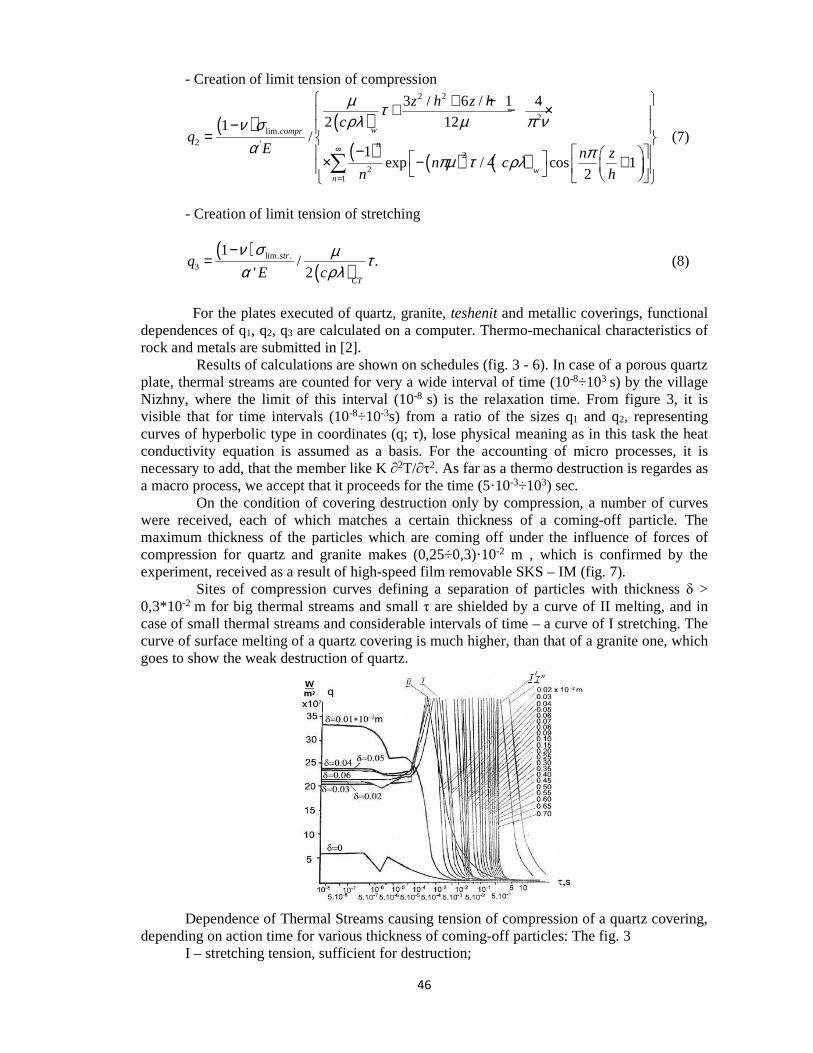
46
- Creation of limit tension of compression
( ) ( )( ) ( ) ( )
2 2
2
lim.2 '
2
21
3 / 6 / 1 4
2 121/
1exp / 4 cos 1
2
wcompr
n
wn
z h z h
cq
E n zn c
n h
µ τρλ µ π νν σ
α ππµ τ ρλ∞
=
+ −+ − × − =
− × − + ∑
(7)
- Creation of limit tension of stretching
( )( )
lim. .3
1/ .
' 2str
CT
qE c
ν σ µ τα ρλ
−= (8)
For the plates executed of quartz, granite, teshenit and metallic coverings, functional
dependences of q1, q2, q3 are calculated on a computer. Thermo-mechanical characteristics of rock and metals are submitted in [2].
Results of calculations are shown on schedules (fig. 3 - 6). In case of a porous quartz plate, thermal streams are counted for very a wide interval of time (10-8÷103 s) by the village Nizhny, where the limit of this interval (10-8 s) is the relaxation time. From figure 3, it is visible that for time intervals (10-8÷10-3s) from a ratio of the sizes q1 and q2, representing curves of hyperbolic type in coordinates (q; τ), lose physical meaning as in this task the heat conductivity equation is assumed as a basis. For the accounting of micro processes, it is necessary to add, that the member like K ∂2T/∂τ2. As far as a thermo destruction is regardes as a macro process, we accept that it proceeds for the time (5·10-3÷103) sec.
On the condition of covering destruction only by compression, a number of curves were received, each of which matches a certain thickness of a coming-off particle. The maximum thickness of the particles which are coming off under the influence of forces of compression for quartz and granite makes (0,25÷0,3)·10-2 m , which is confirmed by the experiment, received as a result of high-speed film removable SKS – IM (fig. 7).
Sites of compression curves defining a separation of particles with thickness δ > 0,3*10-2 m for big thermal streams and small τ are shielded by a curve of II melting, and in case of small thermal streams and considerable intervals of time – a curve of I stretching. The curve of surface melting of a quartz covering is much higher, than that of a granite one, which goes to show the weak destruction of quartz.
Dependence of Thermal Streams causing tension of compression of a quartz covering, depending on action time for various thickness of coming-off particles: The fig. 3
I – stretching tension, sufficient for destruction;
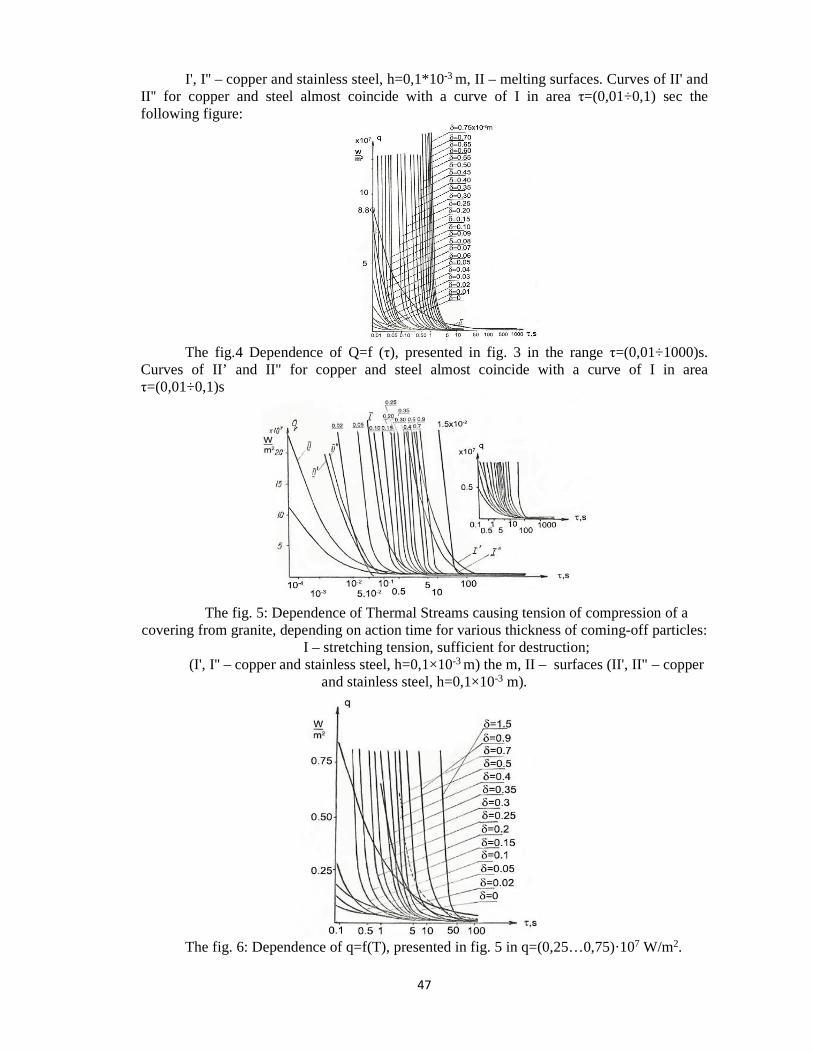
47
I', I'' – copper and stainless steel, h=0,1*10-3 m, II – melting surfaces. Curves of II' and II'' for copper and steel almost coincide with a curve of I in area τ=(0,01÷0,1) sec the following figure:
The fig.4 Dependence of Q=f (τ), presented in fig. 3 in the range τ=(0,01÷1000)s.
Curves of II’ and II" for copper and steel almost coincide with a curve of I in area τ=(0,01÷0,1)s
The fig. 5: Dependence of Thermal Streams causing tension of compression of a
covering from granite, depending on action time for various thickness of coming-off particles: I – stretching tension, sufficient for destruction;
(I', I'' – copper and stainless steel, h=0,1×10⁻³ m) the m, II – surfaces (II', II" – copper and stainless steel, h=0,1×10⁻³ m).
The fig. 6: Dependence of q=f(T), presented in fig. 5 in q=(0,25…0,75)·107 W/m2.
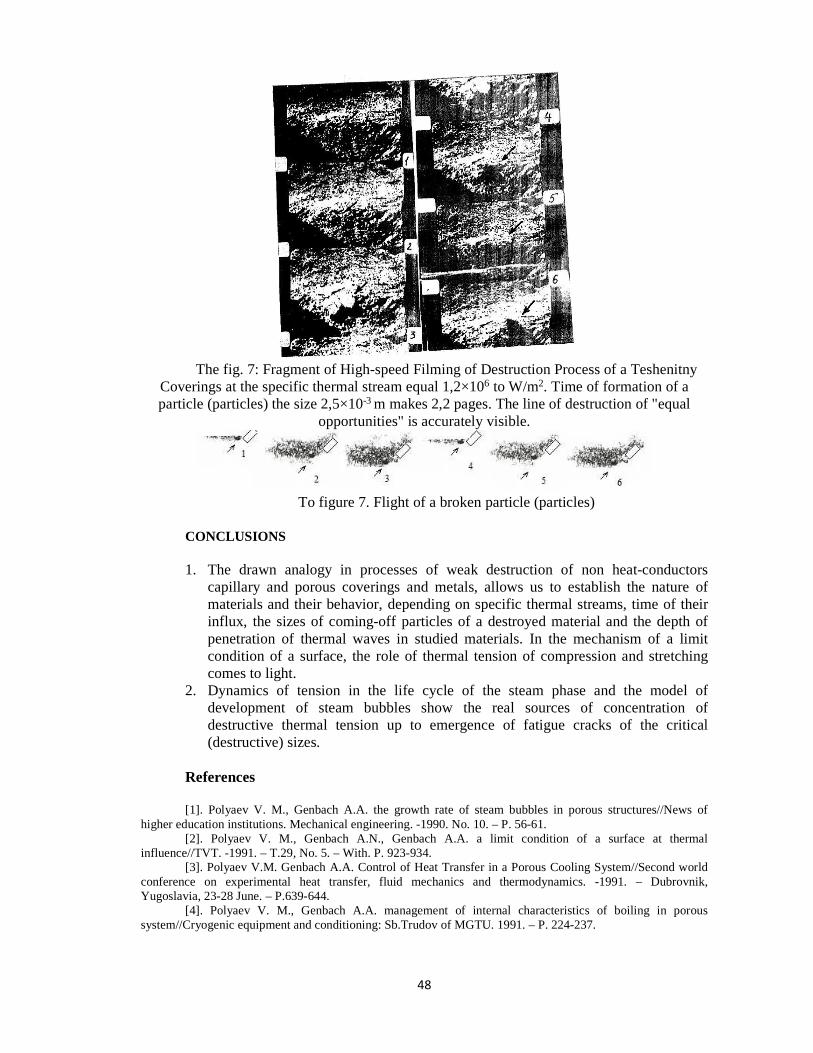
48
The fig. 7: Fragment of High-speed Filming of Destruction Process of a Teshenitny
Coverings at the specific thermal stream equal 1,2×10⁶ to W/m2. Time of formation of a particle (particles) the size 2,5×10⁻³ m makes 2,2 pages. The line of destruction of "equal
opportunities" is accurately visible.
To figure 7. Flight of a broken particle (particles)
CONCLUSIONS 1. The drawn analogy in processes of weak destruction of non heat-conductors
capillary and porous coverings and metals, allows us to establish the nature of materials and their behavior, depending on specific thermal streams, time of their influx, the sizes of coming-off particles of a destroyed material and the depth of penetration of thermal waves in studied materials. In the mechanism of a limit condition of a surface, the role of thermal tension of compression and stretching comes to light.
2. Dynamics of tension in the life cycle of the steam phase and the model of development of steam bubbles show the real sources of concentration of destructive thermal tension up to emergence of fatigue cracks of the critical (destructive) sizes.
References [1]. Polyaev V. M., Genbach A.A. the growth rate of steam bubbles in porous structures//News of
higher education institutions. Mechanical engineering. -1990. No. 10. – P. 56-61. [2]. Polyaev V. M., Genbach A.N., Genbach A.A. a limit condition of a surface at thermal
influence//TVT. -1991. – T.29, No. 5. – With. P. 923-934. [3]. Polyaev V.M. Genbach A.A. Control of Heat Transfer in a Porous Cooling System//Second world
conference on experimental heat transfer, fluid mechanics and thermodynamics. -1991. – Dubrovnik, Yugoslavia, 23-28 June. – P.639-644.
[4]. Polyaev V. M., Genbach A.A. management of internal characteristics of boiling in porous system//Cryogenic equipment and conditioning: Sb.Trudov of MGTU. 1991. – P. 224-237.

49
STUDY OF THE CONDITIONS OF FRAGILE FRACTURE OF CAPILLARY-POROUS COATINGS IN THERMAL POWER PLANTS
Alexander Alexievich Genbach1, Vera Orazievna Baibekova2, Iliya Iliev3
ABSTRACT The conditions of the destruction of fragile capillary - porous coatings were investigated. The
traditional approach shows two basic conditions of destruction: tensile stresses and shift. However, only destructive pressure of compression occurs to cover with granite )11,0( ÷=t , and only when
1ft с, in some region 2106,0 −⋅≈∆ m, they pass into the tensile stresses in a very short period. To cover granite intervals of heat flows within which there is such destruction will be: qmax= 1·107 Vt/m²; qmin= 2,1·105 Vt/m².
1. INTRODUCTION
Capillary-porous coating can be used to create high-intensity and high-cooling
systems. Coatings are applied to the boiling surface. Due to the mass and capillary forces, a cooler is supplied to the coating. A physical model of the processes of heat and mass transfer may look as shown underneath in Fig. 1[1-9].
The normal process of cooling can be violated in case of a heat transfer crisis occurrence (termination of a supply cooler, ultra-high heat fluxes) [9]. The coating can then start to degrade. Of interest to the simulation of the destruction process is the investigation of the behavior offragile capillary-porous coatings, which will allow relatively low heat fluxes and temperature to identify the mechanism of the destruction process.
A variety of rocks that are whether easily or intricately destroyed by the heat flow through the surface installation can be used as simulating fragile coatings, or in the case of direct exposure by flame burners, including high-temperature supersonic. Currently, there are is a significant number of works devoted to the exploration of the mechanism of rock failure by thermal method burner of missile type, criteria for thermo destruction.
2. METHODOLOGY
The works devoted to the theory of thermal destruction, which gives an opportunity to
explore the impact of certain physical properties of rocks, physical and chemical processes as well as properties of the high-temperature supersonic gas flow process.
During the thermal destruction of rocks some regions of the surface coating are exposed by a burner, resulting in part of the surface rocks being heated to the temperature Ts, whilst in other parts of the rocks the temperature remains T0. Under the irradiated surface of the rocks the temperature gradient ascends, as a result of which the rocks unevenly expand.
1 Professor Dr.Sc., AUES, Kasachstan, [email protected]
2 Ph.D. Student, AUES, Kasachstan, [email protected]
3 Professor, PhD, Ruse University, Ruse, Bulgaria, e-mail: [email protected]; cell phone: +359 887306898

50
Surrounding unheated layers are able to countervail this expansion. As a consequence thermal stress occurs both in the heated part of the rocks, and in like manner in the surrounding unheated array. That stress can reach annihilative values.
Figure 1. Physical model of the processes of heat and mass transfer in porous
structure, covering the cooling surface: straight lines - fluid flow; wavy line - pair movement: q is the heat flux; Tg, TST,Tn-temperature of gases, walls, saturation; Gж ,Gп - consumption of liquid and vapour; δст, δф , δж , δп-width of the adjacent surface of porous coatings, liquid
and vapour; VG, d - cell width of porous coating and the diameter of pores. The rate of the temperature increase on the irradiated high-temperature jet surface is
proportional to the difference of the final temperature Ts and current T,moreover according to one of the models,one can assume that the temperature of the heated surface changes with regard to the following law:
),1(0kt
Skt eTeTT −− −+=
where K- coefficient; t-time. If the rocks were to expand freely without resistance, then there would not be any strain inside, as the reason for its appearance is the resistance of the surrounding materials extension.
),( 0TTLlcв −= α where lсв - increment coverage L; alpha - coefficient of linear thermal expansion.
Stress caused by the heating (or cooling) of rocks, are considered as temperature (thermal). The utmost stress may be observed if the ends of the rod (the model of the rock) are ??? fixed
),( 0max TTEL
lE cв −−=−= ασ
where E - module of elasticity. In fact, the rod is lengthened with l, which is less than lсв
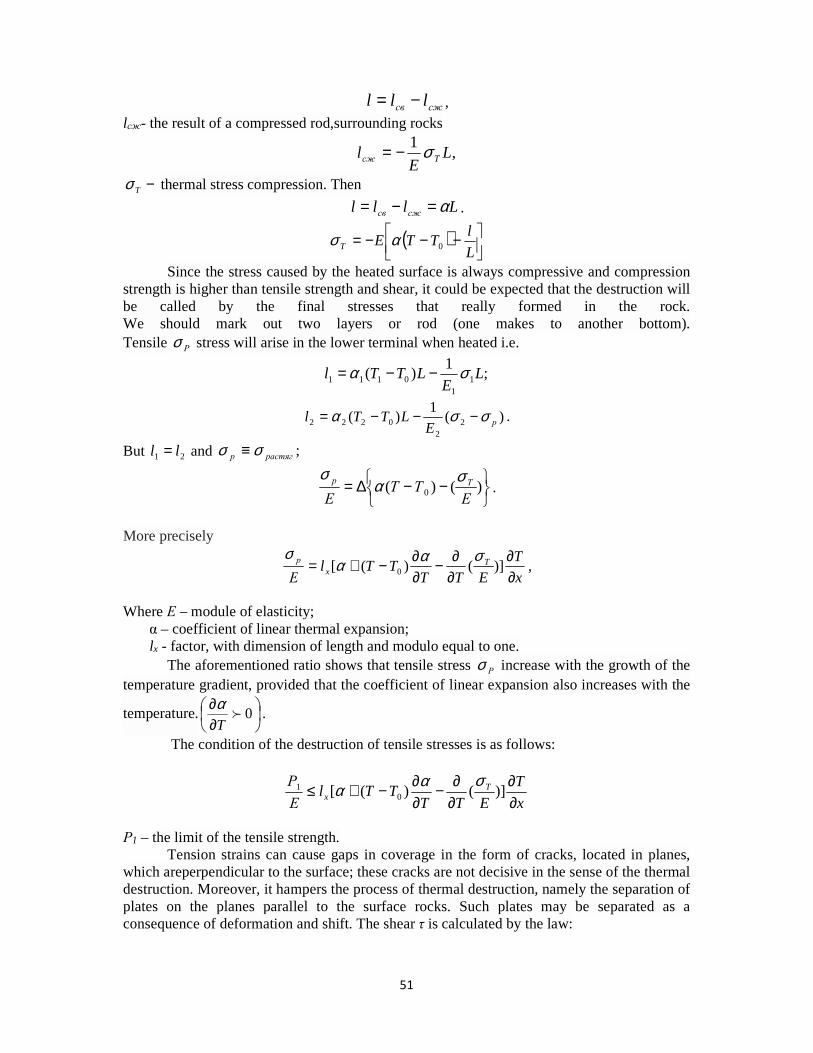
51
сжсв lll −= , lсж- the result of a compressed rod,surrounding rocks
,1
LE
l Tсж σ−=
−Tσ thermal stress compression. Then
Llllсжсв
α=−= .
( )
−−−=L
lTTET 0ασ
Since the stress caused by the heated surface is always compressive and compression strength is higher than tensile strength and shear, it could be expected that the destruction will be called by the final stresses that really formed in the rock. We should mark out two layers or rod (one makes to another bottom). Tensile Рσ stress will arise in the lower terminal when heated i.e.
;1
)( 11
0111 LE
LTTl σα −−=
)(1
)( 22
0222 рELTTl σσα −−−= .
But 21 ll = and ;растягр σσ ≡
−−∆= )()( 0
ЕТТ
Е
Тр σασ
.
More precisely
x
T
ETTTTl
Е
Tx
р
∂∂
∂∂−
∂∂−+= )]()([ 0
σαασ
,
Where Е – module of elasticity; α – coefficient of linear thermal expansion; lx - factor, with dimension of length and modulo equal to one. The aforementioned ratio shows that tensile stress Рσ increase with the growth of the temperature gradient, provided that the coefficient of linear expansion also increases with the
temperature.
∂∂
0fT
α.
The condition of the destruction of tensile stresses is as follows:
x
T
ETTTTl
Е
Р Tx ∂
∂∂∂−
∂∂−+≤ )]()([ 0
1 σαα
Р1 – the limit of the tensile strength. Tension strains can cause gaps in coverage in the form of cracks, located in planes, which areperpendicular to the surface; these cracks are not decisive in the sense of the thermal destruction. Moreover, it hampers the process of thermal destruction, namely the separation of plates on the planes parallel to the surface rocks. Such plates may be separated as a consequence of deformation and shift. The shear τ is calculated by the law:

52
x
lG
x
llGG
∆∆=
∆−== 21γτ
∆х – thickness of deformed layer; G - shear modulus.
Then x
lG
∂∂=τ substituting l, we get the following
( )
−−∂∂=
ETT
xGL Tσατ 0
So, for shearing stress
( )x
T
ETTTTL
GT
∂∂
∂∂−
∂∂−+=
σαατ0
i.e. shear stress has the property to accumulate (τ~L). The condition of the destruction by shift
( )x
T
ETTTTL
G
Р T
∂∂
∂∂−
∂∂−+≤
σαα 02
Р2- tensile-shear. Destruction leads to the appearance of cracks, parallel to the irradiated surface of the
rocks. If we consider that the ultimate strength of rocks stretching P1 and shift P2 are the values of the same order, and P2 contains the length L, which is missing in the first condition (P1) and can take large values, it can be argued that the second condition (P2) can be performed more often than the first.
Progress in the research of thermo elasticity, photo-elasticity, holography and high-speed photography [1,3,5] allows to explain the mechanism of formation of thermal stresses, deformations [1], displacements and the emerging paramount efforts in capillary-porous coatings.
However, the magnitude of the applied specific heat fluxes qi, their duration t and depth of penetration z of temperature waves in thickness h of coverage will pose an influence onthe reasons for the destruction of the capillary-porous coating. This ultimate goal can be solved using the equation of unsteady heat conduction with boundary conditions of the second kind [2,3]. Figure 2 shows a plot of stresses over the thickness h of capillary-porous coatings, made of granite. Limiting heat flow, causing stress fracture melting, compression and tensile, respectively form q1, q2 and q3, and voltages 321 ,, σσσ .
It turned out that the heat flux compression 32 qq p , than stretching, and а
21 qq f and 31 qq f . Fig.2 shows the interrelation between the stresses of compression and
tension inside coatings for various time intervals, beginning with the submission of heat flow. At small )11,0( ÷=t с only pressure of compression occurs.
Starting with с 1ft с in a certain field ( )hz i −∆ , equal to 6·10-2 m, tension
compression pass into the tensile stresses for a very short period of time, and for various intervals of time they are located at different depths of the surface of the capillary-porous coating. Most of the shear layers of coating will be observed in the transitional region of compressive stress in tension strains. Following some time, shear stresses reach their limit values later than the destructive stress of compression and, obviously, sometime before the maximum tensile stresses.

53
Figure 2. The stress distribution over the thickness of the coating in the form of a
granite plate with different heat fluxes and time of their action: 71 10142,0 ⋅=q Vt/m²;
72 10042,0 ⋅=q Vt/m²; 7
3 10075,0 ⋅=q Vt/m²; - limit of tensile strength: ,σ x105, N/m2; Е,
x105, N/m2. CONCLUSIONS
1. So the destruction of rocks under the action of compression forces occur much earlier in time than the forces of stretching. The destruction will probably take place under the action of compression forces and shift. To cover granite intervals of heat flows, within which such a destruction appears, will be: qmax= 1·107 Vt/m²; qmin= 2,1·105 Vt/m². Each thickness iδ of the given particles under the action of compression forces meet their
limits of heat flow, both within the given interval. For a cooled metal surface (see figure 1) in case of a violation of the operation of the cooling system qmin = 1·104 Vt/m², and in the case of capillary-porous cooling system, employed by the combined action of capillary and mass forces (∆Рg+ кап), the value of qмак ≈ (1÷2)·106 Vt/m².
2. The role of compression stress grows with the increase of size q in the heated layer of the coating and consequently reduces the heating time t, despite of the fact that high compression resistance destruction from compressive stresses occurs instantly and in very small volumes in more auspicious conditions.
References
[1]. Polyaev V., Genbach A.N., Genbach A.A. An experimental study of thermal stress in porous material by methods of holography and photoclasticity // Experimental thermal and fluid science, avenue of the Americas.-New York, volume 5. Number 6, November.-1992.-P.697-702. [2]. Genbach A.A., Burmistrov A.V. Investigation of the thermal condition of the cylinders of steam turbines// Industry of Kazakhstan, №2 (65).-2011. -P-93. [3]. Poliaev V.M., Genbach A.N., Genbach A.A. Ultimate state of the surface of the thermal effects// Thermal physics of high temperature.-1991.-T, №5.-P-934. [4]. Polyaev V.М., Genbach A.A. Control of Heat Transfer in a Porous Cooling System// Second world conference on experimental heat transfer, fluid mechanics and thermodynamics.-1991.-Dubrovnik, Yugoslavia, 23-28 June.-P.639-644.

54
[5]. Poliaev V.M., Genbach A.A. Management of internal boiling characteristics in porous system, Cryogenic equipment and air conditioning: Collected proceeding MSTU.-1991.-P-237. [6]. Poliaev V.M., Genbach A.A. Management of heat transfer in porous structures// proceedings of the Russian Academy of Sciences. Power engineering and transport.-T, №6.-P 110. [7]. Poliaev V.M., Genbach A.A. Heat transfer in porous system operating under combined action of capillary and gravitational forces, “Heat and power engineering.-1993, .№7-PP.-58. [8]. Poliaev V.M., Genbach A.A. The Intensity of heat porous system in the gravitational field// School’s news. Power Engineering 1993, №.1,2-P-95. [9]. Poliaev V.M., Genbach A.A. Limiting thermal load in porous structures// School’s news. Aerotechnique.-1991 №.1.-PP. 33-37.
55
CASE OF STUDY REGARDING THE ENERGY REQUIREMENTS FOR
A MEDIUM RURAL HOUSEHOLD
Alexandru Gruia1 University of Craiova
ABSTRACT
The paper presents a case of study for meeting the energy demands for a medium rural household regarding the most accessible renewable energy resource.
1. INTRODUCTION For many people living in remote areas, connecting to the main power grid is not an option or the costs of connecting tot the grid are very expensive. Therefore, they must produce their own power. Many people are resorting to petrol or diesel generators, but these are noisy, maintenance intensive and environmentally damaging. In more recent years, other cleaner forms of power generation have become available. The most known is solar power but there are other forms of generating power like wind power, water power, biogas that are becoming more common. Unlike fossil fuel powered petrol or diesel generators, these technologies are known as renewable energy. In this document is a comparison on the new types of renewable energy electrical generating technologies that can be used in a rural area household and can provide an independence of the grid. On the market there are a couple of new and green technologies that can solve the electrical energy requirements of a medium rural home. Electrical energy generation is more problematic than thermal energy generation in a rural household because the thermal energy requirements in a medium rural area household are achieved by using biomass that can be found in the area such as: wood, straw, corn cobs. That can be burned in a stove, fireplace, heater to produce thermal energy for cooking and heating.
2. METHODOLOGY The electrical energy requirements of a medium rural household are about 283kw/month
this means 9,43kw/day. But this consumption can be lowered by 30% using more energy efficient light bulbs and appliances. The drawbacks in this new technologies is the price than can be higher than the normal cost of the power consumed of the grid over a period of 20 years which is the guaranteed lifespan of a renewable energy system. The advantages are that this form of producing is green and has smaller carbon foot print than conventional energy use and you will not be defendant on the electrical company for power. Solar energy is the most used electrical energy generating technology. Solar power generates electrical and thermal energy; the electrical power is generated via photovoltaic panels. This technology works by converting solar radiation in to direct current electricity using semiconductors. This is done by using the photovoltaic effect of the semiconductors materials. The solar panels are made using a series of solar cells that contain photovoltaic material. The majority of cells are made of water based crystalline silicone or thin film cells based on cadmium telluride or silicon. The panels that are usually sold now are of two
1Craiova, 0767140877, [email protected]

56
typesmonocrystalline and policrystaline the first is more expensive and has an efficiency of 15-18% the others are less expensive and have o efficiency of 13-15% and the power varies from 30w to 300w per module.
The solar panels can be mounted on a fix mounting system or a mobile 1axis system that it is linked to a sun tracker, this will increase the efficiency of the panels by 20%. Using an off-grid system will require a regulator and a battery pack to store the energy produced by the system. The system will require an inverter to convert the DC current that the panels generate to AC current that is used on household appliances; the power of the inverter is calculated by the power of the solar system. To achieve total Of-grid independence you would need a solar system to produce 3396kw/year. But considering than in the winter the system has a lower efficiently, the system should be a 5000kw/year system which has a medium price of 12000€.The price in Romania is 11€/100kw this means 31,13€/month= 373,56€/year power consumed by the household in 1 year if we make a calculus it will mean that the system will be paid in 32,1 year. This is inefficient because the system is rated for 20 years. In extreme weather conditions like a week of clouded sky the batteries may be depleted an you may need a backup generator to power the system which will raise the cost of the entire system and you would need also to buy fuel for the generator which will raise the of producing the power. Also the system is prone to problems in hail storms or heavy snow falls.
Figure 1: Solar energy system
Wind powered is the conversion of wind energy in to electrical energy using wind
turbines. Wind turbines convert kinetic energy to electrical energy that it is used to charge the batteries. Modern turbines are manufactured in variable sizes and being vertical or horizontal axis design. A wind powered turbine can extract 59% from the total kinetic energy of the air flowing through the turbine, this is the maximal achievable extraction of wind power according to Betz’ law , that the conservation of mass requires as much mass of air exits the turbine as it enters it. But the efficiencies of a modern wind turbine is at 75% of the Betz limit for the wind power extractable at rated operational speed because there are loses in the blade rotor friction and drag, generator and convertor loses, gearbox loses. The small wind turbines are for household uses because there are of a small size are more cost effective than the large commercial wind turbines used in wind farms .The small scale turbines have a range from 2m to 7.5m in diameter and produce rated electricity from 300 to 10000 watts at rated optimal wind speed. The vast majority of small wind turbines are horizontal axis turbines. The generator of a small wind turbine produces AC current that is converted in to DC current to charge the batteries. The small wind turbines use dynamic braking to regulate their speed at high wind speeds. For a small wind turbine the size of the tower varies from 7m to 15m and it

57
must be placed at a distance from 150m from any object higher than the turbine. The components of a small wind turbine design for household of grid use are: The upper part of the turbine composed of the blades and housing which has the rotor, gearbox, generator, convertor, the pole upon the housing sits the charger and the inverter that convert the current from the generator to the battery pack and household electrical grid. To produce electrical energy for a medium household you would need 5000kw/year system. The medium costs of the system are 11000€ including the montage. The price in Romania is 11€/100kw this means 31,13€/month= 373,56€/year this means that the system will be paid in 29,9 year. This is inefficient because the system is rated for 20 years. In extreme weather conditions like a week without wind the batteries may be depleted an you may need a backup generator to power the system which will raise the cost of the entire system and you would need also to buy fuel for the generator which will raise the of producing the power. Also the system is prone to problems in heavy wind and to be used as a standalone system you would need to live in an area with constant wind activity.
Figure 2: Wind turbines system for producing electricity
Water based electricity producing systems, if the local area has a stream or a river
flowing near your house you can harness the power of the flowing water to create a micro hydroelectric plant. In our country approximately in any village there is a stream of water that passes it. This type of system can be created to provide auxiliary power and can be linked to photovoltaic system of a wind turbine system. The water flow can be harvested in a couple of ways the first would be that you make a small channel of water that runs along the river. The channel would have to have a drop from whom the water would be channeled in to a funnel that will turn a turbine linked to a generator and then the water that passed the turbine should flow back in to the river. The generator would be linked to a charger and then to the batteries. This system can be linked to a 150w up to 600 w generators depending on the water speed and flow. This system has reduced costs but depends on the position and the flow of the river. The other option is to build a micro dam and a micro basin like a miniature hydro plant and have the water funneled to a small turbine that will be linked to a generator. The cost of this system would be higher because you would have to build the dam out of concrete and you have to dig the small basin, but it can have a larger generator an you can produce more power, if you have enough river flow you can power the entire household. The system would provide the most power in spring and fall; it can be affected by drought in the summer and freezing in the winter. This system can be used as an auxiliary system in hybrid system with classic generators and wind turbine systems, it can’t be used so well with solar systems because in
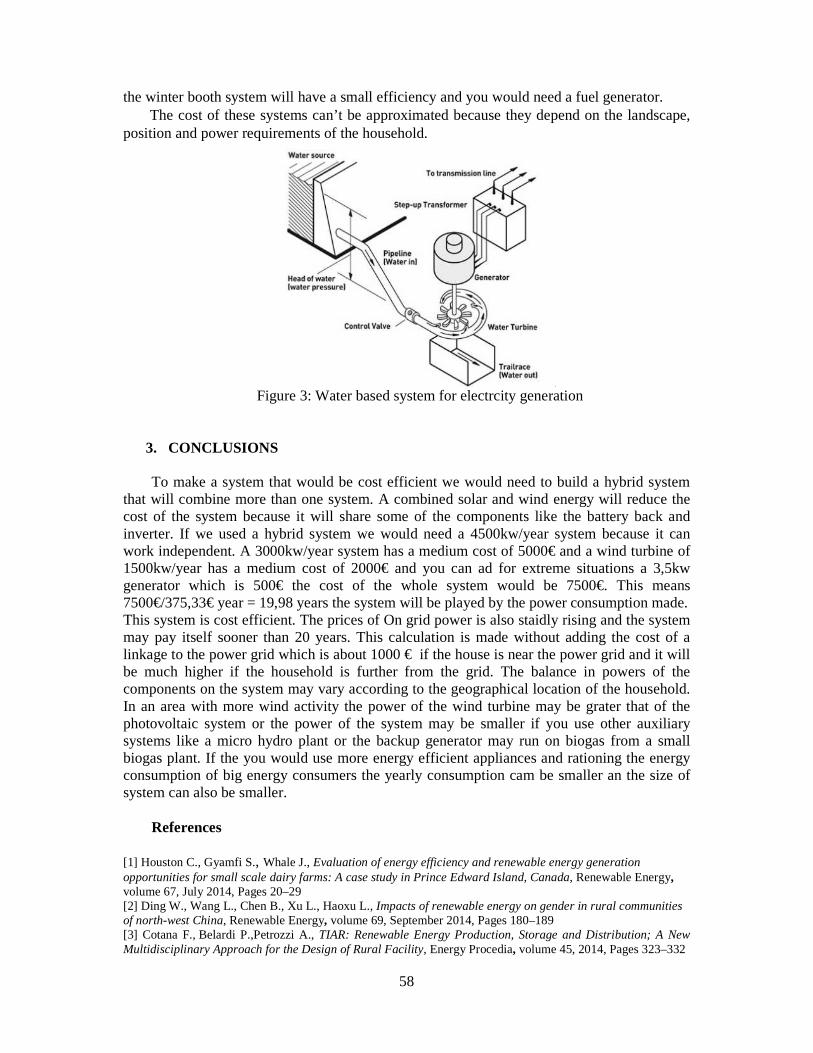
58
the winter booth system will have a small efficiency and you would need a fuel generator. The cost of these systems can’t be approximated because they depend on the landscape,
position and power requirements of the household.
Figure 3: Water based system for electrcity generation
3. CONCLUSIONS To make a system that would be cost efficient we would need to build a hybrid system that will combine more than one system. A combined solar and wind energy will reduce the cost of the system because it will share some of the components like the battery back and inverter. If we used a hybrid system we would need a 4500kw/year system because it can work independent. A 3000kw/year system has a medium cost of 5000€ and a wind turbine of 1500kw/year has a medium cost of 2000€ and you can ad for extreme situations a 3,5kw generator which is 500€ the cost of the whole system would be 7500€. This means 7500€/375,33€ year = 19,98 years the system will be played by the power consumption made. This system is cost efficient. The prices of On grid power is also staidly rising and the system may pay itself sooner than 20 years. This calculation is made without adding the cost of a linkage to the power grid which is about 1000 € if the house is near the power grid and it will be much higher if the household is further from the grid. The balance in powers of the components on the system may vary according to the geographical location of the household. In an area with more wind activity the power of the wind turbine may be grater that of the photovoltaic system or the power of the system may be smaller if you use other auxiliary systems like a micro hydro plant or the backup generator may run on biogas from a small biogas plant. If the you would use more energy efficient appliances and rationing the energy consumption of big energy consumers the yearly consumption cam be smaller an the size of system can also be smaller. References [1] Houston C., Gyamfi S., Whale J., Evaluation of energy efficiency and renewable energy generation opportunities for small scale dairy farms: A case study in Prince Edward Island, Canada, Renewable Energy, volume 67, July 2014, Pages 20–29 [2] Ding W., Wang L., Chen B., Xu L., Haoxu L., Impacts of renewable energy on gender in rural communities of north-west China, Renewable Energy, volume 69, September 2014, Pages 180–189 [3] Cotana F., Belardi P.,Petrozzi A., TIAR: Renewable Energy Production, Storage and Distribution; A New Multidisciplinary Approach for the Design of Rural Facility, Energy Procedia, volume 45, 2014, Pages 323–332
59
SIMPLIFIED METHODOLOGY FOR MONITORING AND
ASSESSMENT OF THE EFFECT OF ENERGY SAVING MEASURES IN PUBLIC BUILDINGS
Veselka Kamburova , Ruse University; Iliya Iliev , Ruse University; Angel Terziev, Technical University of Sofia
ABSTRACT
The object of the study is development of simplified methodology for monitoring and assessment of the effect of implemented energy efficiency measures in public buildings.
Several EU programs provide funds for the implementation of energy efficiency measures in public buildings. When applied beneficiaries provide energy audits with estimated energy savings based on which base they are selected.
After the implementation of energy efficiency measures in order to justify the savings a monitoring is needed. The report proposes a simple methodology for energy monitoring in buildings with various types of heating - central heating, electricity, light fuel oil, gas and biomass boilers.
The methodology is consistent with the beneficiary’s education background in the field of energy. However the presented methodology gives complete information to verify the foreseen in the audits savings through the introduction of energy efficiency measures.
1. INTRODUCTION
The goal of sustainability in the building sector requires a tremendous effort to reduce energy demand, boost energy efficiency and increase the share of renewable energy sources. According to the analysis made, buildings are one of the largest energy consumers. Summarized data for the European Union show that 40% from the entire energy consumption comes from the 160 million existing buildings in Europe and 3/4 from the consumed energy is used for heating and cooling.
The households and business in Bulgaria consume considerably more energy for heating and cooling compared to other countries in Europe. According to the Agency for Sustainable Energy Development (ASED) the consumption of energy in the housing sector is more than1/3 from the entire energy consumption in the country.
Several EU programs in Bulgaria provide funds for the implementation of energy efficiency measures in public buildings. The main purpose of these measures is to reduce energy demand in the buildings.
2. MEASUREMENT AND VERIFICATION OF ENERGY SAVINGS Energy savings cannot be measured directly. In general, the energy-saving can be
calculated as the difference between the consumption according to the energy efficiency measures (EEM) and the consumption prior to the energy efficiency measures implantation. AES BLEU PREU= − , (1) where AES - annual energy saving, BLEU - baseline energy use or demand, PREU - Post-retrofit energy use or demand.

60
The baseline energy use presents the energy consumption by the building for a certain period in the pre-retrofit period. Selection of the period and duration of the baseline period is an important decision to be made during the savings determination process. The baseline period must end before the period of implementation of the energy efficiency measures so the data for the baseline period must not include any measurements taken during the installation period.
The post-retrofit energy period includes the data for the energy consumption that are collected after the implementation of energy efficiency measures. The defined post-retrofit period is usually called “performance period”, which can vary from about two weeks to 12 months, depending on the type of energy efficiency measures and technology [2].
Power consumption, however, depends on different variables like weather, usage or occupancy of the building, which makes a direct comparison difficult since it might not be obvious if the observed difference is caused because of implementation of energy efficiency measures or other effects. At best case the two periods which is to be compared should have the same conditions (e.g. for the same time of the year with the same weather conditions). Where this cannot be achieved, suitable adjustments have to be made.
AES BLEU PREU A= − − , (2)
where A is the adjustment.
The calculation of baseline can start with short-term or continuous measurements of key operating parameter(s) (sub-metering energy efficiency measures affected system), consumption measurements of the entire building and calibrated simulations.
The methodology to be used for determination of the baseline and to make the necessary adjustments should be easy to implement, deliver accuracy, useful and transparent results and – quite important – has to be adaptable for this type of project.
Measurement and verification (M&V) methods are used to measure and verify, in a defined, rigorous and transparent way, the energy savings resulting from the implementation of energy conservation measures, that have been planned and designed to improve the energy performance of a specific facility or group of facilities. This is done without regard to the energy performance of any facility other than the one at which a change in energy infrastructure is implemented. M&V provides certainty that reported results are real and verifiable.
The four approaches to determining savings use similar concepts in savings computation. They differ in their ways of measuring the actual energy use and demand quantities to be used in savings determination. This clause summarizes the three approaches for determination of energy and demand savings [1, 3].
A. Partially Measured Retrofit Isolation. Savings are determined by partial field measurement of the energy use of the systems to which an energy conservation measure was applied separate from the energy use of the rest of the facility. Measurements may be either short-term or continuous. Partial measurement means that some but not all parameters may be stipulated, if the total impact of possible stipulation errors is not significant to the resultant savings. Detailed review of energy conservation measures design and installation will ensure that stipulated values fairly represent the probable actual value. Stipulations should be shown in the M&V Plan along with analysis of the significance of the error they may introduce. The energy savings are defined through the simple engineering calculations for short term or continuous post-retrofit measurements and stipulations.
B. Retrofit Isolation. Savings are determined by field measurement of the energy use of the systems to which the energy conservation measure was applied separate from the energy use of the rest of the facility. Short-term or continuous measurements are taken throughout the

61
post-retrofit period. The energy savings are obtained by engineering calculations using short term or continuous measurements.
C. Entire Facility. Savings are determined by measuring energy consumed by entire facility level. Short-term or continuous measurements are taken throughout the post-retrofit period. The energy savings are obtained by analysis of whole facility utility meter or sub-meter data using techniques from simple comparison to regression analysis. Energy consumption is defined through the gas and electric utility meters for a twelve month baseline period and throughout the post-retrofit period.
D. Calibrated Simulation. Savings are determined through simulation of the energy consumption of separate measure or the entire facility. The accepted simulation procedures must demonstrate adequately the actual energy consumption in the facility. This option usually requires considerable skill in calibrated simulation. The energy savings are obtained by energy use simulation, calibrated with hourly or monthly utility billing data and/or end-use metering. Multifaceted energy management program affecting many systems operating in a building where no baseline data are available. Post-retrofit period energy consumption is measured by the gas and electric utility meters. Baseline energy consumption is determined by simulation using a model calibrated by the post-retrofit period utility data.
Options A and B focus on the performance of specific ECMs. They involve measuring the energy consumption of systems affected by each ECM separately from the rest of the facility. Option C focuses on the energy savings for the entire facility. Option D is based on simulations of the energy performance of equipment or entire facilities to enable determination of savings when baseline or post-retrofit data are unreliable or unavailable.
3. METHODOLOGY FOR ASSESMENT THE SAVING OF ENERGY
EFFICIENCY MEASURES FOR PUBLIC BUILDINGS
As it was noted above several EU programs in Bulgaria provide funds for the implementation of energy efficiency measures in public buildings. The main purpose of these measures is to reduce energy demand in the buildings. The common measures are as follow:
• Replacement of windows; • Thermal insulation - rehabilitation of walls; • Thermal insulation - rehabilitation of roofs/attics; • Thermal insulation - rehabilitation of floor; • Replacement/modernization of the heating system; • Energy efficient optimization of the electrical system. The four first energy efficiency measures are related with the building envelope which is
composed of walls, floors, roof, doors, and windows. The effect from the implementation of each of those measures and on fifth measure defines the energy needed for heating and cooling.
The baseline for each building is preliminary defined in the prepared energy audits. The energy audits are prepared according on the European Standard ISO 13790:2004 through the specialized software EAB approved by SEDA for Bulgaria. Baseline was calibrated in relation with day degrees for the specific climatic database.
The main purpose of the monitoring is to determine energy savings regardless of the implemented energy efficiency measures.
The authors have extensive experience in the monitoring of the public buildings. The first step of the monitoring procedure is development of M&V. The plan includes the
following activities: • Configuration and testing of the measuring equipment; • Performance of series of tests on-site before installation;
62
• Installing of the equipment at the preliminary selected measuring points; • Performing measurements and data collection; • Checking the availability and reliability of the data collected during monitoring
period; • Testing the performance of the equipment after measurements are completed; • Downloading and processing the data; and • Saving the data on the computer. The following measurements should be performed for 14 days during technical
monitoring period: • Flow rate heat pipe measurements; • Heat pipe temperature measurements (in-flow and out-flow); • U-value measurements; • Boiler efficiency determination; • Indoor temperature measurements; • Outdoor temperature measurements; and • Light intensity measurements. As a result of performed measurements were obtained the data of: daily consumptions of
thermal energy for heating the building, the average daily temperatures in the building, and average daily maximum and minimum outdoor temperatures in the technical monitoring period. The average daily temperature was calculated as a daily average of temperatures in reference rooms.
The indicator of the specific energy consumption per m2 and degree hour (KTM, kWh/m2/DH) was calculated on the base of measurement data. This indicator is generally characterized by thermal-technical features of the observed buildings. Based on this, it is possible to further carry out analyses in terms of:
• comparison with other buildings that have similar purposes; • comparison with the buildings with different structural and environmental
characteristics; • estimate (forecasts) of the consumption of thermal energy for heating reaching
different levels of comfort in the building, different observation periods at different climate conditions.
The annual thermal energy consumption (Qg,а), calculates with the following relation:
, ,. .=g a TM g g aQ K A DH , (3)
where gA - total heated area, ,g aDH - average annual degree hours for the heating season,
TMK - heat transfer coefficient denoting the amount of heat transferred through the walls, windows, doors, and floors of the building.
Under the current methodology the consumption of the thermal energy of the building defines on the base of 14 days monitoring period and further multiplication for the entire heating period.
The Authors’ experience shows that the proposed methodology gives good results and the deviations in determination of the consumed energy are negligible.
A disadvantage of the proposed methodology may be pointed the need of usage of specialized measuring devices and highly educated staff. Hence the relatively high price of the monitoring process.
Concerning current case this methodology is inapplicable because of the great number of buildings and the budget for the monitoring process is limited. It means that the mechanism of

63
obtaining data during measuring period should be simple in order to be accomplished by non-professional in the energy area people.
In this case is very important the type of measuring devices the boiler room is equipped with and the boiler by itself. It is also should be proposed the different methodologies in accordance with specifics in heating the building.
In central heating systems in the boiler room is usually installed heating meter. The data about consumed thermal energy can be obtained directly without additional measuring devices. Collecting data can be performed daily or weekly. It is recommended to record meter readings daily at a certain hour.
When local heating system is available it is easier to measure the consumed amount of fuel (natural gas, LHO or wood pellets) than the consumed amount of energy needed for heating the building. The amount of the consumed fuel can be accounted on a daily bases with gas meter or level of the LFO in the tank. Concerning this the thermal energy supplied to the building needs to be calculated on the base of boiler efficiency and the fuel caloricity. The caloricity of the fuel during the heating season changes insignificantly. The boiler efficiency defines at the beginning of the heating season when adjusting the burner.
The results of the monitoring needed to be filled in the preliminary prepared table (Table 1). Thus can be account the real consumption of heat energy and the amount of fuel for heating the building neglecting the specific terms – thermal comfort and outdoor temperature.
It is highly recommended in the representative rooms in the building to be installed a several temperature sensors. The number of installed temperature sensors in the rooms should be at least equal to number of riser pipes coming from the distributing header. The temperature data need to be stored in the data loggers where the temperature readings are recorded at specified intervals and then averaged. That is the way to determine the daily average temperature.
The data about the outdoor temperature can be obtained either by direct measurements or the closest meteorological station. The temperature sensors measuring the outdoor temperature must not be installed on the facades adjacent to technical rooms, kitchens, heating devices and others where presence of huge amount of heat.
Based on the collected data about the internal and external temperature is possible to be calculated the day degrees then the measurements for the consumed energy are adjusted and the referent consumption of energy can be determined.
,,
.= M g a
g aM
Q DDQ
DD, (4)
The resulting energy consumption for post retrofit period is compared to the base line
identifying energy savings. The obtained results of the energy monitoring should be deeply analyzed and compare
with expected values calculated with the specialized software. In case of significant deviations needs to find the reason.
The most common reasons for deviation from predefined parameters according international experience are:
• Wrong set up of the thermostatic regulator; • Wrong set up of the system for automatic control; • Significant part of the windows that are left open; • Damages in the regulating valves; • Leakages in the distributing network; • Damages in ventilating systems;

64
• Incorrect filling of the heating system causing air pockets into the system and the inability to maintain the indoor air quality and etc.;
In the weekly (manually or automatically) collection of data it is more easily to find the damages in the systems or in the set ups without leading serious financial consequences. This increase the quality of the performed analysis about annual energy consumption and the associated costs.
Table 1: Measurement Data
Data Outside temperature, oC Average inside temperature, oC 1. ........................................
2. ........................................
3..........................................
4..........................................
Heat energy consumption, kWh Fuel consumption, (m3, litters, kg)
3. CONCLUSIONS
The simplified methodology for assessment of savings as a result of implementation of energy efficiency measures in public buildings is presented. The presented methodology is based on the collection of data for the consumed heat energy or amount of fuel and further correction with the information about the actual day degrees calculated after proper measurement of internal and outdoor temperature. The methodology is developed for the Beneficiaries who mostly are not professionals in the field. This methodology is simplified but still gives information about achieved energy savings. References [1] Guidelines for Verifying Existing Building Commissioning Project Savings,
resources.cacx.org/library/holdings/ [2] International Performance Measurement & Verification Protocol Concepts and Options for Determining
Energy and Water Savings, Volume I, International Performance Measurement & Verification Protocol Committee, 2002, DOE/GO-102002-1554
[3] Measurement of Energy and Demand Savings, ASHRAE Guideline 14-2002, ISSN 1041-2336
65
SCHEMES FOR PROJECT FINANCING OF COMBINED HEAT AND POWER PRODUCTION TROUGH BIOMASS GASIFICATION
Veselka Kamburova1, Iliya Iliev2, Angel Terziev3
Summary
The current report aims is to analyze the system for combined heat and power production through biomass gasification system. Special attention is paid on the process of synthetic gas production in the gasifier, its cleaning and further burning in the co-generation unit. A financial analysis is made regarding the investments and profits generated by the combined heat and power production.
A scheme for project financing, characterized by low interest rates, for funding of renewable energy sources by export credit agencies is analyzed. Comparison between the standard funding grant schemes and the project financing schemes was made. The presented conclusions can be used for making important investment decisions on various renewable energy sources projects.
1. INTRODUCTION
Combined heat and power production process also known as cogeneration, is the simultaneous production of thermal and electric energy from a single fuel source (oil, gas, biomass, biogas, coal, etc.). Currently the CHP systems are affordable not only for commercial buildings but also for homeowners. The CHP engines producing electricity that can be internal combustion or Stirling engines. The micro-CHP installations applicable for residential buildings usually run on propane, natural gas, or even solar energy or biomass. The CHP systems offering combined heat and power have efficiency of approximately 90%.
Here is reviewed the CHP system by using biomass as a fuel source. The process of the syngas production is through biomass gasification. Currently such power plants produce up to 100 kW electric energy and 150 kW thermal energy. The calorific value of the syngas produced by the process of biomass gasification reaches up to 11 000 kJ/m3 or more than double the values of autothermal gasification process. The total efficiency of the power plant is 81%, as cold gas efficiency is in the amount of 70%, electrical efficiency is 33% and thermal efficiency is 48%.
2. GENERAL INFORMATION ABOUT CHP POWER PLANT The annual consumption of wood waste is 1,152 tons per year. The wood waste material is
from wood industry. The wood material will be delivered to the plant’s storage. A wheel loader will be used for filling the container (with volume of 12 t) with wood waste. The material will then be delivered by transport belt to each gasifier systems’ hermetic storages (each 12 t load is capable of supplying raw material to the gasifier for 6 to 8 hours). The two gasifiers are filled 1 Ruse, Bulgaria, e-mail: [email protected]; cell phone: +359 885955347 Ruse University 2 Ruse University, Ruse, Bulgaria, e-mail: [email protected]; cell phone: +359 887306898 Ruse University 3 Technical University, Sofia, Bulgaria, e-mail: [email protected]; cell phone: +359 885955183
66
with dry wood material through feeding screws from the biomass storage. The heat needed for pyrolysis is delivered to the gasifier system using air ducts. Before reaching the gasifiers, the air passes through heat exchangers. The temperature of the air reaches up to 600oC accelerating the gasification reaction and decreasing formation of dioxin.
The entire power plant consists of two different size gasifiers. The gasifier system with the capacity of 100 kW consumes 110 kg/hour wood waste and 190 kg/h air generating approximately 298 kg/h biogas. The gasifier for 30 kW installation consumes 34 kg/hour wood waste and 59 kg/h air generating approximately 91 kg/h biogas. The annual wood waste consumption of both gasifiers is 1,152 t/y. Combined, the gasifiers generate approximately 400 kg/h biogas. The components of the biogas generated in the gasifiers are shown on Table 1.
Table 1: Components of the generated biogas
CO H2 CH 4 CO 2 N 2 H 2 O
20-21% 22-23% 1-3% 4-6% 48% 1-3%
The gas components
3. THE PROCESS OF GASIFICATION AND CALCULATION OF ENERGY PRODUCTION
The purpose of the implementation of CHP system is the production of electric energy to be
sold to the local electricity company at a preferential feed in tariff, and the production of thermal energy for selling to a wood waste delivery company and greenhouses.
The raw material is wood waste from the wood industry (branches, tree-tops, trunks, rind peelings and etc.) and wood pellets. The wood waste is delivered from the biomass storage to the gasifier. In bottom of the gasifier, the biomass is burned and in the top part, the biomass is heated for syngas production. Then the syngas is cooled with water before entering the cyclone filter. The cooled syngas passes through a cyclone filter where the hard particles like coke are separated from the gas. The exhaust gases from the burning process are filtered before being cooled. The hard particles, are separated from the syngas, are then returned for burning. The waste products of the chemical cleaning are separated in a settling tank and the particulate residue is returned to the burning chamber, while the remaining ester is delivered to the rinse. The exhaust gases of the gas engine’s burning chamber, after cooling, pass through a cyclone filter where the ashes are separated from the exhaust gases. After filtration the cleaned exhaust gases are mixed with the exhaust gases of the gas engine and the combined exhaust gases are released through the chimney.
Cleaning of the syngas, after the gasifier, is according to the following cleaning system: o Cyclones – used for separation of larger dust particles (98%) from the gas flow leaving the
reactor zone. o Heat exchanger – The gases are cooled by passive cooling tower. The temperature is reduced
from 180oC to 70 oC; o 10-micron filter - The filter for the 30 kW system has 70 m3/h capacity and for the 100 kW
system has 200 m3/h capacity. The filters also separate water and moisture from gases at a rate of 15 ml/h;
o 1-micron filter - The filter is made by INFASTAUB and has a 70 m3/h capacity (for the 30 kW installation) and 200 m3/h capacity (for the 100 kW installation).
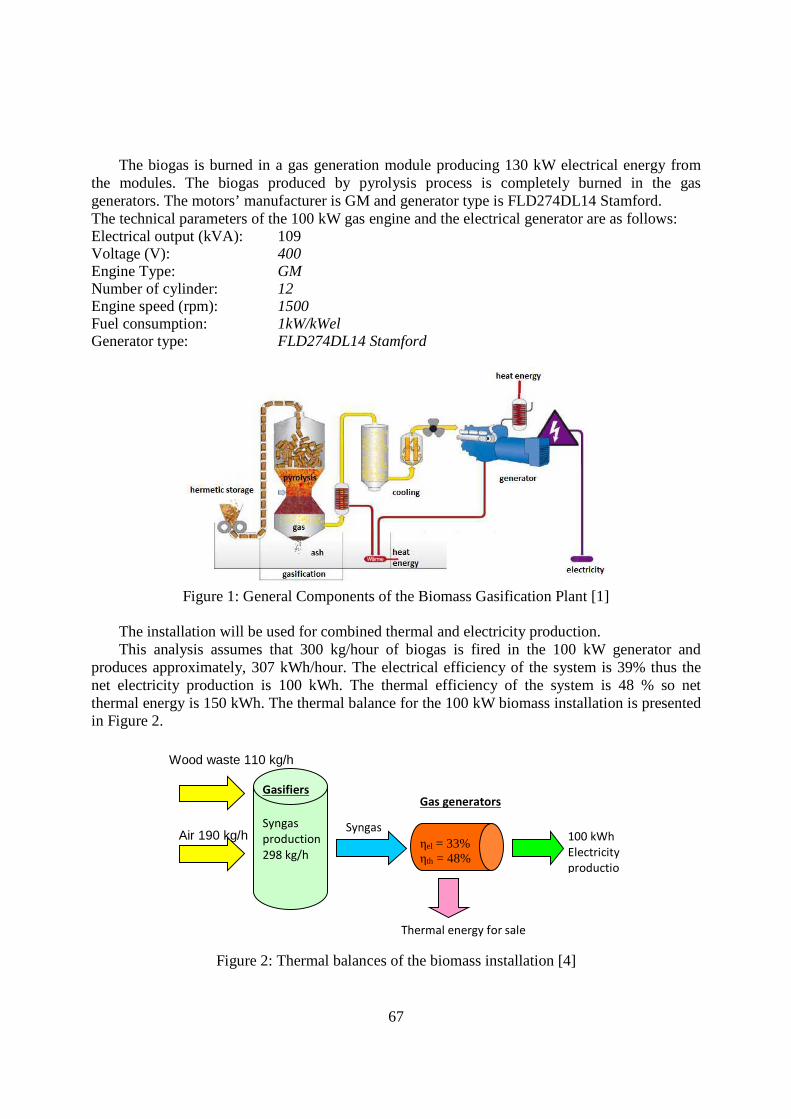
67
The biogas is burned in a gas generation module producing 130 kW electrical energy from
the modules. The biogas produced by pyrolysis process is completely burned in the gas generators. The motors’ manufacturer is GM and generator type is FLD274DL14 Stamford. The technical parameters of the 100 kW gas engine and the electrical generator are as follows: Electrical output (kVA): 109 Voltage (V): 400 Engine Type: GM Number of cylinder: 12 Engine speed (rpm): 1500 Fuel consumption: 1kW/kWel Generator type: FLD274DL14 Stamford
Figure 1: General Components of the Biomass Gasification Plant [1]
The installation will be used for combined thermal and electricity production. This analysis assumes that 300 kg/hour of biogas is fired in the 100 kW generator and
produces approximately, 307 kWh/hour. The electrical efficiency of the system is 39% thus the net electricity production is 100 kWh. The thermal efficiency of the system is 48 % so net thermal energy is 150 kWh. The thermal balance for the 100 kW biomass installation is presented in Figure 2.
Figure 2: Thermal balances of the biomass installation [4]
Wood waste 110 kg/h
Air 190 kg/h
Gasifiers
Syngas
production
298 kg/h
Syngas
Gas generators
ηel = 33% ηth = 48%
Thermal energy for sale
100 kWh
Electricity
productio
68
4. FINANCIAL ANALYSIS
The profitability of a certain project depends not only by the technical parameters but also by the financing scheme. The funding method and the associated costs can sometimes make a good project unattractive to investors and prevent further implementation. On the other hand with suitable financing scheme a project with seemingly unprofitable and accompanied by high risks parameters can be implemented.
To be comparable here it is assumed that the lending period is 8 years (based on the simple payback period – the investment costs are in the amount of 622 500EUR and net savings are in the amount of 88 417 EUR) and the amount of credit is 100% of the investments.
Based on the abovementioned here an analysis of three possible financing schemes concerning the project have been studied and presented.
The first scheme is standard financial scheme with no extra terms for beneficiaries with annual interest rate in the amount of 8.0 %. The second scheme utilizes grant financing with a corresponding incentive of 15 % of the loan and the same financial terms (annual interest rate 8.0%) as first scheme. The third scheme is project financing under the credit line of Exim Bank in as much as the equipment is American.
Ex-Im Bank’s "Renewable Express" is designed to provide streamlined post-completion project financing to small renewable-power producers that meet Ex-Im Bank’s credit standards. This initiative meets the increased demand for financing of small renewable-power transactions.
� Ex-Im Bank's provides medium and long-term direct loans and loan guarantees to international buyers of the US equipment and related services;
� Ex-Im Bank's guarantees coverage for 100% of commercial and political risks; � Ex-Im Bank’s loans and guarantees cover 85% of the US equipment cost and up to 30% of
local project costs (design, construction and installation works) and ancillary services such as financial, legal or local bank fees;
� No limits on transaction size. There is no minimum or maximum limit to the size of the export sale that may be financed with Ex-Im Bank's loan guarantee;
� Products must be shipped from the U.S. to a foreign buyer; � Ex-Im Bank's loans and medium-term guarantees include repayment terms of up to 7 years
for financed amounts of $10 million or less; � Ex-Im Bank's medium-term guarantees and loans for projects that are over $10 million.
Repayment terms are typically up to 10 years, but can be up to 12 years for large power plants and up to 18 years renewable energy and water sector exports;
� Direct Loan Costs • Letter of Interest processing fee - $100 (one-time payment); • An exposure fee based on risk (one-time payment)
Creditworthiness Group of Project Sponsors Medium-Term 7-Years Long-Term 10-years
State Owned Entities and Exceptionally Good Credit Quality Private Entities
4.74% 6.72%
Very Good Credit Quality Entities 5.53% 7.87%

69
Good to Moderately Good Credit Quality Entities 6.59% 9.41%
• Interest rate
Loan Terms Interest Rate
Up to 5 years (including) ≤ 5 years 1.69%
Between 5 and 8.5 years (including) 2.58%
Between 8.5 and 12 years (including) 3.29%
Project financing differs with its substantially lower interest rate (with up to 4-5 percent
points, in comparison with standard financing). Aside from that, the preferential prices of the regulatory organ are reduced with regard to the level of the incentive grant, and furthermore, the reduced price of the purchased electricity from renewable energy sources is effective during the whole period of 15-20 years. Consequently, that is why most companies circumvent grant financing. Below is provided the short financial analysis, concerning the project investments, cash flow generated by the power plant during the period of operation and operational and maintenance costs.
The allocation of sold heat production, electricity production, electricity own needs, wood consumption and O&M cost savings in Figure 3.
Figure 3: Allocation of sold heat production, electricity production, electricity own needs, wood
consumption and O&M cost savings
The revenues from the purchase electricity produced by the power plant according the prices announced in the Resolution No Ц-018/28.06.2012 [3] of SEWRC.
The approximate base project costs are presented in Table 2.
Table 2: Base project costs
70
The investments for the implementation of such systems are in the amount of 1 915 EUR/kW installed capacity.
The financial analysis was made for the abovementioned three financial scheme. The initial data for the analysis are as follow: 100% loan in the amount of EUR 622 500 and the loan is granted for a period of 8 years.
Liquidating plan was prepared for the three financial schemes. In the first funding scheme for a loan of EUR 622 500 for a period of 8 years interest payable amounted to EUR 201 275 or 32.3% of the loan amount;
In the second financial scheme the interest rate remain the same (8%) but in addition as a result of implementation of energy efficiency or renewable energy project 15% incentive grant of the loan is applied. Concerning this for the same loan amount the interest payable amounted to EUR 171 084 or 27.5% of the loan amount.
The last proposed financial scheme employs financing under the credit line of Exim Bank. Based on the terms of the Bank the proposed in the section 4 tables the interest payable amounted to EUR 64 911 (at 2.58% interest rate). The utilization of loan at lowest interest can be compared with obtaining grant in the amount of 67.8% of the loan amount. Even the requested loan to be for a period between 8.5 and 12years (interest rate in the amount of 3.29%) the interest payable amounted to EUR 103 254 or can be compared with obtaining grant in the amount of 58.9% (for a period of 10 years). The summarized results are presented in the table below.
Period, years
Loan amount,
EUR
Interest payable at 8% interest
rate, EUR
Interest payable at 8% interest rate
and 15% incentive, EUR
Interest payable at 2.58%
interest rate, EUR
Interest payable at 3.29%
interest rate, EUR
8 622 500 201 275 171 084 64 911
10 622 500 251 075 213 414 103 255
5. CONCLUSIONS
1. The caloricity of the produced syngas is higher than the gas obtained by the standard
gasification process; 2. Higher efficiency (81%) of the CHP plant (33% electrical and 48% thermal efficiency)
resulted in significant amount of thermal and electricity production, respectively considerable incomes;
3. The presented power plant is compact and has low operational and maintenance costs; 4. The proposed scheme of financing shows definitely better parameters of the project because of
lower interest rate and higher purchase price of electricity due to absence of grant. References [1] Richard Drummond - Legal adviser, office of the general counsel, Export Credits Guarantee Department, UK, Role of Export Credit Agencies in Project Financing, ABA Section of International low, November 2008. [2] Implementation of Renewable Project Producing Heat and Electricity from Wood Waste, Nova Energia Lozen Ltd, March 2013 [3] Resolution NoЦ-018/28.06.2012 of State Energy and Water Regulatory Commission, June 2012

71
PARAMETRIC INVESTIGATION STUDY OF COUNTER-FLOW EVAPORATOR FOR WASTE HEAT RECOVERY
Mahdi Hatf Kadhum Aboaltabooq1, Horatiu Pop, Viorel Badescu, Valentin Apostol, Malina Prisecaru, Cristian Petcu, Cristina Ciobanu
University Politehnica of Bucharest, Faculty of Mechanical Engineering and Mechatronics
ABSTRACT
Organic Rankine cycle system (ORC) may be used to recover waste heat from an internal combustion engine (ICE). The evaporator design in such a system is a very important task. For a successful ORC system, the amount of heat that can be received in the evaporator should be determined. In this paper, the performance of a counter-flow evaporator used to recover exhaust waste heat from a diesel engine is presented. First, depending on the measured data, the exhaust heat of the diesel engine is evaluated. Then, a mathematical model of the evaporator is developed based on the detailed geometry and the specific ORC working conditions. The evaporator is subdivided into three zones, i.e preheater, boiler and superheater. The results show that the percentage heat flux for preheater zone is approximately 47.4% from total heat while for boiler zone it is 38.01% and for superheater zone is 14.59%. Furthermore, the heat transfer rate of each zone is proportional to that of the overall heat transfer rate when the engine operating condition changes. Consequently the percentage area for preheater zone is approximately 71% from the total area while for the boiler zone it is 26%; for superheater zone it is 3 % (in case of evaporation temperature 120oC and superheating degree 10oC). Results were compared with literatures and shows a very good agreement.
1. INTRODUCTION
One of the methods to improve the thermal efficiency of an internal combustion engine is the usage of, Organic Rankine cycles (ORCs) to recover the waste heat. Many studies analyzing the ORC performances have been conducted recently [1–7]. The available heat which is called as waste heat is transferred to the organic working fluid by an evaporator in an ORC, where the organic working fluid changes from a liquid state to a vapor state under a high pressure. Then, the organic working fluid, which has a high enthalpy, is expanded in an expander, and output power is generated. Therefore, the evaporator is an important part of the ORC for an engine waste-heat recovery system. In this study, the parametric investigation of a counter-flow evaporator designed to recover the exhaust waste heat from a diesel engine is evaluated theoretically. The working fluid R245fa is selected as the working fluid. A mathematical model of the evaporator is developed according to the detailed dimensions of the designed evaporator and the specified ORC working conditions.
2. SYSTEM DESCRIPTION
The schematic of an ORC for exhaust heat recovery of a diesel engine is shown in Figure 1. The pressure of fresh air is increased by the compressor. Then, the air enters the engine cylinders, which combusts with the injected fuel. After expanding in the cylinders, the high-temperature gas is exhausted to the turbine to be expanded further. In the turbine outlet, the temperature of the exhaust gas is still high between 170 oC and 480 oC depending on the load variations [8]. This high-temperature waste heat can be use as a heat source for ORC, for
1Splaiul Independenţei 313, Bucharest 060042, Romania and Foundation of Technical Education, Technical College Najaf, Iraq, Tel. 0040734322783, e-mail: [email protected].
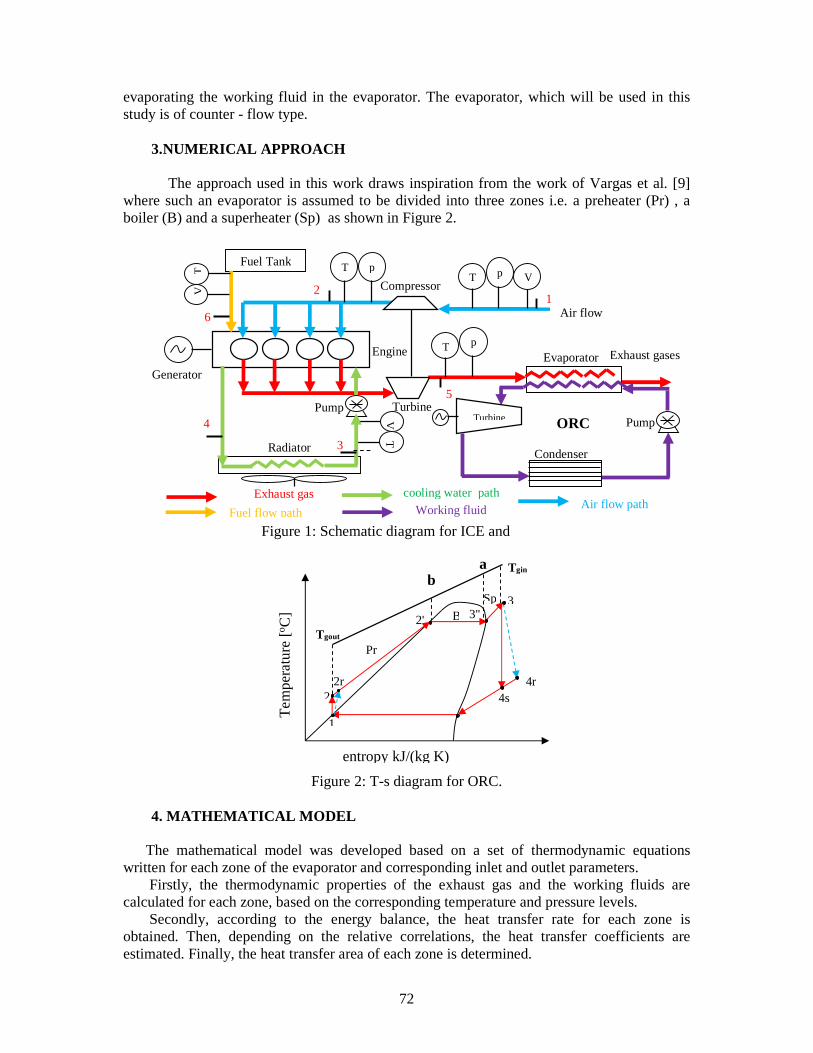
72
evaporating the working fluid in the evaporator. The evaporator, which will be used in this study is of counter - flow type.
3.NUMERICAL APPROACH
The approach used in this work draws inspiration from the work of Vargas et al. [9] where such an evaporator is assumed to be divided into three zones i.e. a preheater (Pr) , a boiler (B) and a superheater (Sp) as shown in Figure 2.
Figure 2: T-s diagram for ORC.
4. MATHEMATICAL MODEL
The mathematical model was developed based on a set of thermodynamic equations written for each zone of the evaporator and corresponding inlet and outlet parameters. Firstly, the thermodynamic properties of the exhaust gas and the working fluids are calculated for each zone, based on the corresponding temperature and pressure levels. Secondly, according to the energy balance, the heat transfer rate for each zone is obtained. Then, depending on the relative correlations, the heat transfer coefficients are estimated. Finally, the heat transfer area of each zone is determined.
2'
a Tgin
Tgout
b
B
Sp
Pr
2r
3''
4r 4s
3
2
1
Te
mpe
ratu
re [o C
]
entropy kJ/(kg K)
Pump
Exhaust gases
Generator
Fuel flow path Working fluid path Figure 1: Schematic diagram for ICE and
ORC
Air flow path cooling water path Exhaust gas
path
Turbine
Compressor
Engine
Pump
Radiator
Air flow
Evaporator
Condenser
ORC
1
T p
p T V
5
2
T p Fuel Tank
T
V
6
V
T 3
4
Turbine
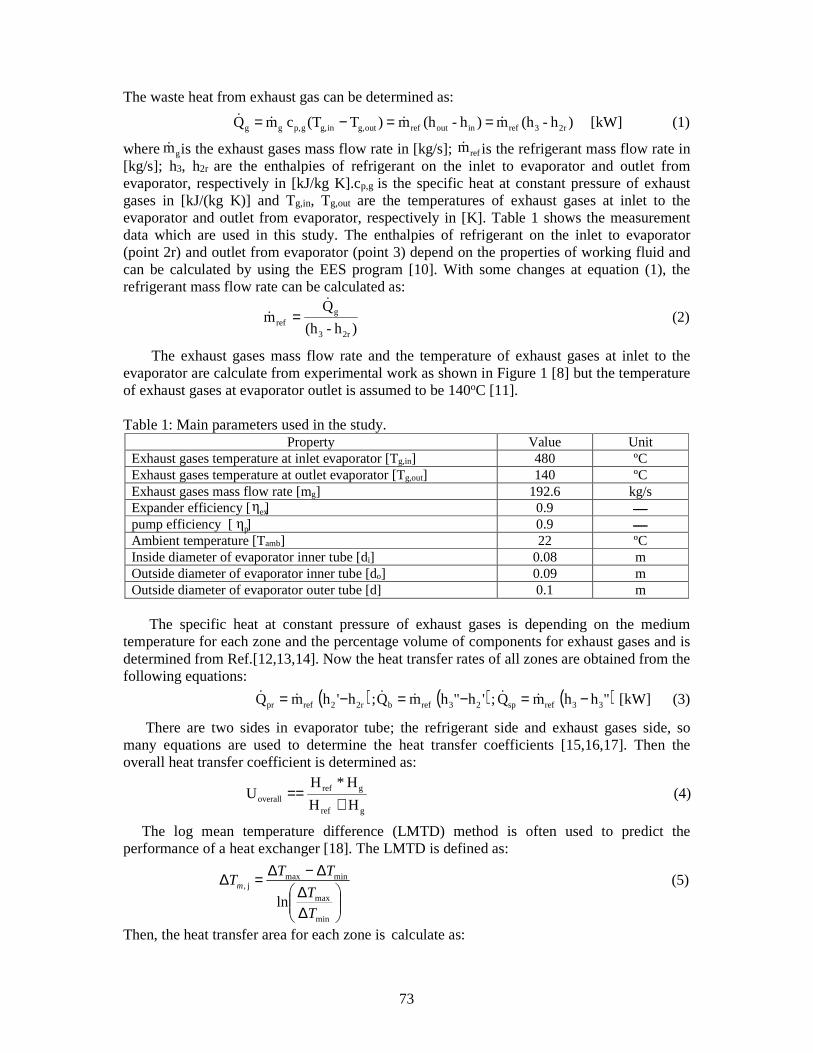
73
The waste heat from exhaust gas can be determined as: where is the exhaust gases mass flow rate in [kg/s]; is the refrigerant mass flow rate in [kg/s]; h3, h2r are the enthalpies of refrigerant on the inlet to evaporator and outlet from evaporator, respectively in [kJ/kg K].cp,g is the specific heat at constant pressure of exhaust gases in [kJ/(kg K)] and Tg,in, Tg,out are the temperatures of exhaust gases at inlet to the evaporator and outlet from evaporator, respectively in [K]. Table 1 shows the measurement data which are used in this study. The enthalpies of refrigerant on the inlet to evaporator (point 2r) and outlet from evaporator (point 3) depend on the properties of working fluid and can be calculated by using the EES program [10]. With some changes at equation (1), the refrigerant mass flow rate can be calculated as: The exhaust gases mass flow rate and the temperature of exhaust gases at inlet to the evaporator are calculate from experimental work as shown in Figure 1 [8] but the temperature of exhaust gases at evaporator outlet is assumed to be 140oC [11]. Table 1: Main parameters used in the study.
Property Value Unit Exhaust gases temperature at inlet evaporator [Tg,in] 480 ºC Exhaust gases temperature at outlet evaporator [Tg,out] 140 ºC Exhaust gases mass flow rate [mg] 192.6 kg/s Expander efficiency [ ] 0.9 ـــــ pump efficiency [ ] 0.9 ـــــ Ambient temperature [Tamb] 22 ºC Inside diameter of evaporator inner tube [di] 0.08 m Outside diameter of evaporator inner tube [do] 0.09 m Outside diameter of evaporator outer tube [d] 0.1 m
The specific heat at constant pressure of exhaust gases is depending on the medium temperature for each zone and the percentage volume of components for exhaust gases and is determined from Ref.[12,13,14]. Now the heat transfer rates of all zones are obtained from the following equations: There are two sides in evaporator tube; the refrigerant side and exhaust gases side, so many equations are used to determine the heat transfer coefficients [15,16,17]. Then the overall heat transfer coefficient is determined as: The log mean temperature difference (LMTD) method is often used to predict the performance of a heat exchanger [18]. The LMTD is defined as: Then, the heat transfer area for each zone is calculate as:
gm &
( ) ( ) ( ) (3) [kW] "hh mQ ; 'h"h mQ; h'h mQ 33refsp23refb2r2refpr −=−=−= &&&&&&
refm &
(2) )h-(h
Qm
2r3
gref
&
& =
(4) HH
H*HU
gref
grefoverall +
==
exη
pη
(1) [kW] )h-(hm )h-(hm )T(Tc m Q 2r3refinoutrefoutg,ing,gp,gg &&&& ==−=
(5)
lnmin
max
minmaxj,
∆∆
∆−∆=∆
T
T
TTTm
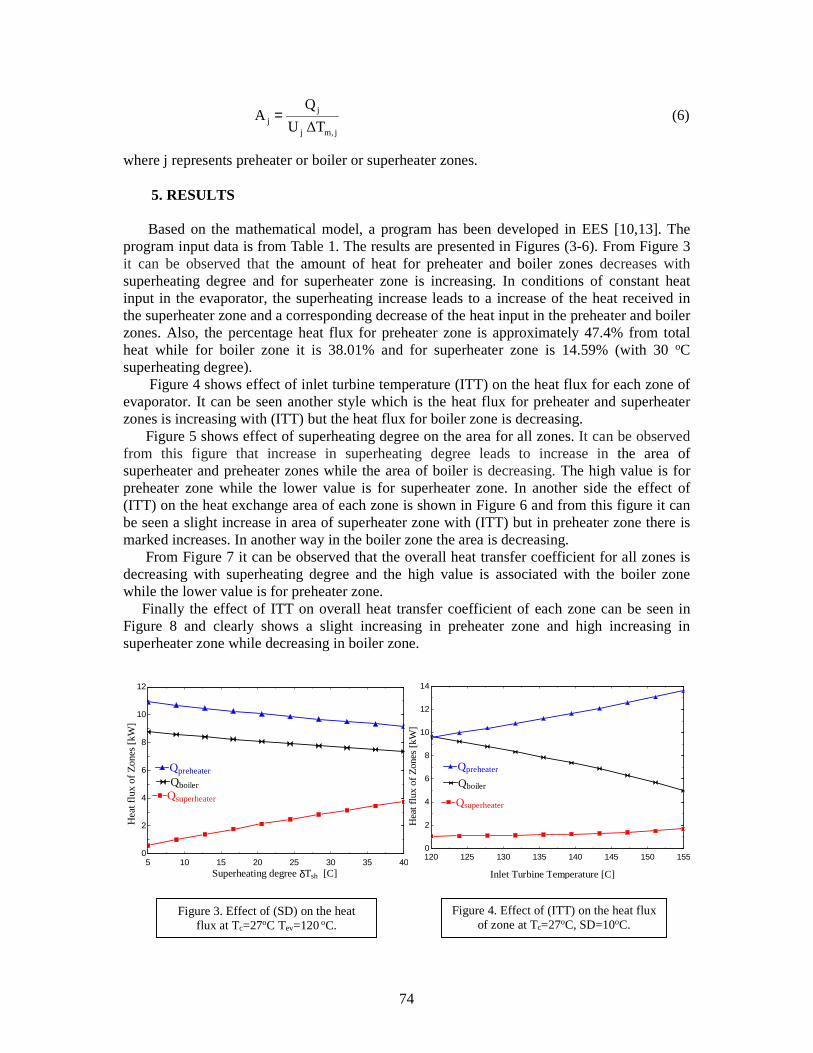
74
where j represents preheater or boiler or superheater zones.
5. RESULTS
Based on the mathematical model, a program has been developed in EES [10,13]. The program input data is from Table 1. The results are presented in Figures (3-6). From Figure 3 it can be observed that the amount of heat for preheater and boiler zones decreases with superheating degree and for superheater zone is increasing. In conditions of constant heat input in the evaporator, the superheating increase leads to a increase of the heat received in the superheater zone and a corresponding decrease of the heat input in the preheater and boiler zones. Also, the percentage heat flux for preheater zone is approximately 47.4% from total heat while for boiler zone it is 38.01% and for superheater zone is 14.59% (with 30 oC superheating degree). Figure 4 shows effect of inlet turbine temperature (ITT) on the heat flux for each zone of evaporator. It can be seen another style which is the heat flux for preheater and superheater zones is increasing with (ITT) but the heat flux for boiler zone is decreasing. Figure 5 shows effect of superheating degree on the area for all zones. It can be observed from this figure that increase in superheating degree leads to increase in the area of superheater and preheater zones while the area of boiler is decreasing. The high value is for preheater zone while the lower value is for superheater zone. In another side the effect of (ITT) on the heat exchange area of each zone is shown in Figure 6 and from this figure it can be seen a slight increase in area of superheater zone with (ITT) but in preheater zone there is marked increases. In another way in the boiler zone the area is decreasing. From Figure 7 it can be observed that the overall heat transfer coefficient for all zones is decreasing with superheating degree and the high value is associated with the boiler zone while the lower value is for preheater zone. Finally the effect of ITT on overall heat transfer coefficient of each zone can be seen in Figure 8 and clearly shows a slight increasing in preheater zone and high increasing in superheater zone while decreasing in boiler zone.
Figure 3. Effect of (SD) on the heat flux at Tc=27oC Tev=120 oC.
5 10 15 20 25 30 35 400
2
4
6
8
10
12
Superheating degree δTsh [C]
Heat
flu
x o
f Z
ones
[kW
]
QboilerQboiler
QpreheaterQpreheater
QsuperheaterQsuperheater
120 125 130 135 140 145 150 1550
2
4
6
8
10
12
14
Inlet Turbine Temperature [C]
QsuperheaterQsuperheater
QpreheaterQpreheater
QboilerQboiler
Heat
flu
x of Z
ones
[kW
]
Figure 4. Effect of (ITT) on the heat flux of zone at Tc=27oC, SD=10oC.
(6) ∆T U
QA
jm,j
jj =

75
6. Comparison
To check the validity of the results, it was necessary to compare the results with literature. The present model and calculation procedure were successfully validated by comparison with results found in Ref. [12]. The input data used in comparison are as follow: The exhaust gases temperature at evaporator outlet is 197 oC ; exhaust gases Temperature at the evaporator inlet is 528 oC; evaporation temperature Tev= 131.5 oC; Degree of superheat is 35 K; Mass flow rate of exhaust gases is 0.188 kg/s. The comparison with Ref.[12] shows very good agreement.
6. CONCLUSIONS
In this study, the heat transfer characteristics of an ORC system combined with diesel engine were analyzed by using measured data such as flue gas mass flow rate and exhaust gas temperature at evaporator outlet. A mathematical model was created and developed with regard to the preheated zone, the boiler zone, and the superheated zone of a counter flow evaporator. The performance of the evaporator was evaluated under variations of superheating degree and inlet turbine temperature. Based on our analysis, the following points can be concluded: 1. The heat transfer rate of the preheated zone is the largest and is more than half of the overall heat transfer rate. The heat transfer rate of the boiler zone is higher than that of the
Figure 5. Effect of (SD) on the area of zone at Tc=27oC Tev=120 oC.
Figure 6. Effect of (ITT) on the area of zones at Tc=27oC, SD=10oC.
Figure 7. Effect of (SD) on the heat transfer coefficient at Tc=27oC Tev=120 oC.
Figure 8. Effect of (ITT) on the heat flux of zone at Tc=27oC, SD=10oC.
120 125 130 135 140 145 150 1550
0.5
1
1.5
2
2.5
3
3.5
4
4.5
AboilerAboiler
ApreheaterApreheater
AsuperheaterAsuperheater
Hea
t e
xch
ang
e ar
ea o
f eva
po
rato
r b
y zo
nes
[m
2 ]
Inlet Turbine Temperature [oC]5 10 15 20 25 30 35 40
0
0.5
1
1.5
2
2.5
3
3.5
4
He
at
exc
han
ge
are
a o
f eva
po
rato
r b
y zo
nes
[m
2 ]
AboilerAboiler
ApreheaterApreheater
AsuperheaterAsuperheater
Superheating degree δTsh [oC]
120 125 130 135 140 145 150 15515
20
25
30
35
40
45
50
55
UsuperheaterUsuperheater
UpreheaterUpreheater
UboilerUboilerO
vera
ll h
eat t
rans
fer
coef
ficie
nt [
W/m2 K
]
Inlet Turbine Temperature[oC]5 10 15 20 25 30 35 40
15
20
25
30
35
40
45
50
55
Ove
rall
hea
t tr
ansf
er c
oef
ficie
nt [
W/m2 K
]
UboilerUboiler
UpreheaterUpreheater
UsuperheaterUsuperheater
Superheating degree δTsh [oC]
76
superheated zone. Furthermore, the heat transfer rate of each zone is proportional to that of the overall heat transfer rate when the engine operates in variable condition. In conditions of constant heat input in the evaporator, the superheating increase leads to a increase of the heat received in the superheater zone ( )and a corresponding decrease of the heat input in the preheater ( ) and boiler zones ( ). Also, the percentage heat flux for preheater zone is approximately 47.4% from total heat while for boiler zone it is 38.01% and for superheater zone is 14.59% (with 30 oC superheating degree). 2. The area of superheater and preheater zones are increased with superheating degree while the area of boiler is decreased with superheating degree and high value was for preheater zone while the lower value was for superheater zone .The percentage area for preheater zone is approximately 71% from total area while for boiler zone it is 26% and for superheater zone it is 3 % (for evaporation temperature 120 oC and superheating degree 10 oC). Acknowledgments One of the authors (M.H.K.Aboaltabooq) acknowledges support from the Iraqi government through grant and the Romanian government through Research grant ,” Hybrid micro-cogeneration group of high efficiency equipped with an electronically assisted ORC”, 1st Phase Report, 2nd National Plan, Grant Code: PN-II-PT-PCCA-2011-3.2-0059, Grant No.: 75/2012. References [1] Kang SH. Design and experimental study of ORC (organic Rankine cycle) and radial turbine using R245fa working fluid. Energy 41 (2012) 514–524. [2] He C, Liu C, Gao H, Xie H, Li Y, Wu S, et al. The optimal evaporation temperature and working fluids for subcritical organic Rankine cycle. Energy 38 (2012) 136–143. [3] Sun J, Li W. Operation optimization of an organic Rankine cycle (ORC) heat recovery power plant. Applied Thermal Engineering 31 (2011) 2032–2041. [4] Wang EH, Zhang HG, Fan BY, Ouyang MG, Zhao Y, Mu QH. Study of working fluid selection of organic Rankine cycle (ORC) for engine waste heat recovery. Energy 36 (2011) 3406–3418. [5] Rentizelas A, Karellas S, Kakaras E, Tatsiopoulos I. Comparative technoeconomic analysis of ORC and gasification for bioenergy applications. Energy Convers Manage 50 (2009) 674–681. [6] Gewald D, Karellas S, Schuster A, Spliethoff H. Integrated system approach for increase of engine combined cycle efficiency. Energy Convers Manage 60 (2012) 36–44. [7] Vélez F, Chejne F, Antolin G, Quijano A. Theoretical analysis of a transcritical power cycle for power generation from waste energy at low temperature heat source. Energy Convers Manage 60 (2012) 188–195. [8]Research Grant,” Hybrid micro-cogeneration group of high efficiency equipped with an electronically assisted ORC”, 1st Phase Report, 2nd National Plan, Grant Code: PN-II-PT-PCCA-2011-3.2-0059, Grant No.: 75/2012. [9] J.V.C. Vargas, J.C. Ordonez, A. Bejan. Power extraction from a hot stream in the presence of phase change, International Journal of Heat and Mass Transfer 43 (2000) 191-201. [10] Engineering Equation solver program from website: http://www.fchart.com/ees/ [11] Panoiu Nicolae, Cazane de abur, Ed. Didactica si pedagogica, Bucuresti (1982). [12] H.G. Zhang, E.H. Wang, B.Y. Fan. Heat transfer analysis of a finned-tube evaporator for engine exhaust heat recovery, Energy Conversion and Management 65 (2013) 438–447. [13] M.H.Kadhum, "Mathematical Modeling Of Organic Rankine Cycle For Waste Heat Recovery From Internal Combustion Engine", scientific 2nd report, University Politehnica of Bucharest, Faculty of mechanical engineering and mechatronics, April (2014). [14] Guopeng Yu, Gequn Shu, Hua Tian, Haiqiao Wei, Lina Liu. Simulation and thermodynamic analysis of a bottoming Organic Rankine Cycle (ORC) of diesel engine (DE). Energy 51 (2013) 281-290. [15] J.P.Holman, Heat Transfer, Tenth edition, Published by McGraw-Hill, New York (2010). [16] H., Kakac S. Heat exchangers; Selection, rating and thermal design. Florida : CRC Press, (2002) . [17] Sun L, Mishima K. An evaluation of prediction methods for saturated flow boiling heat transfer in mini-channels. Sol Energy 52 (2009) 5323–5329. [18] Bergman TL, Lavine AS, Incropera FP, Dewitt DP. Fundamentals of heat and mass transfer. 7th ed. USA: John Wiley & Sons; (2011).
)Q( g&
Qpr&
Qsp&
Qb&

77
AIR QALITY IN ROMANIA. DISPERSION OF POLLUTANT IN A
URBAN AREEA USING CFD SIMULATION
Oliver MĂRUNŢĂLU1, Gheorghe LĂZĂROIU2 University Politehnica of Bucharest, Romania
ABSTRACT
The ambient air quality in Romania is made permanently trough 138 automated stations that are part of National Network for Air Quality (R.N.M.C.A) distributed throughout the country. The following pollutants are taken into consideration when evaluating the air quality: SO2, NO2, NOx, PM10, PM2.5, B, C6H6, CO, O3, As, Cd, Ni, Hg, and HAP. In studies of air quality in rural and urban areas need to know the answers to some basic questions you should ask them. Some of these questions are: What is the contribution of source A to the concentration of pollutants at site B?; What is the most effective strategy for reducing the concentration of pollutants to meet air quality standard?; What will be the air quality tomorrow or in the days following?. In this paper is studied the pollutants dispersion from multiple sources, punctual and mobile, continuous or instantaneous, in an urban area using CFD simulation. Finally presented solutions for reducing emissions in the atmosphere and associated conclusions.
1. INTRODUCTION Romania has the obligation to limit annual emissions of acidification, eutrophication and ozone precursors’ greenhouse pollutants under the values of 918 thousand tons/year of sulphur dioxide (SO2), 437 thousand tons/year for nitrogen oxides (NOx), 523 thousand tons/year for non-methane volatile organic compounds (NMVOC) and 210 thousand tons/year for ammonia (NH3), values that are national emission ceilings. National emission ceilings for sulphur dioxide, nitrogen oxides, volatile and ammonia organic compounds, set for 2011 are those provided in the Protocol to the 1979 Convention on long-range transboundary air pollution, to reduce acidification, eutrophication and troposphere ozone levels, adopted in Gothenburg, on 1st of December 1999, ratified by Law no. 271/2003 and represents the maximum amount of pollutant that can be emitted into the atmosphere at national level in a calendar year. Romania submits annual estimates of emissions of air pollutants covered by Directive no. 2001/81/EC on national emission ceilings for certain atmospheric pollutants (NEC Directive) and the Protocols to the Convention on Long-range Transboundary Air Pollution, done at Geneva on 13th of November 1979 (UNECE/CLRTAP). In this sense, the final national inventory of emissions of sulphur dioxide, nitrogen oxides, volatile organic compounds, ammonia, powders, heavy metals and persisting organic pollutants is drawn up for a period of two years after the present year and the preliminary national inventory of emissions of sulphur dioxide, nitrogen oxides, volatile organic compounds and ammonia is drawn up for the year before the present year. Emissions were also recalculated for the period 2005-2011, using emission factors from the new guide EMEP/EEA 2009, concerning the elaboration of the emission inventories.
1Splaiul Independenţei nr. 313, [email protected], 0743196458

78
1.1. Evolution of SO2, NOx, NMVOC and NH3 emissions for the period 2005-2011
SO2 emissions corresponding to 2011 are characterized by a decrease of about 48.8% compared to 2005; significant decreases occurring in areas like "Burning in the metallurgic industry" (73.07%), and "Production of heat and power "(45.11%). In 2011, the largest contribution to the national total was from the large combustion plants, which are sources of the "Production of heat and power" sector, whose emissions were about 282.882 kt (85.44%). Emissions from burning in the steel industry had a share of 7.13% and those in other industries had a share of 3.94% of the national total.
Figure 1.1 Evolution of SO2, NOx, NMVOC and NH3
emissions for the period 2005-2011
Year Emissions SO2 [kt]
Emissions NOx [kt]
Emissions NMVOC [kt]
Emissions NH3 [kt]
2005 642584 309056 198049 424813 2006 653491 294556 294556 396344 2007 534933 271684 202325 396408 2008 525771 269567 185931 412274 2009 443579 230052 186398 365674 2010 350344 217916 159814 365397 2011 331083 221606 159204 355870
Table 1.1 Evolution of SO2, NOx, NMVOC and NH3 emissions for the period 2005-2011 The total NOx emissions in 2011 amounted to 221.606 kt, compared to 309.056 kt. in 2005. NOx emissions derive especially from the "Road Transport" sector (36.18%) and the "Production of heat and power" (25.77%). NOx emissions calculated for 2011, which saw declines compared to 2005, were the ones from sectors like "Production of heat and power" (40.15%), "Burning in metallurgic industry" (69.6% ) and "Burning in the commercial/institutional sector" (26.57%). Increases in NOx emissions compared to 2005 were recorded in "Burning in the residential sector" (2.17%). NH3 emissions have decreased by 19.61% compared to 2005. During the analyzed period, the highest value was recorded in 2006 (294.556 kt). In 2011, total NH3 emissions were 159.204 kt. Change in emissions from livestock activities is explained by fluctuations in the number of livestock. The most important share in the national total is represented by the manure management from dairy cows breading (22.42%), sows (24.75%) and laying hens (13.71%) and the waste water treatment (9.69%). NMVOC emissions decreased in 2011 compared to 2005 by 16.23%. An increase is noted, mainly due to the "Fugitive emissions coming from natural gas extraction" (33.97%), "Burning in the residential sector" (14.88%). In the year of 2012 the ambient air quality assessment in Romania was made permanently through 138 automated stations that are part of the National Network for Air Quality
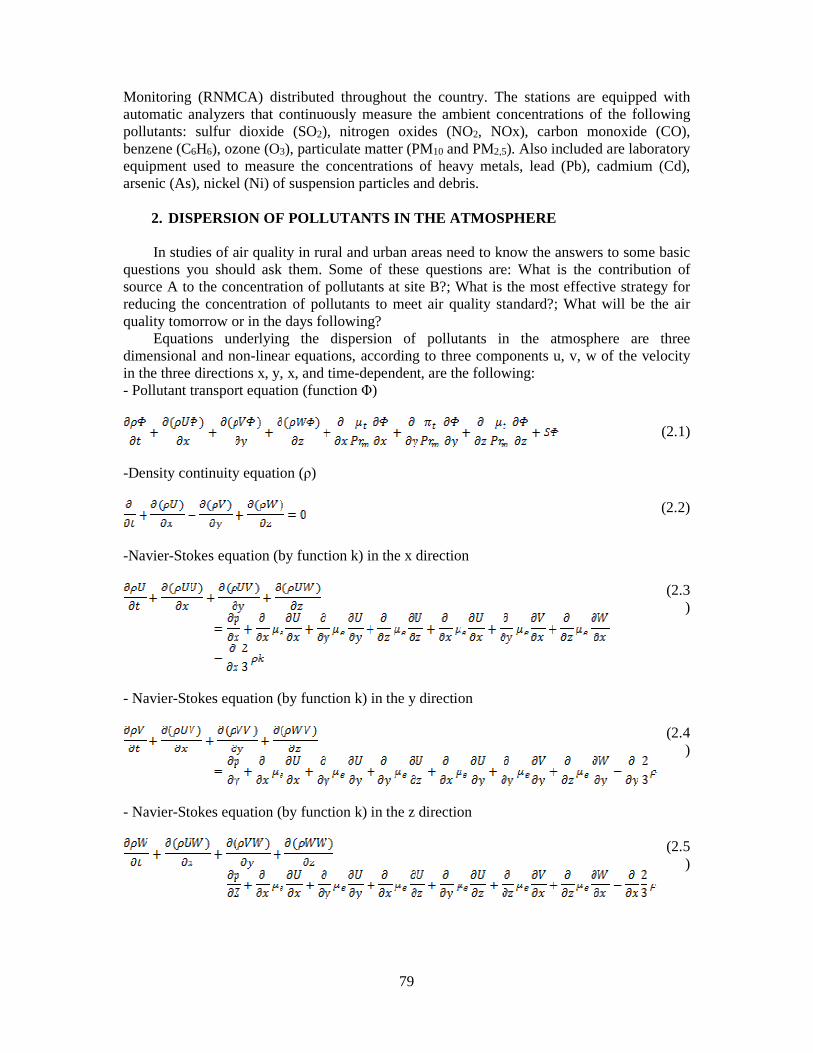
79
Monitoring (RNMCA) distributed throughout the country. The stations are equipped with automatic analyzers that continuously measure the ambient concentrations of the following pollutants: sulfur dioxide (SO2), nitrogen oxides (NO2, NOx), carbon monoxide (CO), benzene (C6H6), ozone (O3), particulate matter (PM10 and PM2,5). Also included are laboratory equipment used to measure the concentrations of heavy metals, lead (Pb), cadmium (Cd), arsenic (As), nickel (Ni) of suspension particles and debris.
2. DISPERSION OF POLLUTANTS IN THE ATMOSPHERE
In studies of air quality in rural and urban areas need to know the answers to some basic questions you should ask them. Some of these questions are: What is the contribution of source A to the concentration of pollutants at site B?; What is the most effective strategy for reducing the concentration of pollutants to meet air quality standard?; What will be the air quality tomorrow or in the days following? Equations underlying the dispersion of pollutants in the atmosphere are three dimensional and non-linear equations, according to three components u, v, w of the velocity in the three directions x, y, x, and time-dependent, are the following: - Pollutant transport equation (function Φ)
(2.1)
-Density continuity equation (ρ)
(2.2)
-Navier-Stokes equation (by function k) in the x direction
(2.3)
- Navier-Stokes equation (by function k) in the y direction
(2.4)
- Navier-Stokes equation (by function k) in the z direction
(2.5)
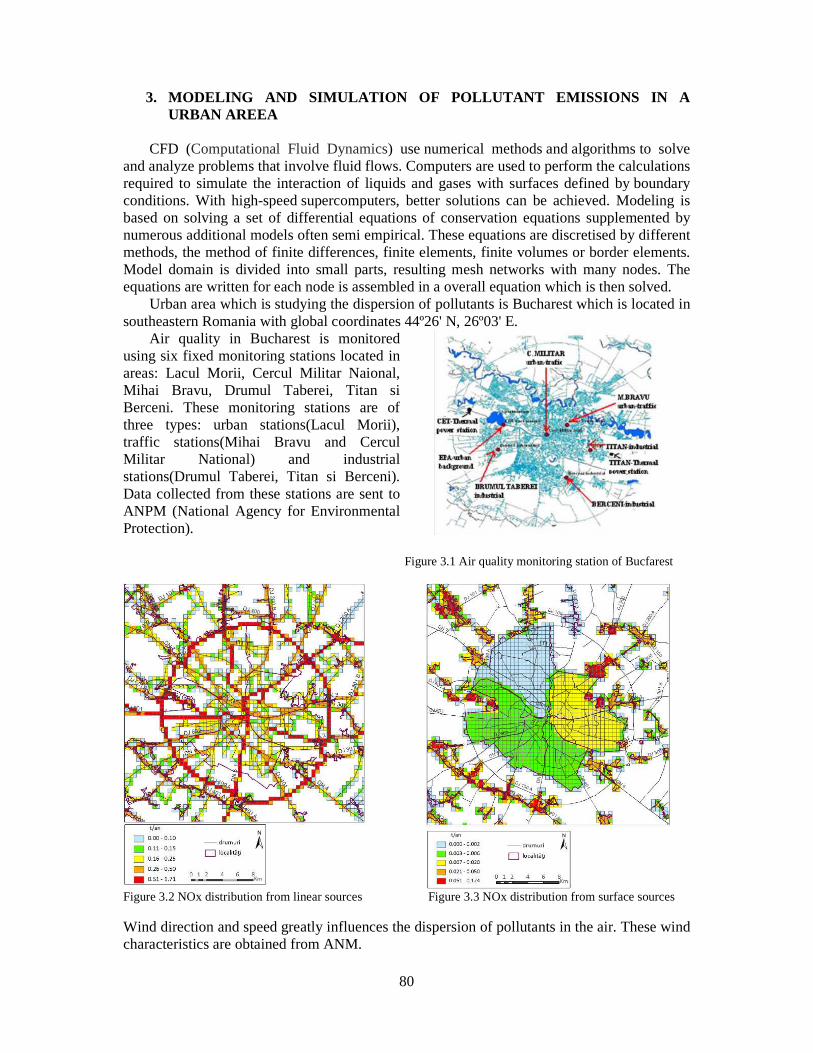
80
3. MODELING AND SIMULATION OF POLLUTANT EMISSIONS IN A URBAN AREEA
CFD (Computational Fluid Dynamics) use numerical methods and algorithms to solve and analyze problems that involve fluid flows. Computers are used to perform the calculations required to simulate the interaction of liquids and gases with surfaces defined by boundary conditions. With high-speed supercomputers, better solutions can be achieved. Modeling is based on solving a set of differential equations of conservation equations supplemented by numerous additional models often semi empirical. These equations are discretised by different methods, the method of finite differences, finite elements, finite volumes or border elements. Model domain is divided into small parts, resulting mesh networks with many nodes. The equations are written for each node is assembled in a overall equation which is then solved. Urban area which is studying the dispersion of pollutants is Bucharest which is located in southeastern Romania with global coordinates 44º26' N, 26º03' E. Air quality in Bucharest is monitored using six fixed monitoring stations located in areas: Lacul Morii, Cercul Militar Naional, Mihai Bravu, Drumul Taberei, Titan si Berceni. These monitoring stations are of three types: urban stations(Lacul Morii), traffic stations(Mihai Bravu and Cercul Militar National) and industrial stations(Drumul Taberei, Titan si Berceni). Data collected from these stations are sent to ANPM (National Agency for Environmental Protection).
Figure 3.1 Air quality monitoring station of Bucfarest
Figure 3.2 NOx distribution from linear sources Figure 3.3 NOx distribution from surface sources Wind direction and speed greatly influences the dispersion of pollutants in the air. These wind characteristics are obtained from ANM.
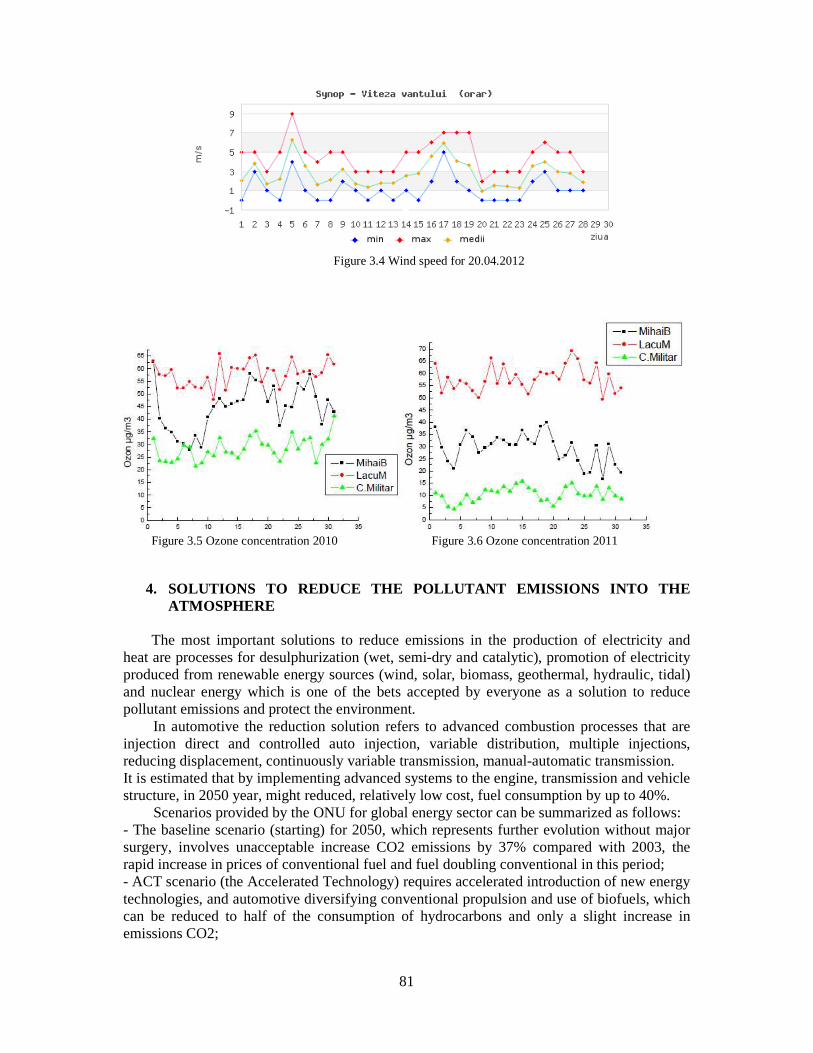
81
Figure 3.4 Wind speed for 20.04.2012
Figure 3.5 Ozone concentration 2010 Figure 3.6 Ozone concentration 2011
4. SOLUTIONS TO REDUCE THE POLLUTANT EMISSIONS INTO THE ATMOSPHERE
The most important solutions to reduce emissions in the production of electricity and heat are processes for desulphurization (wet, semi-dry and catalytic), promotion of electricity produced from renewable energy sources (wind, solar, biomass, geothermal, hydraulic, tidal) and nuclear energy which is one of the bets accepted by everyone as a solution to reduce pollutant emissions and protect the environment. In automotive the reduction solution refers to advanced combustion processes that are injection direct and controlled auto injection, variable distribution, multiple injections, reducing displacement, continuously variable transmission, manual-automatic transmission. It is estimated that by implementing advanced systems to the engine, transmission and vehicle structure, in 2050 year, might reduced, relatively low cost, fuel consumption by up to 40%. Scenarios provided by the ONU for global energy sector can be summarized as follows: - The baseline scenario (starting) for 2050, which represents further evolution without major surgery, involves unacceptable increase CO2 emissions by 37% compared with 2003, the rapid increase in prices of conventional fuel and fuel doubling conventional in this period; - ACT scenario (the Accelerated Technology) requires accelerated introduction of new energy technologies, and automotive diversifying conventional propulsion and use of biofuels, which can be reduced to half of the consumption of hydrocarbons and only a slight increase in emissions CO2;

82
- TECH Plus scenario, the most optimistic, assume for the road transport sector, the use of bio-fuels and hydrogen fuel cells and will reduce 16% of CO2 emissions and maintaining the consumption of hydrocarbons at current levels, despite the rapid growth of the vehicle fleet.
5. CONCLUSIONS Air quality in recent decades was changed therefore should not be neglected, we have to bring solutions to improving it because the air is very important factor for the existence of life. Need to support energy production by renewable energy. LIST OF ABBREVIATIONS AND ACRONYMS ANM AGENTIA NATIONALA DE METEOROLOGIE ANPM AGENTIA NATIONALA PENTRU PROTECTIA MEDIULUI CFD COMPUTATIONAL FLUID DYNAMICS NMVOC COMPUSI ORGANICI VOLATILI NONMETANICI R.N.M.C.A RETEAUA NATIONALA DE MONITORIZARE A CALITATII AERULUI References [1] Agentia Nationala pentru Protectia Mediului www.anpm.ro . [2] Administratia Nationala de Meteorologie www.anm.ro . [3] Parlamentul României. “Legea nr. 104/15.06.2011 privind calitatea aerului înconjurator.” In: Monitorul Oficial al Romaniei, Partea I 452 (June 2011). [6] Caracterizarea meteorologică a anului 2012 în România - Administraţia Naţională de Meteorologie . [7] Strategia Națională a României privind Schimbările Climatice 2013-2020 - Ministerul Mediului și Schimbărilor Climatice. [8] Inventarul Național al Emisiilor de Gaze cu Efect de Seră 2013 (INEGES-2013) - Ministerul Mediului și Schimbărilor Climatice.

83
RESULTS ON THE 18 T/H BOILER OPERATION IN S.C. VRANCART S.A.
Lucian Mihăescu1, Ionel Pîşă1, Ion Oprea1, Gabriel Negreanu1,
Adrian Adam2, Cristian Mândrean2, Ion Bărbieru2, Romeo Rusu3, Romeo Sava3
1. INTRODUCTION
VRANCART S.A. Adjud is one of the most important producers of corrugated cardboard, paperboard and tissue paper in Romania, with over 35 years of activity in this field. The heating system from VRANCART S.A. is equiped with a stream boiler of 18 t/h nominal flow rate and 5 bar nominal pressure, with solid fuel resulted from manufacturing processes and with natural gas as support fuel.
The initial project was requested by S.C. VRANCART S.A. Adjud from the necessity to eliminate the soil and underground water pollution due to storage of sludge and waste byproducts from production process on dump, in order to recover biomass energy from sludge and waste.
The boiler is designed for the following operating modes: -mixed supply, constantly with dried sludge/dried waste and natural gas (support combustion + addition to boiler load);
-sludge + gas supply, or waste + gas supply, avoiding sludge + waste + gas supply whitch does not allow a stable combustion to maintain the boiler performance;
-only gas supply was also taken into account. The pressure body of the boiler consists of a horizontal mono-block and with fume
tubes construction with three gas pass and a submerged entry chamber. It mainly consists of a welded layer between two tubular plaques; in this assembly there are mounted flame tubes and smoke pipes.
The first gas path having heat exchange consists of the flame tubes – the focus, of Ø 1200 mm external diameter. The convection part of the boiler consists of second gas path composed of smoke pipes, welded between front tubular plaque and intermediate tubular plaque of the boiler.
The combustion chamber for solid fuel is placed under the (cilindrical) pressure body, inside walled antefocus, made of refractory brick. The turning back chamber is a welded construction, uncooled and sealed, placed in the lower part of the cylindrical pressure body; it allows the exit for gas from second path and the passage to the air preheater. The main combustion installation includes the grate with push forward and consists of three monoblock burners mounted above the grate. The three burners are monoblock type, having the thermal power P = 4000 kW.
The grate is made of steel profiles, on which the cross elements made of refractory iron are based. In the lower part of the slanted grate there is a horizontal grate.
Behind the boiler there is mounted the air preheater, and after there is the exhauster for hot gas which extracts the gas resulted in combustion, through pipes to several cyclone, preheater and then exit to the chimney of the power plant.
1 University Politehnica of Bucharest, Faculty of Mechanical Engineering and Mechatronics 2 ICEMENERG Bucharest 3 SC VRANCART SA

84
The primary air fun is installed on the air preheater; it suckes the combustion air and blowes that under the slanted grate. The preheated air flows through pipes to below grate. Preheated air flow is adjusted with three flaps and another flap between the air preheater and secondary air fan.
The secondary combustion installation consists of two monoblock burners on natural gas with continuous adjustment of air – fuel, having each of them the thermal power P = 10000 kW and being installed in the back side of the slanted grate, at the 2,8 m level.
By design, the boiler had the main role in thermal waste treatment, burning sludge with moisture content of 40% with natural gas support.
2. TESTS AND CALCULATIONS
The measurements determinate the combustion performance, the temperatures in the
focus and on the masonry walls, also the boiler efficiency, if an operating regime agreed. The operating conditions included a solid fuel flow of 1450 kg/h, consisting of: -850 kg/h of sludge with moisture content of 40%; -400 kg/h waste; -200 kg/h of polyethylene waste. The calorific value of the solid fuel was calculated based on the following
composition: -sludge, with a calorific value of 5780 kJ/kg and the mass ratio of 55%; -waste, with a calorific value of 15100 kJ/kg and the mass ratio of 25%; -polyethylene waste, with the mass ratio of 20%. The polyethylene with the composition (C2H4)nH2 has a calorific value of 37700 kJ/kg.
With this composition, the calorific value of the solid fuel has resulted as 14450 kJ/kg. The natural gas flow was determined at a load of 60 %, 5% and 59 % for the burners
installed in the combustion chamber. The natural gas flow was in this case of 496 Nm3/h, compared to the total obtainable flow of 1200 Nm3/h (41,33 % load). Each secondary burner was charged at 5% load, making a total flow of 200 Nm3/h, compared to the total obtainable flow of 2000 Nm3/h (10% load). The measurements on the operatin mode during the tests shown:
-the input temperature in the secondary burners of 950-10500C -the outlet temperature from the boiler for combustion gases: tev = 148 – 150 0C; -the air excess at the end of furnace: λf = 0,97; -massive emissions of carbon monoxide at the end of focus: CO=18000-20000 ppm; -increasing of the air excesse up to the air preheater: λPA = 2,39 and up to the exit from boiler: λev = 2,58, values manifested by burning carbon monoxide to the value of 12-13 ppm; -the temperature measured by pyrometer of 1150°C in the first third of the layer on the grate, of 1350-1370°C for the final combustion on the grate and of 1100-1200°C for the brick at the turning back chamber.
The unburnt content in the discharged material from the focus, as ICEMENERG’s samplings and determinations, was 8,32%. The method used is STAS 10274/15-1975. The value is usual for such combustion technology. The air deficiency measured at the end of the focus required a verification of the calculation for the air required by the combustion. This stoichiometric air deficiency has the value of 1040 Nm3/h and it will be compensated by an additional injection. We recommend an injection of air into the last third of the grate with 1300 Nm3/h, at an air excess of 1,25. Currently, the operating conditions considered by the owner of the boiler include:

85
-operating with a solid fuel made of sludge, waste and polyethylene waste, having a calorific value of 14450 kJ/kg; -a medium flow for solid fuel of 1450 kg/h; -a charge for natural gas burners placed in furnace of 40-45%; -a charge for secondary natural gas burners of 10-15%; -temperatures resulted at input in the secondary burners of 950-10000C, with maintenance of the minimum value; -the flow of the air under the grate of 80-90% compared with project value; -increasing the life time of the refractory brick by using 60A type, which has the compressive deformation temperature of 14500C. The calculated value of the efficiency for the operating mode was 80,7%. We see that
the value for the efficiency is the same as the project value, so the operating mode proposed by VRANCART S.A. is an acceptable regime because it provides an efficiency very close to the project.
Figure 1 Variation of the project efficiency with the fuel moisture
After proposed retrofitting, it is mentioned that the estimated operating period between two repairs will increases at about 4 months, which is an acceptable economic stage for the currrentcondition of the boiler.
According to the contract, S.C. VRANCART S.A. Adjud sent to ICEMENERG two mobile plates from combustion grate, an unused plate (marked PN) and an old plate which was deformed and fractured during operating (marked PV), in order to analyze the state of metallic material and eventually to detect the causes of deformation and cracking durin operation.For both plates there were made visual checks (macroscopic) and dimensional measurements and samples were taken for chemical analysis, metallographic analysis and Brinell hardness tests.
The results of complete chemical analysis on both plates are shown in the table no. 1 and in the test reports of the UPB-CCEEM-ECOMET: no. 100 EOS/14.03.2014 (PV) and no. 101 EOS /14.03.2014 (PN),
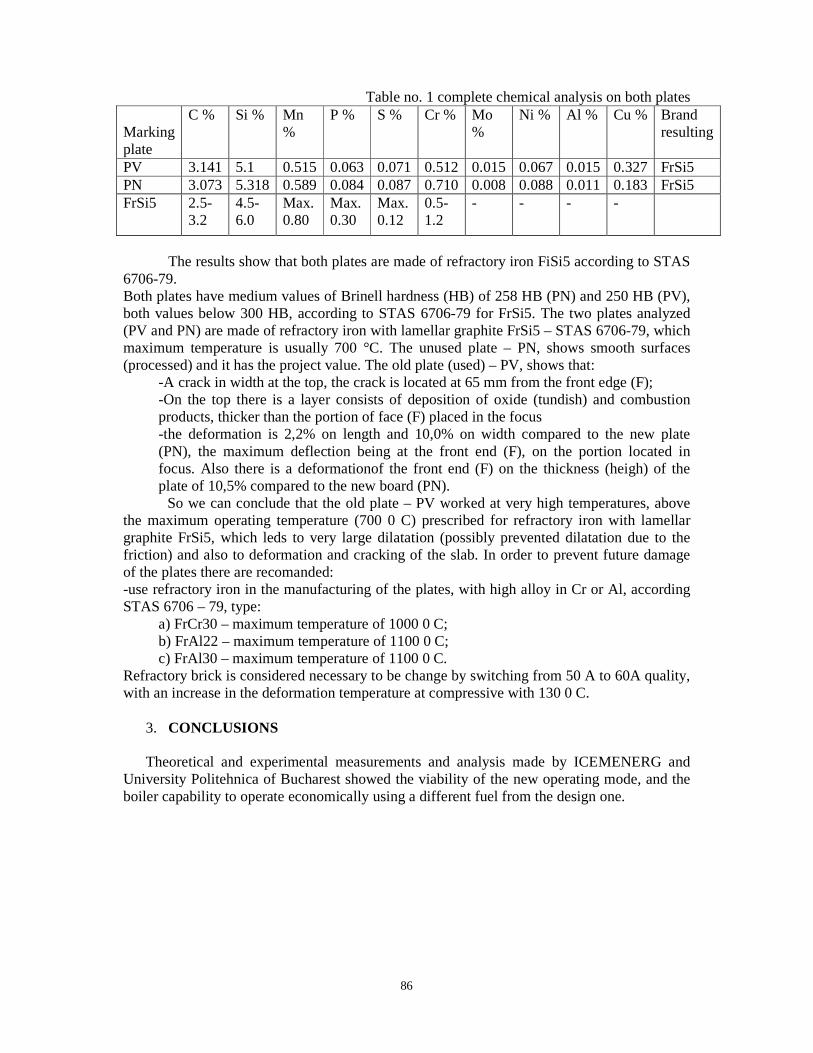
86
Table no. 1 complete chemical analysis on both plates Marking plate
C % Si % Mn %
P % S % Cr % Mo %
Ni % Al % Cu % Brand resulting
PV 3.141 5.1 0.515 0.063 0.071 0.512 0.015 0.067 0.015 0.327 FrSi5 PN 3.073 5.318 0.589 0.084 0.087 0.710 0.008 0.088 0.011 0.183 FrSi5 FrSi5 2.5-
3.2 4.5-6.0
Max. 0.80
Max. 0.30
Max. 0.12
0.5-1.2
- - - -
The results show that both plates are made of refractory iron FiSi5 according to STAS
6706-79. Both plates have medium values of Brinell hardness (HB) of 258 HB (PN) and 250 HB (PV), both values below 300 HB, according to STAS 6706-79 for FrSi5. The two plates analyzed (PV and PN) are made of refractory iron with lamellar graphite FrSi5 – STAS 6706-79, which maximum temperature is usually 700 °C. The unused plate – PN, shows smooth surfaces (processed) and it has the project value. The old plate (used) – PV, shows that:
-A crack in width at the top, the crack is located at 65 mm from the front edge (F); -On the top there is a layer consists of deposition of oxide (tundish) and combustion products, thicker than the portion of face (F) placed in the focus -the deformation is 2,2% on length and 10,0% on width compared to the new plate (PN), the maximum deflection being at the front end (F), on the portion located in focus. Also there is a deformationof the front end (F) on the thickness (heigh) of the plate of 10,5% compared to the new board (PN).
So we can conclude that the old plate – PV worked at very high temperatures, above the maximum operating temperature (700 0 C) prescribed for refractory iron with lamellar graphite FrSi5, which leds to very large dilatation (possibly prevented dilatation due to the friction) and also to deformation and cracking of the slab. In order to prevent future damage of the plates there are recomanded: -use refractory iron in the manufacturing of the plates, with high alloy in Cr or Al, according STAS 6706 – 79, type:
a) FrCr30 – maximum temperature of 1000 0 C; b) FrAl22 – maximum temperature of 1100 0 C; c) FrAl30 – maximum temperature of 1100 0 C.
Refractory brick is considered necessary to be change by switching from 50 A to 60A quality, with an increase in the deformation temperature at compressive with 130 0 C.
3. CONCLUSIONS Theoretical and experimental measurements and analysis made by ICEMENERG and
University Politehnica of Bucharest showed the viability of the new operating mode, and the boiler capability to operate economically using a different fuel from the design one.

87
RESEARCH AND EXPERIMENTAL ANALYSES CONCERNING THE INCREASE EFFICIENCY OF SOLID BIOMASS COMBUSTION IN
HYDROGEN JET
Lucian Mihăescu1, Gheorghe Lăzăroiu, Ionel Pîşă, Elena Pop, Gabriel Negreanu, Universitatea Politehnica Bucuresti
ABSTRACT
The paper analyzes the experimental combustion efficiency of solid biomass in the form of willow chips in hydrogen jet (gas enriched in hydrogen - HRG). The experiments has been performed on a 2 MW boiler from the Polytechnic University of Bucharest. We used a 600 kW burner with HRG injection in the supply pipe for willow chips. The main contribution of the hydrogen consisted in a massive reduction of CO, mainly because of a higher combustion rate.
1. INTRODUCTION
An inovative and efficient technology for burning solid biomass as willow is the combustion in air jet. This technology allows the combustion of solid biomass in form of chips, as was harvested. We distinguish the following aspects related of efficiency:
- no need for mechanical processing for willow after harvest; - increased thermal power that recommand the process for energy production; - a swift and efficient combustion. Typically, the CO emission is quite high for solid biomass combustion, regardless of
technology. Combustion in a stream of hydrogen, with a thermal participation up to 8% allows to control CO emissions, at the end of furnace reaching the generally accepted values of max 100 ppm.
Achieving high power plants using solid biomass involves compliance with the environmental protection regulations. CO is the main pollutant that must be removed; consequently, the combustion of solid biomass with hydrogen is an effective way to solve this problem.
2. WILLOW COMBUSTION EFFICIENCY IN JET OF AIR AND HYDROGEN
Combustion of solid biomass in airflow is similar with pulverized coal combustion.
Consequently, the combustion chamber (the furnace) will be equipped with a suitable burner. In our previous research, two burners of 600 and 620 KW have been built.
Hydrogen was introduced with the willow chips in the burner, resulting a perfect blend between solid phase, air and hydrogen. The analysis of safety concluded that the continuous supply system of hydrogen and solid fuel besides the high speed air jet into the furnace does not allow for the return of the hydrogen flame. The return of the flame may be possible due to the poor burn rate between hydrogen and biomass.
Figure 1 shows a scheme of the solid biomass burner and the hydrogen (HRG) injection.
1University Politehnica of Bucarest, 313 Splaiul Independentei st. 060042 Bucharest, Romania; tel: +404029158; E-mail: [email protected]
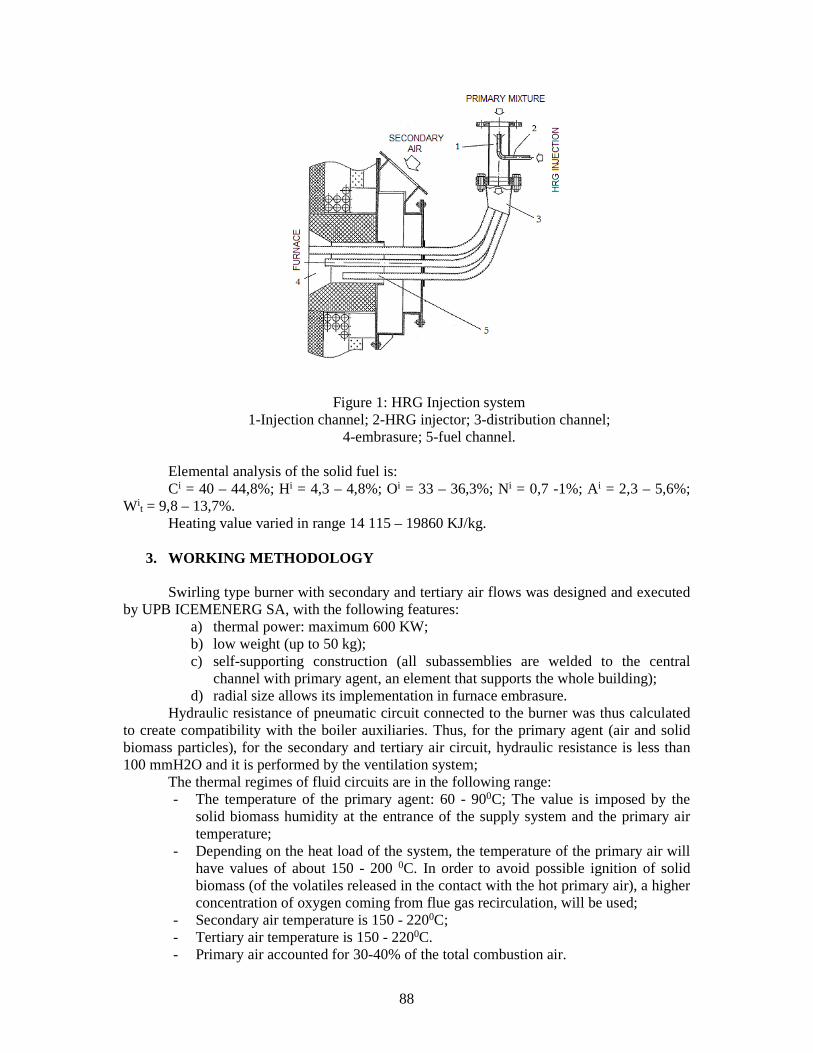
88
Figure 1: HRG Injection system 1-Injection channel; 2-HRG injector; 3-distribution channel;
4-embrasure; 5-fuel channel.
Elemental analysis of the solid fuel is: Ci = 40 – 44,8%; Hi = 4,3 – 4,8%; Oi = 33 – 36,3%; Ni = 0,7 -1%; Ai = 2,3 – 5,6%;
Wit = 9,8 – 13,7%.
Heating value varied in range 14 115 – 19860 KJ/kg.
3. WORKING METHODOLOGY Swirling type burner with secondary and tertiary air flows was designed and executed by UPB ICEMENERG SA, with the following features:
a) thermal power: maximum 600 KW; b) low weight (up to 50 kg); c) self-supporting construction (all subassemblies are welded to the central
channel with primary agent, an element that supports the whole building); d) radial size allows its implementation in furnace embrasure.
Hydraulic resistance of pneumatic circuit connected to the burner was thus calculated to create compatibility with the boiler auxiliaries. Thus, for the primary agent (air and solid biomass particles), for the secondary and tertiary air circuit, hydraulic resistance is less than 100 mmH2O and it is performed by the ventilation system;
The thermal regimes of fluid circuits are in the following range: - The temperature of the primary agent: 60 - 900C; The value is imposed by the
solid biomass humidity at the entrance of the supply system and the primary air temperature;
- Depending on the heat load of the system, the temperature of the primary air will have values of about 150 - 200 0C. In order to avoid possible ignition of solid biomass (of the volatiles released in the contact with the hot primary air), a higher concentration of oxygen coming from flue gas recirculation, will be used;
- Secondary air temperature is 150 - 2200C; - Tertiary air temperature is 150 - 2200C. - Primary air accounted for 30-40% of the total combustion air.
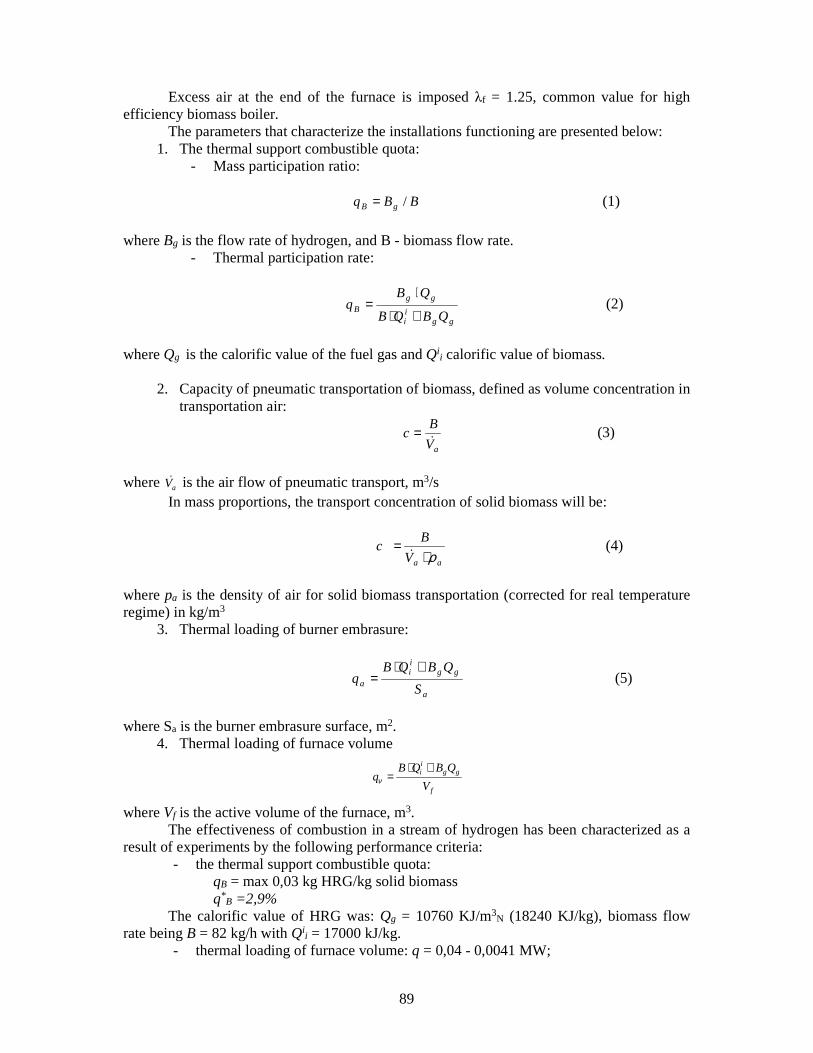
89
Excess air at the end of the furnace is imposed λf = 1.25, common value for high efficiency biomass boiler.
The parameters that characterize the installations functioning are presented below: 1. The thermal support combustible quota:
- Mass participation ratio: BBq gB /= (1)
where Bg is the flow rate of hydrogen, and B - biomass flow rate.
- Thermal participation rate:
gg
ii
ggB
QBQB
QBq
+⋅
⋅= (2)
where Qg is the calorific value of the fuel gas and Qi
i calorific value of biomass.
2. Capacity of pneumatic transportation of biomass, defined as volume concentration in transportation air:
aV
Bc
&= (3)
where aV& is the air flow of pneumatic transport, m3/s In mass proportions, the transport concentration of solid biomass will be:
aaV
Bc
ρ⋅=
& (4)
where pa is the density of air for solid biomass transportation (corrected for real temperature regime) in kg/m3
3. Thermal loading of burner embrasure:
a
ggii
a S
QBQBq
+⋅= (5)
where Sa is the burner embrasure surface, m2.
4. Thermal loading of furnace volume where Vf is the active volume of the furnace, m3.
The effectiveness of combustion in a stream of hydrogen has been characterized as a result of experiments by the following performance criteria:
- the thermal support combustible quota: qB = max 0,03 kg HRG/kg solid biomass q*
B =2,9% The calorific value of HRG was: Qg = 10760 KJ/m3
N (18240 KJ/kg), biomass flow rate being B = 82 kg/h with Qi
i = 17000 kJ/kg. - thermal loading of furnace volume: q = 0,04 - 0,0041 MW;
f
ggii
V
QBQBq
+⋅=ν

90
As the thermal load may be raised to values of 0.1 - 0.12 MW, results the possibility of charging of the furnace with a volume of 10 m3, with two burners having increased flow rate up to 120 kg/h
- the pneumatic transportation capacity; The solid biomass mass concentration in the transportation air was: c = 0,24 kg/m3 and
c* = 0,19 kg/kg - during the tests, the air excess value was:
O2 = 1,2 – 6,6% λ = 1,06 – 1,45
- the carbon monoxide emission was: CO = 20 – 40 ppm
This value is incontestable lower comparing to the layer burning technology. The NOx emission was NOx = 375 – 387 mg/m3.
4. CONCLUSIONS
The burner operating parameters recommends a transportation air flow rate of 25-35
m/s, for secondary air, about 30 - 35 m/s and for tertiary air, about 30 - 35 m/s The designed burner successfully achieved the rated thermal power 620 KW, for a
solid biomass flow capacity of 80 – 85 kg/h and 4 m3N/h gas HRG. It is recommended a
proportion for transportation air of about 35 – 40%. The flame had high brilliancy aspect and filled the entire furnace volume. Under the
influence of HRG, the burning was stable and the emissions were low. The CO emission, which is high when using layer burning biomass, was extremely low, under 40 ppm, when using suspension burning solid biomass. This aspect offers an advantage to suspension burning of solid biomass as also the possibility of higher power archievements.
Experiments have shown that hydrogen is more effective in reducing CO emissions than natural gas or LPG. Considering the economical aspects related to the use of hydrogen, can be specified that because of its very low proportions, will not act as a financial inhibitor.
Acknowledgement This work was supported by a grant of the Romanian National Authority for Scientific
Research, CNDI-UEFISCDI, PN-II-ID-PCE-2011-3-0698.
References
[1] Mihăescu, L., Pîşă, I., Negreanu, G., Berbece, V., „Arderea pulverizată a tocăturii de biomasă – premisă pentru producerea de energie electrică”, rev. Energetica [2] Mihăescu, L. E. Pop, M. E. Georgescu, G. Lăzăroiu, I. Pişă, G.P. Negreanu, C. Ciobanu „Testing of a 620 KW burner for sawdust in suspension and gas enrichen in hydrogen (HRG), 2th International Conference of Thermal Equipment, Renewable Energy and Rural Development, TE-RE-RD 2013, Baile Olanesti, 20-22 June 2013. [3] Prisecaru, T., Petcu, C., Prisecaru, M., Pop, E., Ciobanu, C., Pîşă, I. „Co-combustia cărbunelui cu gaz îmbogăţit în hidrogen (HRG) pp 145-149, a IX Conferinţă Naţională de Echipament Termomecanic Clasic şi Nuclear şi Energetică Urbană şi Rurală, Bucureşti, 25 iunie 2010, ISSN 1843-3359 [4] Mihăescu, L., Prisecaru, T., Georgescu, M., Lăzăroiu, Gh., Oprea, I., Pîşă, I., Pop, E., Berbece, V.,”Construction and testing of a 600 KW burner for sawdust in suspension”, COFRET12, 11-13 June Sozopol, Bulgarie
91
THEORETICAL ANALYSIS OF IMPACT OF THE SOLID BIOMASS COMBUSTION IN HYDROGEN JET
IN DEVELOPING NEW INNOVATIVE TECHNOLOGIES
Lucian Mihăescu1, Tudor Prisecaru, Gheorghe Lăzăroiu, Ionel Pîşă, Elena Pop, Gabriel Negreanu, Manuela-Elena Georgescu, Viorel Berbece, Malina Prisecaru
University Politehnica of Bucharest
ABSTRACT
The experience and positive results obtained in combustion of solid biomass with hydrogen allowed the development of innovative technologies for renewable solid fuels. Two concepts for efficient combustion of solid biomass with hydrogen have been developed: combustion in a tunnel burner attached to a low thermal power boiler respectively combustion in complex power plants comprising gas-producing, internal combustion engine, steam boiler and steam turbine.
1. INTRODUCTION
Experimental researches on solid biomass combustion efficiency with hydrogen intake
have been conducted in the laboratory of fuels and combustion installations from the University Politehnica of Bucharest. The research has been focused on two technologies for wood chips combustion (sort 0-30 mm), in compacted form or in stream of air. The first technology is an application of fluidized bed combustion, fluidizing taking place only in a room located in the furnace, and the second has similarities with the combustion in pulverized condition.
The research focused particularly on the combustion efficiency for the sort 0-30 mm wood biomass or willow chips, in order to reduce costs on its additional machining after harvest (sort 0-30 mm resulting either once with harvesting or later after harvest).
The use of hydrogen was evaluated from the point of view of reducing flame length and reducing carbon monoxide emissions by experimental research [1].
By use of hydrogen to support the combustion of solid biomass has been achieved excellent performance, particularly in reducing the emission of carbon monoxide by 30 - 100 times. CO emissions were below 40 ppm for all cases tested. Burning rate of wood biomass minced to 0-30 mm was 17 m/s, a very high value. 2. INNOVATIVE TECHNOLOGIES FOR EFFICIENT COMBUSTION OF SOLID BIOMASS
From the results of experimental research concerning solid biomass combustion in hydrogen jet, two innovative technologies have been proposed.
a) The combustion of solid biomass with hydrogen in a tunnel or in a combustion chamber
located before the furnace of the boiler.
1University Politehnica of Bucarest, 313 Splaiul Independentei st. 060042 Bucharest, Romania; tel: +404029158; E-mail: [email protected]
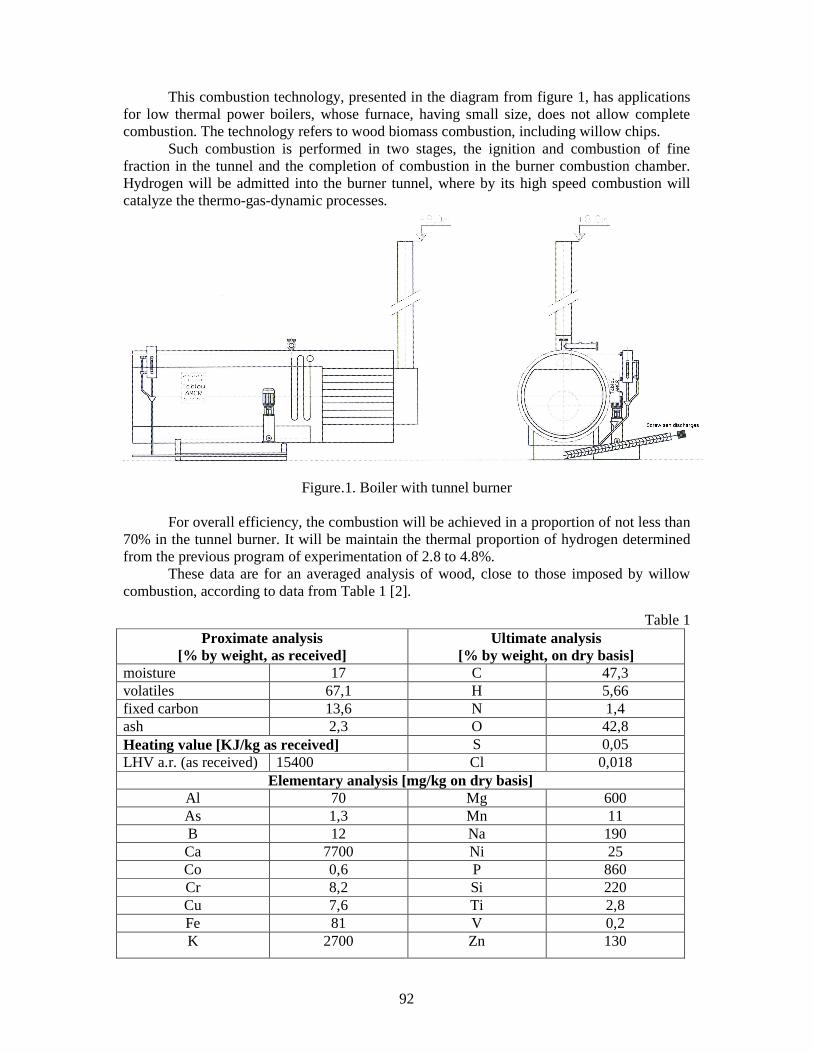
92
This combustion technology, presented in the diagram from figure 1, has applications for low thermal power boilers, whose furnace, having small size, does not allow complete combustion. The technology refers to wood biomass combustion, including willow chips.
Such combustion is performed in two stages, the ignition and combustion of fine fraction in the tunnel and the completion of combustion in the burner combustion chamber. Hydrogen will be admitted into the burner tunnel, where by its high speed combustion will catalyze the thermo-gas-dynamic processes.
Figure.1. Boiler with tunnel burner
For overall efficiency, the combustion will be achieved in a proportion of not less than 70% in the tunnel burner. It will be maintain the thermal proportion of hydrogen determined from the previous program of experimentation of 2.8 to 4.8%.
These data are for an averaged analysis of wood, close to those imposed by willow combustion, according to data from Table 1 [2].
Table 1 Proximate analysis
[% by weight, as received] Ultimate analysis
[% by weight, on dry basis] moisture 17 C 47,3 volatiles 67,1 H 5,66 fixed carbon 13,6 N 1,4 ash 2,3 O 42,8 Heating value [KJ/kg as received] S 0,05 LHV a.r. (as received) 15400 Cl 0,018
Elementary analysis [mg/kg on dry basis] Al 70 Mg 600 As 1,3 Mn 11 B 12 Na 190 Ca 7700 Ni 25 Co 0,6 P 860 Cr 8,2 Si 220 Cu 7,6 Ti 2,8 Fe 81 V 0,2 K 2700 Zn 130
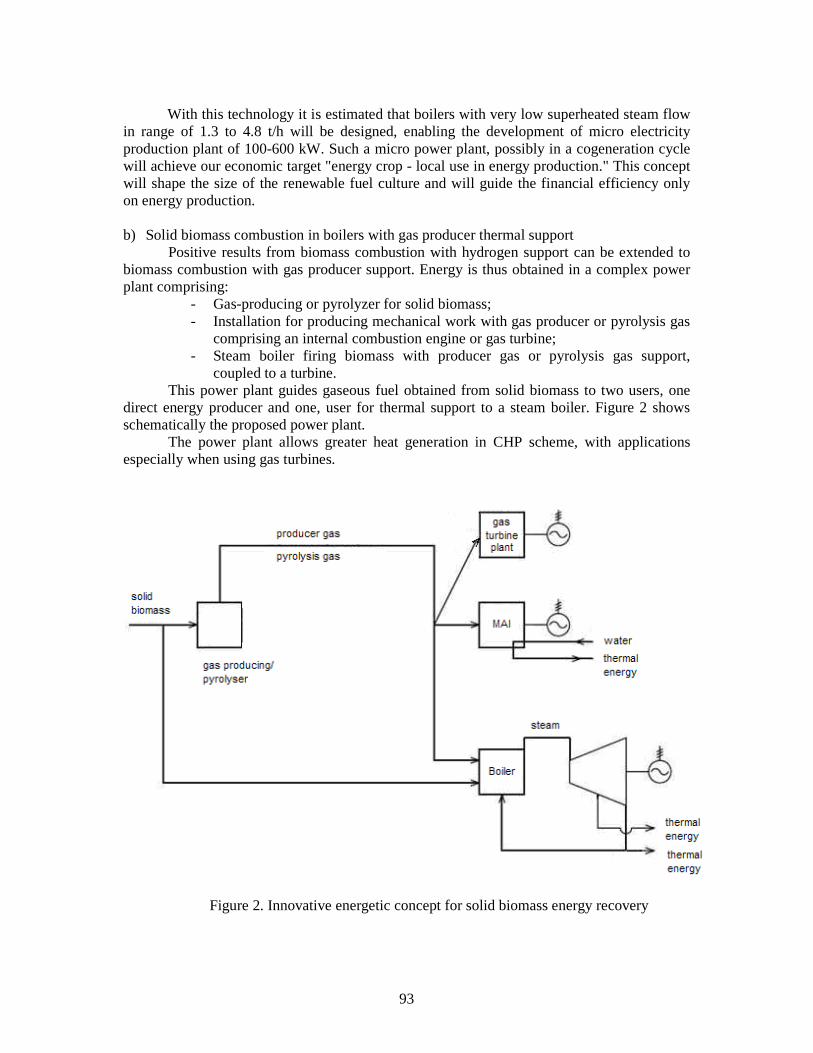
93
With this technology it is estimated that boilers with very low superheated steam flow
in range of 1.3 to 4.8 t/h will be designed, enabling the development of micro electricity production plant of 100-600 kW. Such a micro power plant, possibly in a cogeneration cycle will achieve our economic target "energy crop - local use in energy production." This concept will shape the size of the renewable fuel culture and will guide the financial efficiency only on energy production.
b) Solid biomass combustion in boilers with gas producer thermal support
Positive results from biomass combustion with hydrogen support can be extended to biomass combustion with gas producer support. Energy is thus obtained in a complex power plant comprising:
- Gas-producing or pyrolyzer for solid biomass; - Installation for producing mechanical work with gas producer or pyrolysis gas
comprising an internal combustion engine or gas turbine; - Steam boiler firing biomass with producer gas or pyrolysis gas support,
coupled to a turbine. This power plant guides gaseous fuel obtained from solid biomass to two users, one
direct energy producer and one, user for thermal support to a steam boiler. Figure 2 shows schematically the proposed power plant.
The power plant allows greater heat generation in CHP scheme, with applications especially when using gas turbines.
Figure 2. Innovative energetic concept for solid biomass energy recovery
94
3. CONCLUSIONS The combustion of solid biomass has not only positive results for majority technologies of combustion on grate. The hydrogen support, a gas with high combustion rate, theoretically and experimentally has proved to be very beneficial. Starting from this result, there are proposed two combustion technologies that consider a minimum processing of solid biomass for burning.
First innovative combustion technology proposed aims to achieve its highest proportion before the boiler furnace in order to be implemented to low power installations. The second innovative technology proposes achievement of power plants for solid biomass combustion, with gasification or pyrolysis in parallel with burning installations both for gaseous fuel and solid biomass.
Acknowledgement This work was supported by a grant of the Romanian National Authority for Scientific
Research, CNDI-UEFISCDI, PN-II-ID-PCE-2011-3-0698. References [1] Mihăescu, L. E. Pop, M. E. Georgescu, G. Lăzăroiu, I. Pişă, G.P. Negreanu, C. Ciobanu „Testing of a 620
KW burner for sawdust in suspension and gas enrichen in hydrogen (HRG), 2th International Conference of Thermal Equipment, Renewable Energy and Rural Development, TE-RE-RD 2013, Baile Olanesti, 20-22 June 2013.
[2] J. Boyd,”Energy from Willow” SAC, West Mains Road, Edinburgh Eh 9 3JG, UK, The Scottish Agricultural College, December 2000
95
THE EXPERIMENTAL ANALYSIS ON THE INFLUENCE OF AIR FILTER, OIL FILTER AND OIL ON THE PERFORMANCE OF THE
INTERNAL COMBUSTION ENGINE
Marius Daniel Muscalagiu1, Alexandru Mihai Dima, Cosmin Gabriel Muscalagiu University of Craiova, Faculty of Mechanics
ABSTRACT
In case of a long period of parking of a car engine and non usage of it, its integral parts wich have
capstan-turned surfaces may bee atacked by corrosion and the properties of oil and gas may decrease. That is the reason why it is recommended that the engine shoulb be booted from time to time after shorts periods of idling. When an internal combustion engine parked for a long period of time the first parts that are affected in their perfomance are the air filter, oil filter, fuel filter, oil and coolant fluid. In this article we present a methodology that would allow an experimental analysis of air filter, fuel filter performance and fuel performance also.
1. INTRODUCTION
Previous studies in the field of internal combustion engines were focused
mainly on reducing the wear and the fuel consumption during the function period of those engines. There are few researches about the effect of a log period of parking on the internal combustion engine. In this experiment we intend to study the possibility of reducing the engine wear and the fuel consumption as the idling of an engine can cause serious damage to the power system, to the cooling system and to the road-crank mechanism.
The engine is a technical system able to transform any form of energy into mechanical power. If the initial energy is obtained by burning a fuel-air mixture the engine is called heat engine (combustion engine) [1], [2].
The performances of internal combustion engines are characterized by the existence of several areas on charge and in relative movement some towards others. Under these circumstances it is necessary to reduce the frictional effects on the surfaces and to spread among them a fluid that would adhere to surfaces and to be a sliminess one; this way the pressure that occurs would maintain the surfaces to a certain distance [1], [2], [6].
Fuel filters have a particular significance in the function of an engine because they block the pollutants form the fuel in order to ensure the best performance of an engine. Hole injector clogging due to the deposits of pollutants in the fuel is a major problem to an engine because it decreases its power and increases fuel consumption [3], [4], [5], [7].
Air filter is an important component of an engine as every engine has one since the earliest models and all have the same goal to clean up the air before it reaches the intake and the engine. Besides the methodology herein this article our purpose is to analyse the following experiment set out on a Volkswagen Golf VI 1,4MPI 80 CP engine, fuel consumption, gasses emission coming from the internal combustion and the functional parameters of the engine : speed, position of throttle valve coolant fluid temperature, intake air temperature and inlet pressure. These experiments presented in the article are the first step to further analysis of air filters, fuel filters and fuel properties in case of a long period of parking
1Craiova, 0720064495, [email protected]
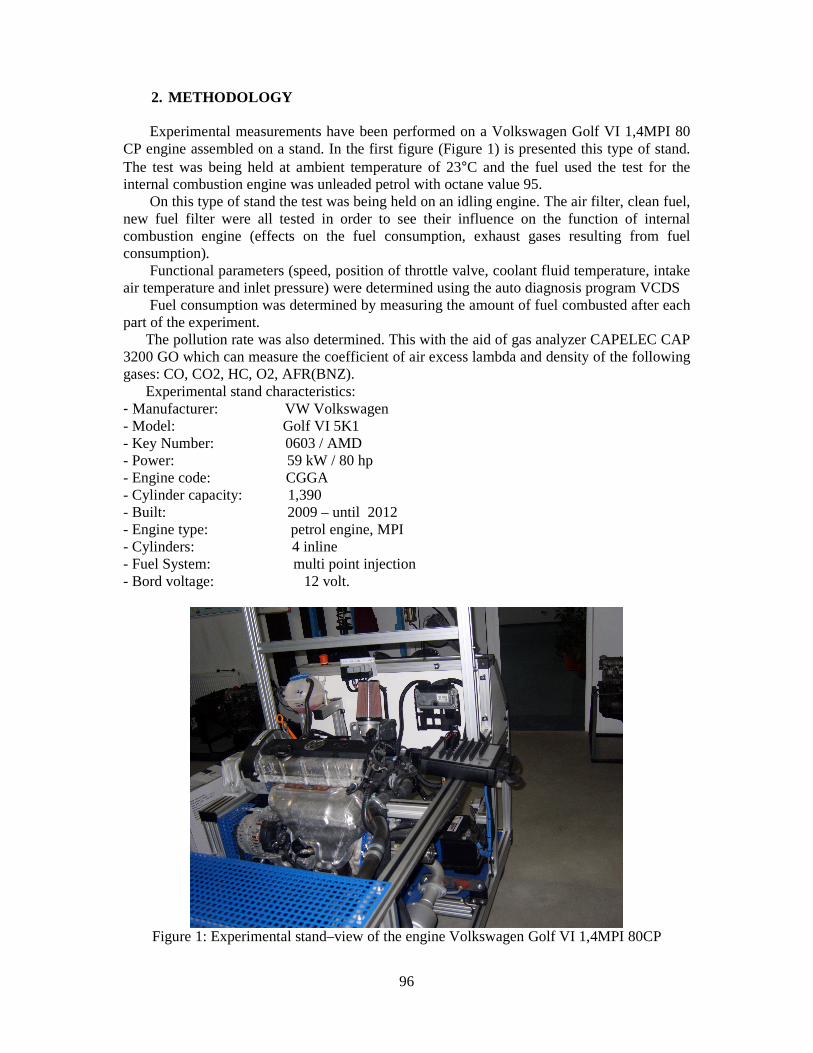
96
2. METHODOLOGY Experimental measurements have been performed on a Volkswagen Golf VI 1,4MPI 80
CP engine assembled on a stand. In the first figure (Figure 1) is presented this type of stand. The test was being held at ambient temperature of 23°C and the fuel used the test for the internal combustion engine was unleaded petrol with octane value 95.
On this type of stand the test was being held on an idling engine. The air filter, clean fuel, new fuel filter were all tested in order to see their influence on the function of internal combustion engine (effects on the fuel consumption, exhaust gases resulting from fuel consumption).
Functional parameters (speed, position of throttle valve, coolant fluid temperature, intake air temperature and inlet pressure) were determined using the auto diagnosis program VCDS
Fuel consumption was determined by measuring the amount of fuel combusted after each part of the experiment.
The pollution rate was also determined. This with the aid of gas analyzer CAPELEC CAP 3200 GO which can measure the coefficient of air excess lambda and density of the following gases: CO, CO2, HC, O2, AFR(BNZ).
Experimental stand characteristics: - Manufacturer: VW Volkswagen - Model: Golf VI 5K1 - Key Number: 0603 / AMD - Power: 59 kW / 80 hp - Engine code: CGGA - Cylinder capacity: 1,390 - Built: 2009 – until 2012 - Engine type: petrol engine, MPI - Cylinders: 4 inline - Fuel System: multi point injection - Bord voltage: 12 volt.
Figure 1: Experimental stand–view of the engine Volkswagen Golf VI 1,4MPI 80CP
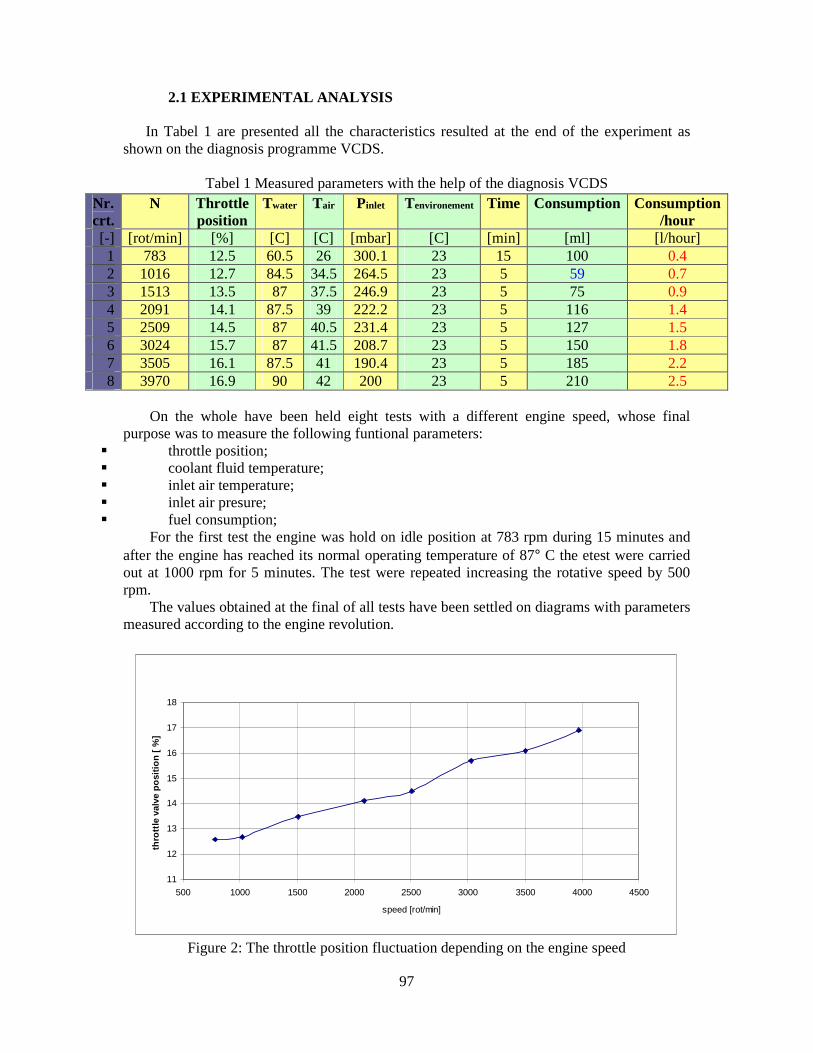
97
2.1 EXPERIMENTAL ANALYSIS In Tabel 1 are presented all the characteristics resulted at the end of the experiment as
shown on the diagnosis programme VCDS.
Tabel 1 Measured parameters with the help of the diagnosis VCDS
On the whole have been held eight tests with a different engine speed, whose final
purpose was to measure the following funtional parameters: � throttle position; � coolant fluid temperature; � inlet air temperature; � inlet air presure; � fuel consumption;
For the first test the engine was hold on idle position at 783 rpm during 15 minutes and after the engine has reached its normal operating temperature of 87° C the etest were carried out at 1000 rpm for 5 minutes. The test were repeated increasing the rotative speed by 500 rpm.
The values obtained at the final of all tests have been settled on diagrams with parameters measured according to the engine revolution.
11
12
13
14
15
16
17
18
500 1000 1500 2000 2500 3000 3500 4000 4500
speed [rot/min]
thro
ttle
val
ve p
osi
tio
n [
%]
Figure 2: The throttle position fluctuation depending on the engine speed
Nr. crt.
N Throttle position
Twater Tair Pinlet Tenvironement Time Consumption Consumption /hour
[-] [rot/min] [%] [C] [C] [mbar] [C] [min] [ml] [l/hour] 1 783 12.5 60.5 26 300.1 23 15 100 0.4 2 1016 12.7 84.5 34.5 264.5 23 5 59 0.7 3 1513 13.5 87 37.5 246.9 23 5 75 0.9 4 2091 14.1 87.5 39 222.2 23 5 116 1.4 5 2509 14.5 87 40.5 231.4 23 5 127 1.5 6 3024 15.7 87 41.5 208.7 23 5 150 1.8 7 3505 16.1 87.5 41 190.4 23 5 185 2.2 8 3970 16.9 90 42 200 23 5 210 2.5
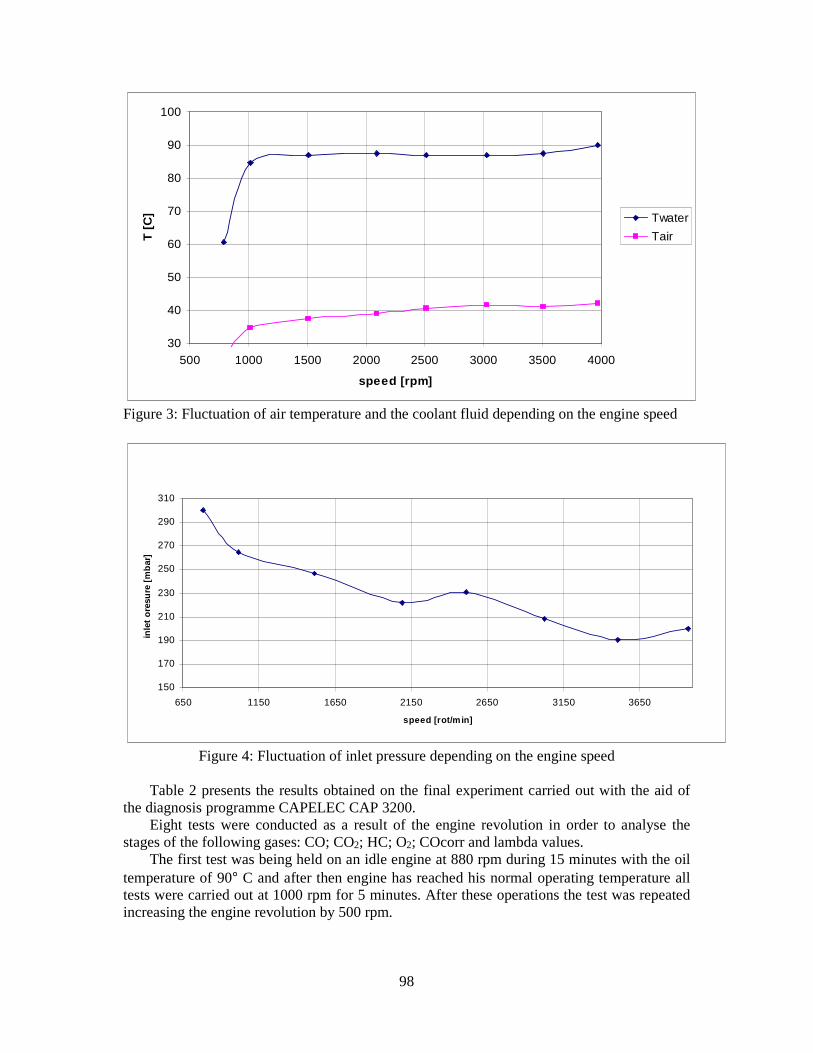
98
30
40
50
60
70
80
90
100
500 1000 1500 2000 2500 3000 3500 4000
speed [rpm]
T [
C] Twater
Tair
Figure 3: Fluctuation of air temperature and the coolant fluid depending on the engine speed
150
170
190
210
230
250
270
290
310
650 1150 1650 2150 2650 3150 3650
speed [rot/min]
inle
t o
resu
re [
mb
ar]
Figure 4: Fluctuation of inlet pressure depending on the engine speed
Table 2 presents the results obtained on the final experiment carried out with the aid of
the diagnosis programme CAPELEC CAP 3200. Eight tests were conducted as a result of the engine revolution in order to analyse the
stages of the following gases: CO; CO2; HC; O2; COcorr and lambda values. The first test was being held on an idle engine at 880 rpm during 15 minutes with the oil
temperature of 90° C and after then engine has reached his normal operating temperature all tests were carried out at 1000 rpm for 5 minutes. After these operations the test was repeated increasing the engine revolution by 500 rpm.
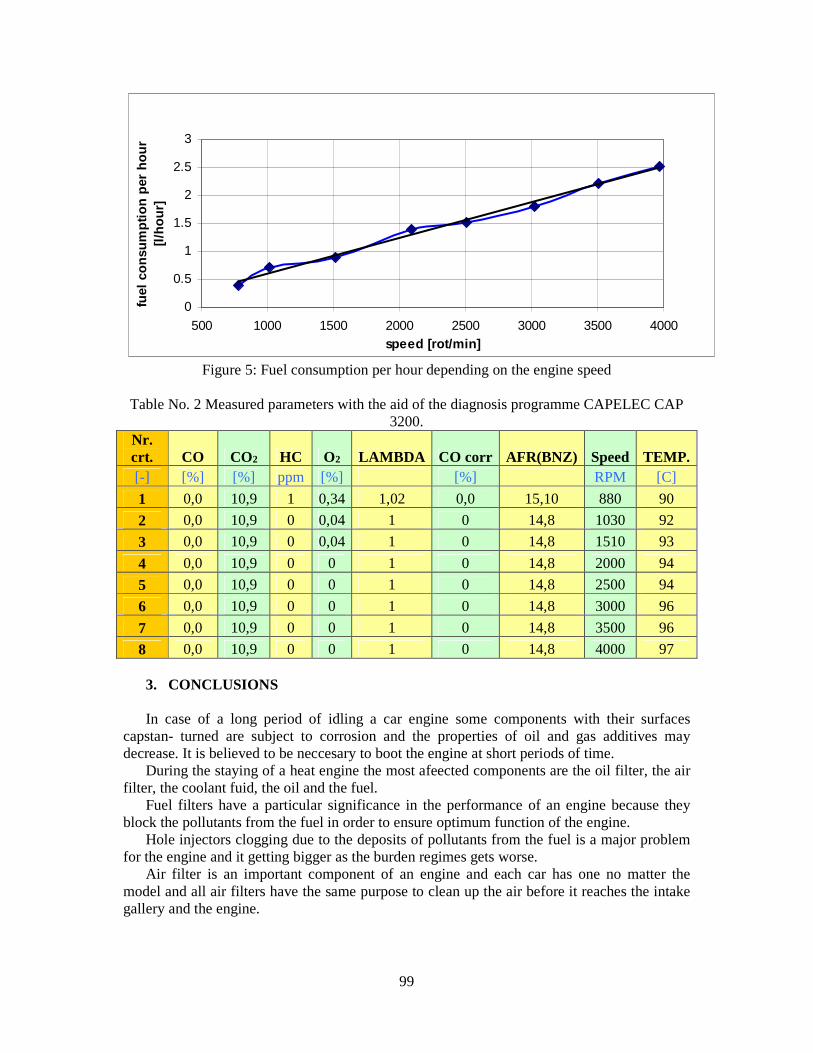
99
0
0.5
1
1.5
2
2.5
3
500 1000 1500 2000 2500 3000 3500 4000speed [rot/min]
fuel
co
nsu
mp
tio
n p
er h
ou
r [l
/ho
ur]
Figure 5: Fuel consumption per hour depending on the engine speed
Table No. 2 Measured parameters with the aid of the diagnosis programme CAPELEC CAP
3200. Nr. crt. CO CO2 HC O2 LAMBDA CO corr AFR(BNZ) Speed TEMP. [-] [%] [%] ppm [%] [%] RPM [C]
1 0,0 10,9 1 0,34 1,02 0,0 15,10 880 90
2 0,0 10,9 0 0,04 1 0 14,8 1030 92
3 0,0 10,9 0 0,04 1 0 14,8 1510 93
4 0,0 10,9 0 0 1 0 14,8 2000 94
5 0,0 10,9 0 0 1 0 14,8 2500 94
6 0,0 10,9 0 0 1 0 14,8 3000 96
7 0,0 10,9 0 0 1 0 14,8 3500 96
8 0,0 10,9 0 0 1 0 14,8 4000 97
3. CONCLUSIONS
In case of a long period of idling a car engine some components with their surfaces capstan- turned are subject to corrosion and the properties of oil and gas additives may decrease. It is believed to be neccesary to boot the engine at short periods of time.
During the staying of a heat engine the most afeected components are the oil filter, the air filter, the coolant fuid, the oil and the fuel.
Fuel filters have a particular significance in the performance of an engine because they block the pollutants from the fuel in order to ensure optimum function of the engine.
Hole injectors clogging due to the deposits of pollutants from the fuel is a major problem for the engine and it getting bigger as the burden regimes gets worse.
Air filter is an important component of an engine and each car has one no matter the model and all air filters have the same purpose to clean up the air before it reaches the intake gallery and the engine.

100
Using the tests results presented herein it can easily be observed that once we increase the engine speed the temperature raise also in the intake gallery due to the raise of engine temperature but decreases the inlet presure and increases the fuel consumption.
It can also be observed that simultaneously with the increment of engine speed, the oxygen resulting from exhaust gases disappears and CO2 remains constant no matter the speed ot the temperature of the engine. References [1] Aramă C., Grunwald B. – Motoare cu ardere internă ed. 1966 – Procese şi caracteristici. [2] Băţagă N., Tănase F., Zătreanu Gh., Dăscălescu D., Caramavru N. – Motoare termice ed. bucuresti 1979. [3] Rădulescu G.A – Combustibili, lubrifianţi şi materiale specifice pentru automobile, ed. Bucureşti, pag 35-40;51-58;58-65;170-173; [4] Mateescu M., Blejoiu S. - Combustibili, lubrifianţi şi materiale speciale pentru autovehicule rutiere, Craiova 1998 pag 14-32;32-36;66-83;99-101; [5] Gailis M., Pirs V. Research in influence of engine air filter replacement periodicity. In proceedings of 10th International Scientific Conference ENGINEERING FOR RURAL DEVELOPMENT, May 26 – 27, 2011, Letonia. [6] Filtru combustibil. Adresa:http://newpartsauto.wordpress.com/2012/08/23/filtru-combustibil. [7] Filtre carburant bosch. Adresa:http://www.bosch-auto.ro/noutati/de-80-de-ani-filtrele-de-carburant-bosch-asigura-functionarea-optima-motoarelor/

101
DESIGN CONCEPTION OF A PILOT BURNER THAT SIMULATES THE RETROFITTED BURNERS FROM CHP IŞALNIŢA
Gabriel Negreanu*1, Lucian Mihăescu*, Ionel Pîşă*, Ion Oprea*, Viorel Berbece*,
Adrian Adam** , Cristian Mândrean** , Ion Bărbieru** , Viorel Gherghina*** , Alexandru Moga*
University Politehnica of Bucharest*
ICEMENERG Bucharest**
CE Oltenia CHP Isalnita***
ABSTRACT
The paper presents the results of the third phase of a research grant [1] with the purpose of decrease of NOx emissions, using a staggered combustion new lignite burner. Until now, the research team has tested the burner on the wind tunnel and by numerical modeling. After design and manufacturing, the burner will be tested in a 2 MWth pilot boiler in order to simulate the behavior of the combustion system to be retrofitted at CHP Işalniţa. Due to the modular construction, it is possible to multiply the operational results of a single experimental burner to the whole structure of the industrial burner. In the next pages we will present the design approach of this burner.
1. INTRODUCTION The research developed in our project [1] aims to create a new lignite burner with
lower NOx emissions meant for the replacement of the burners belonging to the current combustion system of the steam generators installed at CHP Işalniţa. The new burners will use the staggered combustion technology, by means of the aerodynamics remodeling, especially for the secondary air flow, which will have a long-drawn admission related to the exit section of the burner.
Because the industrial burner has a modular construction, with 16 modules, the tests performed for one module, in a lower thermal power furnace (a pilot furnace of 2 MWth from University Politehnica of Bucharest), will produce results that can be replicated in the large power steam generator.
In order to achieve the project main task, the following research stages have been completed in 2013:
- Testing of the burner aerodynamics on the wind tunnel, with atmospheric air; - Numerical modeling of the burner. The tasks of 2014 stage are: - Design of the pilot burner; - Manufacturing and installing the pilot burner on the experimental furnace; - Testing the combustion efficiency.
2. GENERAL CONDITIONS FOR THE DESIGN OF EXPERIMENTAL
BURNER
1Tel: +40214029158, email: [email protected]
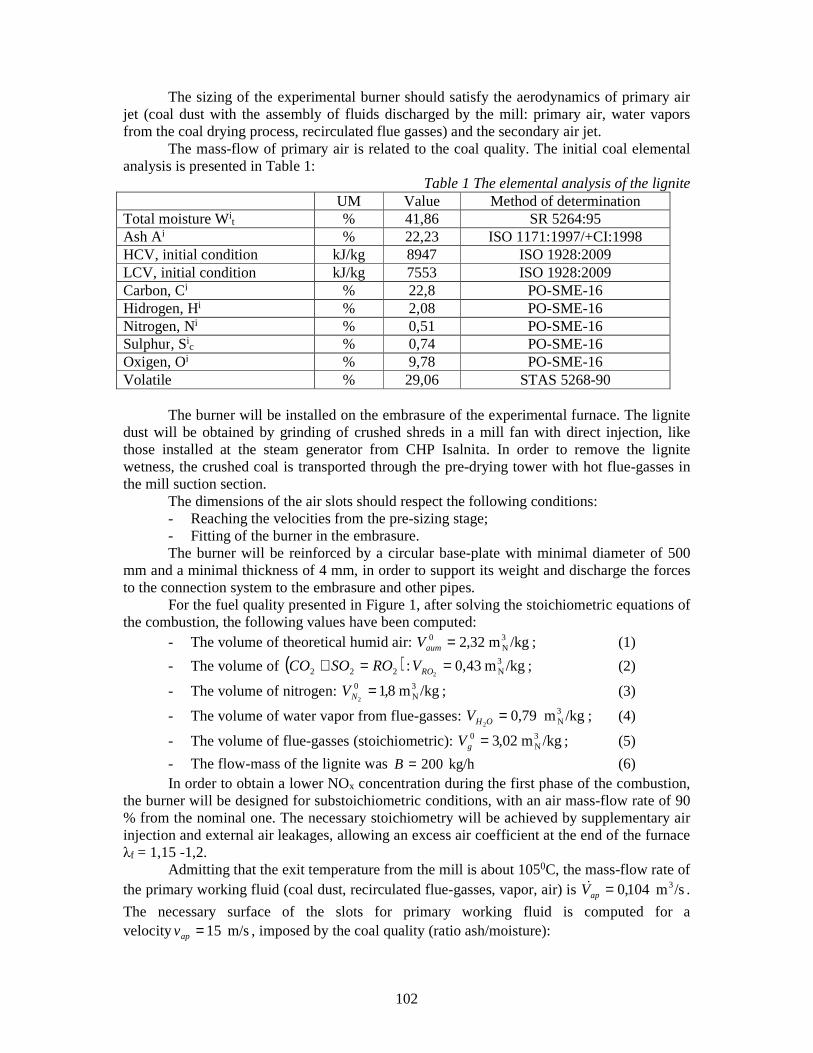
102
The sizing of the experimental burner should satisfy the aerodynamics of primary air jet (coal dust with the assembly of fluids discharged by the mill: primary air, water vapors from the coal drying process, recirculated flue gasses) and the secondary air jet.
The mass-flow of primary air is related to the coal quality. The initial coal elemental analysis is presented in Table 1:
Table 1 The elemental analysis of the lignite UM Value Method of determination Total moisture Wi
t % 41,86 SR 5264:95 Ash A i % 22,23 ISO 1171:1997/+CI:1998 HCV, initial condition kJ/kg 8947 ISO 1928:2009 LCV, initial condition kJ/kg 7553 ISO 1928:2009 Carbon, Ci % 22,8 PO-SME-16 Hidrogen, Hi % 2,08 PO-SME-16 Nitrogen, Ni % 0,51 PO-SME-16 Sulphur, Si
c % 0,74 PO-SME-16 Oxigen, Oi % 9,78 PO-SME-16 Volatile % 29,06 STAS 5268-90 The burner will be installed on the embrasure of the experimental furnace. The lignite dust will be obtained by grinding of crushed shreds in a mill fan with direct injection, like those installed at the steam generator from CHP Isalnita. In order to remove the lignite wetness, the crushed coal is transported through the pre-drying tower with hot flue-gasses in the mill suction section.
The dimensions of the air slots should respect the following conditions: - Reaching the velocities from the pre-sizing stage; - Fitting of the burner in the embrasure. The burner will be reinforced by a circular base-plate with minimal diameter of 500
mm and a minimal thickness of 4 mm, in order to support its weight and discharge the forces to the connection system to the embrasure and other pipes.
For the fuel quality presented in Figure 1, after solving the stoichiometric equations of the combustion, the following values have been computed:
- The volume of theoretical humid air: /kgm32,2 3N
0 =aumV ; (1)
- The volume of ( ) /kgm43,0: 3N222 2
==+ ROVROSOCO ; (2)
- The volume of nitrogen: /kgm8,1 3N
0
2=NV ; (3)
- The volume of water vapor from flue-gasses: /kgm79,0 3N2
=OHV ; (4)
- The volume of flue-gasses (stoichiometric): /kgm02,3 3N
0 =gV ; (5)
- The flow-mass of the lignite was kg/h200=B (6) In order to obtain a lower NOx concentration during the first phase of the combustion,
the burner will be designed for substoichiometric conditions, with an air mass-flow rate of 90 % from the nominal one. The necessary stoichiometry will be achieved by supplementary air injection and external air leakages, allowing an excess air coefficient at the end of the furnace λf = 1,15 -1,2. Admitting that the exit temperature from the mill is about 1050C, the mass-flow rate of the primary working fluid (coal dust, recirculated flue-gasses, vapor, air) is /sm104,0 3=apV& .
The necessary surface of the slots for primary working fluid is computed for a velocity m/s15=apv , imposed by the coal quality (ratio ash/moisture):

103
2m0069,015
104,0 ===v
VA ap
p
&
(7)
For a slot width of 0,083 m, required by the framing of rectangular slots in a circular embrasure, it results a high of 0,08 m. It may be allowed deviations of ± 12% from these dimensions, resulting an unessential change of the primary working fluid velocity. For the secondary air slots II, the section dimension are 0,280 x 0,140 m, imposed by the structure of air supply network. While the velocity of the secondary air was optimized by experiment [2] on wind tunnel, ( )svasII m/40= , the mass-flow rate of the secondary air II, represents 70 % of the total secondary air mass-flow, meaning 0,06 m3/s. with these figure it is possible to calculate the surface of the slots for the secondary air II: AasII = 0,0015 m2. The rest of the secondary air will be injected trough the space between the embrasure and the channels for primary working fluid and secondary air II. The burner design should satisfy the following hydraulic conditions:
- Losses of pressure on the circuit of primary working fluid circuit, 10–20 mm H2O; - Losses of pressure on the circuit of secondary air I, 20–40 mm H2O; - Losses of pressure on the circuit of secondary air II, 20–40 mm H2O; In Figure 1 are shown the details of the preheated air supply and mixed air-coal
supply.
Figure 1 details of the preheated air supply and mixed air-coal supply
The pressure losses on the circuit of primary working fluid circuit will be covered by
mill ventilation. The 0,2 t/h fan mill provides an overpressure of minimum 90 mm H2O. The pressure losses from the particle separator of the mill to the burner is maximum 20 mm H2O. A rectangular supply network with smoothly curved shape, with a length of maximum 1,5 m, transporting a fluid with a velocity of 15 m/s causes a pressure loss of 10–15 mm H2O, then the burner design respects this criterion.
While the central preheated air network has a static overpressure of 150 mm H2O, , the pressure losses from the secondary air I and II can be easily covered. Eventually, a control and measurement system (valve and diaphragm) of the mas-flow rat can also be installed.
In figure 2 are shown the general conception of burner connection to the supplying circuits of the furnace.
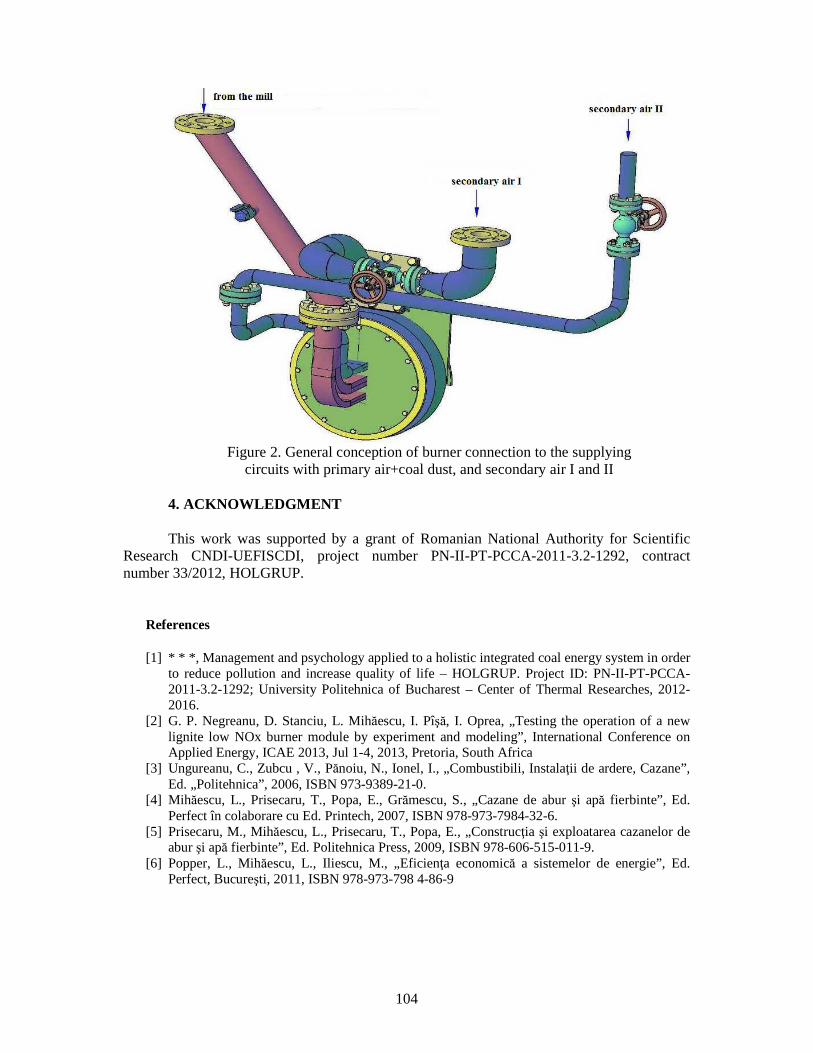
104
Figure 2. General conception of burner connection to the supplying
circuits with primary air+coal dust, and secondary air I and II
4. ACKNOWLEDGMENT
This work was supported by a grant of Romanian National Authority for Scientific Research CNDI-UEFISCDI, project number PN-II-PT-PCCA-2011-3.2-1292, contract number 33/2012, HOLGRUP.
References [1] * * *, Management and psychology applied to a holistic integrated coal energy system in order
to reduce pollution and increase quality of life – HOLGRUP. Project ID: PN-II-PT-PCCA-2011-3.2-1292; University Politehnica of Bucharest – Center of Thermal Researches, 2012-2016.
[2] G. P. Negreanu, D. Stanciu, L. Mihăescu, I. Pîşă, I. Oprea, „Testing the operation of a new lignite low NOx burner module by experiment and modeling”, International Conference on Applied Energy, ICAE 2013, Jul 1-4, 2013, Pretoria, South Africa
[3] Ungureanu, C., Zubcu , V., Pănoiu, N., Ionel, I., „Combustibili, Instalaţii de ardere, Cazane”, Ed. „Politehnica”, 2006, ISBN 973-9389-21-0.
[4] Mihăescu, L., Prisecaru, T., Popa, E., Grămescu, S., „Cazane de abur şi apă fierbinte”, Ed. Perfect în colaborare cu Ed. Printech, 2007, ISBN 978-973-7984-32-6.
[5] Prisecaru, M., Mihăescu, L., Prisecaru, T., Popa, E., „Construcţia şi exploatarea cazanelor de abur şi apă fierbinte”, Ed. Politehnica Press, 2009, ISBN 978-606-515-011-9.
[6] Popper, L., Mihăescu, L., Iliescu, M., „Eficienţa economică a sistemelor de energie”, Ed. Perfect, Bucureşti, 2011, ISBN 978-973-798 4-86-9

105
THERMAL POWER PLANT FOR ENERGY WILLOW USE: DESIGN, PERFORMANCES
Gabriel Negreanu1*, Viorel Berbece*, Lucian Mihăescu*,
Ion Oprea*, Ionel Pîşă*, Dan Andreescu**
*University Politehnica of Bucharest **Turboexpert Romania
ABSTRACT
In last few years, in Romania, the energy willow crops exceeded 1200 hectares, with an average yield of 50 t/ha at 50 % of moisture. The entrepreneurs are selling the chopped biomass with 50 €/t to the firms and individuals, mainly for heating purposes, to be burned in stoves and hot water boilers. The purpose of the paper is to analyze the opportunity to increase the overall efficiency of the biomass conversion, using a thermal power plant based on Rankine-Hirn thermodynamic cycle. The innovation of our research is related to the concept of integrated use of the biomass in energy purposes, from the crops formation and initiation up to the electricity and heat markets. The analysis of the different constructive solutions of the low-size steam turbines allows the estimation of the technical performances and economic indicators, in order to obtain a successful project. Several constructive and functional schemes for steam power plants in the range of 200-2000 kWe are studied in comparison. The main goals are to maximize the internal efficiency of the turbine at lowest rated load and to obtain positive economic indicators (payback period, net present value, internal rate of return)
1. INTRODUCTION
Today, in Romania, energy willow crops are booming, the cultivated area is over 1000 ha. In 2013, Covasna County held its first energy harvesting willow, with a production of 50 t/ha at harvest moisture of 50%. The local use in small heating installations is restricted by complicate transport and storage. The design of power plants with an output of 200-2000 kW, allows an efficient recovery, especially in locations near the crops. The high calorific energy willow chips (about 16,000 kJ/kg) will expect that power.
Only a steam boiler with efficient and environmental friendly combustion to be coupled with a turbine in current production is the main need for harnessing energy willow crops. The selected combustion technology (willow chips entrained by the primary air) imposes a tunnel-burner attached to the combustion chamber. Superheated steam conditions are required by the turbine input parameters, while the steam exhaust pressure is higher than usual.
2. TECHINCAL SOLUTIONS
Two constructive and functional schemes for steam power plants are studied in comparison. The main goals of the research are to prove the technical feasibility, to maximize
1 313 Splaiul Independentei, Bucuresti, Romania, Tel. +40214029158, email: [email protected].
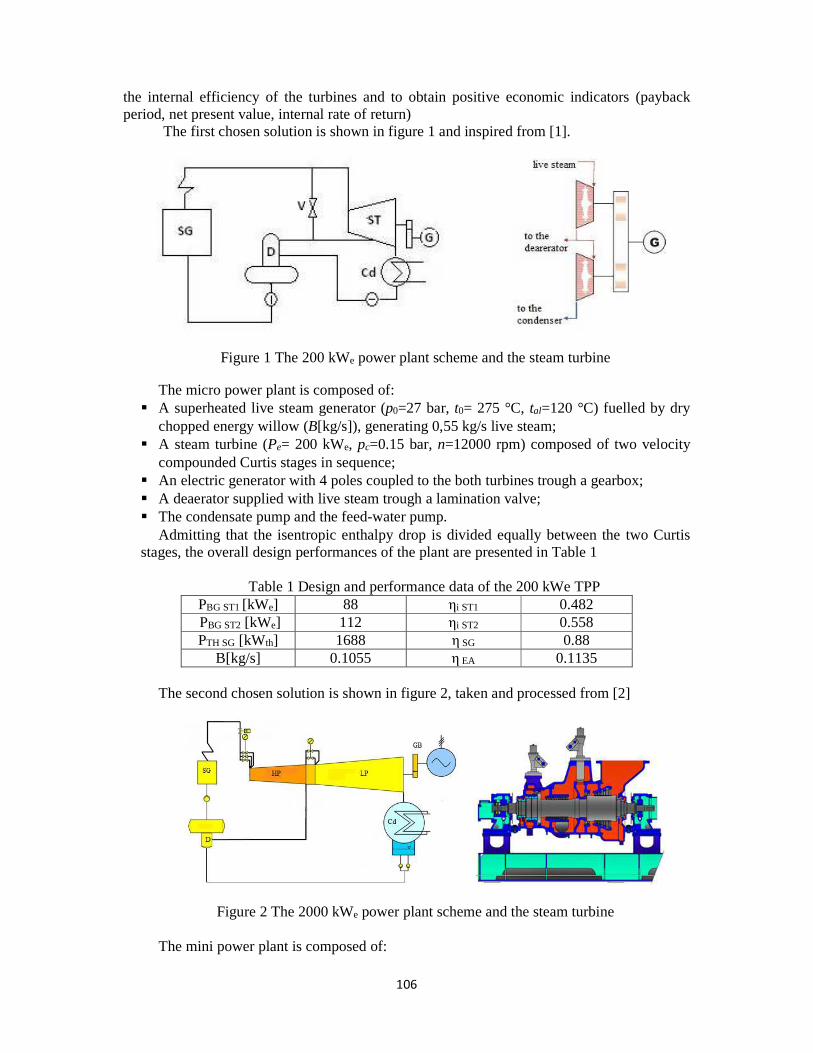
106
the internal efficiency of the turbines and to obtain positive economic indicators (payback period, net present value, internal rate of return)
The first chosen solution is shown in figure 1 and inspired from [1].
Figure 1 The 200 kWe power plant scheme and the steam turbine
The micro power plant is composed of: � A superheated live steam generator (p0=27 bar, t0= 275 °C, tal=120 °C) fuelled by dry
chopped energy willow (B[kg/s]), generating 0,55 kg/s live steam; � A steam turbine (Pe= 200 kWe, pc=0.15 bar, n=12000 rpm) composed of two velocity
compounded Curtis stages in sequence; � An electric generator with 4 poles coupled to the both turbines trough a gearbox; � A deaerator supplied with live steam trough a lamination valve; � The condensate pump and the feed-water pump.
Admitting that the isentropic enthalpy drop is divided equally between the two Curtis stages, the overall design performances of the plant are presented in Table 1
Table 1 Design and performance data of the 200 kWe TPP
PBG ST1 [kWe] 88 ηi ST1 0.482 PBG ST2 [kWe] 112 ηi ST2 0.558 PTH SG [kWth] 1688 η SG 0.88
B[kg/s] 0.1055 η EA 0.1135 The second chosen solution is shown in figure 2, taken and processed from [2]
Figure 2 The 2000 kWe power plant scheme and the steam turbine
The mini power plant is composed of:

107
� A superheated steam boiler (p0=35 bar, t0= 350 °C, tal=135 °C) fuelled by dry chopped energy willow B[kg/s]), generating 2,92 kg/s live steam;
� A steam turbine (Pe= 2000 kWe, pc=0.1 bar, n=10500 rpm) composed of two sections, each one with a Rateau control stage and many pressure compounded stages;
� An electric generator with 4 poles coupled to the turbine trough a gearbox; � A deaerator; � The condensate pumps and the feed-water pump.
The original steam turbine had a controlled extraction at the pressure of 3 bar, but we have computed the turbine like two serial condensing turbines (high pressure –HP and low pressure –LP). The overall design performances of the plant are presented in Table 1
Table 1 Design and performance data of the 2000 kWe TPP
PBG HP [kWe] 993 ηi HP 0.785 PBG LP [kWe] 1007 ηi LP 0.793 PTH SG [kWth] 8213 η SG 0.90
B[kg/s] 0.5133 η EA 0.2435
3. ECONOMIC ANALISYS
The economic analysis is carried on a period equal to the lifetime expectance of the equipments (usually 20 years). The cash-flow source is represented by the money value of the available electricity generated during this period. There are two income components: the market price (pel= 40 €/MWh) and the support scheme for the energy produced from renewable sources (3 green certificates of pGC=27-52 €/MWh).
The expenses are represented by the annual return of the investment, the interest (if the investment cost is covered even partially by a loan), the fuel cost, O&M cost, insurance, etc.
Considering an annual discount rate a, it is possible to compute the economic indicators, such as: simple payback time (Ts), net present value (NPV), internal rate of return (IRR). The conditions for a good micro gas turbine system are: NPV > 0, IRR > a, Ts < lifetime and related to the investor satisfaction.
( )∑= +
−=
n
tttt
a
CVNPV
0 1 ; IRR = a* for ( )∑
=
=+
−=
n
tt
tt
a
CVNPV
0*
01
; ( )∑=
=
≥−sTn
ttt CV
min
0
0
where: - Vt – revenues of year t; Ct – expenses of year t; - n – power plant lifetime.
The study case is based on the installation of a TPP producing PBG and delivering to the network (1-ε)·PBG, ε being the internal electricity consumption (assumed 10%). The annual operation period was estimated at 7000 hours, in integration with the forest activity (energy willow crop)
The common input figures for the economic analysis are: • O&M costs CO&M = 30,000 €/MWei+4 €/MWhe[3]; • Energy willow price pew = 20 €/t; (the willow culture and the power plant are
integrated in the same business, so the price is lower than 50 €/t) • Electricity market price pE = 40 €/MWhe; • Green certificate price pGC = 40 €/MWhe; • Discount rate a = 10%; • Planned payback period Tp = 7 years; • The investor has the money for the project and don’t borrow it from the bank.

108
In table 2 are represented the components of the capital costs:
Table 3 Components of the capital costs of the biomass TPP No. Component 200 kWe 2000 kWe M.U. 1 Turbine+annexes+gearbox+electric generator 300,000 3000000 € 2 Steam generator+deaerator 60,000 400000 € 3 Pumps 30,000 240000 € 4 Fuel supply and storage plant 20,000 100000 € 5 Chimney 20,000 106154 € 6 Total equipments 430,000 3,846,154 € 7 Services & labor 87,000 769,231 € 8 Contingency 43,000 384,615 € 9 Capital cost 560,000 5,000,000 € 10 Specific capital cost 2,800 2,500 €/kWei
The results of economic analyze are shown in table 3.
Table 3 Results of the economic analyze of the biomass TPP
No. Economic criteria 200 kWe 2000 kWe M.U. 1 Ts 8.3 5.3 years 2 NPV 970,892 24,671,709 € 3 IRR 14.09 21.50 %
4. CONCLUSIONS
Analyzing these numbers, we can draw the conclusion that both projects are feasible.
However, a slight slippage of a single input data (such as the value of the green certificates, or even the interruption of the support mechanism) can easily bring looses to the project and put the investor in a difficult situation. It is also possible to increase the revenues of the plant if the electricity market price will rise in the future. The 2000 kWe TPP has an overall efficiency twice then the 200 kWe TPP, but its capital cost is quite double. For the 200 kWe TPP the necessary crop area for energy willow is about 160 hectares/2 year harvest, while for the 2000 kWe TPP is about 776 hectares.
After the comparative analysis of the studied technical schemes, the following conclusions were drawn:
� The smaller TPP is suitable to work in remote areas, while the larger one is better to be connected to the grid.
� While the nominal power increases, the economic indicators are increasing too. � The support mechanisms for renewable energy sources (green certificates) are vital
for the project success.
References
[1] http://www.etgroup.nl/?steam-turbine-mk-7,25 [2] http://www.ttk.hr/en/?page_id=351 [3] Technology Data For Energy Plants, energynet.dk, ISBNwww: 978-87-7844-931-3 [4] A. Leca, V. Muşatescu,...G.P. Negreanu,...et all, „Managementul energiei”, Editura AGIR, ediţia a II-a 2008, 745 pagini, ISBN 978-973-720-190-4. [5] L. Mihăescu, I. Oprea, G. Negreanu, I. Pîşă, M. Ceclan, Mălina Prisecaru, Elena Pop, Manuela Georgescu, V. Berbece, „Sisteme şi echipamente termice pentru producerea energiei – Construcţie, funcţionare, management”, Ed. Printech, ISBN 978-606-521-872-7, Bucureşti 2012, 386 pag.

109
THE ANALYSIS OF THE DYNAMICS OF VEGETABLE OILS BURNING IN POWER PLANTS
PhD student Eng Bogdan Niculescu
Faculty of Power Engineering, University Politehnica of Bucharest
1. THE ENERGETIC HARNESSING OF VEGETABLE OILS
The energetic harnessing of vegetable oils represents an economical and ecological solution if it is resorted only to conventional combustion installations. The development of a special technology of burning would lead to additional investments, which would be hard to amortize.
The vegetable oils used for energy purposes differ from the bio fuels used in internal combustion engines and that through special treatments follow a different financial course.
The harnessing of vegetable oils that are pure or mixed with liquid fossil fuels in electrical installations includes boilers of hot water and steam, destined for residential and industrial heating and the heating of technological steam or steam for turbines coupled with electrical generators.
Analyses that were conducted in the past few years on the energetic characteristics of crude vegetable oils indicate they are approaching those of fossil fuels.
The research on the process of burning vegetable oils, starting from their energetic characteristics, is imposed concurrently by two methods, analytical and experimental. It is estimated that only after a concordance of the experimental results with the theoretical results occurs, a certain burning technology can be validated.
The most common mixing situation is with the liquid fossil fuels. The light liquid fuels, like the crude vegetable oils, are characterized by the
temperature of vaporization situated under the one of ignition, with the burning being influenced adequately.
2. COMPUTATION MODELS APPLICABLE TO THE BURNING OF
VEGETABLE OIL DROPS Mathematically, the modelling of the burning processes for vegetable oils will be
derived from the one for light fossil fuels. There exist several mathematical models that approach the burning of light liquid
fuels. The first step in choosing the mathematical model will depend on the comparative
analysis of the energetic characteristics for the crude vegetable oils and the light liquid fuels. The following structural models are defined: -the Hitrin model, considers that the liquid drops receive warmth from the
environment through convection and the time of burning is imposed by the time of vaporization:
( ) [ ]sTT
RL
fm
Oe
−=
2
2
λρ
τ (1)
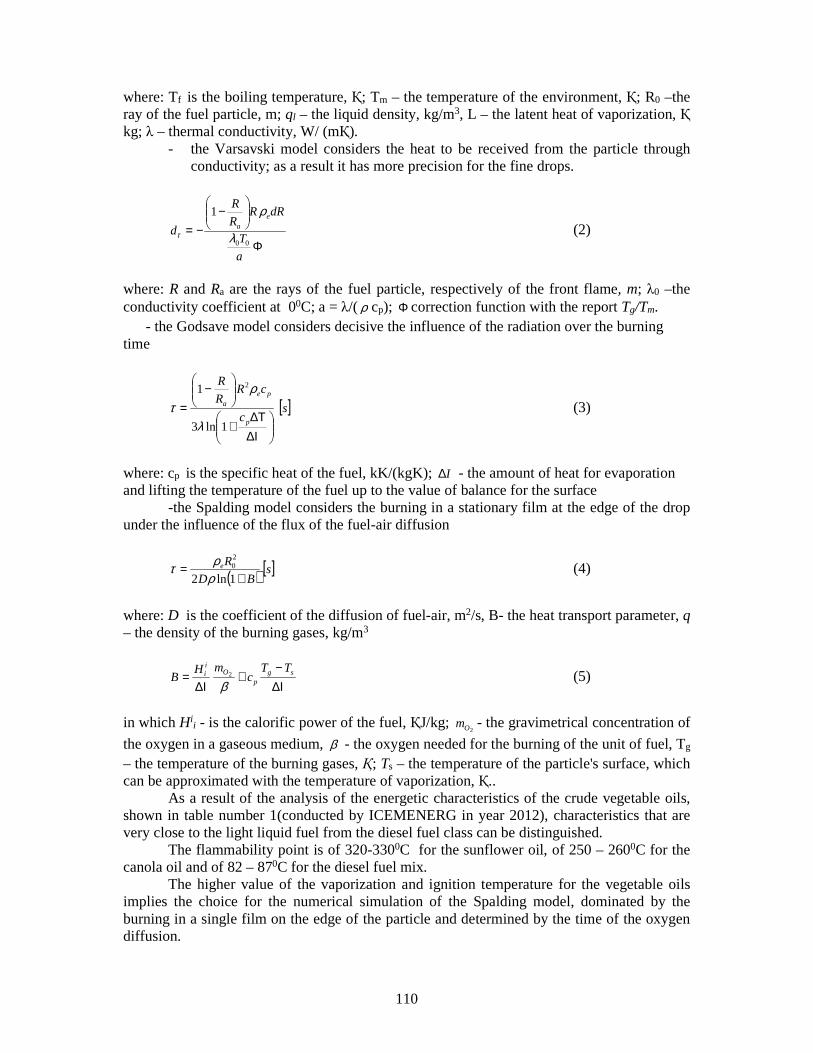
110
where: Tf is the boiling temperature, Қ; Tm – the temperature of the environment, Қ; R0 –the ray of the fuel particle, m; ql – the liquid density, kg/m3, L – the latent heat of vaporization, Қ kg; λ – thermal conductivity, W/ (mҚ).
- the Varsavski model considers the heat to be received from the particle through conductivity; as a result it has more precision for the fine drops.
Φ
−
−=
a
T
dRRR
R
de
a
00
1
λ
ρ
τ (2)
where: R and Ra are the rays of the fuel particle, respectively of the front flame, m; λ0 –the conductivity coefficient at 00C; a = λ/( ρ cp); Φ correction function with the report Tg/Tm.
- the Godsave model considers decisive the influence of the radiation over the burning time
[ ]sc
cRR
R
p
pea
∆Ι∆Τ
+
−
=1ln3
1 2
λ
ρτ (3)
where: cp is the specific heat of the fuel, kK/(kgK); I∆ - the amount of heat for evaporation and lifting the temperature of the fuel up to the value of balance for the surface -the Spalding model considers the burning in a stationary film at the edge of the drop under the influence of the flux of the fuel-air diffusion
( ) [ ]sBD
Re
+=
1ln2
20
ρρτ (4)
where: D is the coefficient of the diffusion of fuel-air, m2/s, B- the heat transport parameter, q – the density of the burning gases, kg/m3
∆Ι−
+∆Ι
= sgp
Oii
TTc
mHB
β2 (5)
in which Hi
i - is the calorific power of the fuel, ҚJ/kg; 2Om - the gravimetrical concentration of
the oxygen in a gaseous medium, β - the oxygen needed for the burning of the unit of fuel, Tg – the temperature of the burning gases, Қ; Ts – the temperature of the particle's surface, which can be approximated with the temperature of vaporization, Қ..
As a result of the analysis of the energetic characteristics of the crude vegetable oils, shown in table number 1(conducted by ICEMENERG in year 2012), characteristics that are very close to the light liquid fuel from the diesel fuel class can be distinguished.
The flammability point is of 320-3300C for the sunflower oil, of 250 – 2600C for the canola oil and of 82 – 870C for the diesel fuel mix.
The higher value of the vaporization and ignition temperature for the vegetable oils implies the choice for the numerical simulation of the Spalding model, dominated by the burning in a single film on the edge of the particle and determined by the time of the oxygen diffusion.
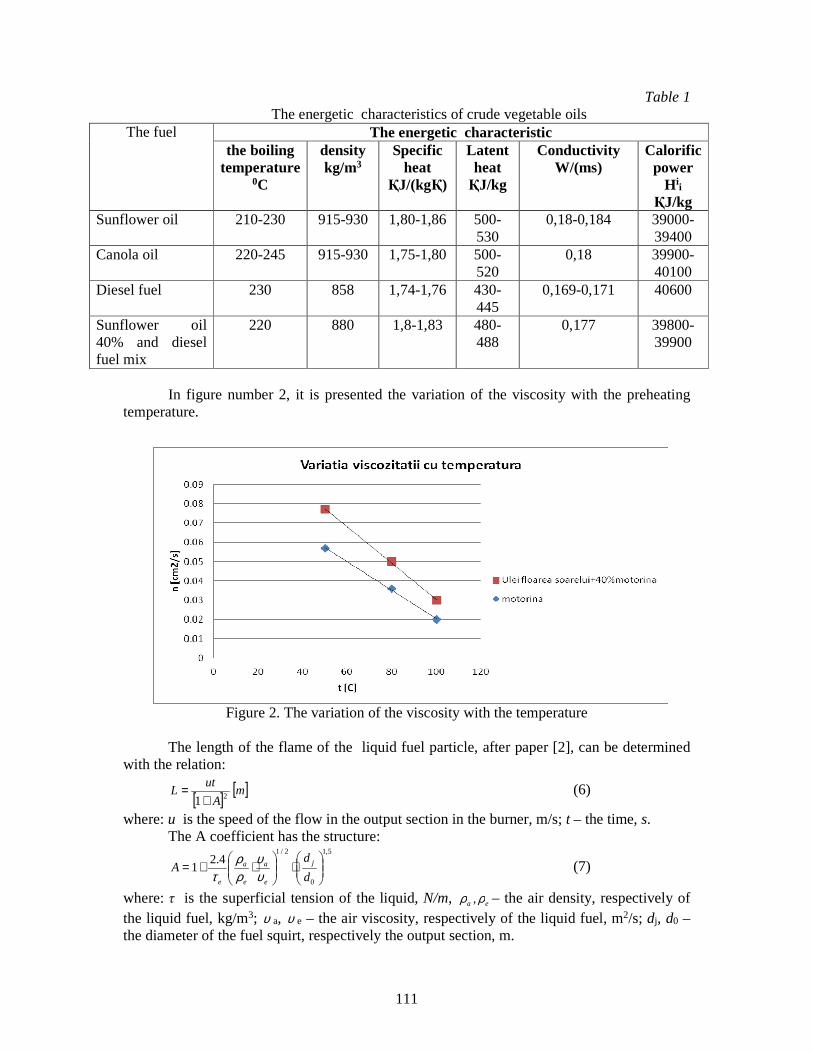
111
Table 1 The energetic characteristics of crude vegetable oils
The fuel The energetic characteristic the boiling
temperature 0C
density kg/m3
Specific heat
ҚJ/(kgҚ)
Latent heat ҚJ/kg
Conductivity W/(ms)
Calorific power
Hii ҚJ/kg
Sunflower oil 210-230 915-930 1,80-1,86 500-530
0,18-0,184 39000-39400
Canola oil 220-245 915-930 1,75-1,80 500-520
0,18 39900-40100
Diesel fuel 230 858 1,74-1,76 430-445
0,169-0,171 40600
Sunflower oil 40% and diesel fuel mix
220 880 1,8-1,83 480-488
0,177 39800-39900
In figure number 2, it is presented the variation of the viscosity with the preheating
temperature.
Figure 2. The variation of the viscosity with the temperature The length of the flame of the liquid fuel particle, after paper [2], can be determined
with the relation:
[ ] [ ]mA
utL 21+
= (6)
where: u is the speed of the flow in the output section in the burner, m/s; t – the time, s. The A coefficient has the structure:
5,1
0
2/14.2
1
⋅
⋅+=
d
dA j
e
a
e
a
e υυ
ρρ
τ (7)
where: τ is the superficial tension of the liquid, N/m, ea ρρ , – the air density, respectively of the liquid fuel, kg/m3; υ a, υ e – the air viscosity, respectively of the liquid fuel, m2/s; dj, d0 – the diameter of the fuel squirt, respectively the output section, m.
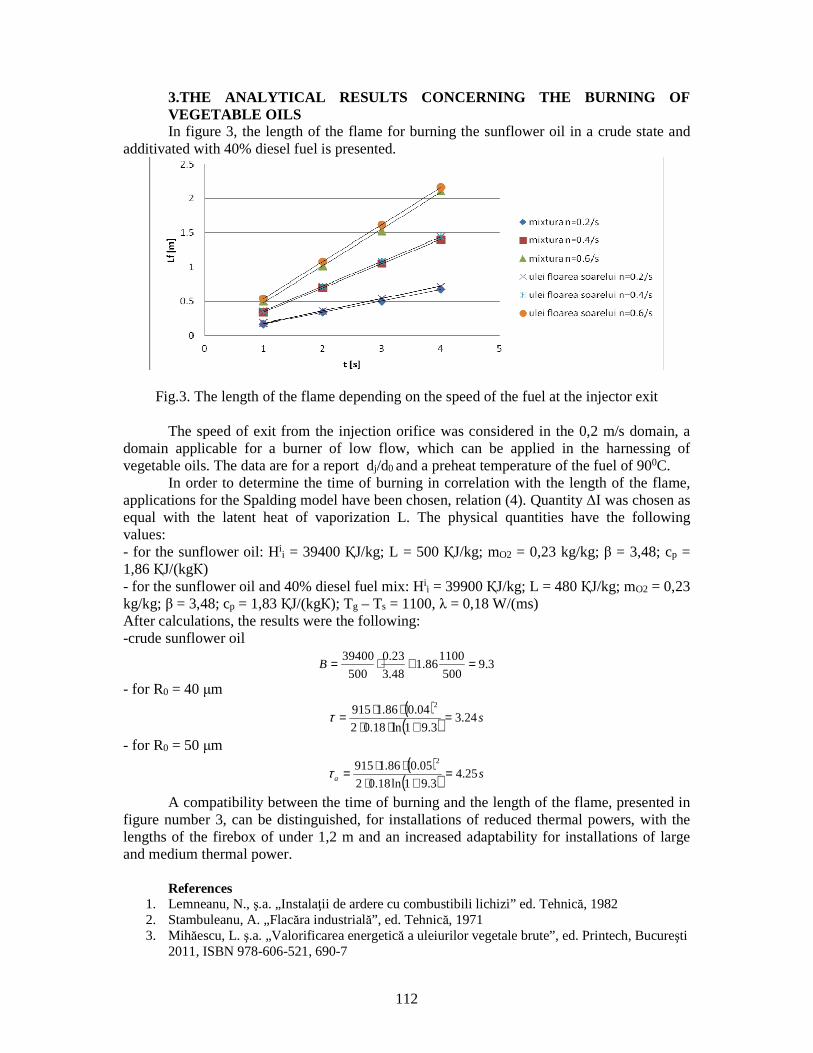
112
3.THE ANALYTICAL RESULTS CONCERNING THE BURNING OF VEGETABLE OILS In figure 3, the length of the flame for burning the sunflower oil in a crude state and
additivated with 40% diesel fuel is presented.
Fig.3. The length of the flame depending on the speed of the fuel at the injector exit
The speed of exit from the injection orifice was considered in the 0,2 m/s domain, a domain applicable for a burner of low flow, which can be applied in the harnessing of vegetable oils. The data are for a report dj/d0 and a preheat temperature of the fuel of 900C. In order to determine the time of burning in correlation with the length of the flame, applications for the Spalding model have been chosen, relation (4). Quantity ∆Ι was chosen as equal with the latent heat of vaporization L. The physical quantities have the following values: - for the sunflower oil: Hii = 39400 ҚJ/kg; L = 500 ҚJ/kg; mO2 = 0,23 kg/kg; β = 3,48; cp = 1,86 ҚJ/(kgК) - for the sunflower oil and 40% diesel fuel mix: Hi
i = 39900 ҚJ/kg; L = 480 ҚJ/kg; mO2 = 0,23 kg/kg; β = 3,48; cp = 1,83 ҚJ/(kgК); Tg – Ts = 1100, λ = 0,18 W/(ms) After calculations, the results were the following: -crude sunflower oil
3.9500
110086.1
48.3
23.0
500
39400 =+⋅=B
- for R0 = 40 µm ( )( ) s24.3
3.91ln18.02
04.086.1915 2
=+⋅⋅
⋅⋅=τ
- for R0 = 50 µm ( )
( ) sa 25.43.91ln18.02
05.086.1915 2
=+⋅
⋅⋅=τ
A compatibility between the time of burning and the length of the flame, presented in figure number 3, can be distinguished, for installations of reduced thermal powers, with the lengths of the firebox of under 1,2 m and an increased adaptability for installations of large and medium thermal power. References
1. Lemneanu, N., ş.a. „Instalaţii de ardere cu combustibili lichizi” ed. Tehnică, 1982 2. Stambuleanu, A. „Flacăra industrială”, ed. Tehnică, 1971 3. Mihăescu, L. ş.a. „Valorificarea energetică a uleiurilor vegetale brute”, ed. Printech, Bucureşti
2011, ISBN 978-606-521, 690-7
113
EFFICIENT USE OF NATURAL GAS FOR A MEDIUM SIZE DISTRICT HEATING SYSTEM
Ion Oprea1, Gabriel Negreanu, Viorel Berbece, Ionel Pîşă, Lucian Mihăescu
Politehnica University of Bucharest
ABSTRACT
Cogenerative combined cycles are now the best commercial technology for energy production. They achieve the higher overall efficiency then other operational power plants, low greenhouse gases and good capital cost. The modern gas-turbines, with high inlet temperature, give the possibility to increase the thermal efficiency and the economic results both in electric and cogeneration operation. Based on literature and own research this paper emphasizes the opportunity to obtain better economic results for natural gas use as fuel for the district heating of a medium size district system. The case study involves not only the thermal efficiency but also the capital costs, fuel price, operational and maintenance costs, and the taxes imposed.
1. INTRODUCTION The new power plants must meet three major requirements: minimum investment, maximum efficiency and reduced emissions. From this point of view the cogeneration combined cycles are the optimal solution being most modern technology in commercial power generation. Combined cycle fuel used must be a superior fuel, gaseous or liquid that burns in the combustion chamber of the gas turbine. Most power plants operate today in the most efficient combined cycle using natural gas as fuel. Cogeneration of electricity and heat in gas-steam combined cycle ensure thermodynamic and economic benefits for certain. The thermal potential of a combined cycle is higher, given that for the same value extracted for heating steam temperature, enthalpy drop in the combined cycle compared to the classic. Heat input gas-steam combined cycle is at a higher temperature, corresponding to gas Brayton cycle.
2. OPERATIONAL SOLUTIONS Combined cogenerative cycle systems operate now in three basic constructive solutions [2]: - Heat recovery steam generator; - Backpressure steam turbine (fig. 1); - Extraction condensing steam turbine (fig. 2). All these three variants bring additional power and better performance flexibility using supplementary firing, with the ability to independently adjust the production of electricity and heat. Gas turbine power controls electric power generation and supplementary firing allows controlling the flow of steam and heat. Another solution that improves the peak loading is complementary firing system, which involved a supplementary industrial sized gas turbine. In combined cycle with heat recovery boiler, the missing of the regenerative circuit in the Rankine makes dominant the external cogeneration index (power to heat ratio in cogeneration). Another feature is the high minimum value of this index. The cogeneration index of combined cycles is significantly affected by three parameters:
1Splaiul Independenţei 313, sector 6, Bucharest, PC RO-060042, [email protected]
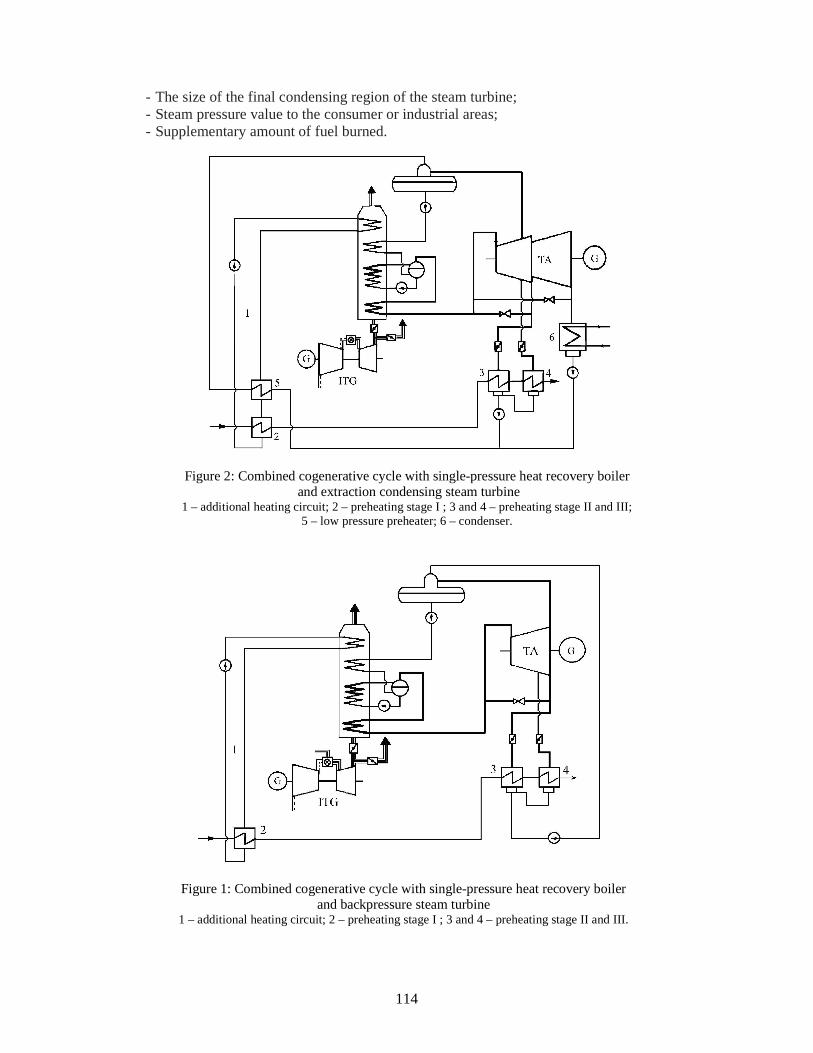
114
- The size of the final condensing region of the steam turbine; - Steam pressure value to the consumer or industrial areas; - Supplementary amount of fuel burned.
Figure 2: Combined cogenerative cycle with single-pressure heat recovery boiler and extraction condensing steam turbine
1 – additional heating circuit; 2 – preheating stage I ; 3 and 4 – preheating stage II and III; 5 – low pressure preheater; 6 – condenser.
Figure 1: Combined cogenerative cycle with single-pressure heat recovery boiler and backpressure steam turbine
1 – additional heating circuit; 2 – preheating stage I ; 3 and 4 – preheating stage II and III.

115
The modern gas turbines with high inlet temperature make no advantage the supplementary heating. More over the supplementary firing diminishes the cogeneration index value that means a decrease of the thermodynamic efficiency. For better efficiency, combined cogenerative cycles are recommended to be used only in relatively high cogeneration indexes.
Extracting condensing steam turbines as compared to the backpressure turbines are characterized by smaller internal efficiency, higher dimensions and costs. But they have some indubitable advantages. These steam turbines can operate independently of heat demand and have high operational flexibility, covering broad areas of demand for electricity and heat. The ability to produce additional electricity in the condensing region makes possible an increasing of the cogeneration index. As it increases, decreases the overall efficiency of the combined cycle, which at very high cogeneration index approaching the combined cycle without cogeneration. This makes the backpressure turbine to be preferred for combined cogeneration.
In modern power combined cycle, with triple pressure, the live steam condition of the heat recovery steam generators is close to those used in classical cycles. Under these conditions the pressure steam extracted to provide heat consumption has a major influence on the combined cycle characteristics. In contrast to boilers with lower parameters and single-pressure, without supplementary firing, the level of the live steam pressure plays an important role. Thus, the high pressure steam is extracted, so it is necessary to adopt a higher pressure of the live steam, in order to ensure a sufficiently high enthalpy drop in the turbine between the two pressure levels. By increasing the live steam pressure decreases the degree of heat recovery and the introduction of an additional heating loop become necessary.
To be effective the steam extract temperature for district heating should be as small and live steam pressure greater than for no cogeneration cycle. The optimum steam extracted temperature is determined so as to obtain maximum electrical power and lowest cost to transport heat.
3. CASE STUDY The new combined cycle power plants set new world records with both their electrical
efficiency of more than 60 percent and un unmatched supply of thermal energy for municipal district heating. The fuel utilization rate of natural gas fuel increases in cogeneration above 85 percent.
The objective of the case study is to emphasize the high efficiency of a triple pressure cogenerative combined cycle and the possibility to obtain better economical results for natural gas using. The thermodynamic analyze includes a model for the heat exchange in the steam recovery boiler, that get the possibility to find the steam condition for the all three steam circuits. On consider a cogenerative triple-pressure combined cycle that has a thermal output of 180 MWt, corresponding to a medium municipal district heating. Heat is supply by an extracting condensing turbine as is shown in figure 3.
The gas turbine has maximum temperature of 1427 0C, pressure ratio 18,1, exhaust mass flow 650 kg/s and exhaust temperature 640 0C. For the Rankine cycle steam condition is: live steam po = 110 bar, to = 565 0C, one stage of reheat t01 = 565 0C, the intermediate steam pressure p01 = 26 bar, the low steam pressure p02 = 3.7 bar, condensing pressure pc = 0.07 bar. The recovery het boiler arrangement is shown in figure 3 and the minimum temperature difference was considered δt = 0C. An intermediate temperature for high pressure vaporization circuit was considered. The equation system for heat exchange is given below:
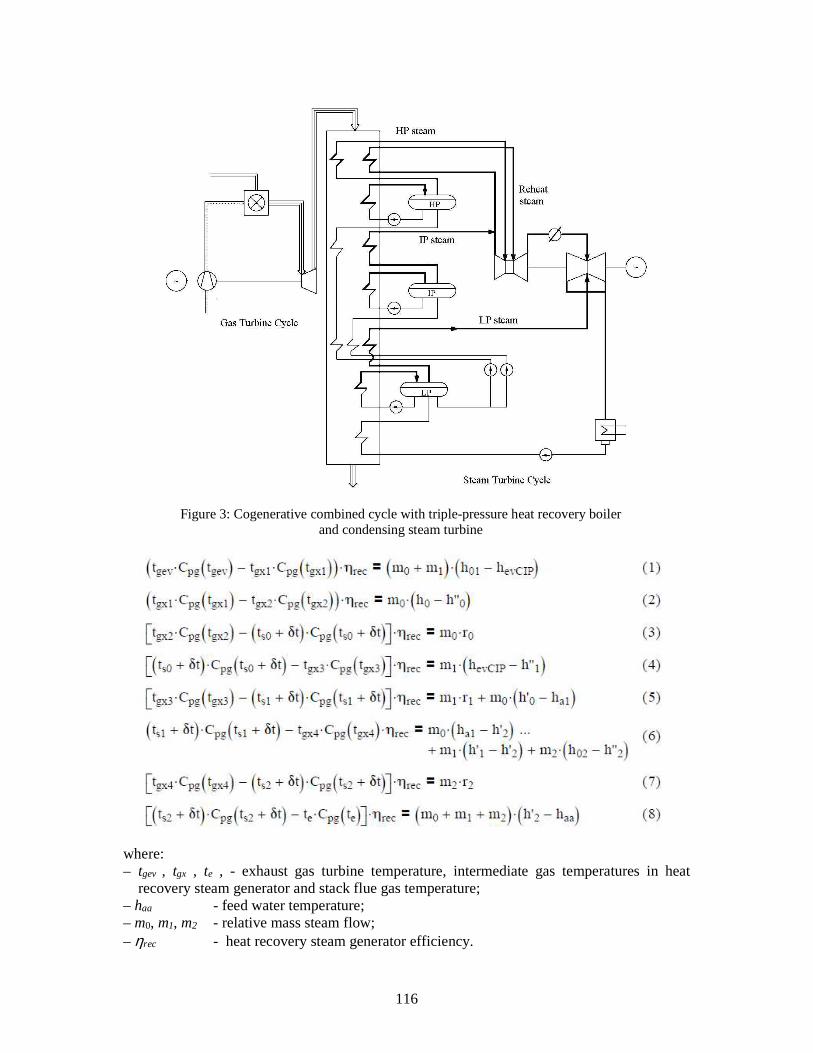
116
where: – tgev , tgx , te , - exhaust gas turbine temperature, intermediate gas temperatures in heat
recovery steam generator and stack flue gas temperature; – haa - feed water temperature; – m0, m1, m2 - relative mass steam flow; – ηrec - heat recovery steam generator efficiency.
Figure 3: Cogenerative combined cycle with triple-pressure heat recovery boiler and condensing steam turbine

117
The relative mass steam flows corresponding to each pressure are: m0 = 0.1264, m1 = 0.02 and m2 = 0.017. The flue gas temperature to the heat recovery steam generator exhaust was obtained te = 87 0C. The simple gas cycle efficiency is 39%, combined cycle gross efficiency is 0.61 and the overall fuel utilization ratio in cogeneration is in excess of 70%. In district heating operational mode the extracted steam ensures the thermal output of 180 MWt with a loss in power of about 50 MW.
4. ECONOMICAL ANALYSIS
The economical analysis will be conducted on a period equal to the lifetime expectance of the equipments (usually 20 years). The two positive cash-flow sources are represented by the money value of the available electricity and heat generated in a year, including two bonuses (for high efficiency cogeneration and CO2 saving).
The expenses are represented by the annual return of the investment, the interest (if the investment cost is covered even partially by a loan), the fuel cost, O&M cost, insurance, etc.
Considering an annual discount rate (a), it is possible to compute the economic indicators of the case, such as: payback time (Ts), net present value (NPV), internal rate of return (IRR). The conditions for a good electric and heat cogeneration system are: NPV > 0, IRR > a, Ts < lifetime and related to the investor satisfaction.
( )∑= +
−=n
tttt
a
CVNPV
0 1 (9)
IRR = a* for ( )∑=
=+−=
n
tt
tt
a
CVNPV
0*
01
(10)
( )∑=
=
≥−sTn
ttt CV
min
0
0 (11)
where: - Vt – revenues of year t; Ct – expenses of year t; - n – power system lifetime. The analysis was performed for the above case study. The annual operation period was estimated at 8160 hours (4400 winter time).
The input figures for the economic analysis are: • Specific capital cost Isp = 583 €/kWi; • O&M costs CO&M = 3.4 €/MWhe+4.5 €/kWi; • Natural gas tariff pgas = 0.29 €/m3
N; • Electricity tariff pE = 35 €/MWhe; • Heat tariff pQ = 36 €/MWht; • Discount rate a = 10%; • Planned payback period Tp = 7 years.
After running the operational case, we have obtained the following results: • NPV = 69,920,000 €; • IRR = 12.65 %; • Ts = 8.9 years.
Looking to these values, it is obviously that the project is successful for a high efficiency use of the natural gas, but it is sensitive to the value of support-mechanisms.
118
5. CONCLUSIONS The paper is an application that shows the benefit of the natural gas utilization in a cogenerative combined cycle for a medium district heating. The choice of a triple pressure cycle ensures the better performances both in electrical and heating operational modes. The presented case studied for natural gas fuel have demonstrated an efficiency of 61% in condensing mode and the fuel utilization rate over 70% in heating mode. The extraction condensing steam turbine is capable of satisfying heat demand of 180 MWt for the municipal district heating system. The analyzed solution has a high operational flexibility, good part-load efficiency, minimum impact on environmental and huge reduction of CO2 emissions.
The economical study of the cogenerative combined cycle have proved that the project is successful for a high efficiency use of the natural gas, but it is sensitive to the value of support-mechanisms.
References [1] Horlock J.H., Advanced Gas Turbine Cycles, Elsevier Press 2003.
[2] Kehlhoferr.H., Plancherel A., Stirnimann F., Rukes. B., Combined Cycle Gas & Steam Turbine Power Plants, PennWell Corporation 2009.
[3] Oprea, I., Heat recovery in micro gas turbines for cogeneration. 1st International Conference on Modern Power Systems MPS, November 8-11, 2006, Cluj-Napoca, Romania.
[4] Oprea I., Steam and Gas Turbines, Ed. Printech, Bucharest 2004.
[5] Leca., A., Muşatescu., V., ..., Negreanu G.P., et all., Managementul energiei, Editura AGIR, 2006.
[6] Bejan A., Termodinamica tehnica avansata, Ed. Tehnica, Bucuresti 1996.
[7] Mihaescu L., Oprea I., Negreanu G.,…, Sisteme si echipamente termice pentru producerea de energie, Ed. Printech 2012.
[8] Chacartegui R., Sánchez D, Muñoz de Escalona J.M., Muñoz A., Sánchez T. “Redesigning gas and steam combined cycles for low BTU syngas fuels utilization”.

119
POLLUTANT EMISSIONS OF A HEAT TREATING FURNACE
Daniela Pană1, Ion V. Ion “Dunărea de Jos” University of Galaţi, Romania
Abstract
The NOx and CO emissions are regulated pollutant emissions. In order to have an insight into the degree
of the amount of pollutant emission, especially at the modification of combustion conditions in the furnace is necessary to know the generation mechanisms and the influence of different parameters on their formation. In this paper, the mathematical models to quantify the generation rate of CO and NOx in a heat treating furnace, on the basis of the chemical equilibrium and chemical kinetic mechanisms have been developed.
1. INTRODUCTION European environmental regulations continue to reduce the CO and NOx emissions
from the combustion plants, production and processing of metals and other industrial activities [1]. Furthermore, the holders of stationary combustion plants that generate emissions of pollutants in the atmosphere are obliged to pay taxes to the Environment Fund in the amount and for substances listed in Annex. 1 of the Government Emergency Ordinance no. 196/2005, approved with amendments by Law no. 105/2006, as amended and supplemented.
The role of a heat treating furnace is to heat the material to a uniform temperature in order to change their shape or properties by using fuel as less as possible. The metal processing including iron production is one of the largest energy consumers in the manufacturing sector. To improve the energy efficiency many techniques have been developed. The most used techniques are: combustion with minimum excess air, correct heat distribution, furnace waste heat recovery, improved design of burners, combustion control, and instrumentation [2]. Combustion with minimum excess air is the first option in increasing energy efficiency as it is more economically convenient.
The normal operation of most burners of a furnace for heat treating is with as low as possible excess air to avoid metal oxidation. Therefore much attention should be paid to the CO emissions and combustion efficiency. The low excess air in flame combined with techniques to reduce NOx emissions (steam or water injection into the flame, air and/or fuel staging, flue gas recirculation, ultra-lean premixing, and eliminating preheating of the fuel and/or combustion air) leads to increased emission of CO. During the start-up of furnace the burners produce cooler flame because the furnace walls, which are cold, absorb much radiant energy from the flame than they do when they are hot and because the furnace is full of ambient air which is entrained by the flame leading to the cooling of the flame. The steep decrease of flame temperature has as result the increase in CO emission.
CO emission is very important especially at small heat treating furnaces where the CO can come out from furnace into the atmosphere around the furnace. It is known that the
1 Galati, 47 Domneasca St., E-mail: [email protected]

120
concentration of CO in the air of 100 mg/m3 is fatal to the person who draws air loaded with CO [3].
In order to have an insight into the degree of the amount of pollutant emission, especially at the modification of combustion conditions in the furnace is necessary to know the generation mechanisms and the influence of different parameters on their formation.
In this paper, the mathematical models to quantify the generation rate of CO and NOx in a heat treating furnace, on the basis of the chemical equilibrium and chemical kinetic mechanisms have been developed.
2. CO AND NOX GENERATION MECHANISMS
Pollutant genesis in combustion processes is closely related to individual chemical reactions that sustain combustion. Formation of carbon monoxide and nitrogen oxides depends very much on the ratio in which the two reactants involved in the reaction - the fuel and air of combustion and the temperature at which combustion takes place [5]. With the increase in air/fuel ratio, under adiabatic conditions, the concentration of CO in the flue gas decreases and the NOx increases to reach a maximum, and then decreases. Increasing the combustion temperature leads to an increased concentration of NOx and to a lower CO concentration.
At chemical equilibrium there is enough time for all combustion reactions to proceed to perfection, so that chemical kinetics is less important. The chemical equilibrium describes composition of the reaction products tat can be achieved if the system is kept sufficiently time at constant temperature and pressure. Experience has shown that most combustion processes take place in finite time and thus chemical kinetics is important [4]. In order to understand the factors influencing the chemical pollutant emissions is necessary to study the rate at which the chemical system closes to the final equilibrium state [6].
The mechanisms that describe the combustion include a large number of reactions, even for simple hydrocarbons. Description of combustion kinetics of usual fuels is complicated by lack of knowledge of the composition of fuels. Once initiated combustion, combustion reactions take place quickly. The pollutant formation processes involve physical processes or slow reaction that impede the equilibrium reaching during combustion or as the combustion products are cooled and lead to partial oxidation of the fuel [6].
Detailed description of the dynamics of the multitude of simultaneous reactions requires finding the solution of a large number of ordinary differential equations [6]. Integrating these equations is difficult because they contain very different time scales, from short times of free radical reactions to long times of initiation reaction. One way to overcome these difficulties consists in modeling the combustion reactions in the processes represented by a small number of synthetic reactions, each of which describes the results of a number of stages of the basic reactions. These mechanisms called "global mechanisms" are stoichiometric equations that can be developed for approximate kinetic expressions. The overall reaction rate expressions may be derived from detailed kinetic mechanisms by taking into consideration appropriate simplifications, such as steady state or partial equilibrium. Another alternative is to use the correlation between concentration profiles, experimentally determined, of the species, the flame velocity measurements or other experimental data for parameters estimating of the overall rate [6].
The global mechanisms greatly reduce the complexity of the kinetic calculations because a small number of steps are used to describe the behavior of a large number of reactions [6]. In addition, the simplified reactions involve generally the major stable species,

121
reducing the number of chemical species that should be followed. Minor species greatly influences the formation of pollutants and that is why the simplified overall mechanisms may not contain sufficient detail to describe chemical pollutant formation steps [107].
The hydrocarbons are consumed quickly during combustion generating CO, H2 and H2O. The oxidation of CO to CO2 occurs at very low rate [107]. This difference in reaction rates may be taken into account using the two-step model, which separates the rapid oxidation of the hydrocarbon to CO and H2O from the slow oxidation of CO to CO2 [107]:
22
22
21
242
COOCO
OHn
mCOOnm
HC
B
A
k
knm
→+
+→
++
(1)
The rate of reaction A is expressed by the same empirical equation used for the one-step reaction model [107]: ba
nmAA OHCkv ][][ 2= [mol/m3·s] (2) The rate of CO oxidation is given by the empirical equation [107]:
][][][ 22 COOOHkv dcBA = [mol/m3·s] (3)
where the concentration of [H2O] is included in equation because the largest share of CO is consumed by the reaction with OH, which is supposed to be in equilibrium with H2O [6].
According to Dryer şi Glassman [107], the oxidation rate of CO in the two-steps model, can be described by the following equation:
TCO eOOHCOv
2013025,0
25,0
210 ][]][[103.1
−⋅−= [mol/m3·s] (4)
The two-steps model, although does not describes accurately the processes that occur at the beginning of combustion, represents an improvement of the one-step model, because it is considered that the CO oxidation reaction occurs at much lower rate than the rate at which fuel is consumed [6].
During the experiments accomplished on a small metal treatment furnace it was observed that at the cold start up, CO emission is high due to rapid cooling of the flame which loses heat to the cold walls and cold metal parts in furnace (Fig. 1). Heat exchange between the flame and the furnace walls occurs at higher rate than is normally done when the furnace is hot. This is in agreement with the results of numerical simulation using two-steps combustion mechanism of hydrocarbons combustion and CO formation (eq. 4). After separation of the variables, the equation (4) has been integrated considering the flue gas mixture composed of the reactants CO, H2O, O2, and the inert gas N2 and CO2.
Figure 2 presents the variation of the CO concentration with flame temperature for different residence times of reactants in furnace, and in Fig. 3 the variation of CO concentration with flame temperature for three values of the oxygen excess in flame. There is an increased conversion of CO to CO2 for high values of flame temperature. The residence time of the reactants in flame greatly influences the CO concentration. A high residence time leads to a low concentration of CO. The oxygen excess in flame influences to a small extent the CO concentration. The concentration of CO decreases with increasing of oxygen concentration in flame because the excess oxygen compensates for imperfections in mixing of the reactants and because of the gas mixture dilution.
The combustion of organic fuels leads to the formation of nitrogen oxides. About 95 % of nitrogen oxides from the flue gases are in the form of nitrogen monoxide and 5% in the form of nitrogen dioxide. Nitrogen oxides are formed from two sources via three mechanisms:
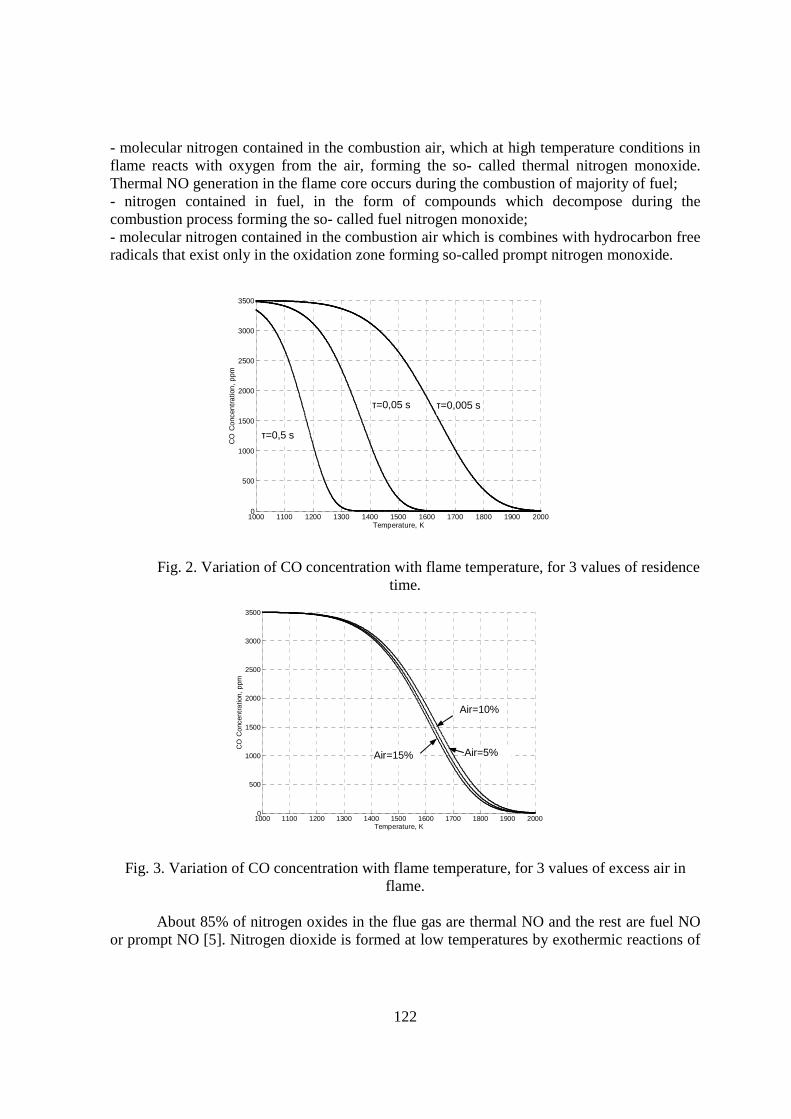
122
- molecular nitrogen contained in the combustion air, which at high temperature conditions in flame reacts with oxygen from the air, forming the so- called thermal nitrogen monoxide. Thermal NO generation in the flame core occurs during the combustion of majority of fuel; - nitrogen contained in fuel, in the form of compounds which decompose during the combustion process forming the so- called fuel nitrogen monoxide; - molecular nitrogen contained in the combustion air which is combines with hydrocarbon free radicals that exist only in the oxidation zone forming so-called prompt nitrogen monoxide.
1000 1100 1200 1300 1400 1500 1600 1700 1800 1900 20000
500
1000
1500
2000
2500
3000
3500
Temperature, K
CO
Con
cent
ratio
n, p
pm
Fig. 2. Variation of CO concentration with flame temperature, for 3 values of residence
time.
1000 1100 1200 1300 1400 1500 1600 1700 1800 1900 20000
500
1000
1500
2000
2500
3000
3500
Temperature, K
CO
Con
cent
ratio
n, p
pm
Fig. 3. Variation of CO concentration with flame temperature, for 3 values of excess air in
flame.
About 85% of nitrogen oxides in the flue gas are thermal NO and the rest are fuel NO or prompt NO [5]. Nitrogen dioxide is formed at low temperatures by exothermic reactions of
τ=0,005 s
τ=0,5 s
τ=0,05 s
Air=5%
Air=10%
Air=15%

123
NO [105]. The NO2 formation is favored by rapid cooling of the flue gas in the presence of the large amount of O2 [4].
The rates of NO generation and destruction, respectively, are [6]:
TNO e
TONv
69160
2216 1
]][[1035.1−+ ρ⋅= (5)
TNO e
TONv
473555.0
22
21
][][5.22−−− ρ= (6)
The rate of prompt NO generation is given by the following equation [6]:
( ) TiiNO e
TCHONv
1600045.0
4223 1
][]][[109.1−
⋅= (7)
where „i’ denotes the initial concentration. Reactions at chemical equilibrium involving NO, NO2, N2 and O2 and their equilibrium
constants are [4]:
21
21
][][
][71,4
22
10900
,
221
221
ON
NOeK
NONO
TNOp ==
⇔+
−
(8)
212
]][[
][105,2
2
26923
4,
2221
ONO
NOeK
NOONO
TNOp =⋅=
⇔+
−−
(9)
This model allows to estimate the concentration of NO and NO2 in flue gas as function of temperature and excess air. Excess air influences in two ways the concentration of NO and NO2: more air in flue gas means more nitrogen that can be converted into NO and NO2, but more air in flue gas leads to lower flame temperature and hence to reduced emission of NO (NO2). To see the influence of excess air on the emission of nitrogen oxides have been calculated and presented graphically concentrations of NO and NO2 at equilibrium (Fig. 4).
0
500
1000
1500
2000
2500
3000
3500
600 800 1000 1200 1400 1600 1800 2000 2200
Temperature [k]
NO
em
issi
on
[p
pm]
Air excess 15%
Air excess 10%
Air excess 5%
Fig. 4. NO and NO2 concentration as function of temperature and excess air.
124
The NOx concentration increases greatly with temperature increase over 1200 K. A lower excess air means a higher NOx concentration. Less air in flame means higher temperature and therefore higher NOx concentration. 3. CONCLUSIONS
European environmental regulations continue to reduce the CO and NOx emissions from the combustion plants. In order to find out how the CO and NOx emissions are influenced by the flame temperature, excess air and residence time simple models based on chemical kinetics and chemical equilibrium have been developed to estimate the CO and NOx emissions. Using these models, the CO and NOx concentrations have been calculated and plotted. There is an increased conversion of CO to CO2 for high values of flame temperature. The residence time of the reactants in flame greatly influences the CO concentration. A high residence time leads to a low concentration of CO. The oxygen excess in flame influences to a small extent the CO concentration. The concentration of CO decreases with increasing of oxygen concentration in flame because the excess oxygen compensates for imperfections in mixing of the reactants and because of the gas mixture dilution. The NOx concentration increases greatly with temperature increase over 1200 K. A lower excess air means a higher NOx concentration. Less air in flame means higher temperature and therefore higher NOx concentration. Bibliografie 1. *** Directive 2010/75/EU of the European Parliament and of the Council of 24 November 2010 on
industrial emissions (integrated pollution prevention and control) 2. Baukal C.E., Industrial Combustion Pollution and Control, Marcel Dekker, New York, NY (2004). 3. *** Ministerul Mediului şi Pădurilor. Agenţia Naţională pentru Protecţia Mediului. Poluanţii aerului
(http://www.calitateaer.ro/parametri.php). 4. Baukal C.E., Jianhui Hong, Richard T. Waibel, Wes Bussman, Controlling Emissions During Cold Furnace
Startup, CEP (Chemical Engineering Progress), February 2007. 5. Heinsohn, R.J., Kabel, R.L., Sources and control of air pollution, Pearson Education-Prentice Hall, 1999. 6. Flagan C.R., Seinfeld H.J., Fundamentals of Air Pollution Engineering, Prentice Hal, 2012. 7. *** Perry’s Chemical Engineers’ Handbook, 7th Ed., McGraw-Hill, Editor Don W. Green, 1997. 8. El-Mahallawy F., El-Din Habik S., Fundamentals and Technology of Combustion, Elsevier Science, 2002.

125
HYDRAULIC FRACTURING IN THE UNITED STATES OF AMERICA
Dan Parascin1, Process Improvement Manager, OneSubsea - a Cameron and Schlumberger company
ABSTRACT
Large amounts of hydrocarbons (specifically gas) could not be recovered economically from low permeability, gas-saturated sandstone. Generally, a formation permeability of less than 0.1 millidarcy is unsuitable for conventional drilling and recovery methods. Geologists and oil producers became increasingly aware of the huge untapped hydrocarbon reserves contained in low permeability formations. A new method, the hydraulic fracturing, was first experimented in 1947. Since 1949 it was used extensively to reinvigorate declining production of conventional wells. In the past ten years the hydraulic fracturing (fracking) became the preferred method to design new wells into formerly inaccessible hydrocarbon reserves. More than two and a half million hydraulic fracturing jobs were performed in the world, with about one million in the US alone.
1. WHAT IS HYDRAULIC FRACTURING ?
Hydraulic fracturing is a technique used to maximize reservoir production of shale gas by creating small fractures (typically less than 1mm) into the formation to increase permeability. A directional well is drilled in the pay-off zone and water mixed with sand and various chemicals is injected into the well at very high pressure. The applied pressure opens small fractures. After the hydraulic pressure is removed, the fractures are kept open by the grains of sand or aluminum oxide that were mixed with the hydraulic fluid.
Figure 1 Hydraulic fracturing
1 5106 Danebridge Dr,Houston, TX 77084, USA, 1 281 770 7711, e-mail:[email protected]

126
2. BENEFITS OF FRACKING Less than a decada ago, government studies and industry analysts predicted that the
United States will run out of gas. Extensive use of hydraulic fracture made these studies obsolete. The US shale gas production increased over eight times in less than 10 years.
Figure 2 Monthly dry shale gas production
Figure 3 Trends in natural gas spot price
At the same time with increased shale gas production, the natural gas prices, in US,
dropped from a peak of $13 per million Btu in 2008 to a low of $2 per million Btu in 2009. Current prices, set by the demand and supply mechanism, are around $4 per million Btu. In 2012, in Japan, the cost of Btu (LNG) was roughly four times higher than in the US. It is predicted that by the year 2016, the United States will become a natural gas net exporter.
Figure 4. Total U.S. natural gas production, Figure 5 Main shale gas fields in the US: consumtion and imports

127
In addition to the pure domestic economic benefit, the high production of natural gas in the US and the export availability has a significant geo-politic and economic impact. United States could become an important player in the global energy market, especially in the natural gas and LNG sectors, currently dominated by few suppliers and in certain cases by producers with monopoly power.
Natural gas is the cleanest fossil fuel. It produces about 29% less carbon dioxide per Joule delivered than oil. When compared with coal, the difference is even more significant: natural gas produces 44% less CO2 per Joule delivered than coal. According to the IPCC Fourth Assessment Report, in 2004, natural gas produced about 5.3 billion tons a year of CO2 emissions, while coal and oil produced 10.6 and 10.2 billion tons respectively. According to an updated version of the Special Report on Emissions Scenario by 2030, natural gas would be the source of 11 billion tons a year, with coal and oil now 8.4 and 17.2 billion respectively because demand is increasing 1.9 percent a year. Total global emissions for 2004 were estimated at over 27,200 million tons. Other pollutants, such as sulfur dioxide, carbon monoxide and nitrous oxides are produced in much lower amounts by the combustion of natural gas, when compared to any other hydrocarbon fuels. Vehicles powered by liquefied natural gas, propane or compressed natural gas run cleaner than cars with either gasoline or diesel in the tank. According to the Department of Energy, if the transportation sector switched to natural gas, it would cut the nation's carbon-monoxide emissions by at least 90 percent, carbon-dioxide emissions by 25 and nitrogen-oxide emissions by up to 60.
Coal-fired electric power generation emits around 2,000 pounds of carbon dioxide for every megawatt hour generated, which is almost double the carbon dioxide released by a natural gas-fired electric plant per megawatt hour generated. Because of this higher carbon efficiency of natural gas generation, as the fuel mix in the United States has changed to reduce coal and increase natural gas generation, carbon dioxide emissions have unexpectedly fallen. Those measured in the first quarter of 2012 were the lowest of any recorded for the first quarter of any year since 1992 (Rachel Nuwer: A 20-Year Low in U.S. Carbon Emissions)
2. CHALLENGES AND CONTROVERSIES
a) Water Recycling: Hydraulic fracturing uses a lot of water. It can take as much as 27,000 cubic meter of water to process just one well, although these are extreme cases. Most wells will take between 10,000 and 15,000 cubic meter of water. At least one third of this water will be trapped deep in the shale. Fracking operations can contribute to the depletion of water supplies in drought-stricken areas. Comprehensive studies of the region’s water supply should be conducted before the fracking operations begin. To put things in perspective, hydro-geologist David Yoxtheimer of Penn State's Marcellus Center for Outreach and Research notes: “Of the 9.5 billion gallons of water used daily in Pennsylvania, natural gas development consumes 1.9 million gallons a day (mgd); livestock use 62 mgd; mining, 96 mgd; and industry, 770 mgd.” Depending on the type of reservoir, 20 to 80% of the water injected flows back in the early stages of production. All the flow back water is treated to remove pollutants, (such as solid particles, hydrocarbon molecules, salts) that are picked up as the water flows through the reservoir rock. In addition, fracking additives must also be removed before the water is return to the ground. Modern treatment processes allow up to 90% of the water to be recycled. A different method that is investigated by the oil companies is to use deep saline aquifers, whose water is unsuitable for human consumption, as a new source of water supply.

128
b) Protecting Aquifers: Drilling deep holes in the ground will reach aquifers. This is not something new to the industry and it is not restricted to hydraulic fracturing operations. It was true at the time of the Spindletop and it is true today. The industry developed very effective methods to protect the sources of underground fresh water by isolating the well bore with successive barriers. A typical well design is shown below. Historically, there were incidents were a poor cement job, inadequate casing program or other causes led to underground water contamination. These occurrences are not specific to hydraulic fracturing. They are risks associated to any drilling in the ground beyond a certain depth. The problem can be corrected by using stronger cement and processing casings to create a better, impermeable seal.
The iconic image captured in 2010 in the “GasLand” documentary that shows a man’s kitchen faucet with flames coming from the pipes has been explained.
The entire scene appears a damning indictment of the gas drilling nearby. However, Colorado officials determined the gas wells were not to blame. The homeowner’s own water well had been drilled into a naturally occurring pocket of methane.
Figure 6 Drilling cross-section
c) Radioactivity: Uranium isotopes such as radium-226 and radium 228 are part of the
shale formation. It is a natural phenomenon used by geologists and drillers to measure and chart the underground. The higher the radiation levels, the greater the likelihood of gas deposits in that section. But that does not necessarily mean the radioactivity poses a public health hazard. Tests conducted in Pennsylvania compared the radiation level of fracking fluids that return to the surface to the radiation level of naturally occurring water that contains radioactive elements and found no evidence of elevated radiation levels. Conrad Dan Volz, former scientific director of the Center for Healthy Environments and Communities at the University of Pittsburgh, is a vocal critic of the speed with which the Marcellus is being developed—but even he says that radioactivity is probably one of the least pressing issues. "If I were to bet on this, I'd bet that it's not going to be a problem," he says.
d) Transparency: Oil and gas producers invoked proprietary privileges to keep secret the type and quantities of the chemical compounds used in their wells. This is changing, as Texas was the first state to pass a law, in 2010, requiring full public disclosure. Following the new

129
regulations, we learned that the ingredients include such benign products like instant coffee and walnut shells, but also some known and suspected carcinogens, including benzene and methanol. Some 5000 gallons of additives are used every 1 million gallons of water and sand. That is only 0.5%, however the large amount is more significant than the concentration. The real question is what to do with this fluid once it returns to the surface. Depending on the formation porosity, this wastewater can be re-injected into the impermeable rock some 1.5 miles deep. This method is not possible at some other locations (such as Marcellus Shale) where the underlying rocks are not porous enough. New methods of wastewater treatment are developed and several facilities are approved to process these fluids. Most companies use the unprocessed water to drill their next well.
e) Pollution: It is clearly established that natural gas has a lower carbon footprint than any other fossil fuel. However, bringing the gas to the surface is an energy intensive task. Drilling and production sites rely on large diesel engines and generators running around the clock. Heavy truck and equipment traffic is common. The industry response is not less drilling for gas but more equipment running on natural gas. Another pollution concern is the methane, extensively used in the drilling process, with potential to escape from poorly designed and maintained equipment. Methane is a significant greenhouse gas. Robert Howarth at Cornell University has calculated that methane losses could be as high as 8 percent. Industry officials concede that they could be losing anywhere between 1 and 3 percent. Some of those leaks can be prevented by aggressively sealing condensers, pipelines and wellheads.
f) Earthquakes: Using hydraulic fracturing to open fractures triggers minute tremors within the source rock. These movements are termed "micro-seismic events." Although significant enough to induce fracturing within the rock, they can be detected only by the most sensitive instruments because of their extremely low magnitude: typically -3 to -2 on the Richter scale, or even at most +0.5. Humans can only detect earthquakes with a magnitude of at least +3 (which is a million times higher than the -3 induced by fracking). And every day, seismographs record several thousand quakes with a magnitude of less than +2. It is true that slightly stronger tremors indirectly linked to hydraulic fracturing have been reported, for example in the United Kingdom. Studies have shown that these phenomena are due to the unusual combination of two factors: the pressure exerted on the rock by water injection and the presence of a naturally fractured, seismically unstable zone. Prior geological surveys and continuous monitoring of rock behavior during fracturing operations should prevent this type of incident, by enabling operations to be halted immediately. “It should be noted, however, that after hundreds of thousands of fracturing operations, only three examples of felt seismicity have been documented. The likelihood of inducing felt seismicity by hydraulic fracturing is thus extremely small but cannot be ruled out.” (Richard Davis – Induced Seismicity and Hydraulic Fracturing for Recovery of Hydrocarbons – Durham University) The Royal Society and the Royal Academy of Engineering, Shale gas extraction in the UK, June 2012 noted that earthquakes of magnitude 3.0, which are more intense than the larger of the two quakes caused by Cuadrilla (2.3 magnitude) are: "Felt by few people at rest or in the upper floors of buildings; similar to the passing of a truck."

130
3. CONCLUSIONS
Not even the most vocal opponents of “fracking” will deny the benefits of the
additional quantities of natural gas recovered using hydraulic fracturing: smaller carbon footprint than any other fossil fuels, reduced energy dependence, low energy cost, job creation and industrial development.
However there is a heated debate with regard to the process itself. Arguments and positions on one side or the other should be strictly based on scientific research, concrete data and facts. Honest debates are beneficial and help both public acceptance and operators restrain and control.
Safe drilling and exploitation activity are possible without affecting the environment or the public health. Communities should be educated about the process, so they can clear balance benefits vs. risks.
Modern technologies and regulations aroused from the public debate. The oil and gas companies are under increased scrutiny and government regulating bodies should be the enforcer of rules and regulations compliance.
Excesses or half-truths are toxic on both sides.
References [1] Chesapeake Industry [2] United States Department of Energy [3] United States Environmental Protection Agency [4] United States Energy Information Administration [5] Total International [6] Royal Society UK [7] Royal Academy of Engineering UK [8] Richard Davis- Induced Seismicity and Hydraulic Fracturing for Recovery of Hydrocarbons [9] Rachel Nuwer – A 20-Year Low in U.S. Carbon Emissions
131
THE EFFECTS OF DIMENSIONS OF COMBUSTION CHAMBER ON THE HEAT TRANSFER PROCESS IN CFB BOILERS
Wojciech Pospolita1, Krzysztof Jesionek2, Adam Wierciak3, Iliya Iliev4
,
ABSTRACT Boilers with circulating fluidized bed are technolgy with many adventages, such as low emission of harmful substances, fuel elasticity and proper operation in large load range. To achieve all of these advantages it is very importannt to design the combustion chamber in proper way. The paper contains short introduction into combustion process in CFB boilers. The most important parameters were chosen and described by appropriate equations. Paper contains also calculations of circulating bed density by using factors and values which are described before. There are figures which show correlations between those parameters
1. INTRODUCTION Nearly 50 years of development in CFB boilers technology has given knowledge about internal processes. According to this knowledge, engineers and scientists can accomplish projects of boilers that fully take advantage of CFB combustion, like lower emission and equal temperature profile in combustion chamber. First one is an important factor due to EU environmental needs, second eliminates a number of operational problems. By analysis of data, it is possible to avoid several problems at the boiler design stage. Project of combustion chamber has to provide e.g. correct temperature of superheaters pipes or optimal flow of ash. This increases reliability of CFB unit by lowering the number of emergency stoppages. Thus, the cost of boiler operation could be lower too. CFB combustion technology in one of the ways to combine coal firing with several environmental restrictions. It still needs research to be sure, that all the correct solutions from well-known 100÷200 MW units, will be successfully transferred into designed ones.
2. BASICS OF COMBUSTION IN CFB Combustion in Circulating Fluidized Bed boilers is a complicated process which depends
on many factors. The most important are those, which determine the parameters of the circulating material flow. Mass flow is made up of [1]:
)()()()( hmhmhmhm fumesinertcs &&&& ++= , (1)
where: – mc is mass flow of fuel [kg/s],
– minert is mass flow of inert material [kg/s], – mfumes is mass flow of fumes [kg/s],
1 Wroclaw University of Technology, Poland,e-mail:[email protected]; cell phone: +48 537651824 2 Wroclaw University of Technology, Poland, e-mail:[email protected]; cell phone:+48713441207 3 Wroclaw University of Technology, Poland, [email protected]; cell phone +48 514784171 4 Ruse University, Bulgaria, e-mail: [email protected]; cell phone: +359 887306898

132
– h is chamber height [m].
The mass flow of the circulating material depends on distance from the bottom of the chamber. It is connected with a phenomenon of burning coal and drooping larger grains back to the bottom. Consequently, the density of the material decreases. The density of bed material is described as [2]:
fumess V
KR Ψ⋅=ρ , (2)
where: – KR is circulation rate,
– ψ=2÷5 is factor which defines the internal circulation of particles in furnace [2], – Vfumes is a gas volume per unit of fuel [m3/kg].
KR gets values from 40 to 60, lower for lignite coal fire units. It is a relation between
fuel (coal) mass flow and inert material [4]:
c
inert
m
mKR
&
&= . (3)
According to KR values, fuel is only around 3 % of the whole material.
Value of bed density is parameter, which directly affects heat transfer processes because of two reasons. Firstly, in contrast to traditional steam boiler, most of the heat is transferred by convection. It is a consequence of lower temperature in chamber, around 850 °C. There are some experimental relations between bed density and convection coefficient of heat transfer. According to [3], this correlation for high power units is described as:
5,0)(30)( hh sc ρα ⋅= , (4) where – αc is convection coefficient of heat transfer [W/(m2·K)]. Due to equation (4), bed density should be chosen so as to ensure optimal heat mass to working fluid into evaporator pipes.
The second important parameter which is influenced by density is flow per unit mass G. It is described as [1]:
fumesfumess wA
hmhG ⋅−= ρ)()(
&, (5)
Where: – ρfumes is fumes density [kg/m3],
– A is chamber cross section [m2]. – wfumes is fumes velocity [m/s],
fumesfumesc w
tVmA
⋅⋅⋅⋅=
273
273& , (6)
where – t is temperature in combustion chamber [°C].

133
Changes of ρfumes is skippable, also wfumes is selected as average for whole chamber. Appropriate analysis of G factor forces provide secondary air on correct height of
chamber. It has to ensure accurate coal burn while low emission of NOx. In equation (6) temperature t appears. Most of CFB boilers operate at 850 °C average
temperature in the combustion chamber. Thus, the obtained possibility to insert calcium sorbent directly into bed greatly reduces emission of sulfur. This temperature is also lower than the temperature of ash softening. It makes heating surfaces less susceptible contamination by ash.
3. CALULATIONS During calculations, some parameters were chosen to show how their influence on the combustion process. As a base, served values from table 1.
Table 1: Base parameters. Fuel Lignite
mc [kg/s] 100 V fumes [m3/kg] 3,7
KR 50 T [°C] 850 ψ 3,5
According to equation (6) and chosen velocities of fumes, the cross section of the chamber was computed. Velocities should be within the range of 4 to 10 m/s [2]. If the velocity in the chamber is out of range, there is a risk that fluidization will stop.
Table 2: Combustion chamber cross sections. Fumes velocity [m/s] 4 5 6 7 8 9 10
Chamber cross section [m2] 285,4 228,3 190,3 163,1 142,7 126,8 114,2 T [m] 23,9 21,4 19,5 18,1 16,9 15,9 15,1 B [m] 11,9 10,7 9,8 9,0 8,4 8,0 7,6
Values T and B are the lengths of the chamber walls. Between them, there is a correlation [2]:
2=B
T (7)
For boilers with a higher power, it is very important to ensure adequate penetration inside the chamber by circulating material mass. In work [1] quoted exemplary range of G values. For chosen value of mc, G should stay in the range of 5÷15 kg/(s·m2). In Figure 1, there is a function which approximates G as a function of h. Chamber height is 42 m.

134
Figure 1: Flow per unit mass G versus chamber height.
Approximate function, including results for all velocities, appears as:
246,019,2)( −⋅⋅= hGhG start , (8)
where – Gstart is G from equation (5) for data from table 1 and 2 [kg/(m2·s)].
Figure 2: G versus chamber height for chosen velocities.
Figure 2 includes results of computing for all velocities that were chosen. It seems to be, that higher velocity (smaller cross section) incereases range of flow per unit mass. As a consequence, during design of chamber, for higher velocities, higher flow of secondary air should be assured. Ussualy flow of secondary air is around 40 % of whole air fed to the
Low
mas
s zo
ne
Hig
h m
ass
zon
e

135
boiler [5]. For highiest velocities it is a good solution to divided air into three flows. For all velocities, there is a devison between two zones of high and low mass flow of per unit mass. The division border seems to be on around 5÷7m. This is a value, where evaporator walls shoud apper instead of brick bottom nozzle. Next important parameter, which takes part during computing was bed density. Acorrding to [3], bed density changes in range from 70 to 7 kg/m3. For those values, function appears as:
129,0
0033,0)( −⋅= h
h startρρ , (9)
where – ρstart is ρ from equation (2) for data from table 1, [kg/m3].
Figure 3: Bed density ρs versus chamber height for chosen KR values.
Figure 4: Convection coefficient of heat transfer ac versus chamber height for chosen KR
values.
End of brick bottom nozzle
136
Figures 3 and 4 show results of computing for variable values of KR. In figure 3, there are little differences between density level for each KR value, but it seems that it is better to use higher KR values for boilers with higher productivity of steam. In both figures, similar to figure 2, there is very clear border between low and high density area. To protect evaporator pipes from overheating, it is good solution to design brick bottom nozzle min. 5 m tall. In range of 1÷5 m is this part of the chamber where convection coefficient of heat transfer is the highest. To take full advantage of this fact, very often designers place there special heating surfaces, which are immersed directly into the bed. Those surfaces are also adapted to adopt extremely high heat flux, often take role of last stage of superheater. Figure 4 clearly shows that αc level still decreases. Conclusion is that in lower part of the chamber, convection takes more important part then in top of the chamber, where radiation starts to dominate. Keeping αc on a medium level is also an important issue. This is one of the reasons way boilers with a higher productivity have taller combustion chambers.
4. CONCLUSIONS To provide an adequate combustion conditions is one of the most important tasks of the designers. Only in this way they can fully utilize all the advantages of fluidized bed boilers. It is important to use the available data to choose KR and dimensions of the chamber, to ensure proper distribution of bed density and its temperature. An important issue is the appropriate design of brick bottom nozzle, on one hand to prevent overheating of lower part of the evaporator, and on the other to be able to use the heat flux gathered there to ensure appropriate parameters of the steam flowing to turbine. References [1] Bis, Z., Kotły Fluidalne. Teoria i praktyka, Wydawnictwo Politechniki Częstochowskiej, Częstochowa, 2010. [2] Kruczek, S., Kotły parowe. Konstrukcja i obiczanie, Oficyna Wydawnicza Politechniki Wrocławskiej, Wrocław, 2001. [3] Dutta A., Heat transfer in circulating bed boilers, Dalhousie University, Halifax, Nova Scotia, 2002. [4] Badur J., Topolski J., "Optymalna krotność recyrkulacji w palenisku z atmosferycznym złożem fluidalnym", Instytut Maszyn Przepływowych PAN, Gdańsk 2002. [5] Pawlik M., Strzelczyk F., Elektrownie, Wydawnictwo WNT, Warszawa, 2012.
137
PERFORMANCE ANALYSIS OF A HYBRID WATER AND AIR SOLAR COLLECTOR WITH RECTANGULAR FINS
QAHTAN ADNAN ABED1,4, VIOREL BADESCU2, IULIANA SORIGA3 1Phd student,Universitatea POLITEHNICA din Bucureşti, Facultatea Inginerie
Mecanică şi Mecatronică 2Prof.dr.ing., Universitatea POLITEHNICA din Bucureşti, Facultatea Inginerie
Mecanică şi Mecatronică 3Dr.ing., Universitatea POLITEHNICA din Bucureşti, Facultatea Inginerie Mecanică
şi Mecatronică 4Foundation of Technical Education, Najaf Technical College, Iraq.
Abstract: In this presented paper a hybrid solar collector with two fluids (water and air) is investigated. The studied configuration consists of rectangular fins in the lower air channel that are arranged perpendicular to the direction of air flow to enhance the heat transfer rate and efficiency. The effect of solar irradiation, ambient temperature, air and water inlet temperatures on the useful energy and thermal efficiency were studied. The indicated results show that the maximum efficiency obtained by using 10 rectangular fins at a constant mass flow rate of 0.1 kg/s was
65.8 %.
Keywords: hybrid solar collector, rectangular fins, solar water heater; solar air heater.
1. INTRODUCTION Among the solar thermal technology, collectors have been widely used for water or air heating. There are many studies reporting solar water heating or solar air heating efficiency improvement methods. The solar water heater has been used in domestic purposes, and various types of solar water heater system were studied, such as flat plate collectors [1], concentrating collectors [2],evacuated tube collectors [3] and integrated collector storage system [4].Also, researches have been made on the efficiency and water outlet temperature of solar collectors when integrated in thermosyphon systems [5]. The solar air heaters are used for applications at low and moderate temperatures. Several solutions have been proposed in order to improve the heat transfer efficiency of air collectors, like the development of various types of baffles [6], or modifying the dual- function solar collector by adjusting the interior air gap and changing the shape of the absorber [7]. In the present work we perform the analysis of a hybrid solar collector (HSC) for water and air heating with rectangular fins in the air channel. __________________________ 1 Corresponding author, email [email protected]
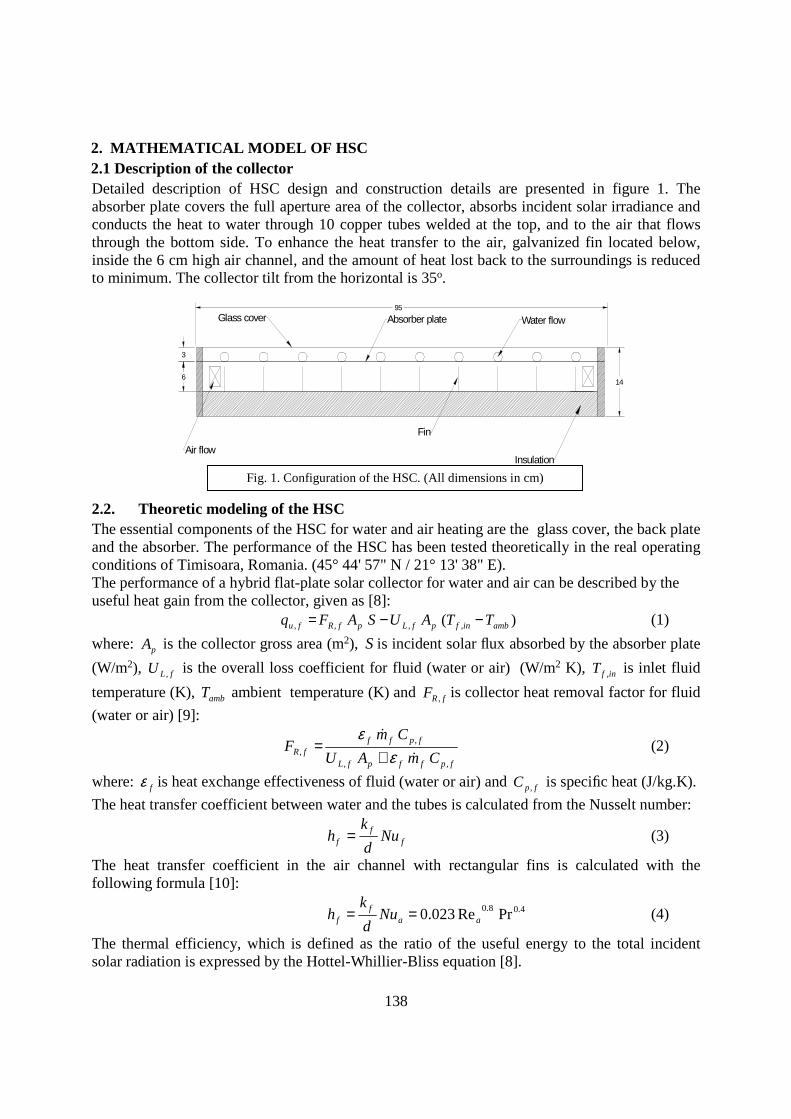
138
2. MATHEMATICAL MODEL OF HSC 2.1 Description of the collector Detailed description of HSC design and construction details are presented in figure 1. The absorber plate covers the full aperture area of the collector, absorbs incident solar irradiance and conducts the heat to water through 10 copper tubes welded at the top, and to the air that flows through the bottom side. To enhance the heat transfer to the air, galvanized fin located below, inside the 6 cm high air channel, and the amount of heat lost back to the surroundings is reduced to minimum. The collector tilt from the horizontal is 35o.
2.2. Theoretic modeling of the HSC The essential components of the HSC for water and air heating are the glass cover, the back plate and the absorber. The performance of the HSC has been tested theoretically in the real operating conditions of Timisoara, Romania. (45° 44' 57" N / 21° 13' 38" E). The performance of a hybrid flat-plate solar collector for water and air can be described by the useful heat gain from the collector, given as [8]:
)( ,,,, ambinfpfLpfRfu TTAUSAFq −−= (1)
where: pA is the collector gross area (m2), S is incident solar flux absorbed by the absorber plate
(W/m2), fLU , is the overall loss coefficient for fluid (water or air) (W/m2 K), infT , is inlet fluid
temperature (K), ambT ambient temperature (K) and fRF , is collector heat removal factor for fluid
(water or air) [9]:
fpffpfL
fpfffR CmAU
CmF
,,
,,
&
&
εε
+= (2)
where: fε is heat exchange effectiveness of fluid (water or air) and fpC , is specific heat (J/kg.K).
The heat transfer coefficient between water and the tubes is calculated from the Nusselt number:
ff
f Nud
kh = (3)
The heat transfer coefficient in the air channel with rectangular fins is calculated with the following formula [10]:
4.08.0 PrRe023.0 aaf
f Nud
kh == (4)
The thermal efficiency, which is defined as the ratio of the useful energy to the total incident solar radiation is expressed by the Hottel-Whillier-Bliss equation [8].
Fig. 1. Configuration of the HSC. (All dimensions in cm)
14
Glass cover Absorber plate Water flow
Insulation
Fin
Air flow
3
6
95
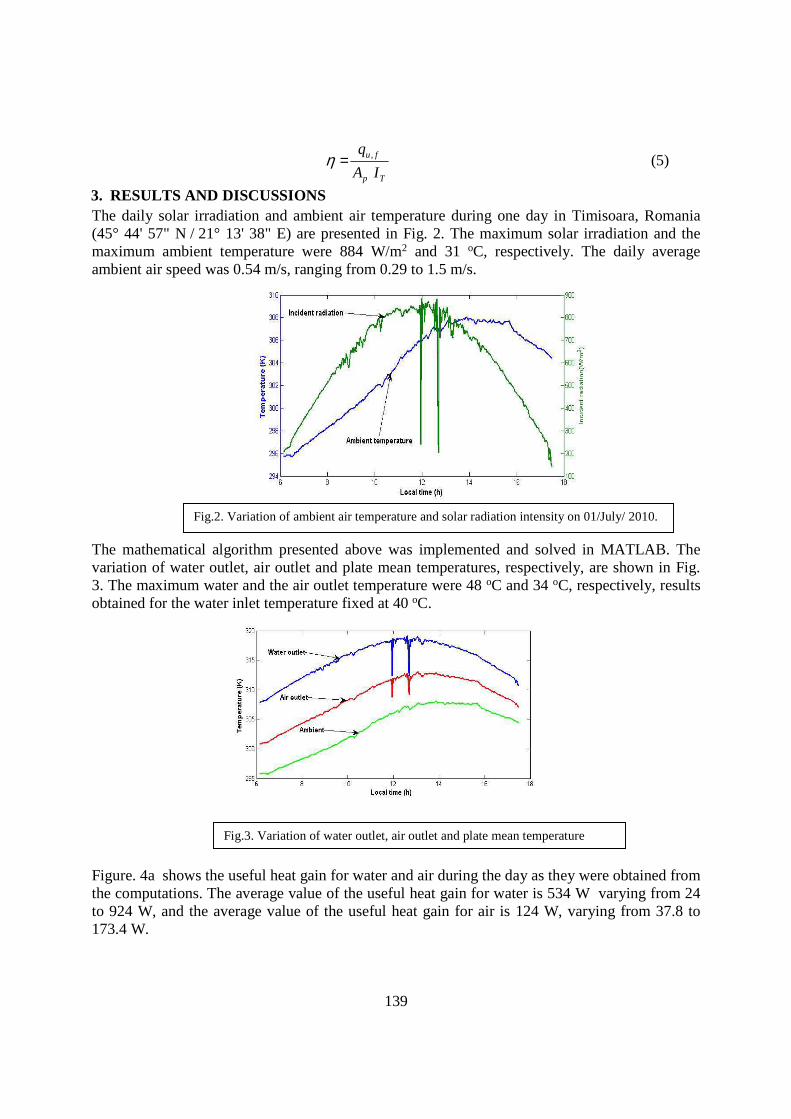
139
Tp
fu
IA
q ,=η (5)
3. RESULTS AND DISCUSSIONS The daily solar irradiation and ambient air temperature during one day in Timisoara, Romania (45° 44' 57" N / 21° 13' 38" E) are presented in Fig. 2. The maximum solar irradiation and the maximum ambient temperature were 884 W/m2 and 31 oC, respectively. The daily average ambient air speed was 0.54 m/s, ranging from 0.29 to 1.5 m/s.
The mathematical algorithm presented above was implemented and solved in MATLAB. The variation of water outlet, air outlet and plate mean temperatures, respectively, are shown in Fig. 3. The maximum water and the air outlet temperature were 48 oC and 34 oC, respectively, results obtained for the water inlet temperature fixed at 40 oC.
Figure. 4a shows the useful heat gain for water and air during the day as they were obtained from the computations. The average value of the useful heat gain for water is 534 W varying from 24 to 924 W, and the average value of the useful heat gain for air is 124 W, varying from 37.8 to 173.4 W.
Fig.2. Variation of ambient air temperature and solar radiation intensity on 01/July/ 2010.
Fig.3. Variation of water outlet, air outlet and plate mean temperature
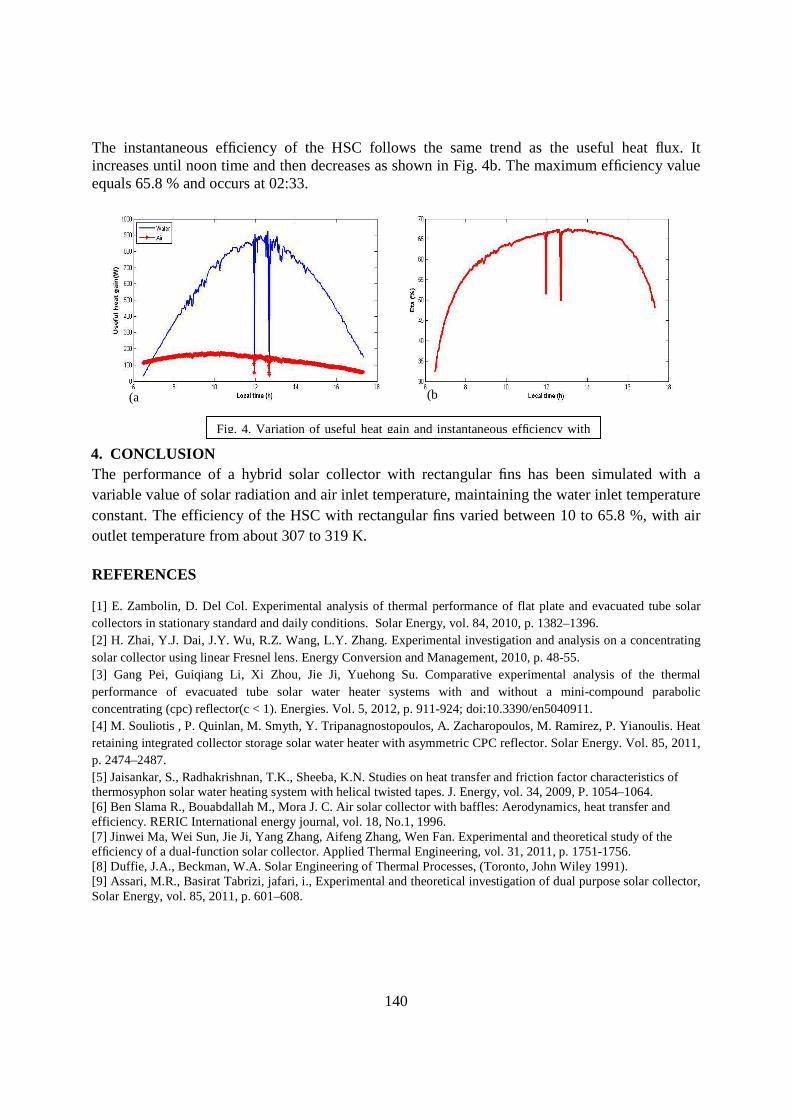
140
The instantaneous efficiency of the HSC follows the same trend as the useful heat flux. It increases until noon time and then decreases as shown in Fig. 4b. The maximum efficiency value equals 65.8 % and occurs at 02:33.
4. CONCLUSION The performance of a hybrid solar collector with rectangular fins has been simulated with a variable value of solar radiation and air inlet temperature, maintaining the water inlet temperature constant. The efficiency of the HSC with rectangular fins varied between 10 to 65.8 %, with air outlet temperature from about 307 to 319 K. REFERENCES
[1] E. Zambolin, D. Del Col. Experimental analysis of thermal performance of flat plate and evacuated tube solar collectors in stationary standard and daily conditions. Solar Energy, vol. 84, 2010, p. 1382–1396. [2] H. Zhai, Y.J. Dai, J.Y. Wu, R.Z. Wang, L.Y. Zhang. Experimental investigation and analysis on a concentrating solar collector using linear Fresnel lens. Energy Conversion and Management, 2010, p. 48-55. [3] Gang Pei, Guiqiang Li, Xi Zhou, Jie Ji, Yuehong Su. Comparative experimental analysis of the thermal performance of evacuated tube solar water heater systems with and without a mini-compound parabolic concentrating (cpc) reflector(c < 1). Energies. Vol. 5, 2012, p. 911-924; doi:10.3390/en5040911. [4] M. Souliotis , P. Quinlan, M. Smyth, Y. Tripanagnostopoulos, A. Zacharopoulos, M. Ramirez, P. Yianoulis. Heat retaining integrated collector storage solar water heater with asymmetric CPC reflector. Solar Energy. Vol. 85, 2011, p. 2474–2487. [5] Jaisankar, S., Radhakrishnan, T.K., Sheeba, K.N. Studies on heat transfer and friction factor characteristics of thermosyphon solar water heating system with helical twisted tapes. J. Energy, vol. 34, 2009, P. 1054–1064. [6] Ben Slama R., Bouabdallah M., Mora J. C. Air solar collector with baffles: Aerodynamics, heat transfer and efficiency. RERIC International energy journal, vol. 18, No.1, 1996. [7] Jinwei Ma, Wei Sun, Jie Ji, Yang Zhang, Aifeng Zhang, Wen Fan. Experimental and theoretical study of the efficiency of a dual-function solar collector. Applied Thermal Engineering, vol. 31, 2011, p. 1751-1756. [8] Duffie, J.A., Beckman, W.A. Solar Engineering of Thermal Processes, (Toronto, John Wiley 1991). [9] Assari, M.R., Basirat Tabrizi, jafari, i., Experimental and theoretical investigation of dual purpose solar collector, Solar Energy, vol. 85, 2011, p. 601–608.
Fig. 4. Variation of useful heat gain and instantaneous efficiency with
(a (b
141
COGENERATION SYSTEM MODELING FOR ISOLATED BUILDINGS
Bogdan Radu1, Alexandru Racovitză
University “POLITEHNICA” Bucharest, Faculty of Mechanical Engineering
Dept. of Thermodynamics, Engines, Thermal and Refrigerant Machines
ABSTRACT
Cogeneration systems highlight a certain way to increase the efficiency of internal combustion engines use for energetic purposes and therefore consist in a valuable source to supply isolated objectives, such as hospitals, hotels or small residential places with electric energy and hot water when no connection to standard utilities networks is available. The main goal of the analyzed model is to evaluate the fuel consumption for a building that requires electric energy and hot water as well. Thus, based on the operation of an internal combustion engine and heat exchangers a calculation model has been proposed, in which certain operating parameters depending on specific delivery situations have been defined. The below presented model allows the calculation of the fuel consumption for every operating regime.
1. INTRODUCTION
Cogeneration refers to the production of electric energy in parallel with waste heat recovery (WHR) to be further used for central heating or hot water preparation. Some results show the fact that engine efficiency in terms of fuel combustion could increase from 30% to 80% in certain cases when using co-generation systems [1][2]. In this work, authors propose a schematic formed by an engine and three heat exchangers to take the recovered heat from the engine exhaust gases, cooling water and oil [1].
Other exergetic and thermo-economical analysis of a cogeneration system equipped with a diesel engine are also presented [3][4]. This refers to a general exergetic modeling of a system deserving an electric plant of 25 MW. Besides the specific thermodynamic calculations, a balance of the entire system costs is either presented.
The present work is trying to highlight a real possibility to assemble and to use a heat recovery system for a given situation. The design of the compounding elements is inspired from other technical data [5].
2. THE SCHEMATIC OF THE INSTALLATION The model consists in a diesel gas engine connected to an electric generator and to a
water circuit designed to deliver hot water to the user. This circuit first passes through a water-water heat exchanger which extracts the heat from the engine cooling water and then passes through a gas-water heat exchanger supposed to take the heat from the engine exhaust gases. Finally, the water circuit contains a gas boiler needed to set the hot water parameters requested by the user.
In the following figure (fig.1), circles mark the points in which agents’ temperatures are measured (U for the user water flow, W for the engine cooling water and G for the engine exhaust gases). Each heat exchanger features a faucets system in order to modify the flow rates of the agents depending on the heat flow rates adjustments, related to the engine as to the
1313 Splaiul Independentei, sect.6, 060042, Bucharest, tel.: 0040-21-4029451, e-mail: [email protected]
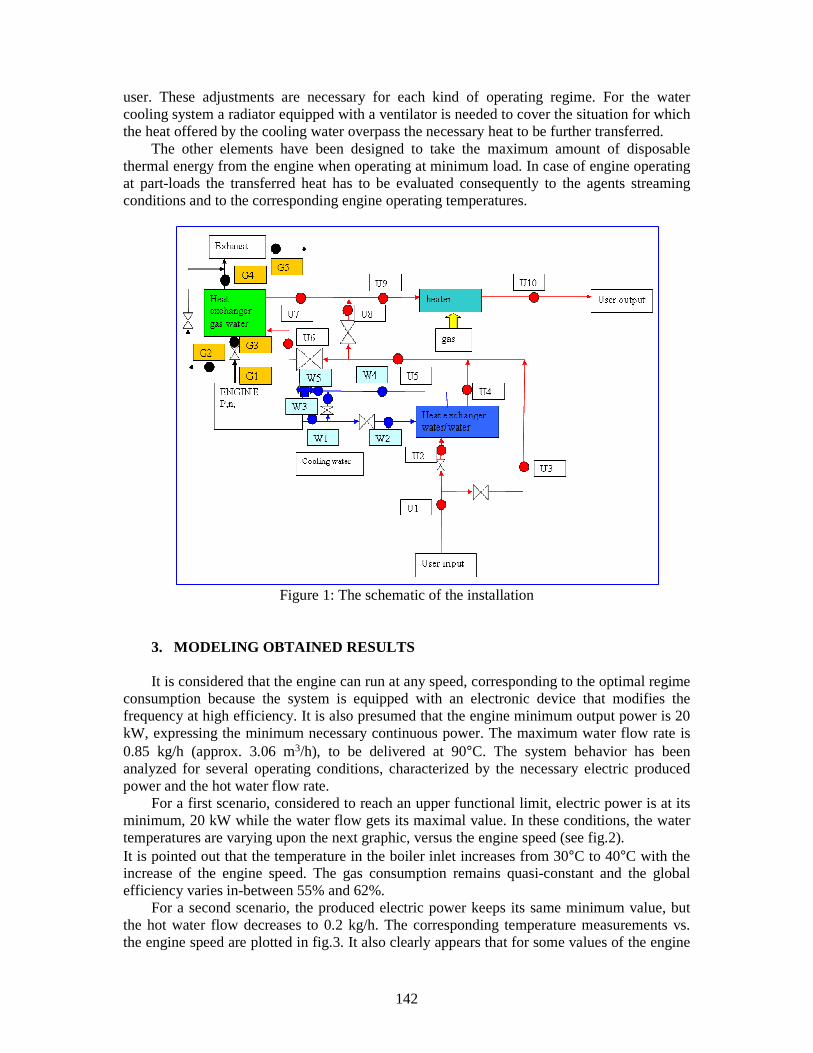
142
user. These adjustments are necessary for each kind of operating regime. For the water cooling system a radiator equipped with a ventilator is needed to cover the situation for which the heat offered by the cooling water overpass the necessary heat to be further transferred.
The other elements have been designed to take the maximum amount of disposable thermal energy from the engine when operating at minimum load. In case of engine operating at part-loads the transferred heat has to be evaluated consequently to the agents streaming conditions and to the corresponding engine operating temperatures.
Figure 1: The schematic of the installation
3. MODELING OBTAINED RESULTS
It is considered that the engine can run at any speed, corresponding to the optimal regime consumption because the system is equipped with an electronic device that modifies the frequency at high efficiency. It is also presumed that the engine minimum output power is 20 kW, expressing the minimum necessary continuous power. The maximum water flow rate is 0.85 kg/h (approx. 3.06 m3/h), to be delivered at 90°C. The system behavior has been analyzed for several operating conditions, characterized by the necessary electric produced power and the hot water flow rate.
For a first scenario, considered to reach an upper functional limit, electric power is at its minimum, 20 kW while the water flow gets its maximal value. In these conditions, the water temperatures are varying upon the next graphic, versus the engine speed (see fig.2). It is pointed out that the temperature in the boiler inlet increases from 30°C to 40°C with the increase of the engine speed. The gas consumption remains quasi-constant and the global efficiency varies in-between 55% and 62%.
For a second scenario, the produced electric power keeps its same minimum value, but the hot water flow decreases to 0.2 kg/h. The corresponding temperature measurements vs. the engine speed are plotted in fig.3. It also clearly appears that for some values of the engine
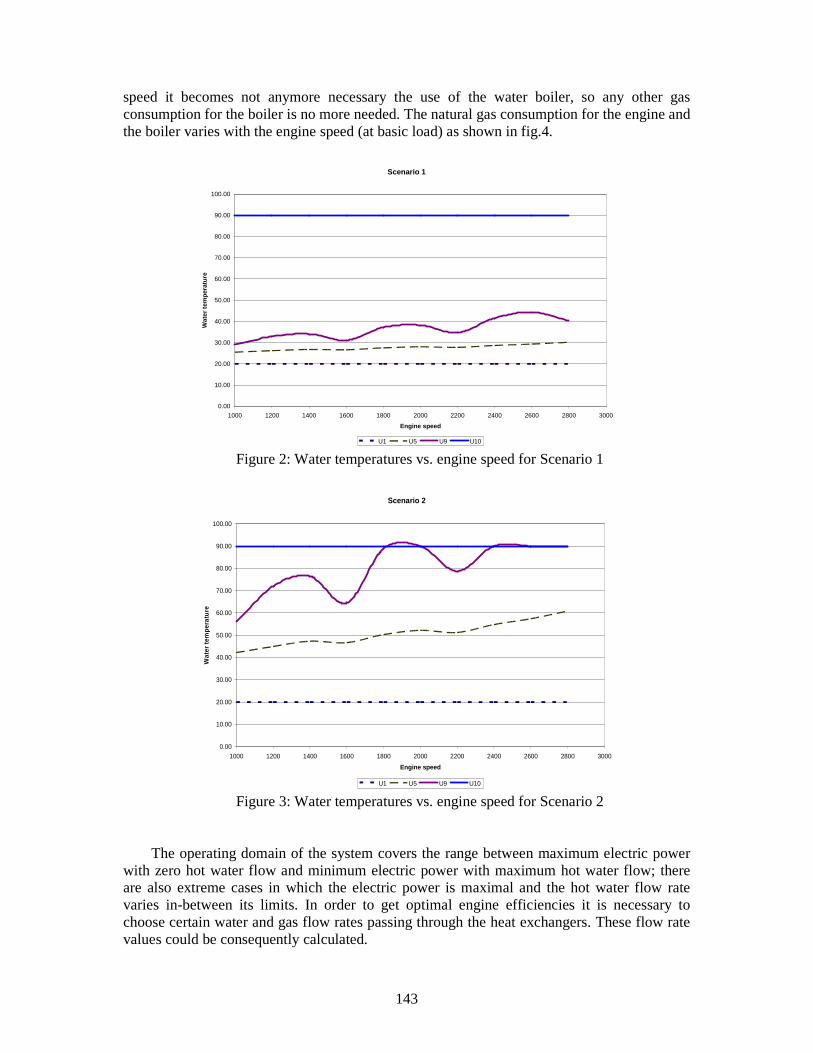
143
speed it becomes not anymore necessary the use of the water boiler, so any other gas consumption for the boiler is no more needed. The natural gas consumption for the engine and the boiler varies with the engine speed (at basic load) as shown in fig.4.
Scenario 1
0.00
10.00
20.00
30.00
40.00
50.00
60.00
70.00
80.00
90.00
100.00
1000 1200 1400 1600 1800 2000 2200 2400 2600 2800 3000
Engine speed
Wat
er t
emp
erat
ure
U1 U5 U9 U10
Figure 2: Water temperatures vs. engine speed for Scenario 1
Scenario 2
0.00
10.00
20.00
30.00
40.00
50.00
60.00
70.00
80.00
90.00
100.00
1000 1200 1400 1600 1800 2000 2200 2400 2600 2800 3000
Engine speed
Wat
er t
emp
erat
ure
U1 U5 U9 U10
Figure 3: Water temperatures vs. engine speed for Scenario 2
The operating domain of the system covers the range between maximum electric power
with zero hot water flow and minimum electric power with maximum hot water flow; there are also extreme cases in which the electric power is maximal and the hot water flow rate varies in-between its limits. In order to get optimal engine efficiencies it is necessary to choose certain water and gas flow rates passing through the heat exchangers. These flow rate values could be consequently calculated.
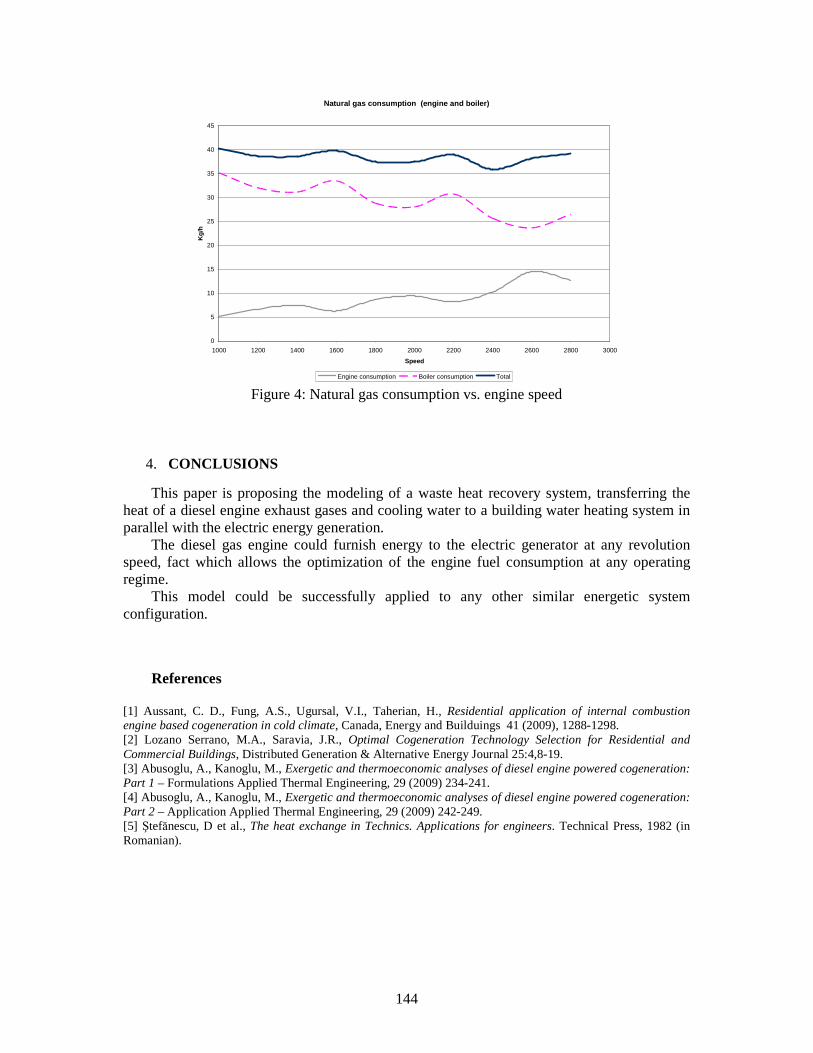
144
Natural gas consumption (engine and boiler)
0
5
10
15
20
25
30
35
40
45
1000 1200 1400 1600 1800 2000 2200 2400 2600 2800 3000
Speed
Kg
/h
Engine consumption Boiler consumption Total
Figure 4: Natural gas consumption vs. engine speed
4. CONCLUSIONS
This paper is proposing the modeling of a waste heat recovery system, transferring the heat of a diesel engine exhaust gases and cooling water to a building water heating system in parallel with the electric energy generation.
The diesel gas engine could furnish energy to the electric generator at any revolution speed, fact which allows the optimization of the engine fuel consumption at any operating regime.
This model could be successfully applied to any other similar energetic system configuration.
References [1] Aussant, C. D., Fung, A.S., Ugursal, V.I., Taherian, H., Residential application of internal combustion engine based cogeneration in cold climate, Canada, Energy and Builduings 41 (2009), 1288-1298. [2] Lozano Serrano, M.A., Saravia, J.R., Optimal Cogeneration Technology Selection for Residential and Commercial Buildings, Distributed Generation & Alternative Energy Journal 25:4,8-19. [3] Abusoglu, A., Kanoglu, M., Exergetic and thermoeconomic analyses of diesel engine powered cogeneration: Part 1 – Formulations Applied Thermal Engineering, 29 (2009) 234-241. [4] Abusoglu, A., Kanoglu, M., Exergetic and thermoeconomic analyses of diesel engine powered cogeneration: Part 2 – Application Applied Thermal Engineering, 29 (2009) 242-249. [5] Ştefănescu, D et al., The heat exchange in Technics. Applications for engineers. Technical Press, 1982 (in Romanian).
145
VERY HIGH GAS TEMPERATURE TURBOENGINE
Constantin Sandu1*, Iulian Vladucă1, Bogdan Sacuiu1, Dumitru Amariutei1, Razvan Cârlănescu1, Razvan Bimbasa1
1COMOTI, Bucharest, Romania *Corresponding author: E-mail : [email protected]
ABSTRACT
This paper presents a new type of turboengine having very high gas temperature in front of turbine. It is known that the maximum gas temperature in front of turbine is the best method to increase the efficiency of turboengines and of any thermal engine. However, this temperature can not be too high because the limited strength of turbine blades. The turbine blades of present turboengines are cooled with air taken from engine compressor. However, this method does not permit increasing of burnt gases temperature over 1450 ºC. This is happened because the thermal transfer between the blade metal and cooling air has a low intensity due to low density of cooling air. This drawback can be eliminated if the turbine blades are cooled with liquid instead of air. The present paper presents the possibility to cool the turbine blades with liquid fuel for gas turbines (‘Kerosene’). The liquid fuel is circulated through cooling holes in turboengine blades before to be injected in combustor. Thus, the heat extracted from turbine is completely recuperated because, after cooling the turbine blades, the liquid fuel is injected and burnt in combustor. Keywords-turbine blade cooling with liquid, turboengine, high gases temperature in front of turbine.
NOMENCLATURE cp -specific heat (kJ/kg/K) d* -characteristic dimension (m) Hc -heat of combustion for Kerosene (kj/kg) Fc -fuel consumption (kg/s) lhev -latent heat of evaporation (kj/kg) lbc -blade chord Ma -mass flow of air through turboengine (kg/s) Nu -Nusselt number (dimensionless) Pr -Prandtl number (dimensionless) Pt -power absorbed by Kerosene in turbine rotor qcgb -The specific heat flux due to convection from burnt gases to blade (W/m2) Re -Reynolds number(dimensionless) Steab-total area of external surfaces of all turbine blades (m2) T -temperature (K) Tmeg -mean temperature of burnt gases (K) Tmesb-mean temperature of turbine blade surface (K) TH -absolute temperature of the high-temperature reservoir for Carnot cycle (K) TL -absolute temperature of the low-temperature reservoir for Carnot cycle (K) t -time (s) w -speed of burnt gases relatively to turbine blade (m/s) Greek αcgb-coefficient of heat transfer due to convec