download (2330kb) - lse theses online - london school of
TRANSCRIPT

The London School of Economics and Political
Science
Melting Pot or Salad Bowl?
Assessing Irish immigrant assimilation in late
nineteenth century America
Peter Cirenza
A thesis submitted to the Department of Economic
History of the London School of Economics and
Political Science for the degree of Doctor of
Philosophy, London, April 2011

1
Declaration I certify that the thesis I have presented for examination for the PhD degree of the London School of Economics and Political Science is
solely my own work other than where I have clearly indicated that it is the work of others (in which case the extent of any work carried out
jointly by me and any other person is clearly identified in it).
The copyright of this thesis rests with the author. Quotation from it is
permitted, provided that full acknowledgement is made. This thesis may not be reproduced without the prior written consent of the author.
I warrant that this authorization does not, to the best of my belief, infringe the rights of any third party.

2
Abstract
This dissertation assesses the degree of assimilation achieved by Irish immigrants in the US in the last decades of the nineteenth century. It employs a
matching technique to link specific individuals in both the 1880 and 1900 US censuses. I use this technique to create matched samples of Irish immigrants and native born Americans, allowing me to capture significant information
concerning these individuals and their families over this timeframe. Utilising these samples, together with other data, I assess the degree of assimilation
achieved by Irish immigrants, in aggregate and in selected subsets, with native born Americans across a range of socio-economic characteristics over this period.
Among my principal findings are that Irish immigrants did not assimilate quickly
into American society in this period, nor did they achieve occupational parity with native born Americans. Younger Irish and those who immigrated to the US as children experienced greater assimilation and achieved higher levels of
occupational mobility, as did those Irish immigrants who married a non-Irish spouse. Higher levels of geographic clustering were associated with lower
degrees of assimilation and lower occupational outcomes. My research provides support for the argument that such clustering delays immigrant assimilation. My results also indicate continued cultural persistence by Irish immigrants as it
relates to their choice of names for their children. Irish immigrants who gave their children a common Irish name closely resembled those who married an
Irish-born spouse - they underperformed in the workplace and experienced a lower degree of assimilation. These results suggest that the flame burning under the Irish melting pot in the last decades of the nineteenth century was not very
hot, and that the assimilation process for Irish immigrants into American society was a varied and multidimensional one.

3
Acknowledgements
I would like to thank my doctoral supervisors, Dr. Chris Minns and Professor Mary Morgan for their excellent guidance and support over the course of this project. I would also like to acknowledge the warm support received from
faculty, staff and fellow research students in the Economic History Department at the London School of Economics and Political Science. I would also like to
thank my wife Lisa and my children Timothy, Julianne, Patrick and Johnathan for their interest in and enthusiasm for my research. Finally, I must also acknowledge Arthur, our dog, who was a constant companion throughout this
project.

4
Table of Contents
Page
Chapter Subject Number
I Introduction and Literature Review 6
II Data and Methodology 53
III Assimilation and Occupational Mobility of 70 Irish Immigrants in the Late Nineteenth Century
America IV Assimilation of Irish Immigrants as Measured 125
by Ethnic Intermarriage
V The Impact of Geographic Clustering 162 on the Assimilation of Irish Immigrants
VI The Naming of Irish Immigrant Children 211 as a Measure of Assimilation
VII Conclusion 257
5
Organisation of dissertation
In this dissertation, Chapter I comprises the introduction and literature review. Chapter
II reviews data sources and key methodological approaches. Chapter III presents a
comparative analysis of Irish immigrant assimilation and occupational mobility in the
US in the late nineteenth century. Chapter IV employs ethnic intermarriage as a
distinct measure of assimilation for a sample of Irish immigrants. Chapter V assesses
the impact of geographic clustering on the degree of assimilation achieved by Irish
immigrants in the late nineteenth century. Chapter VI utilises information about the
first names given to the children of Irish immigrants to draw further conclusions about
the assimilation of these Irish immigrants into American society in the late nineteenth
century. Chapter VII concludes.

6
I. Introduction and Literature Review
“America is God‟s crucible, the great Melting Pot where all races of Europe are
melting and re-forming! ... At Ellis Island, here you stand in your fifty groups, with
your fifty languages and histories, and your fifty blood hatreds and rivalries. But you
won‟t long be like that…Germans and Frenchmen, Irishmen and Englishmen, Jews
and Russians - into the Crucible with you all! God is making the American.”
From Israel Zangwill‟s The Melting Pot (1908)1
Israel Zangwill‟s theatrical work entitled The Melting Pot gave birth to a metaphor for
the assimilation of immigrants into American society that has lived on long after his
play stopped running on Broadway in the early years of the twentieth century. The
concept that immigrants to the United States (“US”) were melded into a new culture,
combining their attributes with those of native born Americans, attracted widespread
attention at the time. It has since become an important concept not only in popular
culture, but also in the academic literature on immigration and assimilation. While
subsequent work in the fields of economics, economic history and sociology has led to
a more nuanced and multifaceted approach to immigrant assimilation, the melting pot
concept popularised by the theatrical work of Zangwill still provides a useful metaphor
for the study of immigrant assimilation.
This dissertation will seek to assess the degree of assimilation achieved by Irish
immigrants in the US in the last decades of the nineteenth century. In particular, it will
1 Israel Zangwill, The Melting Pot (New York: 1909), pp. 37-38.

7
focus on those immigrants who arrived from Ireland prior to 1880, and will track their
progress in the US during the last two decades of the nineteenth century. In this
dissertation, I will employ a matching technique to link specific individuals from the
1880 and 1900 US censuses, capturing significant information concerning these
individuals in both 1880 and again in 1900. I will utilise this matching technique to
create samples of both Irish immigrants and native born Americans, and will use these
samples to track the lives of these individuals over this twenty year period. (A more
complete description of this matching technique, together with a review of the data
sources and methodological approaches to be used in this dissertation, is presented in
Chapter II.) Utilising these samples, I will assess the degree of assimilation achieved
by Irish immigrants with native born Americans across a range of socio-economic
characteristics available in the US census data. Of these various socio-economic
characteristics, one which will receive particular attention is the occupation of these
immigrants, and their occupational mobility over the course of this time period.
Examining the experience of Irish immigrants in the workplace will be a significant
focus of this dissertation. However, I will also assess immigrant assimilation across a
broad range of socio-economic characteristics, and seek to develop a clearer sense for
how these immigrants adapted to their new surroundings, both in and outside the
workplace. In this process, I will create various additional samples using US census
data as well as other sources. Marriage and children‟s naming patterns will be analysed
to assess the degree of assimilation achieved by the Irish in the US as measured by
these indicators. In addition, the role of geographic location will also be examined,
with a particular focus on its impact on the assimilation and labour market outcomes of
Irish immigrants who lived in more ethnically concentrated areas.

8
In this dissertation, the following principal questions will be addressed: Were the Irish
immigrants of the late nineteenth century melded in the crucible of the American
melting pot, being reformed into “the American” so dramatically described by
Zangwill? Or did they retain their distinctiveness in their new homeland? Was the
melting pot in fact more of a salad bowl where different ethnic groups were mixed
together, but with each retaining its own identity? Or were there certain areas where
the Irish adapted quickly to their new surroundings and others where their socio-
economic outcomes did not come to resemble those of native born. Was the
assimilation process in fact multi-dimensional as opposed to being uniform in nature?
Did the assimilation outcomes of Irish immigrants vary depending on which subset of
the Irish sample was being reviewed, and which socio-economic variables were under
consideration? And finally, what was the nature of the relationship between
assimilation and occupational mobility for Irish immigrants in this time period?
In addition to addressing these questions, this dissertation will also examine the
concept of assimilation itself. Assimilation has been approached and defined in a
variety of manners by economists, economic historians and sociologists. Various
frameworks have been developed to analyse assimilation, which will be reviewed in
this chapter. In this dissertation, I will approach assimilation as the process by which
an immigrant group attains a level of social and economic integration into their new
host society such that their overall position in these sectors of society, as measured by
observable outcomes, is similar to those of the native born members of the society.
Using this approach, I will focus on gathering and analysing individual characteristics
which can be readily and accurately measured. Irish immigrant assimilation will be
assessed primarily through the various socio-economic characteristics available in the
9
US censuses of 1880 and 1900, together with relevant data drawn from other sources.
This author views assimilation as a process, where multiple outcomes are possible, as
are variations in the degree of assimilation achieved in different areas under study. The
definition of assimilation provided above represents a framework against which to
assess the assimilation outcomes achieved by the immigrants in my study. In addition,
as will be discussed, there are compelling reasons to analyse the assimilation of Irish
immigrants in this timeframe, and recent advances in the access to and availability of
US census data allow for enhanced methodological approaches to be utilised.
So why should we be interested in the assimilation of Irish immigrants into US society
at the end of the nineteenth century? There are a variety of reasons. First of all, the
Irish were the most prolific of immigrants groups during this timeframe and the US
was their primary destination. In excess of two million Irish immigrated to the US
between 1850 and 1900,2 and in this period Irish per capita emigration was
significantly larger than any other European immigrant group.3 According to
Fitzgerald (1985), the US in 1890 contained approximately two-thirds of all overseas
Irish as well as one quarter of all Irish natives.4 In this period, the Irish were ascendant,
becoming the primary immigrant group in many areas of the US including such
leading cities as New York, Philadelphia and Boston. They established significant
support networks and began to achieve prominence in local politics and in labour
unions, perhaps benefiting from the economic and political inroads made by previous
generations of Irish immigrants. In addition, unlike the extreme circumstances which
led to high Irish emigration during the Famine years, these Irish immigrants would
2 Imre Ferenczi and Walter F. Willcox, International Migrations, Volume 1 Statistics (New York:
1929), pp. 418-433. 3 Timothy J. Hatton and Jeffery G. Williamson, Migration and the International Labor Market, 1850-
1939 (London: 1994), p. 7. 4 David Fitzgerald, Irish Emigration 1801-1921 (Dublin: 1985), p. 5.

10
have had greater control over the decision to emigrate, and their adjustment into the
US economy would not have been subject to the same dire circumstances which faced
the distressed Irish immigrants of the late 1840s. In the second half of the nineteenth
century, emigration to the US became significantly less expensive for Irish labourers
and real wages in the Irish economy rose steadily.5 These Irish had much more of a
choice as to whether to emigrate than did the Irish immigrants of the famine era. They
had more options: staying in Ireland was becoming more feasible as the Irish economy
improved, and leaving for overseas destinations such as the US was becoming both
less expensive and less dangerous as a result of advances in sea transport. The risks of
either choice were lower than they were for the prior generation of Irish. In addition,
economic historians have also found that the Irish exhibited some unique demographic
behavior in this time period. In addition to their unusually high propensity to emigrate,
they were also noted for their distinct marriage patterns, which included a reluctance to
marry coupled with a tendency to have large families when they did marry.6 The
degree to which the Irish maintained these distinct demographic attributes after their
arrival in the US is also a question which merits attention. Finally, the Irish also had
very low levels of return migration.7 Whereas some scholars have questioned the
benefit of studying the assimilation of first generation immigrants in a new society,8
the Irish stayed and settled in the US. Hence it is clearly valid to study their
assimilation process in their new homeland. In sum, the Irish were the most prolific of
immigrant groups in the nineteenth century, they possessed several distinct
5 Timothy W. Guinnane, The Vanishing Irish (Princeton: 1997) pp. 57, 109.
6 Mark C. Foley and Timothy W. Guinnane, “Did Irish Marriage Patterns Survive the Emigrant Voyage?
Irish-American Nuptiality, 1880-1920”, Irish Economic and Social History, 26 (1999), p. 15. 7 Fitzgerald (1985), p. 7. Fitzgerald notes that estimates of return migration for Irish immigrants were
approximately 6%. 8 Alejandro Portes and Ruben G. Rumbaut, “Introduction: The Second Generation and the Children of
Immigrants Longitudinal Study”, Ethnic and Racial Studies, Vol. 28, No. 6, (November, 2005), p. 985.
They describe first generation immigrants as “a restless bunch, here one day and gone the next: in the
society, but not yet of it.”

11
demographic attributes, and the vast majority of them came to America and stayed.
The last two decades of the nineteenth century represent a fascinating time period to
assess their assimilation into American society.
While there has been a great deal of literature written about the Irish in America, there
remain questions, issues and methodological approaches which merit further attention.
For example, there is a lack of consensus regarding whether the Irish achieved
occupational parity with native born Americans in the workplace by the end of the
nineteenth century. In the literature, there are conflicting views. Borjas (1994) found
that European immigrants (including those from Ireland) who arrived in what he terms
The First Great Migration (1880-1924) did not achieve convergence in occupational
levels with native born white males for as long as four generations.9 On the other hand,
Kenny (2006) and Doyle (1975) argued that Irish Americans had achieved relative
occupational parity with native born white Americans by 1900.10 This debate on Irish
occupational mobility will be reviewed in more depth in the literature review, and
Chapter III of this dissertation will seek to develop new evidence with which to assess
this issue.
This dissertation will also examine the assimilation of Irish immigrants away from the
workplace. Ethnic intermarriage (“Intermarriage”) is another important indicator of
assimilation for immigrants. It also has the attractive property of measuring
9 George J. Borjas, “Long-Run Convergence of Ethnic Skill Differentials: The Children and
Grandchildren of the Great Migration”, Industrial and Labor Relations Review , Vol. 47, No. 4 (July
1994) pp. 571-572. 10
Kevin Kenny, “Labor and Labor Organizations” in Making the Irish American: History and Heritage
of the Irish in the United States, J.J. Lee and Marion R. Casey (eds) (New York: 2006), p. 360; David N.
Doyle, „Irish and American Labour, 1880-1920‟, Saothar, vol. 1, 1975, pp. 42-43. In his analysis,
Doyle‟s definition of Irish Americans includes both immigran ts as well as second generation Irish living
in the US.
12
assimilation in the home. As marriage was viewed as a lasting, long term commitment
in the nineteenth century, the decision to marry someone from a different ethnic
background provides a strong signal about an immigrant‟s willingness to adapt to a
new ethnic and social environment. In addition, as the Irish were noted for possessing
distinct marital attributes in this time period, the study of Irish marriage patterns in the
US is an important area for assessing their overall assimilation into American life. In
the literature, intermarriage has been viewed by historians, economists and sociologists
as a critical indicator of assimilation. However, while researchers have examined the
marital behaviour of Irish immigrants in the US in this time period,11 none have
focused specifically on the issue of intermarriage and its use as a measure of
assimilation. Chapter IV will provide such an analysis for my sample of Irish
immigrants living in the US in the late nineteenth century. The focus will be on using
US census data to identify certain causes and consequences of intermarriage, as well as
to examine its impact on assimilation and labour market outcomes.
In the literature on immigrant assimilation, there also exists a debate as to whether
geographic clustering accelerates or delays the assimilation of immigrants into their
new society. By geographic clustering, I refer to the decision by an Irish immigrant to
live in an area which contained a relatively large percentage of Irish immigrants.
Economists and sociologists such as Borjas (1999) and Light and Isralowitz (1996)
have argued that geographic clustering delays immigrant assimilation. Borjas (1999)
found that this was particularly true in cases where the human capital of an ethnic
group is lower than that of the host society.12 However, there is a literature on Irish
immigrants in urban areas such as New York City which argues that the networking
11
See Foley and Guinnane (1999), Landale and Tolnay (1993). 12
George J. Borjas, Heaven’s Door (Princeton: 1999), p. 56.

13
opportunities and support systems which had developed in these cities by the late
nineteenth century aided Irish immigrants in finding work and successfully settling
into American life.13 In addition, sociologists Portes and Rumbaut (1996) have argued
that ethnic enclaves provided significant advantages for immigrant entrepreneurs and
also facilitated immigrant success in the political arena.14 More recently, Cutler et al.
(2008) found that the impact of geographic clustering may be more nuanced, with
potential positive outcomes for some immigrant groups, but negative ones for
immigrant groups with comparatively low levels of education.15 Their work would
appear to confirm that of Borjas (1999) in finding that the level of human capital of an
immigrant group is an important element in assessing the impact of geographic
clustering on assimilation and labour market outcomes. In Chapter V, the issue of
geographic clustering will be examined to determine its impact on the assimilation and
occupational mobility of Irish immigrants in the late nineteenth century. This chapter
will also examine the degree to which the geographic settlement patterns of earlier
cohorts of Irish immigrants influenced the geographic clustering of Irish immigrants at
the end of nineteenth century.
Finally, this dissertation will also analyse the names given to the children of Irish
immigrants as a measure of their parent‟s assimilation into American society. The use
of children‟s names as a measure of assimilation is particularly appealing as it
represents another avenue for assessing the assimilation of immigrants outside of the
workplace. The selection of a non-Irish name for a child is a potential sign of how
13
Lawrence J. McCaffrey, “Forging Forward and Looking Back”, in The New York Irish, Ronald H.
Bayor and Timothy J, Meagher (eds) (Baltimore: 1996), pp. 222, 227; John R. McKivigan and Thomas
J. Robertson, „The Irish American Worker in Transition, 1877-1914” in The New York Irish, Ronald H.
Bayor and Timothy J, Meagher (eds) (Baltimore: Johns Hopkins University Press, 1996), p. 312. 14
Alejandro Portes and Ruben G. Rumbaut, Immigrant America (Berkeley: 1996) p. 54. 15
David M. Cutler, Edward L. Glaeser and Jacob L. Vigdor, “When are Ghettos Bad? Lessons from
immigrant segregation in the United States”, Journal of Urban Economics 63, (2008), p. 772.

14
willing that immigrant parent is for his children to become more assimilated as an
American, whereas the selection of a distinctly Irish name could be viewed as a sign of
cultural persistence and a reduced desire to assimilate. The naming of children can also
be seen as a sign of how parents see themselves, as well as what aspirations they hold
for their children. In the literature, there is a surprising dearth of research into the use
of children‟s names as a measure of assimilation and cultural persistence, despite their
widespread acceptance as effective cultural measures.16 Lieberson (2000) has argued
that it would be extremely difficult for an ethnic group to avoid the influence of the
larger society on the naming patterns of their children, mentioning in particular the
influence of media, literacy and mobility aspirations.17 Chapter VI will seek to assess
to what degree Irish immigrants in the US were able to resist this influence, or
whether, in fact, they sought a greater level of assimilation for themselves and their
children by choosing non-Irish names for their children. In addition, the chapter will
also examine the relationship between the assimilation and labour market outcomes of
Irish immigrants and the types of names they gave their children.
In the chapters to follow, the questions, issues and methodological approaches
described above will be analysed, in each case bringing to bear relevant data from the
US censuses of 1880 and 1900, in addition to other sources, to enhance the
understanding of the assimilation process of Irish immigrants in late nineteenth century
America. In this research, I will also seek to make contributions to a range of
literatures concerned with the assimilation experience of immigrants. With respect to
the cliometric literature, my use of matched Irish and native born samples in Chapter
III will enable me to assess the assimilation and occupational mobility of Irish
16
See Rossi (1965), Zelinsky (1970), Lieberson and Bell (1992). 17
Stanley Lieberson, A Matter of Taste (New Haven: 2000), p. 221.

15
immigrants in the US at the end of the nineteenth century across a range of important
characteristics. In Chapter IV, my use of these matched samples will allow me to
conduct a longitudinal study of potential causes and consequences of intermarriage for
Irish immigrants. In Chapter V, I will examine the relationship between the level of
geographic clustering and the assimilation and occupational outcomes of Irish
immigrants. Finally, in Chapter VI, my contribution to this literature will be to assess
the assimilation of Irish immigrants using the naming of children as the unit of
measurement.
For the literature on Irish immigration, my research in Chapters III and V will
contribute to the understanding of the occupational mobility of Irish immigrants in late
nineteenth century America. As will be discussed, there is some evidence in this
literature which suggests that the Irish made advances in areas such as local
government, unionised work and the clergy. My research in Chapter III will allow me
to take a broad and systematic approach to assessing the labour market outcomes of the
Irish in this time period. In Chapter V, my research will allow me to assess the
literature which argues that the Irish benefited from networks and support systems in
their new communities which helped them to find work and settle into American life.
Finally, with respect to the literature on immigrant assimilation, I will approach
assimilation as a multi-dimensional process without pre-ordained outcomes.
Throughout this dissertation, I will examine relevant segments of both the Irish and
native born populations in addition to aggregate analyses, and will also explore issues
of assimilation which extend beyond the frequently analysed areas of occupational
mobility and earnings. My research will analyse other aspects of assimilation including

16
variables such as marriage and spousal characteristics, fertility, child mortality,
literacy, geographic location (both in terms of rural vs. urban locations as well as
ethnic clustering), home ownership and the choice of children‟s names. This
dissertation will also address the relationship between assimilation and occupational
mobility, as well as that between assimilation and the ethnic environment in which
immigrants lived in the late nineteenth century.

17
Literature Review
Although Zangwill (1908) saw immigrant assimilation into American society solely in
terms of his melting pot metaphor, others who have studied assimilation have since
developed a broader and more nuanced view encompassing a range of possible
outcomes for immigrants in a new homeland. In his classic work Assimilation in
American Life, sociologist Milton Gordon (1964) views assimilation as being a
question of degree, where various stages can be identified. In his work, he outlines
seven distinct stages of the assimilation process. Within these stages, varying degrees
of assimilation can occur.18 Gordon also identifies three primary philosophies of
assimilation that he views as being applicable to the American experience. These are
“Anglo-conformity,” “the melting pot” and “cultural pluralism.” Under Anglo-
conformity, immigrants completely renounce their ancestral culture in favour of the
behaviour and values of the Anglo-Saxon core group. The melting pot has the same
meaning as expressed in the work of Zangwill (1908). Cultural pluralism describes the
maintenance by immigrants of significant portions of their ancestral culture in the
context of American citizenship and political and economic integration into American
society.19 Gordon (1964) thus expands the spectrum of possible assimilation outcomes
to encompass both the complete acceptance of the host culture and significant retention
of ancestral ways. This broader approach, and the recognition that assimilation can
occur in varying degrees across characteristics, helps to provide a more robust basis to
consider the assimilation of the Irish into American society in the late nineteenth
century.
18
Milton M. Gordon, Assimilation in American Life (New York: 1964), p. 71. 19
Gordon (1964), p. 85.
18
Moynihan and Glazer (1963) also question the idea that American society was a
melting pot in the nineteenth and twentieth centuries. In Beyond the Melting Pot, they
examine the experiences of five distinct ethnic groups in New York City beginning in
the late nineteenth century and continuing into the mid-twentieth century. They
conclude that the melting pot did not happen, “at least not in New York and, mutatis
mutandis, in those parts of America which resemble New York.”20 They find that “the
assimilating power of American society operated on immigrant groups in different
ways,” but nonetheless left them “distinct and identifiable.”21 In analysing the Irish,
along with Negroes, Jews, Puerto Ricans and Italians, they find that ethnic differences
survive multiple generations across a range of characteristics, and they conclude their
book by noting that even Zangwill himself, in the years following the publication of
The Melting Pot, “retreated from his earlier position on racial and religious mixture.”22
Kelly (2005) also rejects the idea of a single melting pot model for immigrant
assimilation. She argues that immigrants (including the Irish) “retained important
aspects of their heritages through succeeding generations.” She also supports the view
that immigrant assimilation is not a linear progression towards complete adaptation,
but rather one in which variation can occur, influenced by social, economic and
cultural factors.23
More recent work by scholars across a range of academic disciplines continues to
emphasise that a broad approach to defining assimilation is required. Kurther and
Heisler (2009) argue that immigrant integration in Western democracies is not linear,
20
Nathan Glazer and Daniel Patrick Moynihan, Beyond the Melting Pot (Cambridge: 1963), p. v. 21
Glazer and Moynihan (1963), pp. 13-14. 22
Glazer and Moynihan (1963), p. 290. 23
Mary C. Kelly, The Shamrock and The Lilly – The New York Irish and The Creation of a
Transatlantic Identity 1845-1921 (New York: 2005), p. 4.

19
but a complex patchwork of multidimensional frameworks.24 Freeman (2004) also
argues for a multi-sectoral framework for understanding immigrant incorporation into
a new society. For Freeman (2004), immigrant assimilation is the result of the
interaction of institutions and decisions of immigrants. He expects that immigrant
assimilation outcomes will vary across different domains of society, with results
“being a mixed bag not fully assimilationist, pluralist, or multicultural.”25 Brubaker
(2001) argues for an approach to assimilation which is willing “to consider multiple
reference populations” and “segmented forms of assimilation”.26 He supports the view
that immigrant assimilation research should be multidimensional and agnostic about its
outcomes. For Brubaker (2001), assimilation is not a theory, but simply a concept.27
Light and Isralowitz (1996) define assimilation as the “ultimate absorption” of ethnic
groups into their new society. They argue, however, that complete adaptation by
immigrants is much more of a goal than a reality. They advocate the need for the
concept of acculturation, where fluency in language and culture is achieved, but
broader assimilation does not occur. This more limited form of assimilation is more
frequently observed in their research.28 Portes and Rumbaut (1996) also endorse the
dual concepts of assimilation and acculturation in the study of immigrant assimilation.
In their view, acculturation is the first step in the process of adaptation of immigrants
into a new society. They view assimilation as the final stage, but argue that the process
24
Hermann Kurthen and Barbara Schmitter Heisler, “Immigrant integration: comparative evidence from
the United States and Germany”, Ethnic and Racial Studies, Vol. 32, No. 1 (January 2009), p. 139. 25
Gary P. Freeman, “Immigrant Incorporation in Western Democracies”, International Migration
Review, Vol. 38, No. 3 (Fall 2004), p. 960. 26
Rogers Brubaker, “The return of assimilation? Changing perspectives on immigration in France,
Germany and the United States”, Ethnic and Racial Studies Vol. 24, No. 4 (July 2001), p. 540. 27
Brubaker (2001), p. 544. 28
Ivan Light and Richard E. Isralowitz, Immigrant Entrepreneurs and Immigrant Absorption in the
United States and Israel (Aldershot: 1996), p. viii.

20
is not uniform. Outcomes are varied and can be segmented, reflecting a wide range of
immigrant experiences.29
Within the literature on immigrant assimilation, the study of the occupational mobility
of immigrants has attracted a great deal of attention from scholars. Gans (2007)
clarifies that assimilation and mobility are independent processes, and that immigrants
“can assimilate without being mobile and vice versa”.30 He argues that studies of
European immigrant assimilation during the age of mass migration must take account
of the fact that this period was one of “nearly universal upward mobility” and that most
Europeans were extremely poor when they arrived in the US “and could only move
up”.31 He makes the case that assimilation and mobility need to be examined as
independent processes and not treated as the same phenomenon, particularly in the late
nineteenth century period. In an analysis of contemporary immigrants to the US, Portes
and Zhou (1993) also argue that immigrants can achieve economic advancement
without broader assimilation into their new host society.32
In this area of research, the question of whether late nineteenth century Irish
immigrants achieved occupational parity with native born Americans has been
addressed by several researchers, but with differing conclusions. Kenny (2006) argues
that the Irish in America made significant progress in the last two decades of the
nineteenth century and “achieved rough occupational parity with the native born” by
1900. He does make an adjustment for the fact that the Irish were much more
29
Portes and Rumbaut (1996), pp. 247-8. 30
Herbert J. Gans, “Acculturation, assimilation and mobility”, Ethnic and Racial Studies, Vol. 30, No. 1
(January 2007) p. 152. 31
Gans (2007), p. 152. 32
Alejandro Portes and Min Zhou, “The New Second Generation: Segmented Assimilation and its
Variants”, Annals of the American Academy of Political and Social Science, Vol. 530, (November
1993), p. 96.

21
urbanised than the broader American population to reach this conclusion. Kenny
(2006) argues that while the Irish were much more heavily concentrated than the
national workforce in skilled and unskilled labor, and significantly underrepresented in
agriculture, that this outcome is the result of their more urban orientation. Adjusting
for this fact, Kenny (2006) finds that the Irish by 1900 were less concentrated in
“menial labour” and were disproportionately represented in higher skilled, better paid
and unionised trades than the broader population.33
Doyle (1975) researched Irish immigrants in America in the nineteenth century and
found them to be the first urban as well as the first working class Irish. He notes that in
the 1850s, while fewer than 20% of native born Americans were urbanised, more than
75% of Irish Americans were.34 With regard to the issue of occupational mobility, he
argues that by 1900, “Irish America had attained class-structure parity with native
stock Protestant white America.”35 To support this assertion, Doyle (1975) argues that
only 15% of all working Irish Americans were “unskilled manual laborers” and that
only in what he refers to as the “atypical” state of Massachusetts were most of the
unskilled workers still Irish.36 Doyle (1975) argues that while approximately 60% of
Irish American workers were blue collar in 1900, “5-6% were of middle class proper
social and economic standing” and a further “16-17% were lower middle class.” Doyle
(1975) finds these levels to be in aggregate “comparable to the rates of native
Protestant stock and far advanced on the patterns of new immigrants.”37 However,
Doyle (1975) does not provide supporting evidence for this argument, nor does he
33
Kenny (2006), p. 360. 34
Doyle (1975), pp. 42-43. 35
Doyle (1975), p. 43. 36
Doyle (1975), p. 43. 37
Doyle (1975), p. 50.
22
provide detailed footnotes for the proper referencing of his data sources.38 This author
would also question the accuracy of referring to the native born as being “Protestant”,
given that religious affiliation was not a question asked of respondents to the US
census. In addition, by 1900 the US had witnessed more than a century of significant
levels of immigration from such predominantly Catholic nations as Germany and
Ireland.
Miller (1985) also addresses the occupational assimilation of Irish immigrants in the
late nineteenth century. While endorsing Doyle‟s (1975) view that the Irish had been
successful in achieving occupational parity with native born white Americans, he
stresses that it was the children of immigrants who “took fullest advantage of the
mushrooming growth of corporate staffs and public service bureaucracies.”39 He states
that by 1900, the domination of trade unions by the Irish and the “relative maturity of
Irish-American societies” provided newcomers with a “wide range of kinship networks
and formal social, political and charitable institutions” which enabled the Irish to
achieve upward social mobility in the late nineteenth and early twentieth centuries.40
Notwithstanding this economic success, Miller (1985) finds that a “significant
minority” of Irish Americans saw themselves as exiles from their homeland and that
“homesickness and discontent were remarkably widespread in turn of the century Irish
America.”41 This concept of Irish immigrants as exiles and its implications for their
assimilation into American society will be examined later in this chapter.
38
Doyle lists selected secondary sources and refers to the “Census of Occupations, 1890 and 1900, U.S.
Bureau of the Census” and “Congressional Record, 1890-1915”, but does not provide section or page
references. 39
Kerby A. Miller, “Assimilation and alienation: Irish emigrants‟ responses to industrial America, 1871-
1921”, in The Irish in America: Emigration, Assimilation and Impact , P.J. Drudy (ed) (Cambridge:
1985), p. 89. 40
Miller (1985), p. 92. 41
Miller (1985), p. 107.

23
In contrast to the work of Kenny (2006) and Doyle (1975), Borjas (1999) reaches a
very different conclusion regarding the occupational mobility of Irish (as well as other
European) immigrants during this timeframe. With regard to these turn of the century
immigrants, Borjas (1999) does not support the idea of a melting pot where ethnic
differences melt away, nor does he accept the idea of Anglo-conformity. In his view, a
“simmering pot”, where differences take several generations to disappear is more
appropriate.42 In his analysis of European immigrants (including those from Ireland)
who arrived in what he terms The First Great Migration (1880-1924), he finds that
these immigrants did not achieve convergence in occupational levels with native born
white males for as long as four generations.43 Using US census data from 1910, 1940
and 1980 and creating synthetic cohorts to analyse subsequent generations of the First
Great Migration, Borjas (1994) tracks the occupational outcomes of these immigrants
and their descendants and finds that “ethnic skill differentials do not converge within
three generations.”44 Borjas (1999) finds a significant role for what he calls ethnic
capital – “the whole set of ethnic characteristics - including culture, attitudes, and
economic opportunities” – to which members of particular ethnic groups are
exposed.45 He argues that these influences have spillover effects on human capital
accumulation and that the “quality” of the ethnic environment matters. Borjas‟ (1994)
results would appear to repudiate the conclusions of Kenny (2006) and Doyle (1975).
In this dissertation, I will address this difference of opinion regarding Irish
occupational mobility using a new sample of Irish immigrants drawn from the 1880
and 1900 US censuses.
42
Borjas (1999), p. 144. 43
Borjas (1994), pp. 571-572. 44
Borjas (1994), p. 566. 45
Borjas (1999), p. 148.
24
One of the first scholarly works to address the occupational skill levels of immigrants
during the First Great Migration is Douglas‟ (1919) classic work “Is the New
Immigration More Unskilled Than The Old?” In this article, Douglas reviews the
relative skill levels of immigrants to the US in the late nineteenth and early twentieth
centuries. For Douglas (1919), the purpose of his work is to review the contemporary
view that the then newer immigration from Southeastern Europe was more unskilled
than the older immigration from Northwestern Europe. He had two principal findings
which led him to refute the contemporary viewpoint of a decline in the skill levels of
the newer immigrants. The first was that previous analysis had erroneously excluded
Hebrews from the category of new immigrants (with this group being “the most skilled
of all the newer races.”)46 The second, and in Douglas‟(1919) view the more important
finding, was that the prior analyses by the Immigration Commission and other scholars
had compared the two waves of immigrants at the same point in time (1899-1909). In
so doing, these analyses had failed to examine the skill levels of these immigrants
when both were the “dominant element” in immigration to the US.47 With these two
adjustments, Douglas (1919) finds that the newer immigrants are in fact not less skilled
than the older ones.48 Though he was writing almost a century ago, Douglas‟ (1919)
effort to assess immigrant skill levels based on analysing data in an unbiased manner
provided a sound foundation for future immigration research.
More recently, several scholars have also assessed the occupational mobility of
European immigrant groups in the late nineteenth century time period. Some of these
46
Paul H. Douglas, “Is the New Immigration More Unskilled than the Old?”, American Statistical
Association, Vol. 16, No. 126 (June 1919), p. 393. 47
Douglas (1919), p. 394. 48
He does find that among the older immigrant groups, the Irish were much less skilled than the
English, French and German immigrants in this timeframe.

25
works lend support to the idea that the Irish immigrants could have achieved
convergence with native born Americans in this time period. Blau (1980) examines the
wages of immigrants relative to native born Americans using data from the Reports of
the (US) Immigration Commission. This wage data, which was assembled in the year
1909, allows for a comparison of various immigrant groups relative to native born
white Americans across a range of occupations. Her principal conclusion is that
immigrant skill levels and the amount of time living in the US are the two primary
variables which explain the gap in wage levels between immigrants and natives. In her
regression analysis, she controls for differences in skill levels (among other factors)
and predicts that male immigrants from a poorer group of regions including Ireland,
Southern Europe and French Canada will achieve convergence in wage levels with
native born white males approximately 17 years after their arrival in the US.49 Her
conclusions would appear to lend support to the argument that immigrants could
achieve convergence with native born white Americans in just one generation.
In a study involving a sample of approximately 4,000 immigrants in the US state of
Iowa in the last decade of the 1800s, Eichengreen and Gemery (1986) also find that
time in the US is a crucial variable in immigrant occupational mobility. While their
study does not conclude that immigrants achieved parity with native born Americans,
they do reach some interesting and relevant conclusions regarding the occupational
mobility of immigrants in late nineteenth century America. In their study, they find
that immigrants with prior skills had an initial wage advantage over unskilled
immigrants. Their definition of a skilled worker meant that a person possessed
49
Francine D. Blau, “Immigration and Labor Earnings in Early Twentieth Century America”, Research
in Population Economics, Volume 2 (1980), p. 32.

26
“training which could be put to use in their US occupation.”50 They also highlight three
main influences which they believe are reflected in the relative earnings of skilled and
unskilled immigrants. These are the quantity of skills, the quality of skills, and age
(where age captures the concept that older workers will assimilate less quickly into
American society than younger ones). In their sample, immigrants earn less than
natives, and are older, less unionised and more likely to be married. Even when they
control for these characteristics, they still find that immigrants earn less than natives.
They conclude that while skilled immigrants have an initial advantage over unskilled
immigrants, the unskilled narrow this advantage as they spend more time in the US.
They find that this catch-up by unskilled immigrants is driven by all three influences:
skill quantity (where the unskilled acquire skills), skill quality (where the skills they
learn are of a higher quality because they are acquired and are able to be applied in the
US labor market) and age (they are younger and thus assimilate more rapidly).
Hanes (1996) utilises two regional datasets of workers earnings and occupations to
assess the occupational mobility of late nineteenth century immigrants in the US
labour market. Using state labour bureau surveys conducted in California in 1892 and
in Michigan in 1888 and 1890, Hanes (1996) finds that immigrants from Northwestern
Europe (including those from Ireland) experienced slower growth in wages and
occupational status than did the native born.51 He does accept that the surveys are very
limited in terms of their range of occupations, but notes that there are no other similar
sources available.52 As such, one potential weakness of his work is that the datasets are
50
Barry Eichengreen and Henry A. Gemery, “The Earnings of Skilled and Unskilled Immigrants at the
End of the Nineteenth Century”, Journal of Economic History, Vol. XLVI, No. 2 (June, 1986), p. 442. 51
Christopher Hanes, “Immigrants‟ Relative Rate of Wage Growth in the Late 19th
Century”,
Explorations in Economic History, 33, 35-64. (1996), p. 60. 52
Hanes (1996), p. 39. Hanes notes that the 1888 Michigan survey “is limited to workers in the
manufacture of slate, grindstone, gypsum, and building stone; a small number of coal miners; and

27
not representative of the broader labour market at that time. In his results, he finds that
all the immigrant groups in his study under perform the native born. He uses this result
to argue that discrimination against immigrants was not a significant factor in the
labour market, as immigrants from England, Scotland and British Canada under
performed the native born in a similar manner to those from Ireland and Germany.53
Hatton (1997) also examines the issue of the immigrant occupational mobility as
measured by earnings in the late nineteenth century. Utilising similar regional earnings
data sources to Hanes (1996); he finds that pre-1890 immigrants to the US did in fact
achieve convergence with the native born in the workplace.54 In his analysis, he
specifically takes into account the worker age, as well as whether an immigrant arrived
as a child or as an adult. With respect to age, he finds that there is a pattern in which
late nineteenth century workers “exhibit rapid earnings growth up to the mid-20s and
then slower earnings growth thereafter.”55 He also finds that immigrants who arrive as
children closely resemble the native born in earnings whereas those that arrive as
adults experience an initial disadvantage but do assimilate gradually to native born
earnings standards.56 For Hatton (1997), specifying an earnings function which takes
into account these factors leads him to conclude that immigrants to the US in the late
nineteenth century did in fact assimilate well in the labour market.
workers in the “fire clay” industry.” The 1890 Michigan survey covers workers “in foundries, and
machine shops.” The California survey is the “most comprehensive,” including workers “in construction
and manufacturing.” 53
Hanes (1996), p. 59. 54
Timothy J, Hatton, “The Immigrant Assimilation Puzzle in Late Nineteenth Century America,” The
Journal of Economic History, Vol. 57, No. 1, 34-62, (March 1997), p. 59. 55
Hatton (1997), p. 59. 56
Hatton (1997), p. 58.
28
Minns (2000) employs US census data to assess the occupational mobility of turn of
the century immigrants. While acknowledging that “no consensus has emerged
regarding the performance of American immigrants over the period 1890-1910,” he
finds that immigrants performed well in both blue and white collar occupations, either
catching up or surpassing native born workers in earnings.57 Minns (2000) also finds
that immigrants in this timeframe had significant occupational mobility and “were able
to move across sectors when opportunities presented themselves.”58 He finds
particularly strong earnings growth for those immigrants who were able to move into
white collar employment. His work, while not distinguishing the Irish from other
immigrant groups, does suggest that immigrants in the US at the turn of the century
were able to achieve occupational convergence with native born workers.
The issue of whether the geographic clustering of immigrants aids or impedes
assimilation and occupational mobility has also received much attention from scholars.
With respect to Irish immigrants, this issue will be addressed in detail in Chapter V of
this dissertation. Similar to other questions involving immigrant assimilation, the
literature on this topic crosses a variety of academic disciplines including economics,
economic history and sociology. Portes and Rumbaut (1996) argue that geographic
clustering aids immigrants, in particular for entrepreneurs and for those immigrants
operating in the political arena. For entrepreneurs, they find that ethnic clustering can
provide “access to working capital, protected markets and pools of labor.” In the realm
of politics, they stress that there is “strength in numbers” and argue that politics “can
serve as an avenue of individual upward mobility when other paths remain blocked.”59
57
Chris Minns, “Income, Cohort Effects, and Occupational Mobility: A New Look at Immigration to the
United States at the Turn of the 20th
Century”, Explorations in Economic History, 37 (2000), p. 328. 58
Minns (2000), p. 344. 59
Portes and Rumbaut (1996), p. 54.

29
They specifically mention the late nineteenth century Irish as an example of this
phenomenon. While Portes and Rumbaut (1996) do not argue that geographic
clustering accelerates the assimilation of immigrants, they do believe that it can lead to
greater opportunities for upward occupational mobility. For contemporary immigrants
to the US, Portes and Zhou (1993) also find support for the argument that geographic
clustering aids occupational mobility. They argue that immigrants benefit from
networks in their ethnic communities that can provide “moral and material resources
well beyond those available from official assistance programs.”60 Gordon (1964) also
supports the idea that geographic clustering is beneficial to immigrants. He argues that
the vast majority of newcomers “will need and prefer the security of communal life
made up of fellow immigrants from the homeland.” He believes that acculturation,
where immigrants learn the language, culture and institutions of their new country, and
not more complete assimilation, is the appropriate goal for new immigrants. Gordon
(1964) stresses the benefits of “the comfortable sociological and psychological milieu
which the communality of his own group provides.”61
In the more specific literature on the Irish experience in the late nineteenth century
America, there is support for the idea that geographic clustering is a benefit to both the
assimilation and occupational mobility of these immigrants. This literature argues that
the clustering of the Irish in urban centres such as New York City contributed to their
economic success and facilitated their assimilation into American society. McCaffrey
(1996) argues that the Irish were particularly effective in achieving influence in “the
Catholic Church, politics and the labor movement” and that this success helped to
60
Portes and Zhou (1993), p. 86. 61
Gordon (1964), p. 243.

30
“launch Irish America into the middle class.”62 He finds that the Irish were in fact
“overrepresented in the upper echelons” of the labor movement, though he provides no
evidence to support this assertion. McKivigan and Robertson (1996) also find the Irish
to be highly adept at using their political strength to bolster their economic progress in
New York City. In particular, they stress the success of the Irish in entrenching
themselves in city government jobs such as “policemen, firefighters, rapid transit
workers and school teachers,” as well as in employment such as foremen and
superintendent positions and white-collar clerical work.” They attribute their economic
success to their “knowledge of English and political connections.”63 Finally, Kelly
(2005) also presents evidence supporting the view that geographic clustering aided
Irish immigrants, in her case the area under study was New York City. She focuses on
the role of support organisations such as the Ancient Order of the Hibernians and the
Society of St. Vincent de Paul, which provided “mid and late nineteenth century
arrivals with a support base in a strange city” and helped immigrants to secure
employment. Although she stresses that a meaningful percentage (perhaps as high as
20%) of Irish immigrants in this period were Protestant, she finds that these Catholic
Church affiliated organisations, together with the Church itself, were the “cornerstones
of ethno-religious success for the Irish in New York City.64
In contrast to this group of scholars, however, there are several researchers who have
questioned the benefits of geographic clustering for the assimilation and occupational
mobility of new immigrants. Borjas (1999) argues that geographic clustering results in
skill differences across ethnic groups which persist over time and across generations.
He states that exposure to other ethnic environments with higher human capital can
62
McCaffrey (1996), p. 222. 63
McKivigan and. Robertson (1996), p. 312. 64
Kelly (2005), pp. 147,150.
31
have a positive influence on reducing skill differentials. He asserts that “ethnic capital
creates a type of stickiness in the process of social mobility, making it difficult for
persons in disadvantaged ethnic groups to move up and for persons in the advantaged
ethnic group to move down.”65 Utilising evidence on contemporary immigrants, he
finds a negative correlation between the rate of economic assimilation of immigrants
(as measured by wage growth) and the geographic clustering of that immigrant
group.66 He views the “warm embrace” of the ethnic enclave as an “economic
stranglehold,” and concludes that “the more intense the ethnic clustering in the
immigrant generation, the longer it takes for the melting pot to do its job of dissolving
the ethnic differences and forging the „New Americans.‟”67 Light and Isralowitz
(1996) also argue that participation in the general labour force speeds assimilation,
while participation in the ethnic community slows it. They view ethnic enclaves as
slowing the cultural and linguistic acculturation of contemporary immigrants, which
has the economic effect of slowing the immersion of these immigrants into the general
labour pool.68
More recently, Cutler et al. (2008) have also addressed this issue using contemporary
data on first generation immigrants to the US. In their work, they use US census data
for 1990 to address the debate as to whether immigrant segregation in more ethnically
concentrated areas hinders their educational and labour market outcomes.69 They argue
that the conclusion is nuanced – that ethnic concentration can have benefits as
measured by educational and labour market outcomes for contemporary immigrants to
65
Borjas (1999), p. 14. 66
Borjas (1999), p. 56. 67
Borjas (1999), p. 57. 68
Light and Isralowitz (1996), p. xi. 69
Cutler et al. (2008), p. 762.

32
the US. However, they also find that groups with very low education levels “appear to
suffer negative consequences associated with living in an enclave community.”70
As this section of the literature review has demonstrated, there is a sharp debate over
the impact of geographic clustering on the assimilation and occupational mobility of
immigrants. Interestingly, economists, economic historians and sociologists line up on
both sides of the debate. For the Irish, having access to strong support networks in their
ethnic communities may have provided them with initial advantages in finding work
and settling into their new host society. But did it actually slow their subsequent
assimilation and occupational mobility? Did these networks and support systems
improve their starting position in American society, but also reduce their incentive to
assimilate and learn about the wider American experience? With my sample data, I
will seek to analyse the experience of Irish immigrants in the late nineteenth century to
bring new evidence to bear on this issue. As mentioned previously, the late nineteenth
century represents an ideal time period for assessing this question as several historians
have argued that the Irish immigrants to the US in this era benefited from a strong
network established by prior Irish immigrants, and that they were not subject to the
extreme conditions faced by Irish immigrants during the mid-nineteenth century. In
addition, the subsequent arrival of large numbers of Southern and Eastern Europeans
beginning in the first decade of the twentieth century began to challenge the
advantaged position of the Irish in local government and labour unions.71 Thus, if there
were positive benefits to geographic clustering for Irish immigrants in the US, they are
likely to be found in the late nineteenth century time period which is the focus of this
dissertation.
70
Cutler et al. (2008), p. 772. 71
Glazer and Moynihan, (1963), pp. 260-2.

33
Related to the issue of geographic clustering is the impact of an immigrant‟s ethnic
environment on their assimilation and labour market outcomes. Hatton and Leigh
(forthcoming) argue that immigrants do not assimilate as individuals, but as
communities. They find that history does play a role in the subsequent assimilation
experience of immigrant groups in that the more established is the tradition of an
immigrant group, the more integrated that immigrant community will be in its new
host society. As a result, they argue that newly arrived immigrants from more
integrated groups assimilate more easily into the labour market.72 Borjas (1999) places
emphasis on ethnic capital, which he defines as “the whole set of ethnic characteristics
- including culture, attitudes, and economic opportunities” – to which members of
particular ethnic groups are exposed. He argues that ethnic capital “effectively lowers
the flame under the melting pot from a full boil to a slow simmer” and makes it
difficult “to escape the economic fate implied by one‟s ethnic background.”73 Borjas
(1999) argues that the influences of ethnic capital have spillover effects on human
capital accumulation and hence that the “quality” of the ethnic environment has a key
role to play in immigrant assimilation. He also credits sociologist James Coleman with
developing the concept of social capital, of which ethnic capital represents but one
type. Coleman (1988) defines social capital as “a particular kind of resource” available
to an individual in a social structure that enables that person to take an action he would
not otherwise be able to take. This resource results from “changes in the relations
among persons that facilitate action.” Coleman (1988) argues that while social capital
is “less tangible than physical capital or human capital,” it is equally able to facilitate
productive activity. He uses as an illustration a group having “extensive
72
Timothy J. Hatton and Andrew Leigh, “Immigrants assimilate as communities, not just as
individuals”, Journal of Population Economics, (forthcoming), p. 2. 73
Borjas (1999), p. 14.

34
trustworthiness and trust” being able to accomplish “much more than a comparable
group without that trustworthiness and trust.”74 The impact of social capital is
primarily in its ability to affect the formation of human capital. The concept of social
capital is applicable to this dissertation in the analysis of the impact of ethnic ties and
geographic clustering on the assimilation of immigrants into American society.
Other scholars have also examined the impact of social capital on immigrant
assimilation. Portes (1995) defines social capital as “the capacity of individuals to
command scarce resources by virtue of their membership in networks or broader social
structures.” He views social capital as representing the positive economic effects
resulting from these social structures.75 Similar to Hatton and Leigh (forthcoming), he
stresses that immigrants are not just individuals but members of groups, and
participants in social structures that affect their economic mobility. From this vantage
point, Portes (1995) finds ethnic enclaves to be of significant value to immigrants,
“creating numerous economic opportunities for newcomers that are unavailable in the
external labor market.”76 He acknowledges that there are hidden costs to social capital
in the form of constraints on individual activity imposed by community norms, and a
frequent obligation to “share the wealth” with other group members.77 Notwithstanding
these hidden costs, he is nonetheless an advocate of the benefits of ethnic clustering for
immigrant adjustment into a new society.
Roberts (1995) also examines the influence of social capital on the success of new
ethnic groups in America, but reaches a different conclusion than Portes (1995). He
74
James S. Coleman, “Social Capital in the Creation of Human Capital”, American Journal of
Sociology, Volume 94 (1988), pp. S100-101. 75
Alejandro Portes, The Economic Sociology of Immigration (New York: 1995), p. 12. 76
Portes (1995), p. 28. 77
Portes (1995), p. 14.

35
notes that neo-classical economics tends to focus on the endowments of individuals
within immigrant groups as an explanation for the varying adjustment of these groups
into American society. He believes, however, that the usefulness of these individual
endowments “depends not only on the economic context but on a supportive social
environment.”78 With respect to ethnic enclaves, he acknowledges that immigrants can
create enclaves “in which they speak their native language, shop in stores owned by
co-ethnics, and even be employed by co-ethnics.” However, he finds that “many good
employment opportunities lie with employers who are not co-ethnics” and “a whole
range of government services … are likely to be run by people of a different ethnic
origin.”79 With respect to the Irish, he makes the interesting observation that the
combination of their status as “cultural exiles” (also noted previously by Miller
(1985)), together with the significant flow of new Irish immigrants over many decades,
had the effect of helping them to sustain a distinct ethnic identity in America. Relative
to many other immigrant groups, he finds the ethnic cohesion of the Irish to be quite
strong. He explains this strength by stressing that the Irish were more likely to be
permanent versus temporary residents of the US (owing to their strong sense of being
cultural and political exiles from their homeland), and from the reinforcing effect
which constant, high levels of immigration had on their ethnic identity.80 Roberts
(1995) does not address, however, what impact this strong sense of ethnic identity had
on the assimilation of Irish immigrants, though his concerns about the economic
limitations of ethnic enclaves may provide a sense of what his views may have been.
78
Bryan R. Roberts, “Socially Expected Durations and the Economic Adjustment of Immigrants”, in
The Economic Sociology of Immigration, Alejandro Portes (ed) (New York: 1995), p. 42. 79
Roberts (1995), pp. 57-58. 80
Roberts (1995), p. 64.

36
The literature on Irish immigrants has also focused on several aspects of assimilation
beyond occupational mobility. Akenson (2000) brings a different perspective to the
study of the assimilation experience of the Irish in the nineteenth century by focusing
on what he sees as the misconceptions of that experience. In particular, he rejects the
notion that the vast majority of Irish immigrants and their children were Roman
Catholic, arguing that Protestants were a meaningful percentage of Irish immigrants
and in fact may make up the majority of present day Irish America.81 He also urges an
integrated focus on Irish immigrants in both the US and Canada, claiming that the
porous Canadian border and cheaper transport to many Canadian ports in the
nineteenth century resulted in many Irish immigrants coming to America via Canada
(in addition to those who chose to reside in Canada). With respect to the assimilation
of Irish immigrants, he argues that the perception that the “culture of Roman
Catholicism” left the Irish “backward and not fully able to cope with modernising
America” is incorrect. He claims that this view, which he attributes to Miller (1985),
ignores the success of Catholic immigrants in Canada and the US, as well as those of
the Protestant Irish community. He concludes that “the idea that the Gaelic-Catholic
culture was a heavy disability” for Irish individuals in the modern world of nineteenth
century North America is not valid.82
This dissertation will explore aspects of assimilation beyond occupational mobility and
will assess whether the issue of cultural persistence applies to other socio-economic
characteristics of Irish immigrants in the late nineteenth century. Guinnane, Moehling
and O‟Grada (2006) address one such aspect by examining the fertility experience of
81
Donald Harman Akenson, “Irish Migration to North America, 1800-1920”, in The Irish Diaspora,
Andy Bielenberg (ed) (London: 2000), p. 111. Given that the US census did not ask about a
respondent‟s religion, it is not possible to accurately assess religious affiliation using US census data. 82
Akenson (2000), p. 131.

37
turn of the century Irish immigrants in America. They find that the Irish do not adopt
the fertility patterns of the native born white population, but retain a much higher level
of fertility. They also show that this gap cannot be explained by differences in
observable characteristics such as occupational class, home ownership or other similar
socio-economic factors.83 Like Roberts (1995), they note that Irish immigrants in the
US retained strong links to their Irish heritage. They present evidence from the 1910
US census to argue that this distinctiveness also carried over to their fertility patterns.
Unlike most other immigrant groups, the Irish reduced their fertility through their
marriage patterns. They combined relatively low levels of nuptiality with relatively
high levels of marital fertility. This fertility pattern is unique to the Irish, both in
Ireland and in first generation immigrants in the US (though the Irish in Ireland had
larger families than those in the US).84 The authors conclude that this fertility pattern
indicates the “persistence of cultural differences.”85
No review of the immigrant assimilation literature would be complete without
acknowledging the groundbreaking work of Thernstrom (1964, 1973), and the
subsequent work of scholars including Kessner (1977) and Bodnar et al. (1982). These
scholars were among the first to address the occupational and social mobility of
immigrants and other working class Americans beginning in the nineteenth century.
Thernstrom (1964, 1973), Kessner (1977), and Bodnar et al. (1982), produced detailed
studies which made use of a host of local data sources including census manuscripts,
city directories, marriage licenses, housing deeds, mortgage data, and birth and tax
records to explain the experience of working class natives and immigrants in specific
83
Timothy W. Guinnane, Carolyn M. Moehling and Cormac O‟Grada, “The fertility of the Irish the
United States in 1910”, Explorations in Economic History 43 (2006), pp. 483-484. 84
Guinnane, Moehling and O‟Grada (2006), p. 467. 85
Guinnane, Moehling and O‟Grada (2006), p. 482.

38
towns and cities. Thernstrom (1964), in his pioneering work on the residents of
Newburyport, Massachusetts, was perhaps the first scholar to attempt to assess the
openness of nineteenth century American class structure. He describes his classic
work, entitled Poverty and Progress – Social Mobility in a Nineteenth Century City, as
a volume which “deals with the lives of hundreds of obscure men who resided in a
New England community in the latter half of the nineteenth century.”86 Interestingly
and perhaps not surprisingly, Irish immigrants were an important source of labour in
Newburyport throughout his period of analysis.87 Thernstrom‟s (1964) principal
conclusion is that social mobility for working class men in Newburyport in the second
half of the nineteenth century was limited - „Few of these men and few of their
children rose very far on the social scale.”88 In a subsequent work on social mobility in
the city of Boston, Thernstrom (1973) finds that immigrants fared “much less well than
natives in the occupational competition.” On a comparative level, he finds that “the
Irish and Italians moved ahead only sluggishly and erratically,” while the English and
the Jews “found their way into the higher occupational strata with exceptional
speed.”89 Thernstrom (1973) concludes that relative to Newburyport, working class
natives and immigrants experienced greater upward mobility in the larger and more
diversified economy of Boston.
Kessner (1977) and Bodnar et al. (1982) also examine the experience of working class
immigrants in the cities of New York and Pittsburgh, respectively. Kessner (1977)
chooses to tackle New York City, the largest and most important American city at the
86 Stephan Thernstrom, Poverty and Progress – Social Mobility in a Nineteenth Century City
(Cambridge: 1964), p. 3. 87
Thernstrom (1964), pp. 86, 200. During his period of analysis (1850-1880), Thernstrom finds that the
Irish “entered the labor market at the bottom and climbed slowly.” 88
Thernstrom (1964), p. 223. 89
Stephan Thernstrom, The Other Bostonians – Poverty and Progress in the American Metropolis
(Cambridge: 1973), p. 250.

39
turn of the century. He studies the experiences of Italian and Jewish immigrants in the
late nineteenth and early twentieth centuries. He finds that ethnicity does have an
impact on immigrant occupational outcomes, with the Jewish immigrants
outperforming the Italians in his study.90 In contrast to Thernstrom (1973), Kessner
(1977) finds that immigrant mobility was meaningful in New York City. He notes that
“social mobility was both rapid and widespread, even for immigrants who came from
the peasant towns of southern Italy and the Russian Pale.”91 In Pittsburgh, Bodnar et al.
(1982) find modest occupational mobility for the Italian and Polish immigrants in the
early decades of the twentieth century.92 At the turn of the century, Pittsburgh was a
leading industrial city and was the largest steel producing centre in America.93 The
study is noteworthy both in its choice of a heavily industrial location, and also for the
fact that it attempts to compare the experience of Black Americans to those of
immigrants.
It is important to note, however, that notwithstanding the pioneering nature of these
studies, there are significant methodological limitations associated with the works of
Thernstrom (1964, 1973), Kessner (1977) and Bodnar et al. (1982). In each case, the
authors present analysis based on a group of people who were resident in the town or
city under study. The principal limitation of this approach is that immigrant or native
workers who leave the town or city during the period of analysis also leave the study.
Due to the inability to track individuals who leave, these studies rely for their data
solely on those who remain. Given that the persistence rates for these studies range
90 Thomas Kessner, The Golden Door – Italian and Jewish Immigrant Mobility in New York City 1880-
1915 (New York: 1977), p. 126. 91
Kessner (1977), p. 165. 92
John Bodnar, Roger Simon and Michael Weber, Lives of Their Own (Urbana: 1982), p. 255. They also
examine the experience of Blacks, who lag materially behind the immigrant groups in their study. 93
Bodnar et al. (1982), p. 13.

40
from approximately 20% in the case of Kessner‟s New York City to 40% in the case of
Thernstrom‟s Boston, the experiences of the vast majority of the potential subjects of
their studies cannot be utilised.94 In addition to this crucial loss of relevant data, there
is also the question of the representativeness of the experiences of those who remained.
Are these persisters representative of the broader population or in what ways are they
different from those who chose to leave, Boston, Pittsburgh, Newburyport or New
York? Finally, these studies do not easily permit conclusions to be reached regarding
regional or national level questions. As the dataset of experiences is limited to a
particular town or city, it is not feasible to extrapolate and draw meaningful
conclusions regarding immigrant assimilation at the national level during this
timeframe.
More recent studies by Ferrie (1997, 1999), Long and Ferrie (2004, 2005, 2007),
Stewart (2006) and Abramitzky et al (2010) have taken advantage of improvements in
the availability of and access to US census data to create datasets that are able to track
individuals over time regardless of their geographic location. These studies also benefit
from improvements in computer software and processing capacity. Ferrie (1997)
utilises this approach to take a fresh look at the argument that new immigrants to the
US in the first half of the twentieth century had limited occupational mobility. Using
one such newly created dataset, Ferrie (1997) is able to locate male immigrants in
ships lists of arriving immigrants, as well as in the 1850 and 1860 US census
manuscripts. He is able to use the data available in these sources to track the date of
arrival, occupation in Europe as well as in the US, geographic location, age, and
94
Joseph P. Ferrie, Yankeys Now – Immigrants in the Antebellum U.S. 1840-1860 (New York: Oxford
University Press, 1999), p. 131. In this work, Ferrie references a survey of persistence rates in 63
separate studies of nineteenth century American communities in which Donald Parkerson calculated an
average persistence rate of 38.3%.
41
various other individual and community characteristics of these new immigrants.
Ferrie (1997) focuses on pre- versus post-migration occupational mobility, as well as
the change in occupational mobility over time in the US. Ferrie‟s (1997) work
represents an improvement over prior studies in that he is able to track the status of a
large group of immigrants in the US from a range of European destinations. He is also
able to observe these immigrants over a period of time through the use of the 1850 and
1860 US census manuscripts. Prior studies had located European occupational data
only for narrowly circumscribed areas in Europe or relied on records of occupational
mobility in small local economies.95 Ferrie‟s (1997) principal conclusion is that
European immigrants to the US in this period experienced considerable occupational
mobility. He also finds that immigrants experienced more occupational mobility in
their earlier years in the US than in their later ones, and that among the three primary
immigrants groups in this period, British and German immigrants experienced greater
occupational mobility than did the Irish. Ferrie (1997) suggests that this poor Irish
performance “may have been the result of a combination of a lack of readily
transferable labor market skills and labor market discrimination.”96 Most interestingly,
Ferrie (1999) also finds that immigrants and natives who moved (i.e. became non-
persisters in the terminology of Thernstrom) experienced greater occupational mobility
(both upward and downward) than those who remained. Ferrie (1999) notes that this
exclusive focus on persisters in studies such as those of Thernstrom (1964, 1973),
Kessner (1977) and Bodnar et al. (1982) “may have imparted a significant bias to the
magnitudes of both upward and downward occupational mobility” for the groups under
study.97
95
Joseph P. Ferrie, “The Entry into the U.S. Labor Market of Antebellum European Immigrants, 1840-
60”, Explorations in Economic History (July 1997), p. 3. 96
Ferrie (1997), p. 21. 97
Ferrie (1999), p. 188.

42
Ferrie‟s (1997, 1999) work represents a clear advancement on prior studies that were
more regional in their focus and lacked the ability to track the progress of individuals
in the US over time. However, there are potential problems with his reliance on ship
lists for occupational and ethnic data. A number of researchers including Erickson
(1989) have questioned the accuracy of the pre-migration occupational data recorded
in ships lists. These researchers note that the Passenger Ship Act of 1819 did not
specify whether an immigrant‟s actual or anticipated occupation should be recorded,
and also point to the poor and incomplete nature of many lists.98 Erickson (1986)
argues that many of these lists are not “complete, detailed or accurate,” particularly
with respect to the occupation data.99 Ferrie (1997) defends this data by referencing a
work by Swierenga (1986) which tests the accuracy of ship list occupational data for
Dutch immigrants versus municipal records maintained by the Dutch Interior Ministry
for those same individuals. According to Ferrie (1997), Swierenga (1986) found for a
sample of 878 Dutch immigrants in the period between 1841-1850 that accuracy levels
were 83% for white collar workers, 77% for skilled/semi-skilled workers, 55% for
unskilled workers and less than 40% for farmers.100 While Ferrie (1997) professes
himself satisfied with this level of accuracy, it is unclear that such low accuracy levels
for farmers and unskilled workers should be accepted so readily. Erickson (1989) also
finds systemic problems in the accurate identification of Irish and Scottish immigrants
in ship lists in the period between 1820 and 1850, particularly those arriving in the port
98
Ferrie (1997), p. 5. 99
Charlotte Erickson, “The Uses of Passenger Lists for the Study of British and Irish Emigration”, in
Migration Across Time and Nations, Ira A. Glazier and Luigi de Rosa (eds) (New York: 1986), p. 319.
Erickson notes that “anyone who has examined some of the lists is likely to be appalled when he comes
across one in which the occupation column is filled in with ditto marks covering whole pages.” In
contrast, Cohn (1995) argues that the “information recorded on many of the lists is accurate and
internally consistent.” Raymond L. Cohn, “A Comparative Analysis of European Immigrant Streams to
the United States during the Early Mass Migration”, Social Science History, Vol. 19, No. 1 (Spring,
1995), p. 75. 100
Ferrie (1997), pp. 5-6.

43
of New York.101 This is of concern as this port was the most important point of entry
for immigrants from the British Isles during the nineteenth century. As Ferrie (1997)
has access to no other systematic sources for pre-immigration data on occupations and
ethnicity, he is forced to rely on this data despite its potential shortcomings.
In a series of recent articles, Long and Ferrie (2004, 2005, 2007), Stewart (2006) and
Abramitsky et al (2010), also use census matching techniques to track the experiences
of specific individuals over time. In one study, Long and Ferrie (2005) analyse the
degree of occupational and geographic mobility in the US and the UK in various
historical time periods. They conclude that the US had greater occupational and
geographical mobility in the nineteenth century than did the UK, but that this higher
level of mobility had disappeared by the mid-twentieth century.102 Long and Ferrie
(2007) have also tracked individual fathers and sons over time in the US and UK
censuses to draw conclusions regarding intergenerational occupational and geographic
mobility. Stewart (2006) also utilises census matching techniques in his study of
migrants to the American frontier in the mid-nineteenth century. Stewart (2006)
creates two matched samples, one of households who migrated to the frontier, and a
second of households which remained in the interior of the US. Using these samples,
he is able to observe the pre- and post-migration characteristics of these households,
and to address the question of who moved to the frontier in this period. His
methodology allows him to make judgements on the impact of migration to the US
frontier on wealth accumulation, and he finds a positive relationship between
101
Charlotte Erickson, “Emigration to the British Isles in 1841: Part I.” Population Studies 43 (1989),
pp. 352-3. 102
Jason Long and Joseph Ferrie, “‟Everything in Common… But the Language?‟ Intergenerational
Mobility in Britain and the US since 1850”, NBER Working Paper 11253 (2005), p. 36.

44
migration and economic opportunity.103 Most recently, Abramitsky et al (2010) use
matched samples to assess the economic return to migration for Norwegian immigrants
to the US. In their article, they make use of two fully digitised Norwegian censuses
(1865 and 1900), and create a novel data set of Norwegian men living in the US in
1900 using the genealogy website Ancestry.com. With these datasets, they then create
linked samples of migrants and non-migrants, who are all observed in 1865 in Norway
and in 1900 in the US (migrants) or Norway (non-migrants). In their results, they find
that the return to migration was relatively low, and that men with poorer economic
prospects were more likely to migrate to the US in this timeframe.104 These recent
works of Ferrie (1997, 1999), Long and Ferrie (2004, 2005, 2007), Stewart (2006) and
Abramitsky et al (2010) demonstrate the significant potential of tracking specific
individuals over time using census data and represent a clear improvement over
previous studies that were only able to track individuals in a single geographic
location. In this dissertation, the tracking of specific Irish immigrants in the 1880 and
1900 US censuses will be a critical component in my analysis.
Another measure of assimilation which will be used in this dissertation is that of
intermarriage. For many decades, intermarriage has been viewed by historians,
economists and sociologists as a key indicator of assimilation. Several sociologists
have developed theories to address the issue of how people make decisions regarding
marriage, some of which are highly applicable to the question of intermarriage.
103
James I. Stewart, “Migration to the agricultural frontier and wealth accumulation, 1860-1870”,
Explorations in Economic History, 43 (2006), p. 573. As a point of reference, Stewart‟s samples number
846 and 892 for frontier households and non-frontier households respectively. They are slightly smaller
than the Irish sample to be used in this dissertation and significantly smaller than my native born
sample. 104
Ran Abramitsky, Leah Platt Boustan and Katherine Erickson, “Europe‟s Tired, Poor, Huddled
Masses: Self-Selection and Economic Outcomes in the Age of Mass Migration”, NBER Working Paper
No. 15684 (January, 2010), p. 5.

45
Hollingshead (1950) was one of the first sociologists to assess the influence of cultural
factors on the decision to marry. In a 1948 study of marriages in the city of New
Haven, CT, he found that cultural factors such as religion and ethnicity had a very
strong effect on marriage choices.105 His approach to marriage theory stated that
marriage decisions were either homogamous (where like attracts like) or heterogamous
(where opposites attract). In his New Haven study, he found strong evidence for the
theory of homogamy, and concludes that one‟s subculture, race, age and class position
“effectively determine the kind of person one will marry.”106
More recent work by sociologists has focused to a greater extent on the influence of
relative group size on inter-group relations including intermarriage. Blau et al. (1982)
studied intermarriage using nationwide marriage data and developed their own theories
to explain when members of different groups decide to intermarry. Using 1970 US
census data, they found support for the theorems that 1) a group‟s relative size is
inversely related to the proportion of its members who intermarry and 2) the
heterogeneity of an area is directly related to the rate of intermarriage in it.107 In their
work, heterogeneity “depends on the number of groups and the population‟s
distribution among them”108 and effectively represents the chance of two people from
different groups being in the same area. The authors argue that in the absence of any
“in-group pressures” to marry someone from their own group, that the relative size of
different groups and the degree of heterogeneity in a given area “would govern the
extent of all social relations, including marriage, between members of different
105
August B. Hollingshead, “Cultural Factors in the Selection of Marriage Mates”, American
Sociological Review, Vol. 15 (Oct. 1950), p. 627. 106
Hollingshead (1950), p. 627. 107
Peter M. Blau, Terry C. Blum, and Joseph E. Schwartz, “Heterogeneity and Intermarriage”,
American Sociological Review, Vol. 47, (February 1982), p. 45. 108
Blau et al. (1982), p. 46.

46
groups.”109 They argue that heterogeneity in a given area helps to promote
intermarriage. Schoen (1986) also argues that intermarriage is influenced by the group
composition of the population. He finds that when one group is small relative to
another, that members of that group “may face a restricted market for in-group
marriage but an extensive one for out-group marriage.” Controlling for other factors,
the relatively smaller group in his analysis is more likely to intermarry. Schoen (1986)
also argues that members of the larger group have less chance of intermarriage “simply
because there are relatively few members of the smaller group available.110 In this
dissertation, the theories of Hollingshead (1950), Blau et al. (1982) and Schoen (1986)
will be applied to the results of my analysis of intermarriage among the Irish
immigrants in my sample data.
Beyond theories of marriage, historians, economists and sociologists have also studied
intermarriage as a measure of assimilation for different ethnic and racial groups in a
given society. Alba and Goldin (1986) examine patterns of ethnic intermarriage using
1979 Current Population Survey data for the US. They are interested in marriage
because more so than any other type of relationship, they believe it “tests social
boundaries and the willingness of insiders and outsiders to accept each other” in a
long-lasting relationship.”111 In their study, they also find support for the argument that
smaller ethnic groups have higher rates of intermarriage than do larger ones. In
addition, they argue that individuals of “ethnically related” backgrounds are also more
likely to intermarry. For example, their results show significant levels of intermarriage
among individuals of European ancestry, but very few of European and Asian
109
Blau et al. (1982), p. 51. 110
Robert Schoen, “A Methodological Analysis of Intergroup Marriage”, Sociological Methodology,
Vol. 16 (1986), p. 50. 111
Richard D. Alba and Reid M. Goldin, “Patterns of Ethnic Marriage in the United States”, Social
Forces, Vol. 65, No. 1 (September 1986), pp. 202-3.

47
ancestry. In their results, the mid-twentieth century Irish are more likely to intermarry
than most ethnic groups in their sample.112
Pagnini and Morgan (1990) also study intermarriage among different ethnic groups in
the US, but their focus is on the turn of the century period. Using US census data for
1910, they analyse intermarriage for eight different ethnic groups, including the Irish.
Their results also point to higher levels of intermarriage among ethnically related
groups. In this case, the “old” immigrants from Northwestern Europe are more likely
to intermarry, than they are to marry an individual from one of the “new” immigrants
from Southeastern Europe.113 As for the Irish, they are more likely to intermarry than
the British and Germans, but less likely than the Jews, Poles, Italians and
Scandinavians in their study.114 The native born have the lowest rates of intermarriage
in their study, again confirming the argument that group size has a meaningful impact
on rates of intermarriage.
Chiswick and Houseworth‟s (2008) recent study seeks to examine the determinants of
intermarriage using contemporary data from the 1980 US census. They view
assimilation as “the process by which the foreign born acquire the human capital
specific to the host country.”115 The authors state that country specific human capital
includes investments in language and culture as well as knowledge of local labour
markets. In their study, they use a logistic regression analysis and find that the
112
Alba and Goldin (1986), p. 206. 113
Deanna L. Pagnini and S. Phillip Morgan, “Intermarriage and Social Distance Among US
Immigrants at the Turn of the Century”, The American Journal of Sociology, Vol. 96 No. 2, (September
1990), p. 429. 114
Pagnini and Morgan (1990), p. 413. 115
Barry R. Chiswick and Christina A. Houseworth, “Ethnic Intermarriage among Immigrants: Human
Capital and Assortative Mating”, Discussion Paper No. 3740, The Institute for the Study of Labor
(2008),
p. 3.
48
probability of intermarriage decreases with the age of an immigrant at time of
migration, and increases with level of education and time spent in the US. Their work
also confirms the previous studies which argue that group size is negatively related to
intermarriage.116
Several researchers have studied the marital behaviour of the Irish, as well as other
immigrant groups, in the late nineteenth and early twentieth century time period.
Landale and Tolnay (1993) use 1910 US census data to analyse variations in marriage
timing among the native born, and first and second generation immigrants. While they
do not focus specifically on the Irish, they do include them in their study, which finds
that ethnic differences in the timing of marriage do exist in both first and second
generation immigrants in this time period. With regard to the Irish, they find that Irish
men are less likely to marry than most other immigrant groups and that Irish women
delay the timing of marriage to a greater extent than do other ethnic groups.117 Their
work would support the argument that cultural persistence did affect the demographic
behaviour of immigrant groups in the US in this timeframe, including the Irish.
Foley and Guinnane (1999) have compiled a comprehensive study of Irish immigrant
marriage patterns in the US in the period between 1880 and 1920. They argue that the
Irish were famous for three distinct demographic behaviours at the end of the
nineteenth century - “they migrated in huge numbers, were reluctant to marry, and had
large families when they did marry.”118 Using US census data from 1880 to 1920, they
compare the experience of Irish immigrants to that of native born white Americans.
116
Chiswick and Houseworth (2008), pp. 30-31. 117
Nancy S. Landale and Stewart E. Tolnay, “Generation, Ethnicity and Marriage: Historical Patterns in
the Northern United States”, Demography, Vol. 30, No.1 (February 1993), pp. 117-118. 118
Foley and Guinnane (1999), p. 15.

49
Similar to Landale and Tolnay (1993), they find that the Irish were less likely to marry
than most other immigrant groups, as well as the native born. However, they also find
that these differences were almost entirely accounted for by the urban residence and
lower socio-economic status of the Irish relative to the native born in the earlier
periods under study. In 1910 and 1920, their results did find that Irish men were less
likely to marry even after controlling for other variables.119 They also found
differences between the marriage patterns of Irish men and women, with the women
being more likely to marry and more closely resembling the experience of the native
born than were the Irish men. Hence they find qualified support for the argument of
cultural persistence in Irish marriage patterns in the US, but with interesting
differences between the experience of male and female immigrants, as well as across
the time period under study. In my research, I will also assess whether this issue of
cultural persistence applies to various socio-economic characteristics of Irish
immigrants in the late nineteenth century.
One final area in which this dissertation will seek to measure the assimilation of Irish
immigrants in the late nineteenth century will be an analysis of the first names married
Irish immigrants gave to their children. The use of children‟s names represents another
measure for assessing the assimilation of immigrants outside of the workplace. The
selection of a non-Irish name for a child by an Irish immigrant father can be viewed as
a sign of how willing that parent is for his child to become more assimilated as an
American. Similarly, the selection of a distinctly Irish name can be viewed as a sign of
cultural persistence and of a lesser desire to assimilate. In the literature, there is a
surprising dearth of research into the use of names as a measure of assimilation or
119
Foley and Guinnane (1999), p. 33.

50
cultural persistence. Rossi (1965) was perhaps the first researcher to use the naming of
children in a systematic manner in her study of naming patterns in middle class
American families in the 1960s. She argued that because parents in the US had
considerable freedom in choosing their children‟s names, that this “permissive
environment” produced naming patterns that were valid for use as social indicators.120
Her analysis focused on the impact of kinship on the naming process. Zelinsky (1970)
assigned even greater value to the naming of children, arguing that the choice of a
child‟s name “is closer to fulfilling the criteria for an ideal cultural measure than any
other known item.”121 He also suggested that the use of children‟s names permitted “an
approach to one of the most profound questions in cultural geography, the extent to
which different places are becoming more or less alike in a cultural sense.”122
Zelinsky‟s interest in measuring differences is quite similar to this author‟s focus on
assimilation of immigrants in American society.
Sociologist Stanley Lieberson has perhaps given the most attention to the study of
children‟s names. Lieberson and Bell (1992) argue that first names can “demarcate
subgroups of a society along such lines as gender, race and ethnicity” and, of critical
importance for this dissertation, they can also “signal shifts in assimilation and
identification.”123 Using large-scale data on births in the state of New York in the
1970s and 1980s, they analyse gender differences in naming patterns. With respect to
the relationship between the naming of children and assimilation, Lieberson (2000)
argues that it would be extremely difficult for an ethnic group to avoid the influence of
120
Alice S. Rossi, “Naming Children in Middle-Class Families,” American Sociological Review, Vol.
30, No. 4 (August, 1965), p. 499. 121
Wilbur Zelinsky, “Cultural Variation in Personal Name Patterns in the Eastern United States,”
Annals of the Association of American Geographers, Vol. 60, No. 4 (December, 1970), p. 746. 122
Zelinsky (1970), p. 769. 123
Stanley Lieberson and Eleanor O. Bell, “Children‟s First Names: An Empirical Study of Social
Taste,” The American Journal of Sociology, Vol. 98, No. 3, 511-554 (November 1992), p. 514.

51
the larger society on their naming patterns. He states that “the influence of mass media,
literacy and mobility aspirations requiring entry into the dominant society” all
undermine efforts to have distinct cultural or ethnic “tastes.”124 From a
methodological standpoint, he uses the 20 most common names in a given category
and looks for overlaps among categories to make his comparisons.
Watkins and London (1994) use US Census data to analyse the naming patterns of
immigrants. In their research, they use names drawn from the 1910 US Census to
compare patterns of given names among first and second generation immigrants of
Jewish and Italian descent. In contrast to the approach of this author, they do not
attempt to identify ethnicity based on first name, but rather use the ethnicity of the
parents to classify names. They then seek to compare the diversity and concentration
of name choice among these immigrant groups versus each other, and versus a sample
of native born white Americans.125 In their study, they find that Jewish immigrants use
a smaller and less diverse universe of names than the Italian or native born groups,126
and that there is limited overlap in names between the three groups.127 They also find a
“subtle transformation” in given names between generations, with the second
generation adopting more names common among the native born.128
More recently, Fryer and Levitt (2004) have produced an article on the causes and
consequences of the choice of distinctly Black names by a child‟s parents in the US.
Using four decades of data from the state of California, they analyse the changing
124
Lieberson (2000), p. 221. 125
The use of the top 20 most popular names is a primary form of comparison in this analysis. 126
Susan Cotts Watkins and Andrew S. London, “Personal Names and Cultural Change”, Social Science
History 18:2 (Summer, 1994), p. 178. 127
Watkins and London, p. 187. 128
Watkins and London, p. 197.

52
patterns in child naming and seek to address whether cultural differences are a cause or
a consequence of continued economic disparity between Blacks and Whites in the
US.129 They view the choice of a child‟s name as a means of measuring “cultural
investments.”130 In their results, they find stark differences in naming patterns between
Blacks and Whites, and conclude that having a distinctly Black name is primarily a
consequence as opposed to a cause of segregation and poverty.131 In this dissertation, I
will use information regarding the naming of Irish immigrant children to assess the
degree of assimilation of their parents.
129
Roland G. Fryer, Jr. and Steven D. Levitt, “The Causes and Consequences of Distinctively Black
Names”, The Quarterly Journal of Economics, Vol. CXIX, Issue 3 (August 2004), pp. 768-9. 130
Fryer and Levitt (2004), p. 769. 131
Fryer and Levitt (2004), p. 801. This analysis is also reported in more extensive detail in Steven D.
Levitt and Stephen J. Dubner, Freakonomics (New York, 2005). Similar to Watkins and London (1994)
and Lieberson (2000), Levitt and Dubner also use the 20 most common names in a given category as the
basis for their analyses.

53
II. Data and Methodology
Description of US census data and matching technique – As discussed in Chapter I,
the assimilation of Irish immigrants will be measured in this dissertation primarily by
various socio-economic characteristics available in the US censuses of 1880 and 1900.
The 1880 US census has been converted in its entirety into a machine readable dataset
by the North Atlantic Population Project (NAPP)132. NAPP was created by the
Minnesota Population Center at the University of Minnesota in collaboration with the
University of Ottawa, Université de Montréal, University of Essex, Statistics Iceland,
University of Bergen, and the University of Tromsø. NAPP has created a machine-
readable database of the complete censuses of Canada (1881), Great Britain (1881),
Iceland (1870, 1880, 1901), Norway (1865, 1900), and the US (1880). With respect to
the 1900 US census, a sample of this census has also been converted into a machine
readable dataset, again by the Minnesota Population Center. Their Integrated Public
Use Microdata Series (IPUMS)133 is a project dedicated to collecting and distributing
US census data from 1850 to the present. In the case of the 1900 US census, I was
given access to an enhanced dataset representing a 2.5% sample. The IPUMS samples
are cluster samples, with the sample unit being household dwellings (as opposed to
individuals). The choice of household dwellings as sample units allows for the analysis
of topics such as fertility, marriage patterns and the naming of children that would not
be possible with an individual based random sample. The IPUMS samples are also
geographically stratified. NAPP and IPUMS data are fully compatible with one
132
Minnesota Population Center. North Atlantic Population Project: Complete Count Microdata.
Version 2.0 [Machine-readable database]. Minneapolis: Minnesota Population Center, 2008. 133
Steven Ruggles, J. Trent Alexander, Katie Genadek, Ronald Goeken, Matthew B. Schroeder, and
Matthew Sobek. Integrated Public Use Microdata Series: Version 5.0 [Machine-readable database].
Minneapolis: University of Minnesota, 2010.

54
another, and thus provide a rich source of longitudinal data on the American
population over the last decades of the nineteenth century.
In my research, I have employed a matching technique to link specific individuals
across these two datasets. I have created a sample of Irish male immigrants of working
age drawn from the 1880 US Census, and then located as many unique matches as
possible of these individuals in the 1900 US Census. I have similarly created a
separate, random sample of native born white males of working age. Utilising these
samples, together with various other data sources, this dissertation will assess the
degree of assimilation achieved by Irish immigrants with native born white
Americans134 across a range of census characteristics including: occupation,
employment status, geographic location, literacy, home ownership, marital status and
children‟s names, as well as several characteristics related to their spouses such as
fertility, nationality, literacy and labour market participation. The reason for using this
matching technique is to enable me to track the experience of particular individuals, as
well as to locate information regarding their spouses and children. This approach
allows me to measure changes in socio-economic variables over time and represents an
improvement over several previous immigrant studies in which researchers were only
able to track the experience of individuals who remained in the same location.135 In
addition, this matching technique will also allow me to assess the relationship between
134
I have chosen to exclude all males not classified as white in the census data, the vast majority of
which were black. The reason for this exclusion is that in the time period under analysis, black
Americans had only recently gained emancipation from slavery. As such, their levels of human capital
were far lower than those of whites, as well as those of most of the immigrants arriving in the US. For
example, in 1880 the literacy rate among black men of equivalent age to my sample data was just 43%.
As we will see later in this chapter, literacy rates among native born white males and Irish immigrants
were in excess of 90%. 135
See Thernstrom (1964, 1973), Kessner (1977), Bodnar et al. (1985).

55
characteristics of family members, such as spouse nationality and children‟s names,
and the assimilation and labour market outcomes of these Irish immigrants.
In order to create these samples, individual level census data on first name, last name,
age and marital status, was used to link individuals from the 1880 US census to the
1900 US census sample. To create my Irish born sample, I utilised the NAPP sample
extraction system to select all males between the ages of 16 and 45 years of age who
were recorded as being active in the labour force, were born in Ireland, and were listed
in the 1880 US census manuscripts. This selection generated a universe of 522,180
observations. I then performed a similar selection procedure using the IPUMS 2.5%
sample of the 1900 US census, in this case specifying ages between 35 and 65 years of
age. In order to reduce the chances of false positive matches, I also specified that the
1900 US census sample include only those males who had become resident in the US
on or before 1880, thus excluding the possibility of an immigrant who arrived after
1880 being matched with an Irish immigrant of the same name living in the US before
1880 who was also present in the 1900 dataset. This selection process for the IPUMS
1900 US census dataset generated 8,356 observations. Utilising Soundex, a phonetic
algorithm frequently used to match individuals in nineteenth century US census data, I
then created alpha-numerical codes for first and last names. I then merged the two files
into one and identified those individuals whose Soundex last name code and first name
code matched from the 1880 dataset to the 1900 dataset. As errors in age reporting as
well as age heaping were common in nineteenth century US census data (these issues
will be discussed later in this chapter), I allowed for a one year variation in the
reported age of an individual in 1880, and the reported age of that individual in
56
1900.136 I further refined the matching process by using certain marital status data
available in the 1880 and 1900 US censuses to eliminate those individuals who were
married in 1900 and had a marriage with duration greater than 20 years, yet were listed
as single in 1880. As all these variables were available in both censuses, this technique
allowed me to further refine the matching process.
A subsequent review of the file revealed that there were many observations where
common names were resulting in multiple matches of the same individual across the
two datasets. If individuals from the 1880 and 1900 censuses could not be successfully
matched, that individual had to be dropped from the sample. To address this issue, I
dropped any matches resulting from common names (based on Soundex last name and
first name codes) for which there were more than four duplicates. I then individually
inspected each remaining set of matches, both the unique ones as well as those with up
to four duplicate matches. I undertook this exercise for two reasons: (i) to further
reduce the chances of a false positive match, and (ii) to try to increase the number of
successful matches from the sets which had a limited number of duplicates as
described above. This inspection allowed me to eliminate matches where the first
and/or last name of the uniquely matched individuals was materially different, but the
Soundex coding had been the same. It also allowed me to identify incremental matches
from the group with a limited number of duplicates. With this approach, I was able to
generate a final sample of 937 unique matches of Irish born males drawn from both the
1880 and 1900 US censuses. With an effective universe of 8,356 individuals who fit
my initial criteria in the IPUMS 2.5% 1900 US census dataset, this process generated a
successful matching rate of 11.2%. Of these 937 individuals, 611 were married with
136
Other researchers have recently allowed for a two year age variation, but I chose a one year limit to
reduce the chances of false positive matches. See Abramitsky et al (2010), p. 11.

57
their spouse present in the household at the time of the 1900 census, allowing me to
capture data on all of these spouses as well.
To create my native born sample, I utilised the identical process as described above for
the Irish born sample with one minor exception. Given the extremely large universe of
potential native born males, I chose not to seek to identify incremental matches on an
individual inspection basis where the process created multiple duplicates. I defined
native born as an individual whose birthplace, along with those of both of his parents,
was in the US. For this sample, I was able to identify 15,985 unique matches drawn
from both the 1880 and 1900 US censuses. With an effective universe of 123,979
individuals who fit my initial criteria in the IPUMS 2.5% 1900 US census dataset, this
process generated a successful matching rate of 12.9%. I again sought to locate the
spouses of my native born males using the 1900 US census dataset. Of these 15,985
individuals, 13,149 were married in 1900, again allowing me to capture data on all of
these spouses of native born males. Table 2.1 provides a summary of the matching
process results for both the Irish and native born samples.

58
Table 2.1
Summary of Irish and Native Sample Matching Process
Irish Sample Native Sample
1880 NAPP 100% Sample Population (a) 522,180 5,404,325
1900 IPUMS 2.5% Sample Population (a) 8,356 123,979 Final Matched Sample 937 15,985
Successful Matching Rate (b) 11.2% 12.9%
(a) Represents all individuals in the dataset who met sample criteria with respect to birthplace, gender,
age, labour force participation, year of immigration (Irish sample only), and race (Native sample only).
(b) Matching rate expressed as a percentage of the 1900 IPUMS 2.5% sample population. By way of
comparison, Ferrie (1999) achieved a matching rate of 10.6% using 1850 US census data and passenger
ship lists. Long and Ferrie (2004) achieved a rate of 22% linking individuals from the 1850 and 1880
US censuses.
The decision to use Soundex to code and then match the names in my database was
made based on the nature and time period of my data. Working with late nineteenth
century US census data, using Soundex was the preferred approach for several reasons.
First of all, the US government used Soundex coding to organise all Federal census
data from 1880 until 1920. This was done in large part because many of the actual
enumerators who recorded the census information were discovered to have been
spelling respondent‟s names phonetically.137 As this could lead to multiple possible
outcomes for an individual‟s name across different census periods, the use of a
phonetic code to match individuals in this time period was deemed critical. In addition,
the US Government‟s National Archives and Records Administration continues to use
Soundex as its preferred index for accessing census data on its online database. Finally,
137
Dick Eastman, Eastman’s Online Genealogy Newsletter, April 6, 2005.

59
the Soundex code is the choice of many currently active researchers working with US
census data to match individuals in the mid- to late-nineteenth century.138
In Table 2.2, I have compared my sample results to the relevant populations from
which they were drawn to assess their representativeness. For the populations, I have
used the same NAPP and IPUMS datasets as were used to create my matched samples.
These matched samples, though not statistically identical to the populations from
which they were drawn, do appear on the surface to be quite representative. A
statistical analysis using a t test for age and the chi squared test of independence for the
remaining variables was employed as further test of representativeness.139 As Table 2.2
shows, the Irish sample was statistically representative of the population from which it
was drawn in many variables, including rural status, marital status and literacy. The
native sample was not similarly statistically representative. However, the magnitudes
of the biases in the native sample are quite small, and these biases all vary in the same
direction as those of the Irish sample. For example, for both the Irish and native born,
their samples are slightly more rural, more likely to be married, more likely to own a
home and more likely to be literate than the populations from which they were drawn.
As a result, the effect of these biases on my ability to assess the assimilation of Irish
immigrants in the US using these samples should not be material.140
138
See Ferrie (1996, 1997, 1999), Long and Ferrie (2004, 2005, 2007), Stewart (2006). 139
The chi squared test of independence was employed for the non-age related variables because each of
these variables is expressed as a proportion which sums to one. 140
In a recent article in which matched samples were created to analyse census data over time,
Abamitzsky et al. (2010) p. 17, also found that their samples were not statistically identical to the
populations from which they were drawn. However, they also noted that the direction and extent of the
biases between their two samples were nearly identical, and were thus not likely to affect their estimates
or conclusions.

60
Table 2.2 Representativeness of Irish and Native Samples
Variable Irish Sample Irish Population Age (years) 1880 32.0*** 34.1 1900 51.9*** 52.7 Rural Status 1880 43.2% 41.3% 1900 35.3%*** 30.2% Marital Status (1900) Married 74.5% 74.0% Never Married 14.4% 14.5% Widowed 10.8% 11.3% Divorced 0.3% 0.2% Home Ownership (1900) 52.6%*** 48.9% Literacy (1900) Read and write English 92.6% 90.3% Read or write only 1.1% 2.1%
Variable Native Sample Native Population Age (years) 1880 28.0*** 28.8 1900 48.0*** 47.3 Rural Status 1880 86.0%*** 82.5% 1900 74.7%*** 70.6% Marital Status (1900) Married 84.4%*** 83.3% Never Married 9.1% 9.9% Widowed 6.1% 6.2% Divorced 0.4% 0.6% Home Ownership (1900) 60.2%*** 57.2% Literacy (1900) Read and write English 94.0%*** 93.5% Read or write only 1.5% 1.4% ***Differences between the individuals in the matched samples and those from the populations from
which they were drawn are significant at the 1, 5 and 10% levels using a t test for age and the chi
squared test of independence for the remaining variables. Irish sample rural status is statistically
different in 1900 only.

61
Additional US census data samples - In addition to my Irish and native born samples,
I have also created additional samples using the 1880 and 1900 US censuses. These
samples are utilised in various chapters to address specific questions that cannot be
addressed with my matched Irish and native born samples. In Chapter III, I have
created an additional sample for use in assessing the degree of assimilation of Irish
immigrants at the end of the nineteenth century. This sample is designed to represent
the American population as a whole, and to provide a comparison for both my Irish
and native born samples against the American population in this timeframe. Using the
analogy of the melting pot, this sample could be described as a “melted” sample, and
represents another framework against which the assimilation of Irish immigrants can
be measured. In constructing this melted sample, I have utilised the NAPP and IPUMS
datasets with only minor changes. I have maintained the same selection criteria with
respect to gender, age, race and labour force participation as utilised in my Irish and
native born samples. Apart from these filters, I have not made any further adjustments
to the underlying datasets and have used the NAPP and IPUMS samples in their
entirety. However, one significant difference in the melted sample versus the Irish and
native born samples is that I have not attempted to match individuals across the two
datasets. The rationale for this decision derives directly from the purpose of the melted
sample - that is to represent the broader American population in both 1880 and in
1900. By matching individuals across the two datasets (and thus excluding from the
melted sample anyone who immigrated to the US between 1880 and 1900), I would
miss changes which were occurring in the American population in this time period. My
melted sample would not be reflective of the broader American population in 1900 if I
included only individuals who could be matched back to the 1880 US census. With this
approach, my melted sample totalled 9,267,544 observations in 1880 and 89,854

62
observations in 1900. In Chapter III, I also created samples of German and English
immigrants living in the US in 1880 and 1900 for use in an occupational analysis.
Similar to the melted sample, the German and English immigrants are not matched at
the individual level. I have used the same criteria in terms of gender, age and
workforce participation to select these individuals from the NAPP and IPUMS census
samples.
In Chapter V, I have used the county level US census data available from the
University of Virginia Historical Census Browser141 to create a database which
illustrates the percentage of Irish immigrants living in each county in the US in 1900.
The University of Virginia census data is based on a complete sample of the relevant
censuses, and thus provides a robust basis for examining the issue of geographic
clustering in late nineteenth century America.142 Using this data, I have constructed a
measure of geographic clustering of Irish immigrants at the county level in 1900. In
addition, I have also created a sample of Irish immigrants who came to the US prior to
1900 using the IPUMS 2.5% US census sample for 1900. This sample is comprised of
26,722 male immigrants between the ages of 25 and 65 years old, who were in the
workforce in 1900. I have created this new sample so as to have the largest possible
sample of Irish immigrants with which to assess the impact of geographic clustering at
the county level. My matched sample of 937 Irish immigrants is simply too small in
size for the purpose of examining the issue of geographic clustering at the county level
throughout the US in this time period.
141
Historical Census Browser. The University of Virginia, Geospatial and Statistical Data Center:
http://fisher.lib.virginia.edu/collections/stats/histcensus/index.html. (2004). 142
However, the University of Virginia Historical Census Browser has only limited fields of
information. Thus it would not have been possible to use this source as an alternative to the IPUMS
1900 US census data for my other samples.

63
Finally in Chapter VI, I have created samples of children‟s names which also include
significant information regarding their parents. In the first sample, I have utilised my
matched Irish sample and located the children who were living in the household with
their Irish immigrant father and his spouse in 1900. Using information variables
provided in the IPUMS data extraction system regarding the location of the father and
his spouse, it is possible to locate their children. For the 611 households in my
matched sample where the Irish immigrant was married with the spouse present, I was
able to locate any children living in the household and then was able to go back into
the database and obtain their names. This process generated a total of 1,976 children‟s
names of Irish immigrants in my sample, which is linked to the significant amount of
socio-economic information regarding their parents available in that sample.
In Chapter VI, I also created samples of Irish immigrant children‟s names for children
born in each decade from the 1870s through to the 1920s using the complete US
census sample data available from IPUMS. This approach, while not linked to my
matched sample of Irish immigrants, allowed me to access a much broader distribution
of name outcomes, and to analyse the relationship between children naming patterns
and assimilation over time. For these samples, the IPUMS system allowed me to
screen for children born to an Irish immigrant father, and to ensure that the father was
the natural father of the child and not a step father. This distinction was critical as it
would have been the natural father who would have been involved in the naming of a
child.
Occupational categories and incomes – In addition to using US census data to study
the issue of assimilation of Irish immigrants in late nineteenth century America, this

64
dissertation also assesses the occupational mobility of these immigrants, as well the
relationship between assimilation and occupational mobility for Irish immigrants in
this time period. In order to measure occupational mobility, it is necessary to create a
framework in which to evaluate occupational levels and changes in those levels during
the period under analysis. As noted by Sobek (1996), “our understanding of historical
social structure and where people fit in is bound up with the interpretation of
occupations.”143 Thernstrom (1973) pointed out in his groundbreaking study The Other
Bostonians that the measurement of occupational mobility “requires a specification of
the broad occupational categories that may be considered socially distinct, and a
definition of which jobs fit in which category.” He noted that such a specification is
not straightforward, requires flexibility, and is subject to change over time.144 As this
researcher (and, I am sure, many others) has found, where you draw the lines between
occupational classes can have a meaningful impact on your results. In creating the
occupational categories for use in this dissertation, I have drawn on the
groundbreaking work of Thernstrom (1964, 1973), which itself was originally inspired
by the work of the US census statistician Alba Edwards. In my research, I have
separated my samples into six occupational categories (High White Collar, Low White
Collar, Farmer, Skilled, Semi-skilled and Unskilled), and will examine the changes in
these categories over the period from 1880 to 1900.
In addition, I have drawn on the work of Sobek (1996), who assembled a dataset of
occupational incomes in the US as of 1890. The primary benefit of an income level is
that it is a continuous variable more easily suited to econometric analysis, and it does
not require one to draw arbitrary lines between occupations in order to make
143
Matthew Sobek, “Work, Status and Income – Men in the American Occupational Structure since the
Late Nineteenth Century”, Social Science Review 20:2 (summer 1996), p. 170. 144
Thernstrom (1973), p 46.

65
comparisons. However, there are significant shortcomings involved with income
estimates as well. First of all, a mean occupational income figure ignores the fact that
many people in the same occupation may earn different incomes, and that incomes
may also vary based on the impact of skill levels, career trajectories, regional
differences and other factors. In addition, several researchers have speculated that
certain nineteenth century immigrants to the US were the victim of discrimination, and
may have been paid less than native born workers for the same work.145 A single
income level per occupation would not capture this effect. Finally, the measurement of
the income level of farmers in this time period is particularly problematic. Economic
historians such as Preston and Haines (1991) chose to exclude farmer income from
their own income estimates due to the uncertainty surrounding the “type and size of
farm, crop prices and harvest size.” They concluded that there was simply too much
uncertainty to make a single estimate for this group.146 Inconveniently, farming was
the leading occupation of native born Americans in this time period and hence in my
native born sample. In this dissertation, my analysis of occupational mobility among
Irish immigrants in late nineteenth century America will draw on both the occupational
categories as well as income estimates, and will make particular note of the treatment
of farmers in these results.
Data quality issues - With respect to data quality, there are certain issues that must be
acknowledged regarding the use of US census data in this time period, as well as the
matching technique described herein. As noted by Steckel (1991), nineteenth century
US census data is not entirely reliable, suffering from three main types of error:
underenumeration, overenumeration and misreporting. The first type of error occurs
145
See McGouldrick and Tannen (1977), Hannon (1982a, 1982b). 146
Samuel H. Preston and Michael R. Haines , Fatal Years – Child Mortality in Late Nineteenth Century
America (Princeton: 1991), p. 212.

66
when a record or element is entirely omitted, the second when a person or unit is
included more than once, and the third when attributes such as name, age, gender or
occupation are recorded with error.147 Sobek and Dillon (1995) also found that late
nineteenth and early twentieth century US censuses suffered from data quality
problems, in particular as it relates to occupational coding. While their work
highlighted the underenumeration of domestic female servants in the 1880 US census,
they concluded that “the Census Office coded by the seat of its pants,” and that
researchers should “not be naïve about the sanctity” of US census occupational data.148
Underenumeration is a particular concern for techniques seeking to match individuals
across census years. Steckel (1991) found that the underenumeration is “often
selective,” with “the poor, the unskilled, ethnic minorities, the very young, residents of
large cities, and residents of frontier areas” being more likely to have been
uncounted.149 Magnuson and King (1995) estimate that the US censuses taken between
1880 and 1920 resulted in “levels of undercounts between 6.5 and 7.4 percent.”150
Steckel (1991) does note that the 1880 US census is regarded as “one of the higher
quality efforts of the nineteenth century,”151 and Magnuson and King (1995) argue that
the 1880 US census “marked a turning point, with the replacement of marshals by
supervisors answerable to the Census Office and efforts by the Washington office to
provide training, oversight, and correction of fieldwork.”152 Nonetheless, it is evident
that any research based on nineteenth century US census data must make note of its
shortcomings.
147
Richard H. Steckel, “The Quality of Census Data for Historical Inquiry: A Research Agenda,” Social
Science History 15:4 (Winter, 1991) p. 580. 148
Matthew Sobek and Lisa Dillon, “Interpreting work: Clas sifying occupations in the Public Use of
Microdata Samples”, Historical Methods, Winter 1995, Volume 28, Number 1, p. 73. 149
Steckel (1991), p. 581. 150
Diana L. Magnuson and Miriam L. King, Comparability of the Public Use Microdata Samples:
Enumeration Procedures”, Historical Methods, Winter 1995, Volume 28, Number 1, p. 31. 151
Steckel (1991), p. 589. 152
Magnuson and King (1995), p. 31.

67
With respect to the matching process to be employed in this dissertation, there is an
additional issue that must also be addressed. Common names can limit the ability to
obtain a successful match of an individual across census datasets. When two or more
individuals share a common name that cannot be distinguished on the basis of their
birth year, marital status or other variables, those individuals must be removed from
the matched sample. For example, in a study in which he sought to match a sample of
native and foreign born individuals across the 1850 and 1860 US censuses, Steckel
(1988) found that Irish immigrants had a 4.6% probability of having a common
name.153 However, in a separate analysis of US census data from the same years (1850
and 1860), Ferrie (1999) found no meaningful bias resulting from the inability to
match common names on his own matched sample results.154 If the data sources allow,
the issue of common names should be addressed by analysing the matched samples for
representativeness based on dimensions measurable with broader census data.155 In this
chapter, I have examined the representativeness of my samples in such a manner. In
that analysis, I found that many of the variables in my Irish sample were statistically
representative of the broader datasets from which they were drawn. For those variables
in both my Irish and native born samples which were not statistically representative,
the differences were small, and all of them varied in the same direction, thus
presenting no meaningful bias in their use. Taken together, the issues of
underenumeration, misreporting and common names (in addition to the death of an
individual between 1880 and 1900 and any return migration on the part of Irish
153
Richard H. Steckel, “Census Matching and Migration: A Research Strategy,” Historical Methods,
21:2 (Spring: 1988) p. 54. The probability of an English immigrant having a common name was 3.5%
and the probability for all other foreign born individuals was 5.6%. 154
Ferrie (1999), p. 21. 155
Long and Ferrie (2005), p. 14.

68
immigrants) will reduce the percentage of successful matches that one can obtain
through the matching technique described herein.
One final data issue to be addressed is age heaping in US census data. Age heaping
occurs when respondents to a survey or census tend not to give their exact age. Instead,
some percentage of respondents round their age up or down to the nearest number that
ends in either a zero or five (as these ages represent a less specific and more general
response). One way to identify whether age heaping exists in the data is to graph the
distribution of ages. Instead of finding a smooth distribution, one will find that there
are “heaps” over the ages ending in zero and five. In Figure 2.1, I have graphed the
distribution of ages for my Irish sample in 1900. As can be seen, there is a clear pattern
of heaps in the distribution in the years ending in zero and five. In percentage terms,
ages ending in zero or five represent 33.3% of the total number of observations,
whereas if there was no age heaping, that percentage would be 20%. Figure 2.2
illustrates the corresponding distribution for my native born sample. In the case of the
native born, age heaping does exist, but is much less pronounced than it is in the Irish
sample. In percentage terms, ages ending in zero or five represent just 23.8% of the
total number of observations. Because of the existence of age heaping in the US census
data that was used to create my samples, and the corresponding lack of precision in age
data which it implies, I did allow for a minor degree of variation in age in the process
of creating my matched samples.

69
02
46
81
0
Pe
rcen
t
30 40 50 60 70Age
Distribution of Irish Sample Age in 1900
Figure 2.1
01
23
45
Pe
rcen
t
30 40 50 60 70Age
Distribution of Native Sample Age in 1900
Figure 2.2
70
III. Assimilation and Occupational Mobility of Irish Immigrants in Late
Nineteenth Century America
In this chapter, I will use my sample data to address the following two principal
questions: Did Irish immigrants assimilate quickly into American society at the end of
the nineteenth century and did they achieve occupational parity with the native born?
In the literature, there has been a great deal written about the assimilation experience
of immigrants in the US in this time period. The Irish in particular have been the
subject of significant analysis and discussion. In this chapter, I will apply my newly
created matched sample data, together with other data sources, to the study of the Irish
assimilation experience in the US in the last decades of the nineteenth century. My
approach to the assimilation process will be a multi-faceted one. While I will assess
occupational mobility and income levels in some detail, I will also explore issues of
assimilation which extend beyond the workplace. I will assess areas such as marriage
and spousal characteristics, fertility, child mortality, literacy, geographic location and
home ownership. This multifaceted approach is critical to understanding the
assimilation experience of Irish immigrants in the US in the late nineteenth century. In
addition, I will also assess the debate which exists in the literature as to whether the
Irish achieved occupational parity with the native born in this time period. As
mentioned in Chapter I, there is a lack of consensus regarding whether the Irish
achieved occupational parity with native born Americans in the workplace by the end
of the nineteenth century. Borjas (1994) found that European immigrants (including
those from Ireland) who arrived in what he terms The First Great Migration, the period
from 1880 to 1924, did not achieve convergence in occupational levels with native
born white males for as long as four generations.156 On the other hand, Kenny (2006)
156
Borjas (1994) pp. 571-572.

71
and Doyle (1975) argued that Irish Americans did achieve relative occupational parity
with native born white Americans by 1900.157 In this chapter, I will bring to bear
evidence from my matched samples of Irish immigrant and native born workers to
further assess this issue of Irish occupational mobility at the end of the nineteenth
century.
In addition to assessing the overall assimilation and occupational mobility of Irish
immigrants relative to the native born, this chapter will also analyse various subsets of
the Irish and native born samples to draw more specific conclusions regarding the
assimilation of the Irish. I will assess whether the assimilation experience of specific
subsets of the Irish differed from that of the aggregate Irish immigrant population. In
addition, I will also compare the results of my Irish and native born samples to those of
my melted sample to assess their assimilation and occupational mobility relative to the
broader American population. Finally, I will also compare the occupational mobility of
my Irish sample to that of German and English immigrants; the purpose of this
comparison being to assess how the Irish fared in the workplace relative to the two
other principal immigrant groups present in the US economy at the end of the
nineteenth century. By moving beyond a comparison of my Irish sample to my native
born sample and also analysing various subsets of these samples, and also by making
comparisons between these samples and the broader American population and other
prominent immigrant groups, I will seek to assess in broad terms the degree of
assimilation and occupational mobility achieved by Irish immigrants in the late
nineteenth century. In particular, I will seek to address the question of whether
assimilation can vary across different socio-economic characteristics of a given
157
Kenny (2006), p. 360; Doyle (1975), pp. 42-43.

72
population, and also across different subsets of that population. Did the Irish achieve
assimilation in certain areas, but retain a distinct Irish identity in others? Were there
subsets of the Irish who assimilated differently and came to more closely resemble the
native born than others? Is assimilation a uniform process or is it a multi-dimensional
one that varies based on different socio-economic characteristics and population
subsets?
In this chapter, my contribution to the literature derives from the use of these matched
Irish and native born samples to assess the assimilation of Irish immigrants in the US
at the end of the nineteenth century. The matching technique used to link specific
individuals across the two US census datasets enables me to track the experience of
particular individuals over time, as well as to gather information regarding their
spouses and children. This approach allows me to assess behavioural changes over
time as opposed to simply measuring the status of a group of individuals at one point
in time. This ability to measure changes in socio-economic variables for specific
individuals over time represents an improvement over several previous studies in
which researchers were only able to track the experience of individuals who remained
in the same location.158 While other researchers have used this matching technique in
their research to study themes involving immigrants and domestic migrants159, none
have used this technique to address the assimilation of the Irish and their relative
occupational mobility in the US in the late nineteenth century timeframe.
As mentioned in Chapter I, one of the main factors differentiating these Irish
immigrants from those who had arrived during the famine period was that they had
158
See Thernstrom (1964, 1973), Bodnar et al. (1985). 159
See Ferrie (1996, 1997, 1999), Long and Ferrie (2004, 2005, 2007), Stewart (2006), Abramitzky et al
(2010).

73
much greater control over the decision to leave Ireland and immigrate to a foreign
country such as the US. In the second half of the nineteenth century, the Irish economy
was much stronger than it had been in the earlier years of that century. The Irish
economy experienced steady growth and achieved meaningful economic convergence
with its European neighbours, as well as with the US. As noted by Guinnane (1997),
by the beginning of the twentieth century, “most Irish people were much better off than
their counterparts in 1850.” Relative to the UK, real wages for unskilled Irish workers
increased from 60% of British levels in 1852 to 92% by 1905.160 The cost of transport
to the US had also declined such that “the average unskilled Irish worker could save
for the journey without difficulty.”161 This decline in the cost of transport was
important as most Irish emigration was self-financed, with the state and other
potentially interested parties such as landlords playing only a minor role in providing
assistance to those seeking to emigrate.162 As a result of these developments, Irish
immigrants had more choice in the decision to emigrate than had their famine-era
predecessors. If they chose to stay in Ireland, they had a better opportunity to sustain
themselves in the domestic economy. If they chose to emigrate, the cost of making the
journey had fallen within the reach of most of the Irish population.163
In addition to this greater choice on whether to emigrate, these immigrants were also
more likely to have had some level of primary education than did their predecessors.
National primary schools were introduced in Ireland during the 1830s, with the goal of
160
Guinnane (1997), pp. 57-8. 161
Guinnane (1997), p. 109. 162
Fitzgerald (1985), p. 15. 163
Fitzgerald (1985), p. 22. Fitzgerald found that the passenger trade between Ireland and North
America was highly competitive, and that the basic cost of one passage to America was “roughly
equivalent to the value of a heifer or the rent of a typical Mayo farm at the end of the century.”

74
providing a basic level of education to all Irish citizens.164 These new schools had a
material effect on increasing literacy levels among Irish men and women. As measured
by the 1841 Irish census, literacy levels were just over 50% for males and slightly
higher for females. By the time of the 1911 Irish census, illiteracy for either men or
women had become extremely rare.165 Rising wages in their home economy,
increasing literacy, and declining transport costs combined to give the late nineteenth
century Irish a much greater ability to make economic decisions for themselves,
including the decision to emigrate. The post famine Irish who made the choice to come
to the US should have had a greater opportunity to succeed in the US economy. In this
chapter, through the use of my sample data, we will assess whether in fact they did.
Table 3.1 provides a comparison of the Irish and native born samples across a broad
range of descriptive characteristics. These characteristics includes age, rural status,
marital status, home ownership, literacy, un- and under-employment, spouse fertility as
measured by children ever born as well as by children surviving, child mortality,
spouse age, spouse birthplace, spouse literacy and the percentage of spouses in the
workforce. The results of this comparison are quite striking. As Table 3.1 indicates,
with the exception of the percentage of spouses in the workforce, the Irish living in the
US in 1880 did not attain the levels of native born white males across a range of socio-
economic characteristics captured in US census data in 1900. The differences between
the two samples are statistically significant at the 1% confidence level for every
category except for literacy and spouse in the workforce. The native born were much
more likely to have lived in rural areas, and although the US was becoming more
urbanised during this period, this substantial difference in geographic location between
164
Guinnane (1997), p. 64. 165
Guinnane (1997), p. 65.

75
the two samples continued to persist as of 1900. Native born males in my sample were
more than twice as likely to live in rural areas in 1900 as their Irish counterparts. The
native born were also much more likely to be married, with a 10% gap between the
two samples in 1900. In addition, the Irish were also more likely to have never been
married than the native born, with 14.4% of the Irish sample never having been
married versus 9.1% for the native born. These statistics are even more striking given
that the Irish sample is approximately four years older on average than the native
sample. As for home ownership, the principal measure of wealth available in US
census data during this time period, the native born had achieved a noticeable
advantage by 1900. In terms of employment stability, the native born reported lower
levels of both unemployment and underemployment (as measured by the number of
quarters unemployed in the past year) than did the Irish in 1900. In the area of fertility
and child mortality, the results also varied quite materially. Measured in 1900, the Irish
in my sample had had on average 20% more children than the native born, with a much
higher rate of child mortality (23.3% versus 16.7%). Finally, the Irish were much more
likely to have married a spouse also born in Ireland, whereas more than nine out of ten
native born males chose to marry an American-born spouse. An analysis of the impact
of intermarriage on the assimilation and occupational mobility of Irish immigrants will
be presented in Chapter IV.
Despite the statistical differences, however, there are a few areas where the two
samples did appear to achieve some degree of convergence. In the area of literacy,
both the Irish and native born achieved roughly similar levels. More than nine out of
ten males in my two samples were literate in 1900. As mentioned previously, the
institution of national schooling in Ireland in the 1830s had a significant effect on

76
increasing the basic literacy levels of the Irish in the second half of the nineteenth
century. With such a small difference between the literacy of Irish immigrants relative
to native born males, it would appear that any differences in occupational mobility and
other aspects of assimilation must be explained by factors other than literacy. In
addition, the spouses of the male observations in my samples also had certain
similarities as measured by census data. For example, the average age of spouses in
both samples was approximately five years younger than their husbands in 1900 (4.7
years for the Irish and 5.2 for the native born). In this variable, they effectively
mirrored the age gap between my two samples of approximately four years. In
addition, the spouses also had very similar rates of labour force participation. In both
cases, less than 3% of spouses were recorded as being in the workforce in 1900.166
Finally, although the spouses of the native born had a slight advantage in literacy
levels relative to the spouses of my Irish males in my sample, more than nine out of ten
spouses in both my samples were literate in 1900.
Upon an initial review of the sample results, it would appear that Irish immigrants had
not achieved meaningful convergence with the native born in any significant socio-
economic variable by the year 1900. However, before concluding that Irish immigrants
did not assimilate vis-à-vis the native born in this time period, it is important to note
that the two samples do not correspond precisely to each other in their initial
conditions. For example, the average age of the Irish sample in 1880 is 32.0 years
versus 28.0 for the native born sample. The rural status of the Irish sample is 43.2% in
1880 versus 86.0% for the native born. To adjust for these differences in initial
conditions, I undertook an exercise to standardise my native born sample versus my
166
Though there is evidence to suggest that this figure may underestimate the actual labour market
participation of women in this time period. See Sobek and Dillon (1995), p. 73.

77
Irish sample. Alternatively using various key characteristics such as age, rural status,
home ownership, occupational level and income, I standardised the larger native born
sample to the smaller sized Irish sample in 1880 for each of these variables, and then
observed the impact of this standardisation on the remaining variables in 1900. In each
case, the Irish continued to differ materially from the native born in rural status,
marital status, home ownership, fertility, child mortality, unemployment, spouse
literacy and nationality. Standardising my sample did not materially alter any of my
original conclusions. Table 3.2 shows the impact on my native born sample when
standardised for Irish sample age in 1880. As can be seen from Table 3.2, the impact of
this standardisation exercise is minimal. Aside from age itself (as well as spouse age);
there is no statistically significant convergence between the two samples in any
category. Overall, the effect of standardising my native born sample results has no
effect on my original conclusions.

78
Table 3.1
Summary Statistics
Variable Irish Sample Native Sample Observations 937 15,985
Age
1880 32.0 years*** 28.0 years
1900 51.9*** 48.0
Rural Status
1880 43.2%*** 86.0%
1900 35.3%*** 74.7%
Marital Status (1900)
Married 74.5%*** 84.4%
Never Married 14.4% 9.1%
Widowed 10.8% 6.1%
Divorced 0.3% 0.4%
Home Ownership (1900) 52.6%*** 60.2%
Literacy (1900)
Read and write English 92.6%* 94.0%
Read or write only 1.1% 1.5%
Quarters Unemployed (1900)
Not unemployed 82.5%*** 86.6%
1 Quarter 6.0% 5.6%
2 7.4% 5.8%
3-4 4.1% 2.0%
Spouse Fertility (1900)
Avg. Children Ever Born 6.4*** 5.3
Avg. Children Surviving 4.9*** 4.4
Implied Mortality Rate 23.3% 16.7%
Spouse Age (1900) 47.2 years*** 42.8 years
Spouse Birthplace (1900)
Ireland 53.9%*** 0.4%
Other Foreign Country 8.8% 2.7%
US 37.3% 96.9%
Spouse Literacy (1900)
Read and write English 90.0%*** 93.6%
Read or write only 3.1% 1.7%
Spouse in workforce (1900) 2.5% 2.2%
***Differences between the individuals in the two samples are significant at the 1, 5 and 10% levels,
respectively, using a t test for age and fertility variables, and the chi squared test of independence for the
remaining variables.
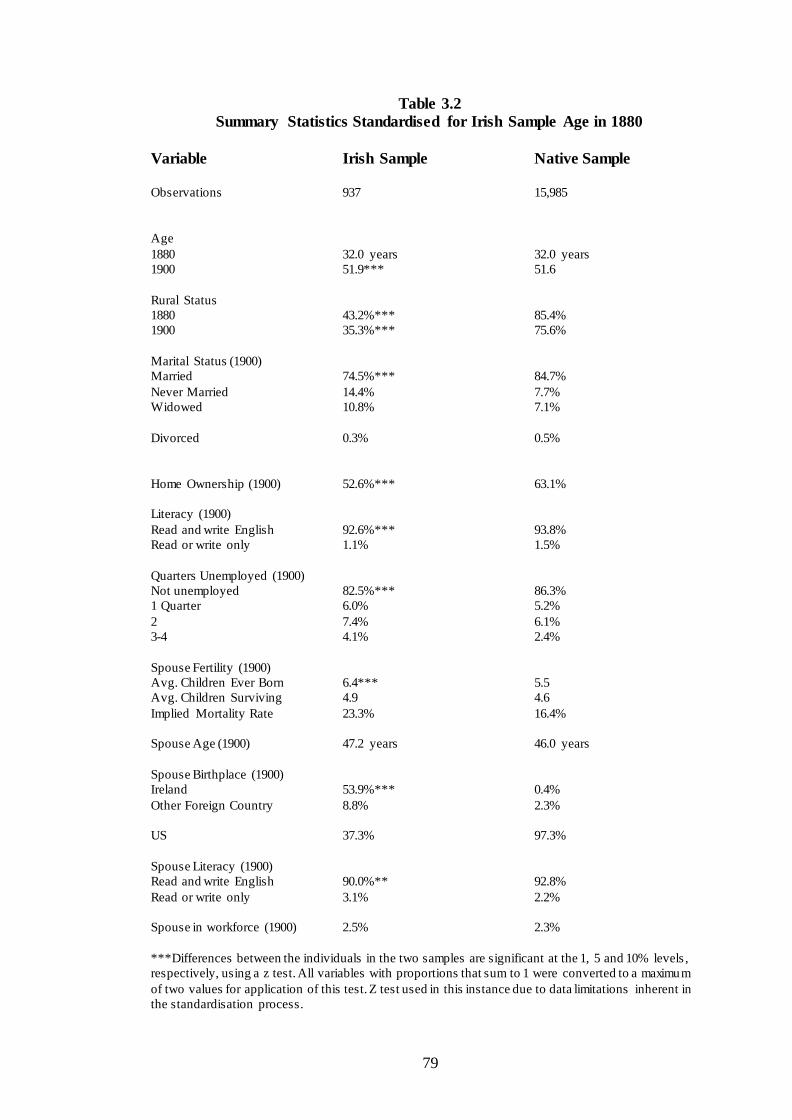
79
Table 3.2
Summary Statistics Standardised for Irish Sample Age in 1880
Variable Irish Sample Native Sample Observations 937 15,985
Age
1880 32.0 years 32.0 years
1900 51.9*** 51.6
Rural Status
1880 43.2%*** 85.4%
1900 35.3%*** 75.6%
Marital Status (1900)
Married 74.5%*** 84.7%
Never Married 14.4% 7.7%
Widowed 10.8% 7.1%
Divorced 0.3% 0.5%
Home Ownership (1900) 52.6%*** 63.1%
Literacy (1900)
Read and write English 92.6%*** 93.8%
Read or write only 1.1% 1.5%
Quarters Unemployed (1900)
Not unemployed 82.5%*** 86.3%
1 Quarter 6.0% 5.2%
2 7.4% 6.1%
3-4 4.1% 2.4%
Spouse Fertility (1900)
Avg. Children Ever Born 6.4*** 5.5
Avg. Children Surviving 4.9 4.6
Implied Mortality Rate 23.3% 16.4%
Spouse Age (1900) 47.2 years 46.0 years
Spouse Birthplace (1900)
Ireland 53.9%*** 0.4%
Other Foreign Country 8.8% 2.3%
US 37.3% 97.3%
Spouse Literacy (1900)
Read and write English 90.0%** 92.8%
Read or write only 3.1% 2.2%
Spouse in workforce (1900) 2.5% 2.3%
***Differences between the individuals in the two samples are significant at the 1, 5 and 10% levels ,
respectively, using a z test. All variables with proportions that sum to 1 were converted to a maximum
of two values for application of this test. Z test used in this instance due to data limitations inherent in
the standardisation process.
80
The second primary question to be addressed in this chapter is whether the Irish
achieved occupational parity with the native born by the end of nineteenth century.
According to Kenny (2006) and Doyle (1975), the Irish in America did achieve such
parity by 1900.167 Other researchers, most notably Borjas (1994), concluded that the
Irish, like other European immigrants who arrived in the US in the late nineteenth and
early twentieth centuries, did not achieve convergence in occupational levels with
native born white males during their lifetime. Borjas (1994) found that it took as many
as four generations for these immigrants to achieve such occupational convergence.168
So did the Irish achieve occupational parity with native born Americans by the end of
the nineteenth century based on my sample data? The clear result of the analysis of my
matched samples is that they did not.
Table 3.3 presents the results of my Irish and native born samples grouped according
to the occupational levels developed by Thernstrom (1964, 1973). The one change I
have made to Thernstrom‟s approach is that I explicitly break out the results for
farmers into a separate category. As Thernstrom had researched primarily urban
workers in his now famous studies of Newburyport and Boston, Massachusetts, he had
included farmers as part of the low white collar category and had not chosen to show
them as a separate group. As my sample includes a high percentage of farmers, I found
that separating them into their own group provided more clarity as to their role in the
results of my occupational analysis.169 Breaking out farmers into a separate group will
also enable me to specifically analyse this form of occupation and to draw conclusions
167
Kenny (2006), p. 360; Doyle (1975), pp. 42-43. 168
Borjas (1994), pp. 571-572. 169
In creating the farmer category, I specifically excluded workers who were classified in the census
data as farm labourers. Labourers who worked on farms were classified as unskilled. The farmer
category is designed to capture only those individuals who either owned or managed farms.

81
with respect to the socio-economic characteristics of farmers relative to other
occupational groupings.
As Table 3.3 illustrates, the Irish were more likely than the native born to occupy
lower levels of the occupational ladder in 1880. Approximately 61% of the Irish
sample was identified as being in the unskilled or semi-skilled categories. This
compares with a level of 40% for my native born sample. While this was not
unexpected, as the Irish in my sample would have been relatively new to the US labour
market in 1880, the Irish continue to lag well behind the native born in 1900 as well.
My results indicate that the Irish were twice as likely to occupy the unskilled and semi-
skilled categories in 1900 as were the native born (46% versus just 22% for the native
born). While both samples would have been impacted by the relatively young age of
workers in 1880 (32 and 28 years old for the Irish and native born respectively), the
Irish clearly do not progress out of these categories nearly as quickly as do the native
born. As can be seen from the percentage change figures in Table 3.3, the percentage
of unskilled workers in the native born sample declines 57% from 1880 to 1900. The
corresponding decline for the Irish is just 20%. More than a quarter of Irish workers in
my sample are still in the unskilled category in 1900, versus a figure of just 13% for
the native born.
In the white collar segments of the workforce, the Irish made up a lower percentage in
both the professional and low white collar areas in 1880 and again in 1900. However,
the Irish are surprisingly close to the levels of native born in 1880 in the high white
collar segment (7.2% versus 7.7%). In 1900, this comparison is still quite close, though
the native born experience a slightly higher percentage change from 1880 levels of

82
68% versus 60% for the Irish. Excluding the impact of farmers from the analysis, the
Irish would appear to approach the native born levels in the combined high and low
white collar categories (18.3% versus 20.1%). However, if one were to include farmers
in the low white collar grouping (as Thernstrom and most historians of this time period
would have done), the native born advantage over the Irish increases dramatically. In
this comparison, the native born would have almost twice the level of white collars
workers as the Irish in 1900 (65.9% for the native born versus just 35.3% for the Irish).

83
Table 3.3
Irish and Native Sample Occupational Groupings 1880-1900
1880 Irish Sample No. % Cum % High WC 67 7.2% 7.2%
Low WC 40 4.3% 11.4%
Farmer 111 11.9% 23.3%
Skilled 148 15.8% 39.1%
Semi-skilled 268 28.6% 67.7%
Unskilled 303 32.3% 100.0%
Total 937 100.00%
1900 Irish Sample No. % Cum % % Change from 1880
High WC 107 11.4% 11.4% 60%
Low WC 64 6.8% 18.3% 60%
Farmer 160 17.1% 35.3% 44%
Skilled 175 18.7% 54.0% 18%
Semi-skilled 190 20.3% 74.3% -29%
Unskilled 241 25.7% 100.0% -20%
Total 937
1880 Native Sample No. % Cum % High WC 1,223 7.7% 7.7%
Low WC 1.011 6.3% 14.0%
Farmer 5,987 37.5% 51.4%
Skilled 1,460 9.1% 60.6%
Semi-skilled 1,437 9.0% 69.6%
Unskilled 4,867 30.5% 100.0%
Total 15,985
1900 Native Sample No. % Cum % % Change from 1880 High WC 2,052 12.8% 12.8% 68%
Low WC 1,159 7.3% 20.1% 15%
Farmer 7,322 45.8% 65.9% 22%
Skilled 2,003 12.5% 78.4% 37%
Semi-skilled 1,338 8.4% 86.8% -7%
Unskilled 2,111 13.2% 100.0% -57%
Total 15,985

84
I also calculated the Duncan dissimilarity index (DDI)170 to further compare the
occupational distributions of the Irish and native born samples. The DDI is an index
developed by Duncan and Duncan (1955) which compares the similarities and
differences between two distributions. The index takes a value between zero and one,
with one reflecting no overlap between distributions and zero representing identical
distributions. The index may be interpreted as the proportion of subjects in a group that
would have to change category in order to obtain the same relative distribution as the
group to which it is being compared. Using the specific occupational code for each
individual in my sample, I calculated the index for both 1880 and 1900. Table 3.4
provides the results of this calculation. I obtained a value of .482 in 1880 and one of
.427 in 1900. These results would imply that more than four out of ten workers in my
Irish sample would be required to change occupation in order for the Irish to have a
similar occupational profile to the native born sample. This outcome only further
confirms that there was a substantial difference between the occupational distributions
of the two samples in 1880, and that there was only a modest degree of occupational
assimilation achieved in the twenty years to 1900.
Table 3.4
Calculation of Duncan Dissimilarity Index for Irish and Native Sample
Occupation
1880 .482
1900 .427
170
DDI = 0.5 x sum|Ai/sum(A) - Bi/sum(B)| where N(A) and N(B) are the two overall distributions.

85
In Chapter II, I described how in addition to creating occupational groupings to assess
occupational mobility, I also generated mean income estimates based on the
occupational codes available in the NAPP and IPUMS datasets. Table 3.5 provides the
results of an analysis of occupational income levels for the Irish and native born
samples. As can be seen from the table, the Irish lagged well behind the native born in
income in 1880. More importantly, they were not able to close this gap with more time
spent in the US labour market. The gap between the two samples only increases, with
the native born earning 17% more on average than the Irish in 1900. Between 1880
and 1900, average Irish incomes grow at a 12% rate, whereas for native born that
figure is 14%.171 As Table 3.5 relies on a single estimate of income for each
occupation for both the 1880 and 1900 samples, changes in the mean income levels for
the Irish and native born samples reflect solely changes in the occupational
distributions of these two groups between 1880 and 1900. In this regard, it is
noteworthy that the Irish sample experienced an increase in the number of occupations
of 7% between 1880 and 1900 (from 68 to 73 occupations), whereas the native born
sample increased by 10% (from 114 to 125 occupations).
Importantly, this analysis excludes farm workers for whom income estimates in this
period are highly problematic. As noted in Chapter II, estimating the income of
farmers in the nineteenth century was fraught with difficulty. Some researchers have
responded to this challenge by making alterations to farmer income estimates to reflect
the lower cost of living in farming areas.172 Others have chosen to exclude farmer
income from their estimates due to the issues of developing a reliable estimate.173 In
171
Income estimates for Table 3.5 are taken from Sobek (1996), and represent a single estimate per
occupation as of 1890. 172
See Minns (2000). 173
See Preston and Haines (1991).

86
this section, I have chosen to exclude farmer income as I believe that making
adjustments to reflect cost of living differences would only create another level of
required adjustments to address potential rural/urban and regional differences in living
costs elsewhere in my sample. As a result, I have chosen to present my income
analysis without the impact of farmer incomes. The results of this analysis further
confirm that there was a gap in occupational progress between the Irish and the native
born in income as well as in occupational mobility.
Table 3.5
Estimated Mean Income Levels Excluding Farm Workers
($ per annum)
Irish Native
1880 554 637 1900 621 727
% Growth 12% 14%
In order to better understand the occupational experience of Irish immigrants relative
to the native born, I also reviewed the change in occupations groups from 1880 to
1900. By assessing the patterns of occupational group movements, I sought to identify
any systematic differences in the occupational mobility of my Irish sample relative to
my native born sample. In Tables 3.6 and 3.7, I present the changes in occupational
groups for both the Irish and native born. I use percentages as opposed to absolute
figures in order to more easily illustrate the comparison between the two groups. The
tables present the percentage of workers in a given occupational group in 1880 along

87
the vertical axis, and the occupational group of these same workers in 1900 along the
horizontal axis.
What is most immediately striking about Tables 3.6 and 3.7 is the significant level of
upward as well as downward mobility experienced by both the Irish and native born in
this time period. For example, 9% of Irish and 10% of native born workers who were
listed in the unskilled category in 1900 had been classified as having a high white
collar job in 1880. Similarly, 19% of Irish and 9% of native born workers who had
reached the high white collar category by 1900 had been classified as being unskilled
in 1880. This fluidity in the labour market appears to have existed for both Irish
newcomers to the US as well as for the native born.174 The sole exception to this high
level of mobility would appear to be farmers. They are the least likely of the six
occupational groups to move to another group between 1880 and 1900. For both the
Irish sample as well as the native born sample, a majority of those workers who were
identified as farmers in 1900 had also been classified as farmers in 1880. There are,
however, some noticeable differences between the occupational group movements of
the two samples. For the Irish, the unskilled category in 1880 provides the highest
percentage of workers for other categories in 1900. For the native born, it is workers
who were classified as farmers in 1880 who provide the highest percentage to the other
occupational groupings in 1900 (though 60% of those who were farmers in 1880
remained so in 1900). A review of Tables 3.6 and 3.7 leads to the conclusion that
labour markets provided for significant upward and downward mobility for both native
174
In a study of immigrant and native born occupational mobility in the mid -nineteenth century, Ferrie
(1999) finds that immigrant and native born workers had comparatively lower upward occupational
mobility than the results presented in Table 3.6 (as measured by the percentage of unskilled workers
who were able to move to a higher occupational category between 1850 and 1860). With respect to
downward mobility, the immigrants in his sample experienced significantly higher downward mobility
whereas the native born had downward mobility levels similar to the results presented in Table 3.6. See
Ferrie (1999), p. 146.

88
born as well as for Irish newcomers to the US in the late nineteenth century. However,
the predominance of the native born in farming and the Irish in unskilled work is quite
distinct. The Irish do appear to make noticeable progress in moving up the
occupational ladder, but not in a markedly different pattern than the native born.

89
Table 3.6
Irish Sample Occupational Group Movements
1900 High Low Semi- Un- 1880 WC WC Farmer Skilled skilled skilled
High WC 34% 18% 8% 7% 12% 9%
Low WC 10% 25% 5% 5% 5% 7% Farmer 10% 10% 53% 9% 12% 14% Skilled 13% 13% 11% 41% 16% 15%
Semi-skilled 12% 20% 8% 16% 26% 23% Unskilled 19% 15% 15% 23% 26% 32%
Total 100% 100% 100% 100% 100% 100%
Table 3.7
Native Sample Occupational Group Movements
1900 High Low Semi- Un-
1880 WC WC Farmer Skilled skilled skilled High WC 36% 20% 9% 12% 11% 10%
Low WC 10% 21% 4% 7% 10% 7% Farmer 30% 32% 60% 29% 31% 44%
Skilled 9% 11% 8% 34% 15% 12% Semi-skilled 7% 8% 6% 8% 19% 9% Unskilled 9% 9% 12% 10% 14% 17%
Total 100% 100% 100% 100% 100% 100%

90
In addition to analysing the changes in occupational groups between 1880 and 1900, I
have also created a transition matrix based on occupational groups for each of the Irish
and native born samples. In a transition matrix, each row includes the probabilities of
moving from the state represented by that row (in this case an occupational group), to
the other states (i.e. other occupational groups). The horizontal rows of a transition
matrix each sum to one. Transition matrices are based on the Markov property, under
which future states are independent of past states. Under this property, future states are
reached through a probabilistic process instead of a deterministic one. In Tables 3.8
and 3.9, I present transition matrices for the Irish and native born samples. As can be
seen from these tables, there are certain occupational groups where the probability of
moving to other groups is quite similar for both the Irish and native born samples.
Movements between the high white collar and low white collar categories, for
example, are very similar for the two samples. However, there is a significant
difference in the farmer category, where the native born show a much higher
probability of entering (or remaining in) this occupational category than do the Irish. In
Table 3.9, we see that for the native born, the probability of moving from any other
occupational group into farming is greater than 30%. These probabilities are roughly
three times as high as for the corresponding occupational group in the Irish sample. In
contrast, the Irish have a much higher probability of moving into (or remaining in)
semi- and un-skilled work than do the native born. The native born demonstrate a
much higher probability of exiting unskilled work than do the Irish. The transition
matrices presented in Tables 3.8 and 3.9 serve to reinforce the conclusion that while
there was a significant degree of occupational mobility for both the Irish and native
born in the US economy at the end of the nineteenth century, there remained material
differences between the occupational experiences of these two groups.
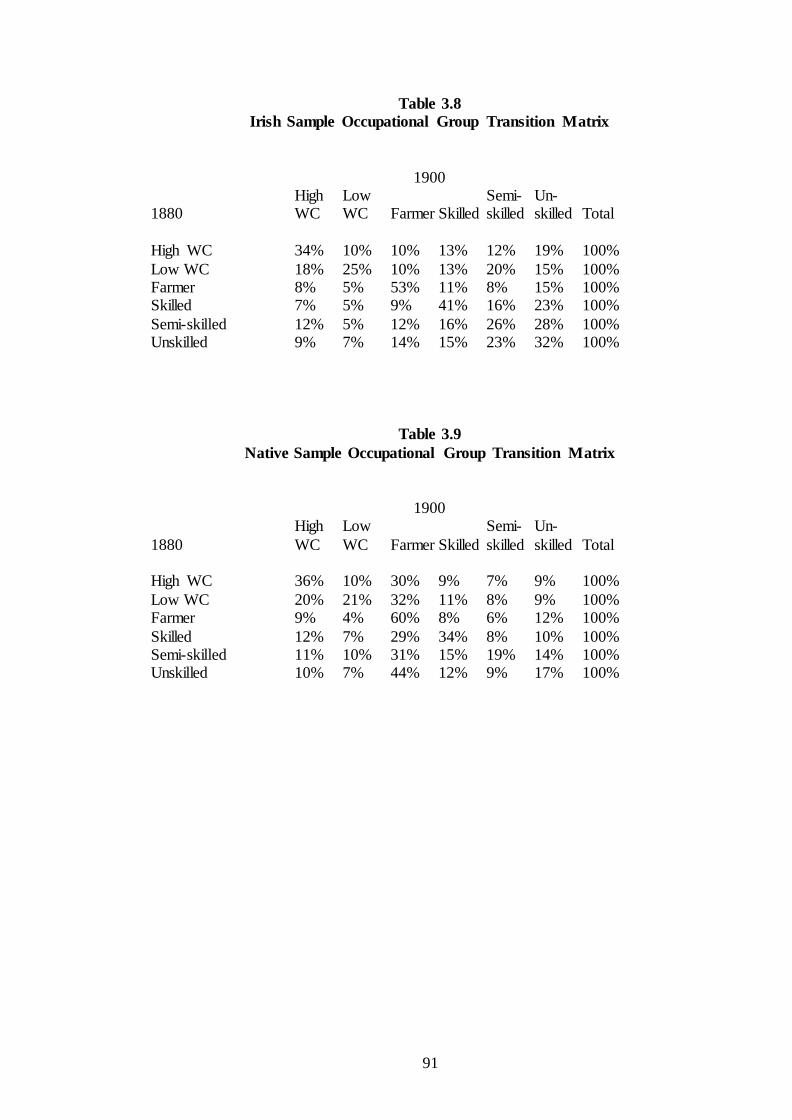
91
Table 3.8
Irish Sample Occupational Group Transition Matrix
1900 High Low Semi- Un- 1880 WC WC Farmer Skilled skilled skilled Total
High WC 34% 10% 10% 13% 12% 19% 100%
Low WC 18% 25% 10% 13% 20% 15% 100% Farmer 8% 5% 53% 11% 8% 15% 100% Skilled 7% 5% 9% 41% 16% 23% 100%
Semi-skilled 12% 5% 12% 16% 26% 28% 100% Unskilled 9% 7% 14% 15% 23% 32% 100%
Table 3.9
Native Sample Occupational Group Transition Matrix
1900 High Low Semi- Un-
1880 WC WC Farmer Skilled skilled skilled Total High WC 36% 10% 30% 9% 7% 9% 100%
Low WC 20% 21% 32% 11% 8% 9% 100% Farmer 9% 4% 60% 8% 6% 12% 100%
Skilled 12% 7% 29% 34% 8% 10% 100% Semi-skilled 11% 10% 31% 15% 19% 14% 100% Unskilled 10% 7% 44% 12% 9% 17% 100%
92
One potential criticism of the results presented thus far is that some might argue that
the Irish could not have been expected to attain the occupational levels of the native
born given their recent arrival in the US and their propensity to reside in the more
urban regions of the US. The native born, as we have observed, were much more likely
to have lived in rural areas in this time period. The Irish who immigrated to the US in
the post famine period were recorded as coming primarily from Connaught and other
western regions of the country. These areas were characterised by an overwhelmingly
agrarian economy, relatively small sized farms by Irish standards, and greater levels of
poverty.175 According to Guinnane (1997), though these Irish immigrants “had skills
most applicable to the farm,” they generally looked for work in cities. He found that
“the Irish emigrant‟s occupational background was less useful in industrial
countries.”176 Fitzpatrick (1985) concurs that “the great majority” of Irish emigrants
left Ireland without marketable skills. He also found that emigration from Ireland after
the 1840s was “most heavily concentrated in the regions of greatest poverty and least
off-farm employment.”177 He noted that Irish emigrants to the US were “drawn from
the surplus of a rural population which had formerly subsisted upon potato production
before the coming of the blight.”178 As these comments illustrate, Irish immigrants to
the US in the late nineteenth century came primarily from poor, agrarian backgrounds.
Yet, despite their lack of experience in non-farm occupations, the vast majority settled
and looked for work in the more urban regions of the US economy. A detailed analysis
of the settlement patterns of Irish immigrants will be presented in Chapter V.
175
Guinnane (1997), pp. 107-8. 176
Guinnane (1997), p.106. 177
Fitzgerald (1985), pp. 8-9. 178
Fitzgerald (1985), p. 11.

93
To address this issue, I have also segregated my Irish and native born samples to
include only those individuals residing in urban areas179 at the start of my period of
analysis in 1880. Since the Irish in the US were overwhelming urban in 1880, this
approach would compare their overall assimilation and occupational mobility against a
native born subset that was more likely to resemble the Irish in this time frame. This
analysis would eliminate the significant advantage that the native born enjoyed in
farming, a white collar occupation where the Irish had achieved little convergence with
the native born by 1900. In Table 3.10, I present summary statistics for my sub-
samples of Irish and native born individuals who lived in urban areas in 1880.
Interestingly, these results are broadly consistent with the prior analyses using the
complete samples of the Irish and native born. Even when restricted to solely an
analysis of individuals living in urban areas, the Irish and native born maintain clear
and statistically significant differences in areas such as marital status, literacy,
employment status, spouse fertility, child mortality and spouse birthplace. Only in
home ownership do the urban Irish achieve any convergence with the urban native
born, though they still lag on an absolute if not on a statistically significant basis. It is
also notable that 26% of the Irish urban sample and 50% of the Native born urban
sample have relocated to rural areas by the time of the 1900 US census. Given the fact
that the US was becoming a more urbanised nation in this time period, these figures
indicate a high degree of geographic mobility among the US population and
underscore the continued attraction of farming as an occupation (particularly for the
native born) despite a rapidly urbanising American economy. They would also indicate
179
Under the NAPP definition, an urban area in 1880 is comprised of villages, thickly settled areas,
cities and incorporated places with 2,500 or more inhabitants. It also includes townships and other
political subdivisions (not incorporating municipalities) with a total population of 10,000 or more and a
population density of 1,000 or more per square mile.

94
that American labour markets were internally integrated in this period, not just
between urban locations but between urban and rural settings as well.

95
Table 3.10
Irish and Native Urban Sample Summary Statistics
Variable Irish Urban Native Urban
Observations 532 2,236
Age
1880 31.6 years*** 28.9 years
1900 51.6*** 48.9
Rural Status
1880 0.0% 0.0%
1900 25.8%*** 49.8%
Marital Status (1900)
Married 74.1%*** 81.6%
Never Married 13.9% 11.5%
Widowed 11.8% 6.4%
Divorced 0.2% 0.5%
Home Ownership (1900) 51.9% 55.0%
Literacy (1900)
Read and write English 91.7%*** 96.5%
Read or write only 1.1% 0.9%
Quarters Unemployed (1900)
Not unemployed 80.5%*** 86.5%
1 Quarter 6.8% 5.4%
2 8.5% 5.4%
3-4 4.2% 2.7%
Spouse Fertility (1900)
Avg. Children Ever Born 6.2 *** 4.7
Avg. Children Surviving 4.7 *** 3.9
Implied Mortality Rate 24.2% 17.0%
Spouse Age (1900) 46.9 years*** 43.5 years
Spouse Birthplace (1900)
Ireland 55.1%*** 0.7%
Other Foreign Country 8.1% 3.9%
US 36.8% 95.4%
Spouse Literacy (1900)
Read and write English 89.0%*** 95.9%
Read or write only 4.2% 1.5%
Spouse in workforce (1900) 2.6% 2.6%
***Differences between the individuals in the two samples are significant at the 1, 5 and 10% levels ,
respectively, using a t test for age and fertility variables, and the chi squared test of independence for the
remaining variables.

96
Table 3.11 presents the change in occupational groupings over time for my samples of
Irish and native born urban dwellers. As the results illustrate, the native born urban
have a sizeable advantage over the Irish urban in terms of occupational levels in 1880.
While this advantage may have been expected, the scale of the difference is quite
significant. The native urban have more than three times the percentage of white collar
jobs as do the Irish urban and roughly one third the percentage of unskilled jobs.
Although the Irish do reduce these differences by 1900 (as evidenced by their higher
percentage change figures), they still lag the native born urban by a ratio of 2:1 in
white collar employment and have approximately three times the percentage of
unskilled workers as do the native born urban in 1900. While both groups show a
strong inclination to move into farming, this trend is particularly strong for native born
urban dwellers that held low white collar jobs in 1880. While the native born moved
into farming from several other categories, 28% of those native born who were low
white collar workers in 1880 moved into farming by 1900. Along with those low white
collar workers who moved into high white collar work, these movements help to
explain the significant 45% decline in the native born urban low white collar category
over the period.
Table 3.12 presents the mean income levels for my Irish and native born urban sub-
samples. As in previous cases, I have excluded farm workers from this analysis. As
these results indicate, the Irish urban also lagged well behind the native born urban in
income levels. In fact, the gap in income between the Irish and native born living in
urban areas is actually greater than for the overall sample results presented in Table
3.5. In this case, the mean native born urban income level is 21% higher than for the
Irish urban. The corresponding figure for the overall samples was 17%. It is true that

97
the Irish urban experienced a higher rate of income growth than did the native born
urban dwellers, but the gap in mean income levels in 1900 remains quite significant.
These results for occupational mobility and income, together with the summary
statistics analysis presented in Table 3.10, indicate that during the period from 1880 to
1900, the Irish living in urban areas did not assimilate quickly relative to the native
born urban, nor did they come close to achieving occupational parity with the native
born urban in the workplace. Narrowing the focus of the analysis to those Irish and
native born who lived in urban areas in 1880 does not alter the conclusions reached
with respect to the broader samples.
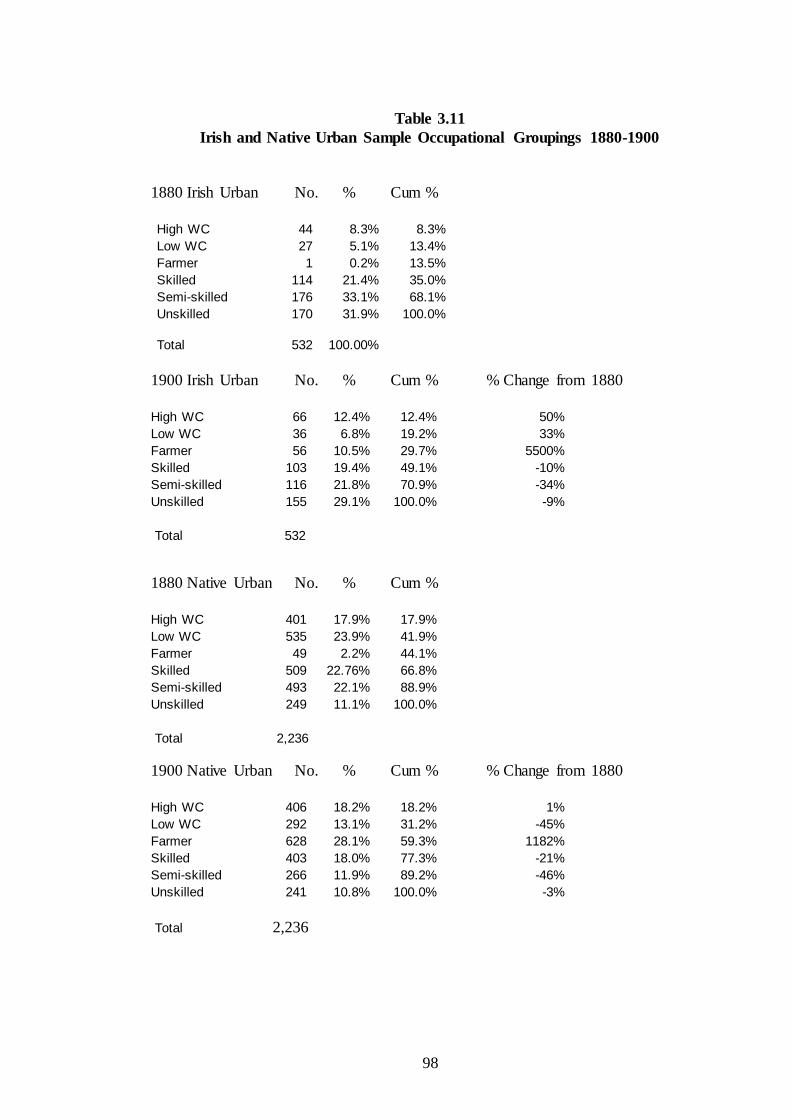
98
Table 3.11
Irish and Native Urban Sample Occupational Groupings 1880-1900
1880 Irish Urban No. % Cum % High WC 44 8.3% 8.3%
Low WC 27 5.1% 13.4%
Farmer 1 0.2% 13.5%
Skilled 114 21.4% 35.0%
Semi-skilled 176 33.1% 68.1%
Unskilled 170 31.9% 100.0%
Total 532 100.00%
1900 Irish Urban No. % Cum % % Change from 1880 High WC 66 12.4% 12.4% 50%
Low WC 36 6.8% 19.2% 33%
Farmer 56 10.5% 29.7% 5500%
Skilled 103 19.4% 49.1% -10%
Semi-skilled 116 21.8% 70.9% -34%
Unskilled 155 29.1% 100.0% -9%
Total 532
1880 Native Urban No. % Cum % High WC 401 17.9% 17.9%
Low WC 535 23.9% 41.9%
Farmer 49 2.2% 44.1%
Skilled 509 22.76% 66.8%
Semi-skilled 493 22.1% 88.9%
Unskilled 249 11.1% 100.0%
Total 2,236
1900 Native Urban No. % Cum % % Change from 1880 High WC 406 18.2% 18.2% 1%
Low WC 292 13.1% 31.2% -45%
Farmer 628 28.1% 59.3% 1182%
Skilled 403 18.0% 77.3% -21%
Semi-skilled 266 11.9% 89.2% -46%
Unskilled 241 10.8% 100.0% -3%
Total 2,236

99
Table 3.12
Estimated Mean Income Levels Excluding Farm Workers
($ per annum)
Irish Urban Native Urban
1880 562 695 1900 616 747
% Growth 10% 7%
Although the majority of Irish immigrants chose to reside and seek work in the urban
regions of the US, there were a meaningful number of Irish immigrants who entered
farming in this period. In 1900, 160 out of the 937 individuals in my Irish sample were
engaged in farming.180 While this figure, which equates to 17% of my sample, is
substantially lower than for the native born sample (46%), it is nonetheless worthy of
analysis.181 Were these Irish immigrants somehow different from the urban Irish we
have just reviewed? What were the factors that would have led almost one in five of
the Irish in my sample to seek work in farming at a time when the US economy was
becoming more urban and industrialised?182 How does the assimilation patterns of this
group compare to those Irish who did not enter farming as an occupation?
In Table 3.13, I have segregated those Irish who were engaged in farming in 1900 from
those who were not. I have also added a column to show the summary statistics for
native born farmers in 1900. The results suggest that there were meaningful differences
between Irish farmers and Irish non-farmers, and that there were some interesting
180
In my Irish sample, the only occupation with a larger number of workers in 1900 was unskilled
labourers, a broad category which numbered 190 (21% of the sample). 181
Fitzpatrick (1985), p. 32. It must be noted, however, that in addition to being less likely to engage in
farming than the native born, the Irish appear to have lagged other immigrant groups as well. Fitzpatrick
found that there was, in fact, no immigrant group in the US in the nineteenth century that was “so
disinclined to work in agriculture as the expatriate Irish.” 182
In my Irish sample, approximately 35% of the Irish who were engaged in farming had been living in
urban areas in 1880. In addition, just 7% of my sample chose to move from a farming to a non -farming
occupation between 1880 and 1900.
100
similarities between the Irish and native born farmers. As Table 3.13 illustrates, the
Irish farmers were older, more likely to be married, and much more likely to own their
home than Irish non-farmers. The difference in home ownership levels is quite
striking, with more than 80% of Irish farmers owning their own home versus just 47%
of non-farmers. Irish farmers reported much lower levels of unemployment in the 1900
US census than did non-farmers (there was just one farmer in my sample who was
reported as being unemployed versus 21% of non-farmers who reported some level of
un- or under-employment in 1900). Also of note is the higher level of fertility among
Irish farming families and the noticeably lower level of child mortality compared to
Irish non-farmers. Finally, Irish farmers were also less likely to marry an Irish spouse
than were their non-farming peers.183
As for the comparison of the Irish farmers to the native born farmers, the results reveal
some interesting patterns of assimilation. Both these groups had a very high percentage
of married couples, much higher than for the non-farming Irish. In addition, they also
had higher levels of home ownership. In fact, the Irish actually had a higher percentage
of home ownership than did the native born farmers. An impressive 81% of Irish
farmers in my sample were home owners in 1900. Finally, the child mortality rates for
the Irish farmers were much lower than for the Irish non-farmers and virtually identical
to those of native born farmers. Interestingly, the Irish farmers nonetheless had higher
levels of marital fertility than either of these groups. Taken as a whole, the Irish who
engaged in farming appeared to assimilate more quickly in certain areas (such as home
ownership, marital status, child mortality and nationality of spouse), but not in other
areas (such as marital fertility), where their behaviour would suggest a lesser degree of
183
It is highly likely that living in a rural area (as opposed to an urban one) may have influenced both
the marriage choices of these Irish immigrants, as well as had an effect on their fertility and child
mortality patterns.

101
assimilation. It is also quite striking to compare the significant level of assimilation
achieved by Irish farmers relative to native born farmers, versus the much lower
degree of assimilation achieved by the urban Irish vis-à-vis the urban native born.
These results would confirm that the assimilation process for Irish immigrants was not
uniform, but varied depending on which subset of the Irish sample was being
reviewed, and which socio-economic variables were under consideration. In addition,
Irish immigrants who engaged in farming were less likely to be surrounded by fellow
immigrants, and were much more likely to have had a greater exposure to native born
Americans. Although a detailed analysis of the relationship between geographic
clustering and assimilation will be conducted in Chapter V of this dissertation, these
results would appear to provide some evidence for the argument that an increased
exposure to the native born enhanced the assimilation of Irish immigrants in many
respects relative to those who lived in urban areas.

102
Table 3.13
Summary Statistics for Irish and Native Farmers, and Irish Non-Farmers in 1900
Variable Irish Farmers Irish Non-Farmers Native Farmers Observations 160 777 7,322 Age 1880 35.1 years 31.3 years 28.8 years 1900 55.0 51.3 48.7 Rural Status 1880 65.0% 38.7% 91.4% 1900 96.9% 22.7% 97.8% Marital Status (1900) Married 83.1% 72.7% 90.1% Never Married 11.3% 15.1% 4.8% Widowed 5.6% 11.4% 4.9% Divorced 0.0% 0.4% 0.2% Home Ownership (1900) 81.3% 46.7% 74.2% Literacy (1900) Read and write English 93.1% 92.5% 91.7% Read or write only 0.6% 1.3% 2.2% Quarters Unemployed (1900) Not unemployed 99.4% 79.0% 95.2% 1 Quarter 0.0% 7.2% 2.3% 2 0.0% 8.9% 1.7% 3-4 0.6% 4.9% 0.8% Spouse Fertility (1900) Avg. Children Ever Born 7.0 6.2 6.1 Avg. Children Surviving 5.9 4.6 5.1 Implied Mortality Rate 16.3% 25.1% 16.3% Spouse Age (1900) 50.2 years 46.5 years 43.4 years Spouse Birthplace (1900) Ireland 45.6% 55.8% 0.3% Other Foreign Country 12.8% 7.9% 1.6% US 41.6% 36.3% 98.1% Spouse Literacy (1900) Read and write English 90.4% 89.9% 90.8% Read or write only 2.4% 3.3% 2.9% Spouse in workforce (1900) 0.8% 3.0% 1.5%
103
In an effort to more specifically assess the influence of certain socio-economic factors
on Irish assimilation into American life, I have also segregated my Irish sample into a
variety of subsets. Specifically, I have segregated my Irish sample into categories
including: younger Irish versus older Irish, recent Irish immigrants versus earlier
immigrants, and those Irish who immigrated to the US as adults versus those who
came as children. In this analysis, a “young” person is one who was 30 years of age or
less in 1880, while an “old” person was over 30 years of age in 1880. A “recent”
immigrant is one who came to the US after 1865, while an “earlier” immigrant came
on or before 1865.184 And those who immigrated at an age of 16 or under were
considered to be children whereas those who were over 16 years of age were
considered to be adults at the time of immigration. The rationale for creating these
specific subsets of my Irish sample was so that I could examine the influence of age
and year of immigration on the assimilation process. Were there differences between
younger and older immigrants in occupational levels and mobility? Did the Irish who
immigrated as children have different characteristics and occupational mobility than
those who came as adults? Was the amount of time living in the US a key factor in the
assimilation of Irish immigrants? The following section addresses these questions.
In Table 3.14, I present a comparison of the summary statistics for these various cohort
groups. I also include the native sample summary statistics for comparison purposes.
As these results illustrate, age, year of immigration, and age at time of immigration do
appear to impact the assimilation process for my Irish sample in this time period. With
respect to age, the younger Irish were more likely to live in urban areas than were older
Irish. In fact, the younger Irish were the most urban of any of the cohorts in this
184
1865 was the year the American civil war ended and thus represents a useful break point to separate
Irish immigrants to the US into separate groups.

104
analysis. The younger Irish were also more literate (as were their spouses), and were
much more likely to marry an American born woman than were the older Irish. The
one category where older Irish had an advantage was in home ownership, indicating a
potential positive relationship between age and home ownership in the data. The
younger Irish also had a lower level of spouse fertility and child mortality than did the
older Irish. But again, these results could also just reflect the fact that with the passage
of time, the older had had more time both to have children and for more of those
children to have not survived once born. Analyses of the summary statistics for recent
versus earlier immigrants also provides some interesting results, though the differences
here are of a lesser magnitude. Recent immigrants, like the younger immigrants, were
less likely to be home owners and were more likely to reside in urban areas. It is
possible that the tendency for these cohorts to live in urban areas reflects the fact that
they settled in areas near the ports where they may have first entered the US, where
jobs may have been more easily found, and nearer to areas where other Irish
immigrants had previously settled. (A more detailed analysis of the geographical
location of Irish immigrants in the US will be presented in Chapter V of this
dissertation). Apart from these differences, they resembled the earlier immigrants quite
closely in other characteristics, none of which were statistically significant in their
differences. Whether the Irish immigrated as children as opposed to as an adult does
appear to impact their subsequent assimilation in several areas. The Irish who came as
children were more literate, as were their spouses. They were the most likely of any
cohort group to marry an American woman. They also recorded the lowest levels of
un-and under-employment of any cohort group at the time of the 1900 US census
(though this difference was not statistically significant).
105
Table 3.15 presents the occupational groupings and mean income levels for the Irish
cohorts groups. Again, the impact of age, year of immigration, and age at time of
immigration is significant. Irish who immigrated as children recorded the highest mean
income levels in 1900, as well as a high percentage of white collar employment and
the lowest percentage of unskilled work. Their income growth between 1880 and 1900
was also one of the highest. Similarly, those Irish who were young at the start of our
period of analysis in 1880 also recorded high levels of income, as well as the highest
rate of income growth. They were also more likely to work in white collar employment
than most of the other cohort groups. Older Irish and immigrants who came to the US
before 1865 were slightly less likely to have white collar employment and were much
more likely to be farmers. There appears to be a strong relationship between the
amount of time living in the US, and age, and the propensity of an Irish immigrant
becoming a farmer. These groups also were less likely to be working in an unskilled
occupation by 1900. The group which appears to have had the lowest levels of
occupational mobility were those Irish who immigrated to the US as an adult. In the
case of this group, not only were they more likely to be unskilled labourers, but they
also recorded the lowest mean income level in 1900.

Table 3.14
Irish Sample Cohort Comparison
Variable Over 30 in 1880 Under 30 in 1880 Immigrated pre-1865 Immigrated post-1865 Immigration Age Under 16 Immigration Age Over 16 Native Sample
Observations 513 424 461 476 431 501 15,985
Age
1880 38.1 years 24.5 years *** 36.0 years *** 28.1 years 30.2 years *** 33.5 years 28.0 years
1900 58.1 44.5 56.0 48.0 50.1 53.5 48.0
Rural Status
1880 45.8% *** 40.1% 44.5% 42.0% 43.6% 43.1% 86.0%
1900 39.4% *** 30.4% 39.7% *** 31.1% 35.5% 35.1% 74.7%
Marital Status (1900)
Married 75.2% 73.6% 73.7% 75.2% 72.6% 76.0% 84.4%
Never Married 9.6% 20.3% 13.7% 15.1% 17.9% 11.4% 9.1%
Widowed 14.6% 6.1% 11.9% 9.7% 9.3% 12.2% 6.1%
Divorced 0.6% 0.0% 0.7% 0.0% 0.2% 0.4% 0.4%
Home Ownership (1900) 59.3% *** 44.6% 57.3% *** 48.1% 53.4% 55.1% 60.2%
Literacy (1900)
Read and write English 91.4% 94.1% 92.2% 93.1% 95.4% *** 90.4% 94.0%
Read or write only 1.6% 0.7% 1.7% 0.6% 0.5% 1.6% 1.5%
Quarters Unemployed (1900)
Not unemployed 83.4% 81.4% 82.4% 82.6% 84.7% 80.6% 86.6%
1 Quarter 5.1% 7.1% 6.1% 5.9% 6.0% 6.0% 5.6%
2 Quarter 6.4% 8.5% 6.9% 7.8% 6.3% 8.4% 5.8%
3-4 Quarters 5.1% 3.0% 4.6% 3.7% 3.0% 5.0% 2.0%
Spouse Fertility (1900)
Avg. Children Ever Born 6.9 *** 5.7 6.5 6.2 6.1 * 6.6 5.3
Avg. Children Surviving 5.2 *** 4.5 5.0 4.8 4.7 5.0 4.4
Implied Mortality Rate 24.60% 21.10% 23.10% 22.60% 23.00% 24.20% 16.7%
Spouse Age (1900) 52.7 years *** 40.5 years 51.1 years *** 43.6 years 45.5 years *** 48.5 years 42.8 years
Spouse Birthplace (1900)
Ireland 60.6% *** 45.9% 52.8% 54.9% 40.4% *** 64.6% 0.4%
Other Foreign Country 10.4% 6.8% 8.4% 9.2% 7.4% 10.1% 2.7%
US 29.0% 47.3% 38.8% 35.9% 52.2% 25.3% 96.9%
Spouse Literacy (1900)
Read and write English 86.3% *** 94.4% 88.8% 91.1% 95.0% *** 86.1% 93.6%
Read or write only 3.6% 2.6% 3.1% 3.1% 3.3% 2.7% 1.7%
Spouse in workforce (1900) 2.5% 2.6% 2.8% 2.3% 1.7% 3.3% 2.2%
***Differences between the individuals in the linked cohort samples are significant at the 1, 5 and 10% levels, respectively, using a t test for age and fertility variables, and the chi squared test of independence for the remaining variables.
106

Table 3.15
Comparison of Irish Cohort Groups and Native Born 1900 Occupational Groupings and Income Growth
Over 30 in 1880 Under 30 in 1880 Immigrated pre-1865 Immigrated post-1865
Occupational
Group (1900) Freq. Percent Cum. Freq. Percent Cum. Freq. Percent Cum. Freq. Percent Cum.
High WC 53 10.3 10.3 54 12.7 12.7 50 10.9 10.9 57 12.0 12.0
Low WC 37 7.2 17.5 27 6.4 19.1 31 6.7 17.6 33 6.9 18.9
Farmer 114 22.2 39.8 46 10.9 30.0 103 22.3 39.9 57 12.0 30.9
Skilled 95 18.5 58.3 80 18.9 48.8 95 20.6 60.5 80 16.8 47.7
Semi-skilled 96 18.7 77.0 94 22.2 71.0 81 17.6 78.1 109 22.9 70.6
Unskilled 118 23.0 100.0 123 29.0 100.0 101 21.9 100.0 140 29.4 100.0
Total 513 100.0 424 100.0 461 100.0 476 100.0
Mean Income Levels Excluding Farm Workers
1880 583 526 581 532
1900 618 625 635 610
% growth 6% 19% 9% 9%
Immigration Age Under 16 Immigration Age Over 16 Native born
Occupational
Group (1900) Freq. Percent Cum. Freq. Percent Cum. Freq. Percent Cum.
High WC 52 12.1 12.1 55 11.0 11.0 2,052 12.8 12.8
Low WC 31 7.2 19.3 33 6.6 17.6 1,159 7.3 20.1
Farmer 75 17.4 36.7 84 16.8 34.3 7,322 45.8 65.9
Skilled 95 22.0 58.7 78 15.6 49.9 2,003 12.5 78.4
Semi-skilled 83 19.3 78.0 107 21.4 71.3 1,338 8.4 86.8
Unskilled 95 22.0 100.0 144 28.7 100.0 2,111 13.2 100.0
Total 431 100.0 501 100.0 15,985 100.0
Mean Income Levels Excluding Farm Workers
1880 566 545 637
1900 648 598 727
% growth 14% 10% 14%
107

It is clear that age, year of immigration, and age at time of immigration were
significant factors in the assimilation of Irish immigrants in this timeframe. Younger
Irish immigrants and those Irish who immigrated to the US as children achieved the
highest levels of occupational mobility, income and income growth. They were also
the most literate and the most likely to marry an American born spouse. These results
confirm the work of Eichengreen and Gemery (1986), which studied immigrant
workers in the US state of Iowa in the late 1800s and also found that younger
immigrants and those that immigrated as children assimilated more rapidly.185 Older
Irish and those Irish who immigrated earlier were less successful in obtaining white
collar work but were more likely to become farmers. They had lower income levels
and income growth. Irish who immigrated as adults had the weakest occupational
performance. They were more likely to work in an unskilled occupation and had the
lowest income level of any of the cohort groups in 1900.
In order to better understand the assimilation experience of Irish immigrants in the US,
in addition to comparing the Irish sample cohort groups to each other, it is also
important to compare them to the native born sample. Through this comparison, we
can identify in which areas these cohorts of Irish immigrants may closely resemble the
native born, and perhaps draw more substantive conclusions regarding the assimilation
of the Irish in this time period. In comparing the Irish cohort results with the summary
statistics of the native born also presented in Table 3.14, it is evident that in most
respects, the native born continue to have significant differences with each of the Irish
cohort groups. In areas such as rural status, marital status, spouse fertility, child
mortality and spouse nationality, none of the Irish cohort groups resembles the native
185
Eichengreen and Gemery (1986), p. 442. They argued that these characteristics (being younger and
immigrating as children) increased the ability of immigrants to learn skills necessary to succeed in the
US economy.
109
born sample. The native born are much more likely to live in rural locations and are
more likely to be married. Their spouses have fewer children and more of their
children survive. Their spouses are also much more likely to be American born than
any of the Irish cohort groups. The older Irish immigrants do approach the native born
level of home ownership, with age again appearing to display a positive correlation
with home ownership. In addition, those Irish who immigrated when they were young
had similarly lower levels of unemployment to the native born. Apart from these two
examples, however, none of the Irish cohort groups appear to have achieved
meaningful levels of assimilation with the native born sample by 1900 in any variable
under analysis.
With respect to occupational mobility and income, the Irish cohort groups also fail to
achieve the levels of the native born sample. As Table 3.15 illustrates, the native born
outperform all of these groups. The native born have a mean income level which is
12% higher than the best performing Irish cohort group in 1900. Only the young Irish
cohort achieves a higher rate of income growth, but their mean income level is
nonetheless 16% lower than that of the native born. With respect to occupational levels
and mobility, the native born again have higher levels of white collar employment than
any cohort group. Including farmers as white collar workers only further increases this
advantage. In 1900, the percentage of native born working in white collar employment
is 65% higher than the best performing Irish cohort group. In addition, the native born
sample also had a far lower percentage of unskilled workers. This figure is 40% lower
than the best performing Irish cohort group.
110
In summary, the Irish do not appear to achieve meaningful assimilation with the native
born, either in aggregate or when analysed in specific cohort groups. The native born
also experience greater occupational advancement and higher income levels. They
remain distinctive in most of the socioeconomic variables available for study using US
census data. Nonetheless, there are several interesting conclusions about the Irish that
can be drawn from this cohort analysis. First of all, youth, both in terms of absolute
age as well as in age at time of immigration, appears to be associated with greater
occupational mobility. Was it the case that the Irish who arrived as children had a
greater ability to adapt to the US economy than those who were older? In line with the
analysis of Eichengreen and Gemery (1986), perhaps youth and immigrating to the US
as a child increased the ability of immigrants to learn the skills necessary to succeed in
the US economy of the late nineteenth century. The young also had higher rates of
literacy and were the most likely to marry an American spouse. In all these respects,
they appear to have assimilated more quickly than those Irish who were older or came
to the US as adults. Two areas in which youth does not appear to have aided
assimilation relative to the native born were farming and home ownership. In these
areas, age and time living in the US were the driving factors enabling the Irish to
approach the levels of the native born sample. Age at immigration had surprisingly
little influence on whether the Irish entered farming as a career relative to these two
factors.
We have clearly established in this chapter that Irish immigrants did not assimilate
quickly relative to the native born in the last decades of the nineteenth century, nor did
they achieve occupational parity in the workforce. But how did the Irish fare relative to
the broader American population in this timeframe? Did they come to resemble the

111
broader American population captured in my melted sample? Were their experiences
in the workforce more similar to those individuals in my melted sample?
This section will compare the Irish and native born experience with that of those
individuals captured in my melted sample. Recall from Chapter II that the melted
sample was assembled using the same criteria with respect to gender, age, race and
labour force participation as were my Irish and native born samples. The one
difference in the construction of the melted sample was that I did not attempt to match
specific individuals from the 1880 to the 1900 US census. The idea is for the melted
sample to accurately resemble the broader American population in both 1880 as well
as in 1900. The constraint of matching individuals would not permit me to maintain
this representativeness with an ever-changing American population, including the
arrival of many millions of new immigrants between 1880 and 1900. Thus, whereas
the Irish and native born samples capture the experience of the same individuals over
time, the melted sample does not. The composition of the melted sample changes
between 1880 and 1900 in order to reflect the changes in the broader American society
over this time period.
A review of the summary statistics presented in Table 3.16 for the Irish, native born
and melted samples reveals that for the most part, the Irish did not melt. In other
words, they did not come to resemble the melted sample in most characteristics under
review. The Irish were more likely to live in urban areas and were less likely to be
married than was the broader US population captured in the melted sample. They had
higher rates of spouse fertility and child mortality, and were far less likely to marry an
American born spouse. They did achieve convergence in literacy and, in contrast to
112
their performance relative to the native born sample, they also achieved convergence in
home ownership and unemployment levels in 1900. However, the home ownership
result may be influenced by the fact that the Irish sample is older on average than the
melted sample by approximately five years.
As for the native born, they also remained distinct from the melted sample in most
respects, but in the opposite direction. In contrast to the Irish, the native born were
more rural and more likely to be married than were the melted sample. They also had
lower levels of spouse fertility and child mortality. The native born were more likely to
marry an American born spouse, enjoyed higher levels of home ownership and lower
levels of unemployment than did the broader American sample. In effect, the melted
sample falls squarely between the Irish and native born samples in most of the
socioeconomic variables under consideration.
With respect to occupational mobility and income, the story is a similar one. As Table
3.17 indicates, the Irish lag both the melted and native born samples in occupational
mobility. The Irish have a significantly higher level of semi- and un-skilled workers in
1900 than do the other two samples, and a lower level of white collar workers. The
Irish also lag significantly behind the other two samples in farmers as well. As for the
native born, they outperform the melted sample as well as the Irish. They show the
greatest ability to exit the semi-and un-skilled categories between 1880 and 1900 and
the highest levels of white collar workers. They also have the highest percentage of
farmers in 1900 of any of the sample groups. Whereas the Irish make only moderate
progress in exiting the lowest two rungs on the occupational ladder between 1880 and
1900 (a reduction of approximately 24%), the native born have a reduction in these
113
two categories of 45%. As with my prior analysis, the melted sample falls in between
the levels of the Irish and native born samples. With respect to mean occupational
income comparisons, the results are again similar. As Table 3.18 illustrates, the native
born achieve both the highest mean income level in 1900 as well as the highest rate of
income growth over the period. The Irish again lag behind both the other samples.
In Table 3.19, I calculate the Duncan Dissimilarity Index for the occupational groups
in the Irish and melted samples. As the results indicate, the Irish do achieve some
convergence with the melted sample between 1880 and 1900. The index result for
1900 indicates that approximately one-third of Irish or melted sample workers would
need to change their job in order for the two distributions to exactly resemble each
other. This represents a narrowing of the index of approximately 7% from its 1880
value. The index levels in this table are lower than the results achieved in Table 3.4,
which compared the Irish occupational distribution to that of the native born sample. It
is important to remember, however, that the composition of the melted sample changes
between 1880 and 1900, whereas my Irish and native born samples do not. As a result,
part of the convergence that the Irish sample achieves with the melted sample in
occupational outcomes is undoubtedly a result of the fact that many new, largely less
skilled immigrants would have come to the US in the years between 1880 and 1900.
Nonetheless, this result does reinforce the conclusion that the Irish more closely
resembled the overall population than they did the native born during this time period.

114
Table 3.16
Irish, Native and Melted Sample Summary Statistics
Variable Irish Native Melted Observations 937 15,985 89,854 (1880) 9,267,544 (1900) Age 1880 32.0 years 28.0 years 29.0 years 1900 51.9 48.0 46.5 Rural Status 1880 43.2% 86.0% 70.6% 1900 35.3% 74.7% 57.2% Marital Status (1900) Married 74.5% 84.4% 81.4% Never Married 14.4% 9.1% 12.3% Widowed 10.8% 6.1% 5.9% Divorced 0.3% 0.4% 0.5% Home Ownership (1900) 52.6% 60.2% 52.7% Literacy (1900) Read and write English 92.6% 94.0% 93.0% Read or write only 1.1% 1.5% 2.3% Quarters Unemployed (1900) Not unemployed 82.5% 86.6% 83.2% 1 Quarter 6.0% 5.6% 7.9% 2 7.4% 5.8% 6.7% 3-4 4.1% 2.0% 2.3% Spouse Fertility (1900) Avg. Children Ever Born 6.4 5.3 5.8 Avg. Children Surviving 4.9 4.4 4.7 Implied Mortality Rate 23.3% 16.7% 19.4% Spouse Age (1900) 47.2 years 42.8 years 46.1 years Spouse Birthplace (1900) Ireland 53.9% 0.4% 4.6% Other Foreign Country 8.8% 2.7% 22.0% US 37.3% 96.9% 73.4% Spouse Literacy (1900) Read and write English 90.0% 93.6% 91.0% Read or write only 3.1% 1.7% 2.3% Spouse in workforce (1900) 2.5% 2.2% 3.2%

115
Table 3.17
Comparison of Irish, Native and Melted Sample Occupational Groupings
1880
Irish Native Melted
% Cum. % Cum. % Cum.
High WC 7.2 7.2 7.7 7.7 7.7 7.7 Low WC 4.3 11.4 6.3 14.0 7.5 15.2
Farmer 11.9 23.3 37.5 51.4 26.9 42.2 Skilled 15.8 39.1 9.1 60.6 12.9 55.0
Semi-skilled 28.6 67.7 9.0 69.6 16.5 71.5 Unskilled 32.3 100.0 30.5 100.0 28.5 100.0
1900
Irish Native Melted
% Cum. % Cum. % Cum.
High WC 11.4 11.4 12.8 12.8 12.9 12.9 Low WC 6.8 18.3 7.3 20.1 8.7 21.6 Farmer 17.1 35.3 45.8 65.9 32.2 53.8
Skilled 18.7 54.0 12.5 78.4 15.9 69.7 Semi-skilled 20.3 74.3 8.4 86.8 13.9 83.6
Unskilled 25.7 100.0 13.2 100.0 16.4 100.0

116
Table 3.18
Estimated Mean Income Levels Excluding Farm Workers
($ per annum)
Irish Native Melted
1880 554 637 597 1900 621 727 670
% Growth 12% 14% 12%
Table 3.19
Calculation of Duncan Dissimilarity Index for Irish and Melted Sample
Occupation
1880 .349
1900 .326
One final question to be addressed is whether this Irish experience of lagging behind
the native born in the workplace at the end of the nineteenth century was unique to the
Irish, or whether other immigrant groups also experienced this outcome. How does the
Irish experience compare to the other principal immigrants group in the US in this
timeframe? In order to address this question, I have chosen to examine the
occupational progress of German and English immigrants in the US in the same
timeframe. I have chosen these two immigrant groups because they were the most
prominent immigrant groups in the US other then the Irish in the late nineteenth
century. Similar to the Irish, these two groups had a long history of immigration to the
US dating back into the eighteenth century, and had come to the US in sizeable
numbers during the nineteenth century. According to Baines (1991), more than 15
million immigrants from Britain and Germany came to the US in the period from

117
1815-1930.186 As such, these two immigrant groups represent an excellent yardstick by
which to assess the relative performance of the Irish in the workplace at the end of the
nineteenth century.
Table 3.20 presents the results of a comparison of German and English immigrants to
the Irish and native born employing the occupational groupings used previously to
compare the Irish and native born. While the German and English immigrants in these
samples are not matched at the individual level, they have been selected using the same
criteria in terms of gender, age and workforce participation as my matched samples. In
addition, to further aid the comparison with my the matched samples, the German and
English immigrants in the 1900 sample also have the requirement of having been
present in the US on or prior to 1880. As Table 3.20 shows, both the Germans and the
English achieved better occupational outcomes relative to the native born than did the
Irish. Both the Germans and English had a higher proportion of white collar jobs than
did the Irish, coupled with a much lower proportion of workers classified as unskilled.
In fact, were it not for the high percentage of the native born who were engaged in
farming, both the English and German immigrants would have attained a higher
proportion of white collar jobs than the native born. In any event, the results are quite
similar to those of the native born, with both the German and English actually having a
lower proportion of workers in the unskilled category than did the native born in 1900.
From this evidence, it is apparent that the Irish underperformed not only the native
born in the workplace at the end of the nineteenth century, but also their fellow
immigrants.
186
Dudley Baines, Emigration from Europe, 1815-1930 (Cambridge: 1991), p. 3.

118
Table 3.20
Comparison of German, English and Native Sample Occupational Groupings
1880
Irish German English Native
% Cum. % Cum. % Cum. % Cum. High WC 7.2 7.2 11.1 11.1 7.7 7.7 7.7 7.7
Low WC 4.3 11.4 7.0 18.1 8.1 15.8 6.3 14.0 Farmer 11.9 23.3 13.6 31.7 14.2 30.0 37.5 51.4
Skilled 15.8 39.1 23.2 54.9 20.6 50.6 9.1 60.6 Semi-skilled 28.6 67.7 25.6 80.5 33.7 84.3 9.0 69.6 Unskilled 32.3 100.0 19.5 100.0 15.7 100.0 30.5 100.0
1900 Irish German English Native
% Cum. % Cum. % Cum. % Cum.
High WC 11.4 11.4 14.6 14.6 12.3 12.3 12.8 12.8 Low WC 6.8 18.3 6.3 20.9 9.0 21.3 7.3 20.1
Farmer 17.1 35.3 30.9 51.8 23.8 45.1 45.8 65.9 Skilled 18.7 54.0 20.5 72.3 22.9 68.0 12.5 78.4
Semi-skilled 20.3 74.3 14.6 86.9 20.9 88.9 8.4 86.8 Unskilled 25.7 100.0 13.1 100.0 11.1 100.0 13.2 100.0

119
In conclusion, it is evident from the results of the analysis in this chapter that Irish
immigrants did not assimilate quickly into American society in the period from 1880 to
1900. Relative to the native born, the Irish were more likely to live in urban areas, less
likely to marry or own a home, and more likely to suffer un- or under-employment.
They had higher rates of fertility as well as child mortality. And the majority of these
Irish immigrant males chose to marry an Irish born spouse, whereas the vast majority
of native born males in my sample had an American–born spouse. Standardising my
sample results to adjust for the impact of initial differences in key variables such as
age, rural status, home ownership and other variables did not affect these outcomes.
With respect to occupational mobility and income levels, the Irish again did not
achieve convergence with the native born. With respect to the debate in the literature,
my results would support the view of Borjas (1994), who argued that immigrant
groups during the era of mass migration did not achieve convergence in occupational
levels with native born white males.187 The Irish were much more likely to remain on
the lower rungs of the occupational ladder than were the native born, who were more
than twice as likely as the Irish to work in a white collar occupation. Using the Duncan
dissimilarity index confirmed that there was a substantial difference in the
occupational distributions of the Irish and native born samples, which narrowed only
slightly between 1880 and 1900. The native born mean income level in 1900
(excluding farm-related workers) was 17% higher than the equivalent Irish level, and
the native born had a higher rate of income growth over the period. An analysis of the
occupational mobility of the two samples showed that though both the Irish and the
native born experienced significant upward and downward mobility over the period,
187
Borjas (1994), pp. 571-572. In his analysis, it took as many as four generations for such convergence
to occur.

120
the Irish were far more likely to find themselves in semi- and un-skilled work in 1900,
whereas the native born were more likely to have a white collar job and were much
more likely to become a farmer. A transition matrix analysis confirmed that while
movements between the high white collar and low white collar categories were quite
similar for the two samples, there was a significant difference in the farmer category,
where the native born show a much higher probability of entering (or remaining in)
this occupational category than did the Irish. The Irish demonstrated a much higher
probability of moving into (or remaining in) semi- and un-skilled work, whereas the
native born had a much higher probability of exiting unskilled work. The transition
matrix analysis reinforced the conclusion that while there was a high degree of
occupational mobility for both the Irish and native born in the US economy at the end
of the nineteenth century, there remained clear differences between the occupational
experiences of these two groups.
To address the possible criticism that the newly arriving, predominantly urban
dwelling Irish should not be compared to the more rural and land owning native born
sample, I also segmented my sample data to compare the urban Irish to the urban
native born. Again, the results confirmed a lack of assimilation by the Irish and an
even more dramatic difference in occupational mobility and mean income levels. The
native born in this analysis were three times as likely to work in white collar
employment in 1900 as were the Irish and one-third as likely to be in an unskilled
occupation. Their income levels were 21% higher in 1900 as well.
I also compared the Irish farmers in my sample to the non-farming Irish, as well as to
the native born farmers. These results reflected major differences between the two

121
groups of Irish, and some interesting similarities between the Irish farmers and the
native born farmers. From this analysis, it is clear that the Irish who engaged in
farming assimilated more quickly in certain areas (such as home ownership, marital
status, child mortality and nationality of spouse), than they did in others (such as
marital fertility). It is also striking that while Irish farmers achieved a significant level
of assimilation relative to native born farmers, the urban Irish realised a much lower
degree of assimilation relative to the urban native born. These results confirm that the
assimilation process for Irish immigrants was not uniform, but in fact was a multi-
dimensional one, which varied depending on which subset of the Irish sample was
being reviewed, and which socio-economic variables were under consideration. They
would also appear to support the argument that an increased exposure to the native
born enhanced the assimilation of Irish immigrants relative to those who lived in urban
areas.
Segmenting the Irish sample into cohorts based on age, year of immigration, and age at
time of immigration also reinforced the conclusion that the assimilation process for the
Irish was a varied and multi-dimensional one. The younger Irish and those Irish who
immigrated to the US as children achieved the highest levels of occupational mobility,
income and income growth. They were also the most literate and the most likely to
marry an American born spouse. The older Irish and those Irish who were not recent
immigrants were less successful in obtaining white collar work, but were more likely
to own a home or to become a farmer. They had lower income levels and income
growth. Finally, those Irish who immigrated as adults had the weakest occupational
performance. They were more likely to work in an unskilled occupation and had the
lowest mean income level of any of the cohort groups.
122
In comparison to the broader American population (as measured by my melted
sample), the Irish again lagged in occupational mobility and income levels and they
did not achieve convergence across a range of socio-economic variables. They did
appear to assimilate more quickly in the areas of literacy, unemployment and home
ownership (though the older age of the Irish sample relative to the melted sample
would be an important contributing factor to the home ownership results). However,
the Irish trailed both the native born as well as the melted sample in occupational
mobility and income levels. In general, the melted sample fell squarely between the
Irish and native born samples in my assimilation and occupational mobility analyses.
Finally, it was also important to undertake a comparison of the occupational
performance of the Irish relative to the other principal immigrant groups in the late
nineteenth century. As we discovered, the Irish also lagged behind the performance of
both German and English immigrants during this time period. Both these groups had
higher levels of white collar occupations and lower levels of unskilled workers than
did the Irish, and they also more closely resembled the native born in terms of their
occupational mobility.
These last results raise an interesting question: given that the Irish had high literacy
levels and had the advantage of speaking English as a native language (unlike the
Germans, for example), why did they fail to achieve higher levels of assimilation and
occupational mobility during this time period? One potential explanation would be that
they were subject to discrimination. Several researchers have argued that there were
meaningful levels of discrimination against Irish immigrants in the workplace during
123
the nineteenth century.188 However, while this explanation may help to justify Irish
underperformance relative to native born Americans, it would not easily explain why
they also lagged other immigrant groups as well (in particular the Germans, for whom
English was not a native language). Another possible explanation may lie in the
differences between the Irish and American economies in this timeframe. Perhaps the
Irish lacked the appropriate human capital necessary to succeed in the increasingly
industrial and less agrarian American economy? As noted by Fitzpatrick (1985) and
Guinnane (1997), the Irish arrived in the US without many marketable skills, and their
occupational backgrounds were not well suited for the more industrialised US
economy.189 Despite their high levels of literacy and English language skills, perhaps
the Irish lacked other critical skills necessary to advance up the occupational ladder in
late nineteenth century America? In the literature, there is evidence that despite their
seemingly high literacy rates, the Irish lagged behind the other principal immigrant
groups in the US in terms of their level of education. Mitch (1992) found that the
school attendance and literacy rates of the mid-nineteenth century English lagged
behind that of Americans, Germans and Scandinavians.190 In a separate study,
Atkinson (1969) found that the Irish lagged behind inhabitants of England, Wales and
Scotland in areas such as primary school attendance, teacher pay and teacher
training.191 This research supports the view that the Irish were less well educated than
the other principal immigrant groups in the US in the late nineteenth century. It is also
interesting that the Irish cohorts which achieved the highest levels of occupational
mobility and income were those Irish who were young or had immigrated as children.
It is equally telling that the group which fared the poorest in the workplace were those
188
See McGouldrick and Tannen (1977), Hannon (1982a, 1982b). 189
Fitzpatrick (1985) pp. 8, 32; Guinnane (1997) p. 106. 190
David F. Mitch, The Rise of Popular Literacy in Victorian England (Philadelphia: 1992), p. 1. 191
Norman Atkinson, Irish Education (Dublin: 1969), pp. 101-2.
124
Irish who arrived in America as adults. These results support the view that developing
skills while living and working in the US may have aided the younger Irish versus
those who developed much of their human capital in the less developed and largely
pre-industrial Irish economy prior to immigrating.
It would appear from the results presented in this chapter that the flame burning under
the Irish melting pot in the last decades of the nineteenth century was not very hot.
Irish immigrants did not assimilate quickly relative to either the native born or the
broader American population, and they lagged noticeably in measures of occupational
mobility and income levels. The claims of Irish occupational parity at the turn of the
century made by Kenny (2006) and Doyle (1975) appear overly optimistic. Based on
this evidence, the Irish assimilation experience in the US would appear to be better
described as salad bowl, where different ingredients are added together but with each
retaining its distinctiveness. While certain subsets of the Irish immigrant population
examined in this chapter did exhibit greater levels of assimilation and occupational
mobility, Irish immigrants, in the aggregate, did not. In the chapters to follow, the
assimilation and occupational mobility of the Irish will be further examined, using both
a variety of measures, and by further segmenting the Irish immigrant population. In
these analyses, the question of whether the Irish assimilation experience more closely
resembles a melting pot or a salad bowl will be further assessed.

125
IV. Assimilation of Irish Immigrants as Measured by Ethnic Intermarriage
In this chapter, I will employ ethnic intermarriage (“Intermarriage”) as another
measure of assimilation for my sample of Irish immigrants living in the US in the late
nineteenth century. Intermarriage is an important indicator of assimilation for
immigrants and it has the attractive property of measuring assimilation in the home. As
marriage was viewed as a lasting, long term commitment in the nineteenth century, the
decision to marry someone from a different ethnic background can provide a strong
signal about an immigrant‟s willingness to adapt to a new ethnic and social
environment. It is also likely that the non-Irish spouses of the immigrants who chose to
intermarry contributed to the assimilation of their husbands.
In my research, I will first compare those Irish who married after arriving in the US
with the married native born in my matched samples. I will examine the relationship
between intermarriage and a host of socio-economic variables available in my sample
data to ascertain the characteristics of Irish immigrants who chose to marry a non-Irish
spouse. I will estimate a logistic regression to ascertain which characteristics of Irish
immigrants and their spouses are most strongly associated with the likelihood of an
Irish immigrant marrying a non-Irish spouse. I will also seek to examine the
relationship between intermarriage and the subsequent behaviour of Irish immigrants
as captured in the longitudinal data available in my sample. Throughout this chapter, I
will seek to identify both the consequences of intermarriage as well as potential causes,
using the US census data at my disposal. By isolating on those Irish immigrants who
were married in the US on or prior to 1880, I will be able to examine socio-economic
outcomes in 1900 that may permit me to reach conclusions about the consequences of
intermarriage. Similarly, I may be able to reach conclusions about certain causes of

126
intermarriage by isolating on the socio-economic characteristics of those Irish who
were not married in 1880 but were in 1900.
The principal questions I will seek to address in this chapter include: what were the
key characteristics of Irish immigrants who chose to intermarry and in which areas did
they differ significantly from those Irish in my sample who married an Irish born
spouse? Did the intermarried achieve greater occupational mobility than those Irish
who married an Irish born spouse and did they achieve greater assimilation relative to
the native born? What were the key differences in the characteristics of Irish born
spouses versus those spouses of Irish immigrants who were born elsewhere? One note
of caution is that there may be unobservable attributes of the individuals in my sample
that may also influence their socio-economic outcomes. As a result, it may not always
be possible to distinguish the direction of causation between intermarriage and these
outcomes. Given this caveat, in this chapter I will seek to reach careful conclusions
about which Irish immigrants intermarried as well as the potential consequences of
intermarriage on their assimilation into American society in the late nineteenth
century.
In this chapter, my contribution to the literature is twofold. First, I will undertake a
detailed study of intermarriage as a measure of assimilation using my sample data of
first generation Irish immigrants in late nineteenth century America. While several
scholars have examined the marital behaviour of Irish immigrants in the US in this
time period,192 none have focused specifically on the issue of intermarriage and its use
as a measure of assimilation. Secondly, I will make use of the longitudinal nature of
192
See Foley and Guinnane (1999), Landale and Tolnay (1993).
127
my matched sample data to explore the relationship between intermarriage and a series
of socio-economic variables. In particular, I will assess the relationship between those
Irish who were intermarried on or prior to 1880, and their subsequent occupational
mobility as captured in US census data in 1880 and 1900. I will also use this
longitudinal approach to analyse the relationship between intermarriage and other
socio-economic variables such as geographic location, employment status, home
ownership, and literacy. The matched sample approach will also allow me to explore
potential socio-economic causes of intermarriage for those Irish immigrants in my
sample who were not married in 1880 but became married prior to the 1900 US
census. This use of a matched sample to conduct a longitudinal study of potential
causes and consequences of intermarriage is also a contribution to the existing
literature on the assimilation of Irish immigrants in late nineteenth century America.
Intermarriage has been viewed by many historians, economists and sociologists as a
key indicator of assimilation. As noted by Schoen (1986), “intermarriage is the
ultimate sign of social acceptability.”193 What this author finds particularly interesting
about intermarriage is that it is a measure of assimilation which is based in the home.
Unlike occupational mobility, which measures assimilation in the workplace,
intermarriage provides a window into the home life of those we are seeking to
understand. The Irish immigrants who came to the US needed to find work in order to
try to build an economic future for themselves and their families in the US. They
needed to adapt to the US labour market and compete with the native born and other
immigrant groups in the workplace. But when they returned to their home after a day‟s
work, they did not need to continue to try to be like those around them in the
193
Schoen (1986), p. 49.
128
workplace. Subject to finding a suitable Irish-born woman in the area in which they
lived, they could choose to marry an Irish native and maintain an additional and more
intimate link to the country of their birth. To a much greater extent than in the
workplace, they had a choice in the decision of whom to marry. In addition, whereas
the choice of occupation was a decision that could be and often was changed based on
individual skill development, labour market conditions and other factors, marriage was
a long term commitment. It is this ability to choose, as well as the intimate and long
term nature of the commitment, which makes intermarriage such an interesting and
important area for the study of assimilation.
In the literature, Gordon (1964) has provided us with a firm foundation for the study of
assimilation into American society with his seven stage model of the assimilation
process. The first level, which is called acculturation or behavioural assimilation,
involves a change of cultural patterns to better reflect those of the host society. Gordon
(1964) sees the next level of assimilation as structural; the process by which the
foreign born are accepted into the institutions of the host country. These institutions
include among others, schools, clubs and work. The combination of these first two
stages paves the way for the widespread possibility of marital assimilation (or
intermarriage) as the third stage in the assimilation process.194 Chiswick and
Houseworth (2008) also view intermarriage as a key indicator of assimilation. For
them, assimilation is “the process by which the foreign born acquire the human capital
specific to the host country.”195 They also note, however, that there is a question of
causality as it relates to intermarriage and assimilation. It is not clear whether
intermarriage leads to greater assimilation in the host country of whether greater
194
Gordon (1964), p. 80. 195
Chiswick and Houseworth (2008), p. 3.
129
assimilation itself facilitates an increase in intermarriage.196 In this respect,
intermarriage may represent both a measure of, and as well as a contributing factor to,
assimilation. Alba and Goldin (1986) argue that given the intimate and enduring nature
of marriage, that intermarriage, more so than any other type of relationship, “tests
social boundaries and the willingness of insiders and outsiders to accept each other” in
a long-lasting relationship. They argue that intermarriage has “fundamental importance
as a measure of social distance and structural assimilation.”197
Sociologists have developed theories to address the issue of how people make
decisions regarding marriage, some of which are highly applicable to the concept of
intermarriage. Hollingshead (1950) was one of the first sociologists to assess the
influence of cultural factors on the decision to marry. In a study of marriages in the
city of New Haven, CT in the mid-twentieth century, he found that cultural factors
such as religion and ethnicity had a strong effect on marriage choices.198 His rather
straightforward approach to theory stated that marriage decisions were either
homogamous (where like attracts like) or heterogamous (where opposites attract). In
his results, he found strong evidence for the theory of homogamy.199 Blau et al. (1982)
studied intermarriage and developed two central theorems to explain when members of
different groups decide to intermarry. Using 1970 US census data, they found support
for the theorems that 1) a group‟s relative size is inversely related to the proportion of
its members who intermarry and 2) the heterogeneity of an area is directly related to
the rate of intermarriage in it.200 In their work, heterogeneity “depends on the number
196
Chiswick and Houseworth (2008), p. 4. 197
Alba and Goldin (1986), pp. 202-3. 198
Hollingshead (1950), p. 627. 199
Hollingshead (1950), p. 627. 200
Blau et al. (1982), p. 45.

130
of groups and the population‟s distribution among them”201 and effectively represents
the chance of two people from different groups being in the same area. The authors
argue that in the absence of any “in-group pressures” to marry someone from their own
group, that the relative size of different groups and the degree of heterogeneity in a
given area “would govern the extent of all social relations, including marriage,
between members of different groups.”202 Schoen (1986) also advances the theory that
intermarriage rates are influenced by the group composition of a given population. He
argues that when one group is small relative to another, that members of that group
“may face a restricted market for in-group marriage but an extensive one for out-group
marriage.” This small group is more likely to intermarry, ceteris paribus. Schoen
(1986) also argues that members of the larger group have less chance of intermarriage
“simply because there are relatively few members of the smaller group available.203 In
this chapter, we will look to apply the theories of Hollingshead (1950), Blau et al.
(1982) and Schoen (1986) to the results of my analysis of intermarriage among Irish
immigrants in the late nineteenth century.
As it is clear that intermarriage is an important measure of assimilation, one further
question to address is why it is interesting or useful to study the marriage patterns of
the Irish in the US in this timeframe? There are two primary reasons. First of all, there
are several unique demographic features of the Irish that merit our attention. As noted
by Foley and Guinnane (1999), „The Irish at the end of the nineteenth century were
famous for three demographic behaviours: they migrated in huge numbers, were
reluctant to marry, and had large families when they did marry.”204 They also found
201
Blau et al. (1982), p. 46. 202
Blau et al. (1982), p. 51. 203
Schoen (1986), P. 50. 204
Foley and Guinnane (1999), p. 15.
131
that relative to other immigrant groups in their study, the Irish were “unusually willing
to marry members of other ethnic groups.”205 Thus the Irish were not only the most
prolific of immigrant groups in the US in this timeframe, they also exhibited distinct
demographic behaviour. Secondly, the use of intermarriage as a means of studying
their assimilation has not been applied to the Irish in this time period.206 Studying the
role of intermarriage among Irish immigrants in the US in the late nineteenth century is
thus important not only as a means to understanding the assimilation of this important
immigrant group, but also to contribute to the broader historiography of Irish
demographic behaviour in this time period.
Before analysing the role of intermarriage in the assimilation of Irish immigrants in the
period from 1880 to 1900, I first compare those Irish who chose to marry to their
married native born counterparts. As we are interested in the assimilation of the Irish
relative to this group, it is important to conduct this initial comparison. Table 4.1
presents the summary statistics for those Irish immigrants and native born from my
matched samples who were married with their spouses present in the household at the
time of the census in 1900.207 Of the 937 Irish immigrants in my matched sample, 611
were married with spouse present in 1900.208 For the native born, 13,149 were
205
Foley and Guinnane (1999), p. 26. 206
Foley and Guinnane (1999) mention intermarriage in this article but are primarily focused on whether
the broader marital and fertility patterns of the Irish in Ireland survived in the US after emigration.
Pagnini and Morgan (1990) do include some findings for Irish immigrants in their study which uses
1910 US census data, but their results focus primarily on a comparison of intermarriage patterns of the
“old” Northwestern vs. the “new” Southeastern European immigrant groups. 207
In order for the NAPP and IPUMS databases to capture any data regarding the spouse, it was
necessary for the spouse to be present in the household at the time of the census. For the Irish sample,
there were 30 cases (3% of the Irish sample) of an individual being married but with the spouse not
present in the household. For the native born, the equivalent figure was 342 (2% of the native born
sample). These figures do not include individuals who were divorced or widowed, as there are separate
categories in the census for those marital statuses. 208
This figure includes only those Irish who married in the US, thus excluding those who were already
married upon their arrival in the US. The rationale for using this approach is to enable an examination of
those Irish who made their marriage decisions in the US, as opposed to those who arrived already
married.
132
similarly married from an original sample of 15,985. As Table 4.1 illustrates, the
married Irish and married native born have noticeable and statistically significant
differences in many socio-economic areas. With respect to age, the Irish sample is
older than the native born, and both the Irish immigrants and their spouses were
slightly older than their native born counterparts at the time of marriage. The gap in
age between husband and wife is quite similar, with the Irish men being approximately
5.1 years older than their brides, and the native born men being approximately 5.2
years older. In keeping with the results of our full samples presented in Chapter III, the
married Irish were much more likely to live in urban areas in both 1880 and 1900 than
were the married native born. In both cases, the native born were more than twice as
likely to live in a rural location as was an Irish immigrant. The Irish were also less
likely to own a home, though this difference was not substantial and is statistically
significant only at a 5% confidence interval. The native born, as well as their spouses,
were also more likely to be literate than were the Irish, though these differences were
slight and statistically significant only in the case of the spouses. The native born were
also more likely to be employed than were the Irish at the time of the 1900 US census,
though this result was also statistically significant only at a 10% confidence interval.
With respect to fertility and child mortality rates, the results are consistent with those
found in Chapter III. The native born who are married with their spouse present in
1900 have fewer children and a lower child mortality rate than do the Irish, and these
results are statistically significant. Perhaps the most dramatic difference between the
two samples is in the area of spouse birthplace. This variable, which we will use
extensively in this chapter as a measure of intermarriage, indicates a substantial
difference in the marriage choices of Irish immigrants‟ vis-à-vis the native born. As
can be seen in Table 4.1, a slight majority of Irish immigrants chose to marry an Irish
133
born spouse, with a sizeable minority marrying either an American born or non-Irish
foreign born spouse.209 For the native born, there is an overwhelming preference for a
native born spouse, with only 3.1% choosing to marry a foreign born woman. This
result probably reflects both a preference for native born to marry a spouse who was
also native to the US, as well as the fact the vast majority of available spouses living in
the US were native born in this time period.210 These results would also support the
marriage theories advanced by Schoen (1986) and Blau et al.(1982), who argue that
members of large groups are less likely to intermarry due to a relative lack of smaller
group potential spouses, whereas members of smaller groups are more likely to
intermarry. Hollingshead‟s (1950) theory of homogamy appears to apply to the native
born, but does not reflect the experience of Irish immigrants in this timeframe.
209
It should be noted that the vast majority (84%) of Irish immigrants in my sample who married a non -
Irish spouse chose to marry a native born woman. 210
88% of single, white females of similar ages to my sample living in the US were native born in 1880,
based on data drawn from the NAPP US census data for that year.

134
Table 4.1
Summary Statistics of Irish and Native Born Married (a)
Variable Irish Native Born Observations 611 13,149
Age
1880 31.6 years*** 28.1 years
1900 51.6*** 48.0
Age at Marriage (1900) 28.5 years*** 27.7 years
Rural Status
1880 42.9%*** 86.6%
1900 35.8%*** 75.9%
Home Ownership (1900) 57.1%** 61.8%
Literacy (1900)
Read and write English 93.8% 93.9%
Read or write only 1.0% 1.6%
Quarters Unemployed (1900)
Not unemployed 85.1%* 87.7%
1 Quarter 5.7% 5.1%
2 6.1% 5.3%
3-4 3.1% 1.9%
Spouse Fertility (1900)
Avg. Children Ever Born 6.2*** 5.3
Avg. Children Surviving 4.8*** 4.4
Implied Mortality Rate 22.6% 16.7%
Spouse Age (1900) 46.4 years*** 42.8 years
Spouse Age at Marriage (1900) 23.4 years*** 22.5 years
Spouse Birthplace (1900)
Ireland 52.4%*** 0.4%
Other Foreign Country 7.4% 2.7%
US 40.3% 96.9%
Spouse Literacy (1900)
Read and write English 90.7%** * 93.6%
Read or write only 3.1% 1.7%
Spouse in workforce (1900) 2.8% 2.2%
(a) Includes those individuals classified as “Married, spouse present” at the time of the 1900 US census.
***Differences between the individuals in the two samples are significant at the 1, 5 and 10% levels ,
respectively, using a t test for age and fertility variables, and the chi squared test of independence for the
remaining variables.

135
Table 4.2 presents the summary statistics for those Irish who married an Irish born
spouse (“Married Irish”) versus those who married either a native born spouse or a
spouse from a foreign country other than Ireland (“Intermarried”). I have also added
the figures for the married native born in order to facilitate comparison with these two
Irish immigrant groups. In the case of the two Irish groups, these samples are limited to
marriages which occurred after the husband had arrived in the US. I have chosen to
limit these samples to only those Irish immigrants who married in the US in order to
analyse the marriage decision as a measure of assimilation. If an Irish immigrant had
married before arriving in the US, he would not have realistically had the opportunity
to enter into an inter-ethnic marriage. With this restriction, I will be able to assess the
assimilation and occupational mobility of Irish immigrants based on the nationality of
their spouses.
In my research, there are striking and statistically significant differences between those
Irish who intermarried and those that married an Irish born spouse.211 With respect to
age, the married Irish are older than the intermarried Irish, yet chose to marry at a
younger age. The spouses of the married Irish are also older than their intermarried
peers, yet both of these groups were roughly the same age at marriage. In Figures 4.1
through 4.4, I present histogram distributions of the ages of both the married Irish and
the intermarried, along with those of their spouses. The distributions reflect the fact
that Irish born couples were more likely to be older than were the intermarried ones.
The Irish born distributions are skewed to the right (towards higher ages) whereas both
the intermarried distributions are skewed left towards lower ages. Returning to an
analysis of the results in Table 4.2, the married Irish were more likely to live in an
211
For the avoidance of doubt, the statistical tests in Table 4.2 highlight the significance of differences
solely between the two Irish groups – Married Irish and Intermarried. The native born column is
provided for comparative purposes only.

136
urban location than were their intermarried peers, with the gap between these two
groups increasing markedly between 1880 and 1900. The intermarried Irish
experienced only a modest decline in the percentage living in rural areas, whereas the
married Irish witnessed a 26% decline in the percentage living in rural areas between
1880 and 1900 (41.3% in 1880 falling to just 30.6% in 1900). Analysing the role of
rural occupations such as farming will be important to understanding this significant
difference between the two sets of Irish immigrants, and will be explored later in this
chapter. Notwithstanding their more urban location, the married Irish were actually
slightly more likely to own a home (though this advantage was not statistically
significant). The married Irish were noticeably less literate, as were their spouses,
where the gap in literacy versus the intermarried Irish spouses measured a full 14
percentage points. The married Irish were also more likely to have been un- or under
employed in 1900, again by a statistically significant margin. They had more children
than did their intermarried peers, and experienced higher rates of child mortality. This
higher rate of child mortality may have been influenced by the fact that they were more
urban than their intermarried peers.212 In summary, there were important and
statistically significant differences between the intermarried and the married Irish in
virtually every socio-economic variable under review with the exception of home
ownership. The intermarried were younger, more literate (both husband and spouse),
more likely to live in rural areas and more likely to be fully employed in 1900. They
also had less children and experienced lower levels of child mortality than did the
married Irish.
212
In my Irish sample, child mortality rates were 25% in urban areas versus 19% in rural areas,
measured using 1900 US census data.

137
Table 4.2
Summary Statistics of Married Irish, Intermarried and Native Born (a)
Variable Married Irish Intermarried Native
Born Observations 320 291 13,149
Age
1880 33.1 years*** 30.0 years 28.1 years
1900 53.0*** 50.0 48.0
Age at Marriage (1900) 27.5 years*** 29.6 years 27.7 years
Rural Status
1880 41.3%*** 44.7% 86.6%
1900 30.6%*** 41.6% 75.9%
Home Ownership (1900) 58.8% 55.3% 61.8%
Literacy (1900)
Read and write English 91.3%*** 96.6% 93.9%
Read or write only 1.6% 0.3% 1.6%
Quarters Unemployed (1900)
Not unemployed 80.9%*** 89.7% 87.7%
1 Quarter 7.2% 4.1% 5.1%
2 7.8% 4.1% 5.3%
3-4 4.1% 2.1% 1.9%
Spouse Fertility (1900)
Avg. Children Ever Born 6.6*** 5.7 5.3
Avg. Children Surviving 5.0** 4.6 4.4
Implied Mortality Rate 24.2% 19.3% 16.7%
Spouse Age (1900) 49.1 years*** 43.5 years 42.8 years
Spouse Age at Marriage (1900) 23.6 years 23.1 years 22.5 years
Spouse Birthplace (1900)
Ireland 100.0%*** 0.0% 0.4%
Other Foreign Country 0.0% 15.5% 2.7%
US 0.0% 84.5% 96.9%
Spouse Literacy (1900)
Read and write English 84.1%*** 97.9% 93.6%
Read or write only 5.0% 0.7% 1.7%
Spouse in workforce (1900) 3.4% 2.1% 2.2%
(a) Includes those individuals classified as “Married, spouse present” at the time of the 1900 US census.
***Differences between the individuals in the Married Irish and Intermarried samples are significant at
the 1, 5 and 10% levels, respectively, using a t test for age and fertility variables, and the chi squared test
of independence for the remaining variables . The Native Born sample results are provided for
comparison purposes only and are not included in the statistical testing.

138
05
10
15
Pe
rcen
t
30 40 50 60 70Age
Distribution of Married Irish Age in 1900
Figure 4.1
Skewness -.1647437
02
46
81
0
Pe
rcen
t
30 40 50 60 70Age
Distribution of Intermarried Age in 1900
Figure 4.2
Skewness .1534659

139
05
10
15
Pe
rcen
t
20 30 40 50 60 70Age of spouse
Distribution of Married Irish Spouse Age in 1900
Figure 4.3
Skewness -.0359496
05
10
15
Pe
rcen
t
20 30 40 50 60 70Age of spouse
Distribution of Intermarried Spouse Age in 1900
Figure 4.4
Skewness .4130734

140
One interesting feature of the intermarried which emerges from the prior analysis is
that they were both more rural than the married Irish and married at an older age. One
possible explanation for this combination of attributes is that they may have had less
access to Irish born spouses as a result of living in a rural location and hence spent
more time looking for a suitable spouse before finally deciding to marry a non-Irish
one. A review of US census data for 1880 reveals that 71% of single Irish females of a
similar age to those in my sample of Irish immigrants resided in urban areas, with only
29% living in rural areas. For an Irish immigrant living in a rural location, it may have
been more difficult to find a suitable Irish born spouse, hence contributing to the
noticeably higher percentage of intermarried living in rural locations and the fact that
they married at an older age than did the married Irish. These results would also
support the argument of Schoen (1986) that members of a smaller group are more
likely to encounter a “restricted market”213 for potential spouses from the same ethnic
group and are hence more likely to intermarry, if they marry at all. They would also
support the arguments of Blau et al (1982) that comparative group size does affect the
likelihood of intermarriage, with members of a relatively smaller group being more
likely to intermarry.
With respect to the question of which of the married Irish or intermarried groups more
closely resembled the married native born, Table 4.2 provides clear evidence. The
intermarried Irish much more closely resembled the married native born than did the
married Irish group. In the areas of rural status, literacy, spouse literacy,
unemployment status, fertility and child mortality, the intermarried results were closer
to those of the married native born than were those of the married Irish. In fact, the
213
Schoen (1986), p. 50.

141
intermarried actually had more impressive outcomes than did the married native born
in several areas, including unemployment status, literacy and spouse literacy. In other
words, the intermarried Irish actually had lower unemployment and higher literacy and
spouse literacy than did the married native born in 1900. The married Irish only more
closely resembled the married native born in home ownership. But even in this
instance, the difference in home ownership between the married Irish and the
intermarried was not statistically significant. In summary, there were clear and
statistically significant differences between the married Irish and intermarried groups
in virtually every socio-economic variable under review. And in virtually all of these
socio-economic variables, the intermarried more closely resembled the married native
born.
We can also use the results in Table 4.2 to make some assessments about the causes
and consequences of intermarriage.214 With respect to those Irish who married on or
before 1880, the 1900 outcomes in rural status, home ownership, employment status,
spouse fertility, child mortality and spouse workforce participation may all shed light
on the consequences of an Irish immigrant having intermarried. Using the results in
Table 4.2, we see that the intermarried in 1900 were more rural, had lower levels of
un- and under-employment, had lower levels of both spouse fertility and child
mortality, and had lower spouse workforce participation than did the married Irish.
Only in the area of home ownership do we find the married Irish with a more
favourable outcome. As mentioned previously, in all these areas with the exception of
home ownership, the intermarried more closely resemble the native born. It would
214
In an additional analysis not reported here, I separated my sample into those Irish immigrants who
were married on or before 1880 as well as into those who were single in 1880 but married prior to 1900,
in both cases comparing the married Irish to the intermarried. I then reviewed the results of these sub
samples versus those in Table 4.2 and found no differences in the direction of the comparative results.

142
appear from these results that the intermarried may have been more successful in
acquiring the human capital necessary to succeed in the US than were the married
Irish. As for potential causes of intermarriage, a review of the 1880 results for rural
status, as well as the results for literacy and spouse literacy215 may help to assess this
aspect of intermarriage. In Table 4.2, the results indicate that those Irish who
intermarried lived in more rural areas in 1880 and that both they and their spouses had
higher levels of literacy than did the married Irish. This relationship between living in
a rural location and higher levels of intermarriage would suggest that Irish immigrants
living in rural locations may have been more likely to intermarry as a result of the
reduced likelihood of finding a suitable Irish born bride. As I have mentioned, the vast
majority of Irish born single women resided in urban areas in this timeframe and the
availability of Irish born spouses in rural areas was thus more limited than it was in
urban areas. This result again confirms the theories of Schoen (1986) and Blau et al.
(1982), where members of a smaller group (in this case Irish immigrants living in rural
locations) are more likely to intermarry. With respect to literacy, an illiterate Irish
immigrant may have experienced greater difficulty in attracting a non-Irish spouse as
the data shows that a very high proportion of these women were literate in this
timeframe. As marriage involves two parties, it may have been the case that a literate
non-Irish spouse may have been less inclined to marry an illiterate Irish immigrant.
215
The US census did not ask questions regarding literacy in 1880.

143
This analysis of intermarriage will now seek to address the question of who among the
Irish immigrants living in the US in the late nineteenth century married a non-Irish
spouse. In Table 4.3, I present the results of a logistic regression analysis which
assesses the probability of an Irish immigrant marrying a non-Irish spouse. Using a
dependent variable which identifies whether or not the immigrant is intermarried, the
model has as its independent variables: age and spouse age, year of marriage, years
living in the US, rural status in 1880, literacy and spouse literacy. This logistic
regression analysis allows me to assess the relationship between these socio-economic
variables and the likelihood of an Irish immigrant marrying a non-Irish spouse. The
results of this analysis will illustrate which socio-economic characteristics are
positively and negatively associated with intermarriage among Irish immigrants in the
late 1800s, hence shedding further light on the potential causes of intermarriage.
The results in Table 4.3 indicate that spouse literacy is positively associated with
intermarriage and is also statistically significant at the 1% confidence level. Using the
marginal effects column (dy/dx), we can estimate the impact of a discrete change in an
independent categorical variable (in this case, spouse literacy) on the change in our
dependent variable (Irish immigrant intermarriage). In the case of spouse literacy, the
probability of an Irish immigrant being married to a non-Irish spouse is 36.6% higher
if that spouse is literate as opposed to illiterate. The data shows that if an Irish
immigrant married an illiterate spouse, that spouse was highly likely to have been born
in Ireland. Spouse age, year of marriage and the number of years living in the US are
also statistically significant at the 1% confidence level. In the case of spouse age, an
increase of one year in age is associated with a 1.7% lower probability of
intermarriage. This result is consistent with the results in Table 4.2 showing that
144
intermarried spouses were younger than their married Irish counterparts. An increase
of one year in the year of marriage is associated with a 1% higher probability of
intermarriage. Finally, an increase of one year in the number of years living in the US
is also associated with a higher probability of intermarriage; in this case it is 1.7%.
These last results would suggest that the process of marrying a non-Irish spouse took
longer to occur than a marriage to an Irish born woman. It may be the case that Irish
immigrants may not have been actively seeking to intermarry, but became increasingly
willing to do so the longer they lived in the US. In summary, the results of this logistic
regression would suggest that spouse literacy, years living in the US and a later year of
marriage are all positively associated with intermarriage, while the age of the spouse
had a negative association. Irish immigrants took longer to decide to intermarry than
did those who married an Irish born spouse. Those who did intermarry were more
likely to marry a younger and literate woman.

145
Table 4.3
Logistic Regression Estimates of Intermarriage for Irish Immigrants
Logistic regression Number of obs 611
LR chi2(10) 121.63
Prob > chi2 0.0000
Log likelihood = -362.0 Pseudo R2 0.1438
Coef z P>|z| dy/dx x Odds Ratio
age -0.013 -0.63 0.530 -0.003 51.56 0.987
spouse age -0.069 -3.65 0.000 -0.017 46.44 0.934
marriageyear
0.040 2.63 0.008 0.010 1876.92 1.041
yearsinUS 0.069 5.47 0.000 0.017 36.12 1.071
urban1880 -0.236 -1.29 0.196 -0.059 1.57 0.790
literacy -0.227 -0.50 0.614 -0.057 0.94 0.797
spouse literacy 1.844 3.78 0.000 0.366 0.91 6.319
constant -75.327 -2.57 0.010 - - -
146
While the logistic regression analysis illustrated which socioeconomic characteristics
were most strongly associated with intermarriage by Irish immigrants, it did not
address consequences of intermarriage such as occupational mobility. In Table 4.4, I
present results for the married Irish and intermarried samples grouped according to
occupational level. For this analysis, I have taken the additional step of limiting the
two samples only to those individuals who were already married in 1880. The purpose
of this adjustment is to allow me to look specifically at those Irish who had already
decided to marry prior to the 1880 US census. As a result, I am able to examine the
relationship between marriage choices and the subsequent occupational mobility of my
sample of Irish immigrants in the period between 1880 and 1900. In creating the
occupational groups, I use the same format as was developed in Chapter II. Again
following the approach of Thernstrom, I continue to make an exception for farmers,
who are separated into their own category to facilitate more detailed analysis of their
role in the results.
As Table 4.4 illustrates, those immigrants who married an Irish born spouse lag
slightly behind the intermarried in terms of white collar employment. If one were to
include farmers in the white collar category, this difference increases, with 46% of the
intermarried working in white collar employment in 1900 versus 36% for the married
Irish sample. In addition, the intermarried are also more successful in exiting the semi-
and unskilled occupational groups between 1880 and 1900. Approximately one-third
of the intermarried remain in the two lowest occupational groups in 1900 versus 45%
of the married Irish sample. In the unskilled category, the decline in the intermarried
sample is more than twice the decline in the married Irish sample between 1880 and

147
1900. These results clearly demonstrate that intermarriage is associated with higher
levels of occupational mobility for Irish immigrants in the late nineteenth century.

148
Table 4.4
Married Irish and Intermarried Occupational Groupings 1880-1900
1880 Married Irish No. % Cum % High WC 17 7.3% 7.3%
Low WC 4 1.7% 9.0%
Farmer 34 14.5% 23.5%
Skilled 43 18.4% 41.9%
Semi-skilled 61 26.1% 68.0%
Unskilled 75 32.1% 100.0%
Total 234 100.00%
1900 Married Irish No. % Cum % % Change from 1880
High WC 26 11.1% 11.1% 53%
Low WC 16 6.8% 18.0% 300%
Farmer 41 17.5% 35.5% 21%
Skilled 45 19.2% 54.7% 5%
Semi-skilled 49 20.9% 75.6% -20%
Unskilled 57 24.4% 100.0% -24%
Total 234
1880 Intermarried No. % Cum % High WC 11 7.3% 7.3%
Low WC 5 3.3% 10.7%
Farmer 27 18.0% 28.7%
Skilled 26 17.3% 46.0%
Semi-skilled 38 25.3% 71.3%
Unskilled 43 28.7% 100.0%
Total 150
1900 Intermarried No. % Cum % % Change from 1880 High WC 17 11.3% 11.3% 55%
Low WC 12 8.0% 19.3% 140%
Farmer 41 27.3% 46.7% 52%
Skilled 32 21.3% 68.0% 23%
Semi-skilled 27 18.0% 86.0% -29%
Unskilled 21 14.0% 100.0% -51%
Total 150

149
In addition to analysing the occupational groupings of the married Irish and
intermarried samples in 1880 and 1900, I also calculated the Duncan dissimilarity
index (DDI) to compare the occupational distributions of these two samples to each
other, as well as to those of the native born sample. This DDI comparison allows me
both to assess whether the intermarried and married Irish occupational distributions
became more similar in the period between 1880 and 1900, and also to determine
which of the two sample distributions more closely resembles that of the native born in
this time period. As first described in Chapter III, the DDI is an index which compares
the similarities and differences between two distributions. The index takes a value
between zero and one, with one reflecting no overlap between distributions and zero
representing identical distributions. The index may be interpreted as the proportion of
subjects in a group that would have to change category in order to obtain the same
relative distribution as the group to which it is being compared. Using the specific
occupational code for each individual in my sample, I calculated the index for both
1880 and 1900.
For the comparison of the intermarried and married Irish groups, the results confirm a
widening in the difference between the occupational distributions for these two groups.
As Table 4.5 illustrates, the DDI calculations for these groups result in a value of .224
in 1880 rising to .299 in 1900. This increase of .075 in the DDI calculation implies that
the intermarried and married Irish have increasingly different occupational outcomes
between 1880 and 1900. Table 4.5 also shows the corresponding results for those
married Irish and intermarried individuals who were already married in 1880. For this
subset, the differences in occupational outcomes increase further. In 1880, the DDI
calculation is .238, rising to .367 in 1900. This result implies that more one out of three
150
workers in the intermarried group (who were already married in 1880) would be
required to change occupation in order for that group to have a similar occupational
profile to the corresponding married Irish group. What these results indicate is that the
intermarried and married Irish groups became less similar in their choice of
occupations between 1880 and 1900, and that this result was only accentuated when
the samples were limited to individuals who had made their marriage decision prior to
1880. These results, particularly those for the Irish who married on or before 1880,
would indicate that intermarriage had a meaningful influence on the subsequent
occupational mobility of Irish immigrants.
Given that the intermarried and married Irish groups had such differing occupational
distributions; one important question to be addressed is which group more closely
resembled the married native born. In an additional analysis using the DDI calculation,
I compared the married native born occupational distributions in 1880 and 1900 to
those of both the intermarried and married Irish subsets. As Table 4.6 illustrates, the
married Irish had a significantly higher DDI score than did the intermarried when
measured against the married native born. In 1880, the married Irish had a DDI score
relative to the married native born of .527, which declined to .517 in 1900 (a 2%
decline). The intermarried, on the other hand, had a DDI score relative to the married
native born of .474 in 1880, but this figure declined by 15% to .404 in 1900. Although
the gap between either of the Irish married groups and the married native born is
significant, the intermarried demonstrated a much greater level of assimilation in the
workforce than did the married Irish group. The intermarried DDI figure in 1900 is
22% lower than the corresponding figure for the married Irish. And although the
intermarried DDI figure implies that approximately four out of ten workers would need

151
to change their occupation for the intermarried distribution to exactly resemble the
married native born distribution; this result still reflects a much greater degree of
occupational assimilation relative to the married native born than does that for the
married Irish.
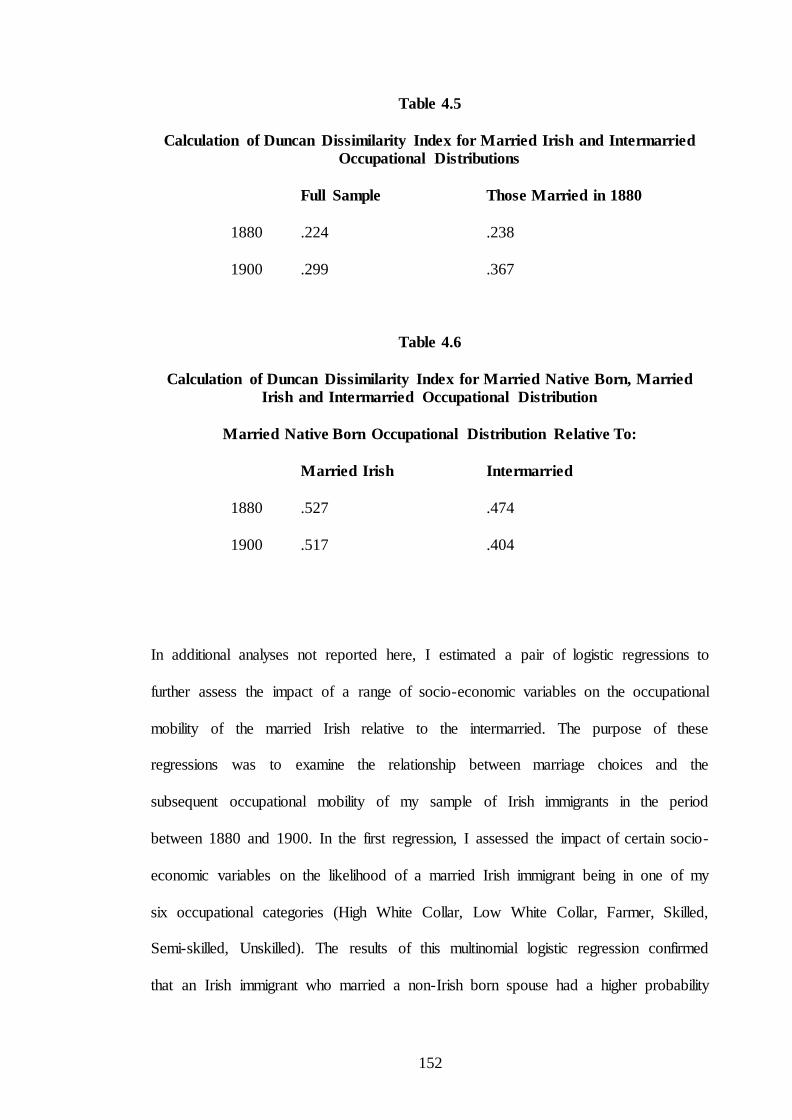
152
Table 4.5
Calculation of Duncan Dissimilarity Index for Married Irish and Intermarried
Occupational Distributions
Full Sample Those Married in 1880
1880 .224 .238
1900 .299 .367
Table 4.6
Calculation of Duncan Dissimilarity Index for Married Native Born, Married
Irish and Intermarried Occupational Distribution
Married Native Born Occupational Distribution Relative To:
Married Irish Intermarried
1880 .527 .474
1900 .517 .404
In additional analyses not reported here, I estimated a pair of logistic regressions to
further assess the impact of a range of socio-economic variables on the occupational
mobility of the married Irish relative to the intermarried. The purpose of these
regressions was to examine the relationship between marriage choices and the
subsequent occupational mobility of my sample of Irish immigrants in the period
between 1880 and 1900. In the first regression, I assessed the impact of certain socio-
economic variables on the likelihood of a married Irish immigrant being in one of my
six occupational categories (High White Collar, Low White Collar, Farmer, Skilled,
Semi-skilled, Unskilled). The results of this multinomial logistic regression confirmed
that an Irish immigrant who married a non-Irish born spouse had a higher probability
153
of working in white collar employment or in farming in 1900 than did an Irish
immigrant who married an Irish born spouse. In the second regression, I estimated a
logistic regression on the upward occupational mobility of my sample of Irish
immigrants. In this analysis, upward mobility was classified as the movement of an
Irish immigrant worker into a higher occupational category between 1880 and 1900. In
this regression, the results were inconclusive.
In one final analysis of the occupational trends of the intermarried and married Irish
groups, I have reviewed the individual level occupations of both groups to look for
important patterns in the data. As was discussed earlier in this chapter, the intermarried
Irish were more likely to live in rural areas than were the married Irish. I also found
that the intermarried were also more likely to be engaged in farming. In reviewing the
occupational choices of both these groups, it is clear that the intermarried have a much
greater involvement with farming than do the married Irish. In 1900, 61 out of the 291
intermarried individuals in my sample (21.0%) were engaged in farming. This
represents the single largest occupation among the intermarried in my sample. As for
the married Irish, farming represented just 14.7% of their sample, with 47 out of a total
sample size of 320 individuals being classified as farmers in the 1900 US census. In
the case of the married Irish, their largest occupation in 1900 was that of an unskilled
urban labourer. In this category, the married Irish significantly outnumbered the
intermarried. In 1900, 62 married Irish immigrants were engaged in unskilled urban
work, representing 19.4% of the total sample. For the intermarried, this figure was just
23 urban labourers equalling 7.9% of that sample. The married Irish had more than
twice as many unskilled urban workers on a percentage basis in 1900 as did the
intermarried. These two results shed light on the question of why the intermarried were

154
more rural than were the married Irish. The intermarried had adopted farming as a
livelihood to a much greater extent than did those Irish immigrants who married an
Irish born spouse, whereas the married Irish had greater difficulty emerging from the
lowest rung on the occupational ladder – that of the unskilled urban worker. And, as
we learned in Chapter III, farming was also far and away the leading occupation of
native born Americans. As such, the fact that farming was also the largest occupational
choice of the intermarried only further supports the argument that the intermarried
were more assimilated in the workforce than were the those Irish immigrants who
married an Irish born spouse.
Extending this comparison to other occupational categories, the intermarried had a
higher percentage of managers (which contributed to their advantage over the married
Irish in the high white collar category). They were also disproportionately well
represented among semi-skilled operatives, as well as in the certain skilled occupations
such as stationary sales and moulding work. As for the married Irish, they were
comparatively well represented as blacksmiths, brick masons, shoe makers, policemen
and longshoremen; all occupations falling in the semi-skilled and skilled
classifications. In summary, the propensity of the intermarried to become farmers and
managers, and for the married Irish to frequently find themselves in unskilled urban
work, contributed significantly to the differing occupational outcomes of these two
groups in 1900. These specific occupational results also support the conclusions
reached in the DDI comparison in Table 4.6, where the intermarried were more
successful in assimilating in the workplace in the late 1800s than were those Irish
immigrants who married an Irish born spouse.

155
The last issue to be addressed in this chapter is that of the rural status of the married
Irish and intermarried. As we have noted, the intermarried were far more likely to
reside in rural areas than were the married Irish. And in this respect, they more closely
resembled the native born who were also predominantly rural dwellers. We have also
previously noted that the US as a whole was becoming a more urbanised society in this
time period. But were there material differences in the propensity for the married Irish
or the intermarried to migrate from rural to urban locations between 1880 and 1900?
And what do these differences imply for their assimilation into American society in
this time period? In an analysis of the rural-urban and urban-rural migration patterns of
Irish immigrants between 1880 and 1900, 60% of the married Irish who lived in an
urban area in 1900 were found to have moved from a rural one in 1880, while just 24%
of those living in rural areas in 1900 had moved from an urban location in 1880. For
the intermarried, 42% of those who lived in an urban area in 1900 had moved from a
rural one in 1880, and 29% of those living in rural areas had moved from an urban
location in 1880.216 There are two principal conclusions to draw from these figures.
First of all, the married Irish were more likely to migrate from rural to urban areas
between 1880 and 1900 than were the intermarried. Secondly, far more of those Irish
immigrants who did migrate were leaving rural areas and heading to urban ones. These
two results would support the argument that even in a country which was becoming
more urban; one further consequence of marrying a non-Irish spouse was an increased
propensity for the intermarried to remain in rural areas.217
216
These results are for all married Irish and intermarried regardless of year of marriage. A separate
analysis not reported here shows that when the two groups are limited to those who had married on or
prior to 1880, the results are approximately the same. 217
A review of those Irish immigrants engaged in farming also confirms this conclusion. 46% of those
intermarried who were farmers in 1900 had also been engaged in farming in 1880, versus just 32% for
the married Irish.

156
Mincer (1978) analysed the role of the family on migration decisions and developed a
highly useful framework through which to assess such decisions. He argued that
families decided whether to migrate based on the net family gain (not just that of the
head of household).218 He also argued that family ties often deterred migration. In his
framework, spouses were “tied” to the mover (or stayer in the event that migration did
not occur).219 In this section, we have seen how the married Irish were much more
likely to move from rural to urban areas, or to remain in urban areas, than were the
intermarried. In Mincer‟s (1978) framework, this outcome would imply that living in
an urban setting was more beneficial to the net family position for the married Irish
than living in a rural one. Two possible reasons for this outcome could potentially be
the ability of both Irish immigrant spouses to more quickly find gainful employment in
urban areas,220 as well as the non-economic benefits of the greater support networks
that existed there (which might be particularly appealing to a “tied mover” spouse). By
contrast, the intermarried were more likely to remain in rural areas and were relatively
less likely to move to urban areas. A likely reason for this result was the greater
tendency of the intermarried to engage in farming, an occupation from which they
were much less likely to leave. In addition, native born spouses of Irish immigrants
might have also had stronger ties to farming communities, as this was the leading
occupation of the native born in this period.
In conclusion, this chapter has sought to use ethnic intermarriage as a measure of
assimilation for Irish immigrants in the late nineteenth century. It has examined the
218
Jacob Mincer, “Family Migration Decisions ,” The Journal of Political Economy, Vol. 86, No. 5
(Oct., 1978), p. 750. 219
Mincer (1978), p. 751. 220
Although the reported labour force participation of women, including Irish immigrant spouses, was
quite low in this time period, researchers have questioned the accuracy of these US census figures. See
Sobek and Dillon (1995), p. 73. In addition, Irish immigrant spouses may have been able to find part
time work more easily in urban areas.
157
characteristics of those Irish immigrants who married a non-Irish spouse, as well as
how these characteristics differed from those of the married Irish. It has addressed the
question of whether the intermarried became more assimilated vis-à-vis the married
native born, and whether they achieved greater occupational mobility in the workplace
than did the married Irish. It has also examined which characteristics of the
intermarried Irish and their spouses were most strongly associated with intermarriage,
and has assessed both causes and consequences of intermarriage for Irish immigrants
in this time period.
With respect to the comparison of the married Irish and intermarried, there were
important and statistically significant differences in virtually every socio-economic
variable under review. The intermarried were younger, more literate (both husband and
wife), more likely to live in rural areas and more likely to be fully employed in 1900.
They also had fewer children and experienced lower levels of child mortality than did
the married Irish. Compared to the married native born, the intermarried Irish achieved
a much greater degree of assimilation than did the married Irish. In the areas of rural
status, literacy, spouse literacy, unemployment status, fertility and child mortality, the
intermarried results reflected greater levels of assimilation than did those of the
married Irish. In certain areas, including unemployment status, literacy and spouse
literacy, the intermarried actually recorded stronger results than did the married native
born. Only in home ownership did the married Irish more closely resemble the married
native born, but this result was not statistically significant. These results provide clear
support for the argument that the intermarried Irish achieved greater levels of
assimilation vis-à-vis the married native born than did the married Irish.

158
Using logistic regression, I assessed which of a range of socio-economic
characteristics were associated with the probability of an Irish immigrant marrying a
non-Irish spouse. The goal of this analysis was to examine potential causes of
intermarriage and to answer the question of what type of person was likely to enter into
an ethnic intermarriage. The logistic regression found that intermarriage by Irish
immigrants at the end of the 19th century was positively associated with the literacy of
the spouse, as well as with the number of years living in the US and a later year of
marriage. These results support the argument that Irish immigrants took longer to
decide to intermarry than did those who married an Irish born spouse, and when they
did marry; their spouse was more likely to be younger and literate. These results would
suggest that among the causes of intermarriage for Irish immigrants in the late
nineteenth century was residing in a rural area where the supply of potential Irish born
spouses was more limited, resulting in a longer search for a spouse. These results also
lend support to the theories of Schoen (1986) and Blau et al. (1982), who argue that
relatively smaller groups in a given population are more likely to intermarry due to a
more restricted marriage market for spouses from their own group.
In order to analyse the relationship between intermarriage and the occupational
mobility of the Irish in the US labour market, and also to begin to assess the
consequences of intermarriage, I grouped the married Irish and intermarried samples
according to occupational level. I also limited the samples to those individuals who
were already married in 1880, allowing me to examine the relationship between
marriage choices and the subsequent occupational mobility of my sample of Irish
immigrants. The results of this analysis showed that immigrants who married an Irish
born spouse lagged slightly behind the intermarried in terms of white collar

159
employment, but with this differential increasing materially when farmers are included
in the white collar category. The analysis also confirmed that the intermarried were
more successful in exiting the semi- and unskilled occupational groups between 1880
and 1900 than were the married Irish.
DDI calculations confirmed a widening in the difference between the occupational
distributions of the intermarried and married Irish groups between 1880 and 1900. A
larger difference existed when the two samples were restricted to those individuals
who had made their marriage decision prior to 1880. These results reinforce the
argument that those Irish who entered into an inter-ethnic marriage had increasingly
different occupational outcomes than those who married an Irish born spouse. The DDI
calculation was also performed for each of the two Irish groups relative to the married
native born to assess which of the two groups more closely resembled the married
native born in the workplace. In this case, the intermarried again demonstrated a much
greater level of assimilation in the workforce than did the married Irish group.
I also examined the individual level occupational data in my samples to identify
important patterns relating to intermarriage. This analysis highlighted the greater
propensity of the intermarried to become farmers and managers, and for the married
Irish to more frequently find themselves in unskilled urban work. Taken together with
the results of the DDI comparison, this analysis further confirmed that the intermarried
were more successful in assimilating in the workplace in the late 1800s than were
those Irish immigrants who married an Irish born spouse.
160
In one final analysis, I examined the migration patterns of the married Irish and
intermarried between rural and urban areas in the period from 1880 to 1900. The
results showed that the married Irish were more likely to migrate from rural to urban
areas than were the intermarried. In addition, net migration for both these groups was
from rural areas to the cities. These results led to the conclusion that marrying a non-
Irish spouse was associated with an increased propensity for the intermarried to remain
in rural areas, notwithstanding the increasing levels of urbanisation in the US in this
time period.
Taken as a whole, these results indicate that greater levels of assimilation across a
range of socio-economic characteristics, coupled with a higher level of occupational
mobility, and a greater degree of assimilation with the native born in the workplace,
were the likely consequences of intermarriage for Irish immigrants in the late
nineteenth century. These results also support the argument that a further consequence
of intermarriage was the increased propensity for Irish immigrants who married non-
Irish spouses to remain in rural areas and not migrate to the cities.
Returning to the questions posed at the beginning of this chapter, it is clear that the
Irish immigrants in my sample who intermarried were noticeably different from those
who married an Irish-born spouse, and that these differences were virtually always
statistically significant. In addition, their spouses also had marked and statistically
significant differences in most of the categories for which we have data: age, literacy,
fertility and child mortality. The evidence clearly supports the argument that the
intermarried adapted more quickly to life in America. They much more closely
resembled the native born across a range of socio-economic characteristics and

161
achieved greater occupational mobility in the workforce than did the married Irish.
Their spouses also more closely resembled the native born spouses than did those of
the married Irish. While the question of causality remains, it is clear that one of the
effects of intermarriage was for Irish immigrants to achieve better labour market
outcomes, as well as to be more likely to work in fields popular with the native born
such as farming. One could conclude from the analysis presented in this chapter that it
was the influence of the non-Irish spouses which led their husbands to assimilate more
effectively in this time period. However, one cannot dismiss the possibility that the
Irish who chose to intermarry were somehow more open to adapting to their new
environment, including in the choice of their spouse, and that it was in fact certain pre-
existing unobservable attributes of these immigrants which led them to assimilate more
rapidly. Notwithstanding this question of causality, it is clear that there is a strong
positive relationship between the intermarriage of Irish immigrants and their
comparatively greater levels of assimilation and occupational mobility in late
nineteenth century America.

162
V. The Impact of Geographic Clustering on the Assimilation of Irish Immigrants
In this chapter, I will assess the impact of geographic clustering on the degree of
assimilation achieved by Irish immigrants in the US in the late nineteenth century. By
geographic clustering, I refer to the decision by an Irish immigrant to live in an area
which contained a relatively large percentage of Irish immigrants. In the literature on
immigrant assimilation, there exists a debate as to whether geographic clustering
accelerates or delays the assimilation of immigrants into their new society, and
whether such clustering can enhance the occupational mobility of immigrant groups.
Economists and sociologists such as Chiswick (2002), Borjas (1999) and Light and
Isralowitz (1996) have argued that geographic clustering delays immigrant
assimilation. Borjas (1999) found that this was particularly true in cases where the
human capital of an ethnic group is lower than that of the host society.221 However,
there is a literature on late nineteenth century Irish immigrants which argues that the
networking opportunities and support systems which had developed in cities with large
concentrations of Irish immigrants aided these immigrants in finding work and
successfully settling into American life. McCaffrey (1996) argues that the Irish in
particular were able to make advances in local government, trade unions and the
Catholic Church, and that “employment connected to politics” in particular “provided
a base of confidence that eventually launched the Irish into the middle class.”222
McKivigan and Robertson (1996) argue that the Irish in New York City used their
political connections to entrench themselves “in city government jobs for policemen,
firefighters, rapid transit workers and school teachers.” They also argue that by 1900,
significant numbers of the city‟s Irish had moved up into the ranks of professionals and
221
Borjas (1999), p. 56. 222
McCaffrey (1996), p.222.

163
entrepreneurs.”223 Chiswick (2002) also finds that “immigrant/ethnic concentrations
provide information networks that can be very valuable in … employment
activities.”224 Sociologists such as Portes and Rumbaut (1996) and Gordon (1964) have
argued that ethnic enclaves provided significant advantages for new immigrants and
immigrant entrepreneurs, and allowed politics to become „an avenue of individual
upward mobility when other paths remain blocked.‟225 In a recent analysis, Cutler et al.
(2008) found that the impact of geographic clustering may be more nuanced, with
positive educational and labor market outcomes for some immigrant groups, but
negative ones for immigrant groups with comparatively low levels of education.226 In
this chapter, I will use my sample data on Irish immigrants to assess the impact of
geographic clustering on the assimilation and occupational mobility of Irish
immigrants in late nineteenth century America.
With respect to the potential impact of geographic clustering on immigrant
assimilation, I will seek to address the following questions. To what extent did
geographic clustering exist for the Irish in late nineteenth century America? How did
the clustering of the Irish in the US compare to the experience of other prominent
immigrant groups in this timeframe? What were the occupational and socio-economic
characteristics of the Irish who lived in more “Irish” areas? Did geographic clustering
lead to a greater degree of assimilation as measured by the socio-economic variables
available in the US census data? Did it assist Irish immigrants in achieving greater
occupational mobility? Were the more geographically clustered Irish
disproportionately represented in certain occupations? With regard to the potential
223
McKivigan and Robertson (1996), p. 312. 224
Barry R. Chiswick, “Do Enclaves Matter in Immigrant Adjustment?”, Discussion Paper No. 449, The
Institute for the Study of Labor (2002), p. 4. 225
Portes and Rumbaut (1996), p. 54. 226
Cutler et al. (2008), p. 772.
164
benefits of clustering described in the literature such as enhanced support networks and
preferred access to trade union or public sector job opportunities, is there evidence in
my sample data to support these assertions? Is it possible to assess the influence of
previous generations of Irish immigrants on the geographic settlement patterns of these
late nineteenth century immigrants?
My unit of measurement for this analysis will be the county, the primary legal division
of states in America and often the most local level of state government. Counties are
also the smallest unit of measurement for which it is possible to obtain complete US
census information on the number of Irish immigrants relative to the total population in
the late nineteenth and early twentieth centuries.227 In undertaking this analysis, I
believe it is important to consider the impact of geographic clustering at the smallest
possible unit of measurement in order to most accurately assess its impact on the
assimilation of Irish immigrants. Using the state as the unit of measurement would
have simplified the analysis, but it would have raised issues in terms of the robustness
of the results. Many states in the US are quite large in size, and whether Irish
immigrants were more clustered or more evenly distributed within a state could have
significantly influenced the results of my geographic clustering analysis.
In this chapter, I have used the county level US census data available from the
University of Virginia Historical Census Browser to create a database which illustrates
the percentage of Irish immigrants living in each county in the US in 1900. The
University of Virginia census data is based on a complete sample of the relevant
censuses, and thus provides a robust basis for examining the issue of geographic
227
Obtaining 100% of the census sample information is crucial, as a partial sample would not be
sufficiently robust for measuring the percentage of Irish immigrants in any given location.

165
clustering in late nineteenth century America. Using this data, I have constructed a
measure of geographic clustering of Irish immigrants at the county level in 1900.
Separately, I have also created a new sample of Irish immigrants who came to the US
prior to 1900 using the IPUMS 2.5% US census sample for 1900. This sample is
comprised of 26,722 male immigrants between the ages of 25 and 65 years old, who
were in the workforce in 1900. In addition to capturing the broad range of socio-
economic variables used elsewhere in this thesis, I have also included their state and
county of residence in 1900. I have created this new sample so as to have the largest
possible sample of Irish immigrants with which to assess the impact of geographic
clustering at the county level. My matched sample of roughly one thousand Irish
immigrants that is used extensively in other chapters of this thesis is too small in size
for this purpose. This new sample, when cross referenced with the complete county
level data available from the University of Virginia Historical Census Browser, allows
me to examine in a more robust manner the effect of geographic clustering on the
assimilation of Irish immigrants in the late nineteenth century.
To assess the influence of previous generations of Irish immigrants on the geographic
settlement patterns of the Irish immigrants living in America in 1900, I again accessed
the University of Virginia Historical Census Browser to determine the percentage of
Irish immigrants living in each county in the US in each decade from 1870 until
1900.228 I then analyse this data to determine if there are patterns in the settlement
choices of Irish immigrants during these earlier decades that may have influenced the
settlement patterns of the Irish immigrants living in America in 1900.
228
I would have preferred to have had historical data for periods prior to 1870, but complete county
level data is only available from 1870 onwards.

166
My primary contribution to the literature in this chapter is that no researcher has
examined the impact of geographic clustering on the assimilation of Irish immigrants
in the nineteenth century. In addition, my ability to examine the relationship between
the level of geographic clustering and occupational outcomes of Irish immigrants in
this timeframe is also a contribution. I would hope that my work will also contribute to
the debate that currently exists in the literature as to what extent such ethnic clustering
hinders or accelerates the assimilation of immigrants in the US, and may also provide
useful information for academics and policy makers who are involved with the
contentious issue of immigrant assimilation in contemporary American society.
The first question that I will seek to address in this chapter is to what extent geographic
clustering existed for the Irish in late nineteenth century America. Using data from the
University of Virginia Historical Census Browser, I have created a map of the US
which illustrates the percentage of Irish born residents relative to the total population
of each county in the US in 1900. The map in Figure 5.1 shows each county based on
its percentage of Irish immigrants to the total population, and groups the counties into
five categories based on this percentage (0-2.5%, 2.5-5%, 5-10%, more than 10%, and
counties for which there were no data available). As can be seen from Figure 5.1, there
was a significant concentration of Irish immigrants in the Northeastern section of the
US in 1900. In and around of the cities of Boston, Providence, New York and
Philadelphia were found the highest percentages of Irish immigrants. Regional cities in
the Northeast such as Springfield, Massachusetts, Hartford, Connecticut (the capital of
the state of Connecticut) and Albany, New York (the capital of the state of New York)
also exhibited relatively high percentages of Irish immigrants in their populations. The
Chicago metropolitan area had a lower but still prominent percentage of Irish

167
immigrants relative to its total population. What is also noticeable from this map is that
there were small pockets where a relatively high percentage of Irish immigrants lived
in a number of Western counties. In Table 5.1, I list the 25 counties in the US in 1900
that had the highest percentage of Irish immigrants relative to their total populations.
So what conclusions can we draw from this initial review of the data on the percentage
of Irish immigrants living in each county in the US as a percentage of the total
population of that county? First of all, there is clear evidence of geographic clustering
of Irish immigrants in this timeframe. The Irish were not evenly spread across the
country, but tended to live in certain regions where they constituted a much higher
percentage of the overall population. In many sections of the US, the percentage of
Irish immigrants was extremely low. For example, in the underlying data there are
actually 2,172 counties in the US where the Irish constituted less than 1% of the total
population.229 There were 379 counties where the Irish constituted less than .01% of
the total population. With the exception of one county in rural Pennsylvania, all of
these 379 counties were located in the Southern and Western regions of the US. What
is quite clear from the evidence is that the Irish tended to cluster in or near the major
cities of the Northeast. As can be seen in Table 5.1, most of the highest clustered
counties were in the Northeast. In fact, 22 of the 25 counties with the highest
percentage of Irish immigrants in 1900 were located in Northeastern states. Several of
the main cities in this region, in particular Boston, New York and Philadelphia, were
also the leading ports of entry for immigrants coming from Europe to the US in this
timeframe. So it would appear that Irish immigrants often settled in locations that were
near to where they may have first entered the US. In addition, these cities were also the
229
To put this number in perspective, there were only 2771 counties listed in the University of Virginia
Historical Census Browser for 1900.

168
largest in the US in this time period and thus would have been a logical place for
immigrants to seek employment. Finally, it is also striking that some Irish immigrants
were willing to travel clear across the vast heartland of the US to find work in frontier
areas in the West. In counties such as Storey, Nevada, and Silver Bow and Deer Lodge
in the state of Montana, mining jobs drew Irish immigrants to live and work in these
remote, sparsely populated areas of the US. Many also worked in the railroad and
farming industries in Western states such as California, Nevada and Montana.
From this evidence, it would appear that Irish immigrants in the US in the late
nineteenth century were drawn to areas close to where they may have entered the US
and close to the major population centres of the Northeast where jobs were most likely
to be available. Certain of them were also willing to move long distances to work in
mining, railroad and farming jobs in the West. They were not evenly distributed across
the US, but were highly clustered in the Northeast. By number they were most likely to
live in the New York City and Boston metropolitan areas. In the next section, I will
examine to what extent their choice of residence may have been influenced by the
choices made by prior generations of Irish immigrants in the US.

169
Figure 5.1

170
Table 5.1
Top 25 Counties Ranked by Percentage of Irish-born Population in 1900
% Number of Irish-
County State Description Irish-born born
Suffolk Massachusetts Boston metropolitan area 73,501 12.02% Storey Nevada Mining region 400 10.89 Middlesex Massachusetts Boston metropolitan area 57,496 10.16 Norfolk Massachusetts Boston metropolitan area 14,716 9.71 Silver Bow Montana Mining region 4,582 9.62 New Haven Connecticut New York metropolitan area 24,666 9.16 Newport Rhode Island Providence metropolitan area 2,962 9.09 Providence Rhode Island Regional city 29,740 9.05 Hampden Massachusetts Springfield metropolitan area 15,891 9.05 New York New York New York metropolitan area 178,886 8.72 Hartford Connecticut Regional city 17,044 8.72 Westchester New York New York metropolitan area 16,047 8.71 Rensselaer New York Albany metropolitan area 10,389 8.54 Hudson New Jersey New York metropolitan area 31,225 8.09 Deer Lodge Montana Mining region 1,295 8.02 Fairfield Connecticut New York metropolitan area 14,348 7.79 Worcester Massachusetts Regional city 26,873 7.75 Essex Massachusetts Boston metropolitan area 27,488 7.70 Philadelphia Pennsylvania Philadelphia metropolitan area 98,427 7.61 Richmond New York New York metropolitan area 4,858 7.25 Kings New York New York metropolitan area 83,400 7.15 Bristol Rhode Island Providence metropolitan area 898 6.83 Hampshire Massachusetts Springfield metropolitan area 3,970 6.75 Union New Jersey New York metropolitan area 6,610 6.65 New London Connecticut Regional city 5,506 6.65

171
An additional question that I will seek to address is to what extent Irish immigrants
were drawn to areas where earlier generations of Irish immigrants had also settled after
arriving in the US. Using the University of Virginia Historical Census Browser, I have
created maps of the US which illustrate the percentage of Irish born residents relative
to the total population of each county in the US in each of 1870, 1880 and 1890, in
addition to 1900. These maps, beginning with Figure 5.2, group the counties into six
categories based on the percentage of Irish immigrants to the total population (0-2.5%,
2.5-5%, 5-10%, 10-15% and more than 15%, and counties for which there were no
data available). As these maps illustrate, there is a clear pattern of settlement of Irish
immigrants in the major metropolitan areas of the Northeast as far back as 1870 which
is very similar to the settlement patterns we observed for Irish immigrants in the 1900
map in Figure 5.1. In 1870, in addition to the major metropolitan areas in the
Northeast, Midwestern areas such as Chicago, Illinois and Western counties in states
including Nebraska, Minnesota and California also had high percentages of Irish
immigrants in their populations. In terms of the absolute numbers of Irish immigrants,
the New York and Boston metropolitan areas were much more significant than any
other regions in the analysis (as they continue to be in 1900). The maps for 1880 and
1890 in Figures 5.3 and 5.4 illustrate the continued importance of the major
metropolitan areas of the Northeast, coupled with a decline in the number of
Midwestern and Western counties with very high percentages of Irish immigrants. The
1900 map further reinforces this trend. There are several likely reasons for this trend.
First of all, whereas Irish immigrants were the dominant immigrant group in the
decades following 1850, other immigrant groups from Southern and Eastern Europe
were becoming more important as the twentieth century approached. In addition, these
maps only capture first generation Irish immigrants, and do not show the presence of

172
second and third generation Irish immigrants who also would have been a very
sizeable presence in these communities. Finally, general population growth would also
contribute to a reduction in the percentage of Irish immigrants in the US over this time
period.

173
Figure 5.2

174
Figure 5.3

175
Figure 5.4
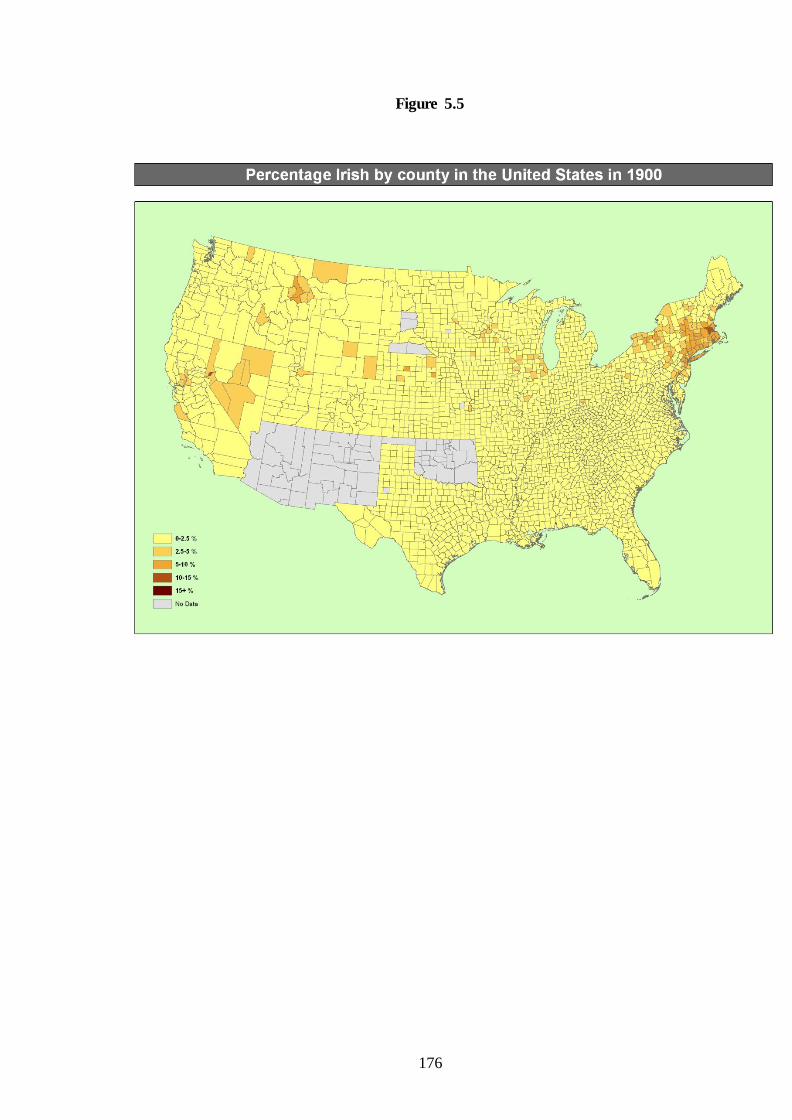
176
Figure 5.5

177
Before continuing with the geographic clustering analysis of the Irish, it is important to
understand how the Irish experience compared to that of the other leading immigrant
groups in this timeframe. As mentioned in Chapter III, the two other leading European
immigrant groups in the US in the late nineteenth century were the English and the
Germans. For this clustering analysis, I have also included the Scottish, in order to
have a better sense of how the Irish compared to another similar immigrant group
coming from the UK. The results are quite striking. As can be seen from the Tables
5.2, 5.3 and 5.4, the most clustered areas where German, English and Scottish
immigrants chose to live looked very different from those chosen by the Irish as
presented in Table 5.1. Whereas the Irish were most likely to cluster in and around the
major cities of the Northeast, with smaller numbers willing to venture out to the West
in search of employment primarily in the mining industry, none of the other immigrant
groups in this comparison had a similar experience. The Germans, who were the
largest European immigrant group in the US in this timeframe, were much more likely
to congregate in the Midwest, in particular in the states of Wisconsin, Iowa and
Minnesota, where farming was the primary occupation. None of the 25 counties where
the German clustering levels were highest were in the East. As for the English and
Scottish, their results also differed from the Irish. Both these British groups were more
likely to cluster in high percentages in the West, primarily in mining regions. They
were not as well represented in the Eastern parts of the country as were the Irish. And
for the Eastern counties that were among the highest in clustering levels for the
English and Scottish, few were in and around the urban centres of New York, Boston
and Philadelphia. These immigrant groups, in particular the English and Scottish, did
resemble the Irish in that in many parts of the US, the percentage of these immigrants
in the population was quite low. The Germans were somewhat less concentrated,

178
settling in larger percentages in more counties throughout the US than did the other
groups. In this respect, the Germans more closely resembled the native born. In
summary, the geographic clustering experience of the Irish differed from that of the
other leading immigrant groups in the US in the late nineteenth century. The Irish were
unique in that the areas in which they were most concentrated were the major urban
centres of the Northeast, whereas the English, German and Scottish, while still living
in large numbers in these urban areas, experienced their highest levels of geographic
concentration in the Midwest and West.

179
Table 5.2
Top 25 Counties Ranked by Percentage of German-born Population in 1900
Number of % County State German-born German-born
Taylor Wisconsin 2,462 21.86% Marathon Wisconsin 8,712 20.14
Sheboygan Wisconsin 10,067 20.00 Milwaukee Wisconsin 63,952 19.38 Jefferson Wisconsin 6,739 19.37
Dodge Wisconsin 8,868 19.02 Carver Minnesota 3,198 18.23
Ozaukee Wisconsin 2,972 18.16 Scott Iowa 9,234 17.91 Cuming Nebraska 2,571 17.63
Green Lake Wisconsin 2,705 17.12 Washington Wisconsin 3,984 16.89
Brown Minnesota 3,326 16.81 Grundy Iowa 2,280 16.57 Shawano Wisconsin 4,524 16.47
Calumet Wisconsin 2,738 16.03 Crawford Iowa 3,436 15.85 Ottawa Ohio 3,515 15.82
Du Page Illinois 4,418 15.67 Douglas Nevada 240 15.65
Sibley Minnesota 2,634 15.62 Lincoln Wisconsin 2,526 15.53 Outagamie Wisconsin 6,786 14.67
Marquette Wisconsin 1,506 14.33 Winnebago Wisconsin 8,299 14.25

180
Table 5.3
Top 25 Counties Ranked by Percentage of English-born Population in 1900
Number of % County State English-born English-born
Bailey Texas 1 25.00% Davis Utah 838 10.48 Salt Lake Utah 7,130 9.17 Summit Utah 859 9.10 Bristol Massachusetts 20,584 8.17 Beaver Utah 295 8.16 Morgan Utah 166 8.12 Juab Utah 816 8.09 Rich Utah 154 7.91 Weber Utah 1,942 7.69 Owyhee Idaho 289 7.60 Silver Bow Montana 3,555 7.46 Tooele Utah 541 7.35 Marquette Michigan 3,020 7.32 Iron Utah 255 7.19 Utah Utah 2,205 6.79 Uinta Wyoming 815 6.67 Granite Montana 281 6.49 Eureka Nevada 123 6.29 Cache Utah 1,088 6.00 Houghton Michigan 3,955 5.99 Storey Nevada 220 5.99 Hansford Texas 10 5.99 Providence Rhode Island 19,624 5.97 Bear Lake Idaho 419 5.94

181
Table 5.4
Top 25 Counties Ranked by Percentage of Scottish-born Population in 1900
Number of % County State Scottish-born Scottish-born
Sweetwater Wyoming 291 3.44% Washington Vermont 1,189 3.25 Uinta Wyoming 359 2.94 Grundy Illinois 698 2.89 Meagher Montana 63 2.49 Wasatch Utah 116 2.45 Carbon Utah 113 2.26 Passaic New Jersey 3,401 2.19 Carbon Montana 160 2.12 Fergus Montana 147 2.12 Park Montana 155 2.11 Washington Rhode Island 505 2.09 Terry Texas 1 2.08 Allegany Maryland 1,093 2.04 Natrona Wyoming 36 2.02 Rich Utah 38 1.95 Fresno California 734 1.94 Hooker Nebraska 8 1.85 Tooele Utah 131 1.78 Glasscock Texas 5 1.75 Jefferson Pennsylvania 985 1.67 Summit Utah 154 1.63 Cascade Montana 395 1.53 Bottineau North Dakota 114 1.51 Salt Lake Utah 1,167 1.50

182
In Table 5.5, I present summary statistics from my sample of Irish immigrants based
on their level of geographic clustering. The table separates the sample into those
immigrants who lived in counties with above and below average levels of geographic
clustering. The results from this analysis are striking. The two groups have marked and
statistically significant differences in virtually every characteristic under review. In
fact, the two groups have differences which are statistically significant at the 1%
confidence level in every category with the exception of spouse literacy. Those Irish
immigrants who lived in counties with below average levels of Irish immigrants were
substantially more rural, more likely to own a home and more likely to have married a
non-Irish born spouse. In addition, their spouses had lower levels of infant mortality
and were less likely to be in the workforce. In all these respects, these Irish immigrants
more closely resembled the native born, whose characteristics we examined in detail in
Chapter III. Only in the area of literacy did the above average clustered Irish more
closely resemble the native born, and in this instance the difference, though
statistically significant, is not very meaningful as more than nine out of ten of both
groups were classified as literate in the 1900 US census.
A possible explanation for the results in Table 5.5 is that perhaps the Irish living in the
more clustered areas (which were generally in more urban areas) had more recently
arrived in the US and would then gradually move to less clustered areas with more
time spent living in the US. This theory is supported by the evidence in Table 5.5,
which shows that the more clustered Irish immigrants were younger and had lived in
the US almost five years less than those Irish immigrants who lived in less clustered
areas. Notwithstanding this potential explanation, it would appear from this initial
analysis of summary statistics that geographic clustering did in fact have a significant

183
effect on the assimilation of Irish immigrants in the US in the late nineteenth
century.230 Those Irish immigrants who lived in less geographically clustered areas
differed significantly from those who lived in more clustered areas across a range of
socio-economic characteristics. And in virtually all of these characteristics, they also
more closely resembled the native born, reflecting a greater degree of assimilation.
These results would also support the views of Chiswick (2002), Borjas (1999) and
Light and Isralowitz (1996), who argue that geographic clustering delays immigrant
assimilation.
230
To control for the potential influence of an immigrant living in an urban area on these results, I also
generated the summary statistics presented in Table 5.5 including only those Irish immigrants who lived
in urban areas. The purpose of this analysis was to examine whether the differences which exist in Table
5.5 may have reflected wider differences in socio-economic conditions between rural and urban areas in
this timeframe. The results showed that although the differences between the above and below average
clustered groups did narrow slightly when restricted to a comparison of urban populations, they were
still statistically significant at the 1% level in every category with the exception of spouse literacy.

184
Table 5.5
Summary Statistics of Irish Immigrants Based on Level of Geographic Clustering
Variable Above Avg. Below Avg. Observations 13,552 13,170
Age 42.1 years*** 46.0 years
Age at Marriage 27.0 years*** 27.9 years
Years in US 22.9 years*** 27.8 years
Rural Status 12.8%*** 36.0%
Home Ownership 24.2%*** 46.9%
Literacy
Read and write English 93.4%*** 91.6%
Read or write only 1.2% 1.8%
Spouse Fertility
Avg. Children Ever Born 5.4*** 5.9
Avg. Children Surviving 4.1*** 4.7
Implied Mortality Rate 24.4% 21.1%
Spouse Age 40.0 years*** 42.9 years
Spouse Age at Marriage 23.7 years*** 23.4 years
Spouse Birthplace
Ireland 74.7%*** 53.5%
Other Foreign Country 6.1%*** 9.6%
US 19.2%*** 37.0%
Spouse Literacy
Read and write English 90.2% 89.9%
Read or write only 2.1% 2.2%
Spouse in workforce 3.0%*** 1.8%
***Differences between the individuals in the two samples are significant at the 1, 5 and 10% levels ,
respectively, using a t test for age and fertility variables, and the chi squared test of independence for the
remaining variables.

185
In Table 5.6, I again separate my sample into above and below average levels of
geographic clustering, in this case to facilitate the analysis of occupational mobility of
Irish immigrants in the late nineteenth century. For my occupational groups, I use the
format developed in Chapter III, which follows the approach of Thernstrom (High
White Collar, Low White Collar, Farmer, Skilled, Semi-skilled, Unskilled). I continue
to make an exception for farmers, who are separated into their own category to
facilitate more detailed analysis of their role in the results. The results presented in
Table 5.6 again demonstrate that geographic clustering had a significant impact on the
lives of Irish immigrants in this timeframe. Those Irish immigrants who lived in above
average clustered areas were less likely to be in the white collar categories and in
farming, and were more likely to be in semi- and un-skilled work. In Table 5.6, we
find that only 15.4% of those Irish who lived in above average clustered counties were
engaged in white collar work or in farming, versus a figure of 30.7% for the less
clustered group. Similarly, almost two thirds of the more clustered Irish were engaged
in semi- or un-skilled work, versus approximately 55% for those Irish who lived in less
Irish neighbourhoods.231 One limitation of this analysis is that it does not control for
the influence of other socio-economic characteristics of these Irish immigrants. In
order to confirm the statistical significance of these characteristics on occupational
outcomes, it is necessary to undertake a regression analysis.232
231
I also created comparisons for Irish immigrants who lived in the top and bottom quartile, as well as in
the top and bottom decile based on their level of geographic clustering. The occupational outcomes for
these comparisons were progressively more differentiated as the degree of clustering moved from halves
to quartiles to deciles. The less clustered Irish became even more likely to be in white collar work and in
farming, whereas the more clustered Irish were even more likely to be in semi-and un-skilled work. 232
I did control for the potential influence of an immigrant living in an urban area by generating the
occupational mobility results presented in Table 5.6 including only those Irish immigrants who lived in
urban areas. The results confirm those in Table 5.6, with the differences in occupational mobility
between the two groups actually increasing slightly in the white collar and skilled categories.

186
Table 5.6
Irish Immigrant Occupational Groupings in 1900
Based on Level of Geographic Clustering
Above average clustered Irish
No. % Cum %
High WC 944 6.97 6.97 Low WC 931 6.87 13.84 Farmer 212 1.56 15.40
Skilled 2,365 17.45 32.85 Semi-skilled 4,119 30.39 63.25
Unskilled 4,981 36.75 100.00 Total 13,552 100.00
Below average clustered Irish
No. % Cum %
High WC 1,203 9.13 9.13
Low WC 958 7.27 16.41 Farmer 1,888 14.34 30.74 Skilled 1,861 14.13 44.87
Semi-skilled 2,937 22.30 67.18 Unskilled 4,323 32.82 100.00
Total 13,170 100.00

187
Table 5.7 presents the results of a multinomial logistic regression on the likelihood of
an Irish immigrant in my sample being in one of the six occupational categories (High
White Collar, Low White Collar, Farmer, Skilled, Semi-skilled, Unskilled). This form
of regression allows me to assess the impact of individual variables on the likelihood
of being in one of these six occupational categories, while controlling for the impact of
all the other variables used in the regression. The results in Table 5.7 show the
marginal effects of these variables for each occupational level. With this approach, I
am able to demonstrate the impact which these variables have on the likelihood of an
Irish immigrant being in a particular occupational group. In particular, this approach
allows me to observe the influence of geographic clustering on occupational outcomes,
while controlling for a host of other socio-economic variables. As a result, it will allow
me to reach more definitive conclusions about the specific impact of geographic
clustering on occupational outcomes. In this logistic regression analysis, I have
included the following variables: age, spouse age, years living in the US, duration of
marriage, literacy, spouse literacy, home ownership, urban status, employment status,
intermarriage, and the percent of population in the immigrant‟s county of residence
whom were born in Ireland.
The results in Table 5.7 confirm that geographic clustering was in fact an important
factor in the occupational outcomes of Irish immigrants at the turn of the century. In
every category except the unskilled, the influence of geographic clustering (as
measured by the percentage of the population in a given county of residence whom
were born in Ireland), was statistically significant. For the high white collar category,
this measure of geographic clustering was significant at the 1% confidence level and
was negative, indicating that those Irish who lived in more heavily concentrated Irish

188
counties were less likely to be in the highest occupational category in 1900. The
marginal effect output also allows us to calculate the magnitude of this effect. If we
were to assume that an Irish immigrant moved from a county with no other Irish
immigrants to the county in the greater Boston area with the highest percentage of Irish
immigrants (12.02%), the effect of this change in geographic clustering, holding other
variables constant, would be to reduce his likelihood of being in a high white collar
occupation by 2.4%. While this result may not sound significant, it represents a 30%
reduction in the share of Irish immigrants who held high white collar occupations in
1900 (Irish immigrants in this category being approximately 8% in my sample). The
results for the low white collar category were similar in terms of statistical significance
and direction, with the marginal effect of geographic clustering indicating a larger
3.6% reduction in the likelihood of being in a low white collar occupation. This figure
represents a 51% reduction in the share of Irish immigrants who would have held low
white collar occupations. As for farming, the results indicate that the impact of
geographic clustering was similar to that for the white collar categories with a 30%
reduction in the share of Irish immigrants in this occupational group. The results for
the farming category were also significant at the 1% confidence level. These results
clearly show that geographic clustering did not aid Irish immigrants in reaching the
highest occupational categories in 1900, but was in fact a hindrance to advancing up
the occupational ladder. In each of these occupational categories, Irish immigrants who
lived in more geographically clustered counties were less likely to be employed in
1900. As for the skilled and semi-skilled categories, Irish immigrants who lived in
more geographically clustered counties were more likely to work in these sectors of the
workforce. The relationship between geographic clustering and working in these
occupational categories in 1900 was statistically significant and positive, reflecting a

189
1% confidence level for the skilled worker level and a 5% confidence level for the
semi-skilled category. The marginal effects calculations indicate a 2% and 8% increase
in the likelihood of being in these two categories, respectively. These effects would
have resulted in increases in the share of Irish immigrant workers in these categories of
15% and 32%, respectively. Only in the unskilled category was the effect of
geographic clustering not statistically significant. In this category, factors such as years
living in the US, literacy and intermarriage were critical, in each case with the
relationship being negative. Irish immigrants that were newer to the US, married to an
Irish born spouse, and less literate were more likely to find themselves in unskilled
work. These factors were more important than whether an Irish immigrant lived in a
geographically clustered area for unskilled workers.
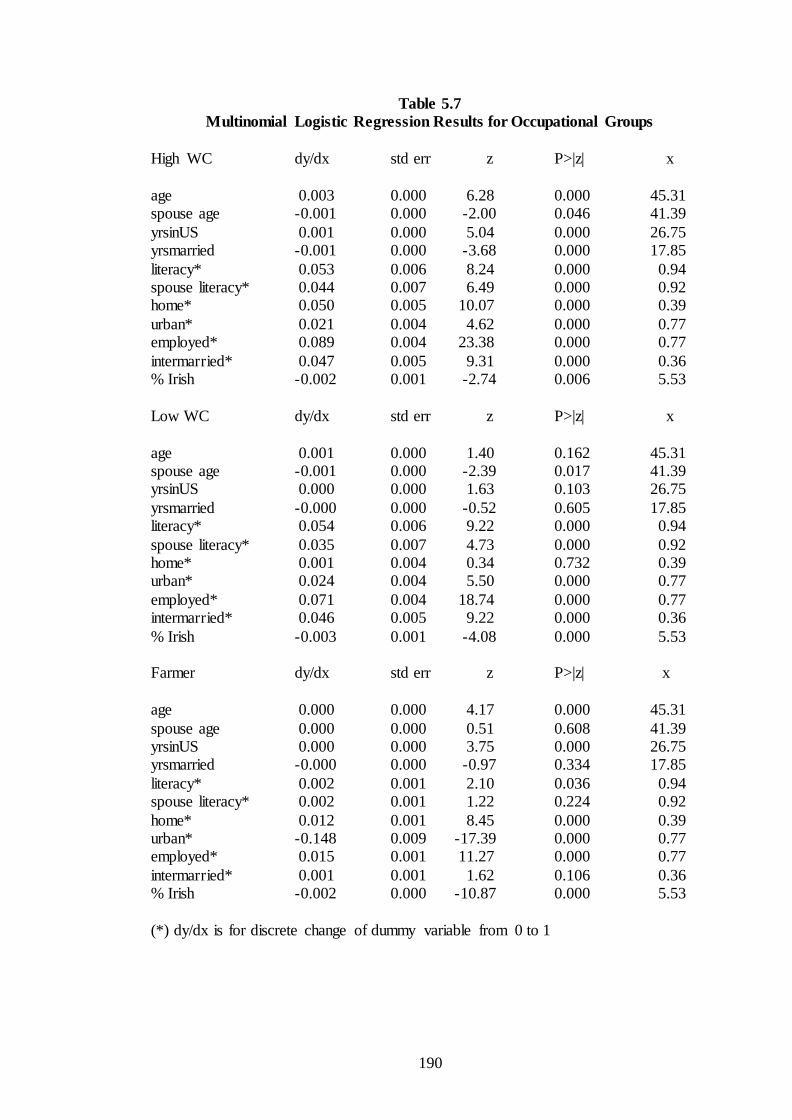
190
Table 5.7
Multinomial Logistic Regression Results for Occupational Groups
High WC dy/dx std err z P>|z| x
age 0.003 0.000 6.28 0.000 45.31 spouse age -0.001 0.000 -2.00 0.046 41.39
yrsinUS 0.001 0.000 5.04 0.000 26.75 yrsmarried -0.001 0.000 -3.68 0.000 17.85
literacy* 0.053 0.006 8.24 0.000 0.94 spouse literacy* 0.044 0.007 6.49 0.000 0.92 home* 0.050 0.005 10.07 0.000 0.39
urban* 0.021 0.004 4.62 0.000 0.77 employed* 0.089 0.004 23.38 0.000 0.77
intermarried* 0.047 0.005 9.31 0.000 0.36 % Irish -0.002 0.001 -2.74 0.006 5.53
Low WC dy/dx std err z P>|z| x
age 0.001 0.000 1.40 0.162 45.31 spouse age -0.001 0.000 -2.39 0.017 41.39 yrsinUS 0.000 0.000 1.63 0.103 26.75
yrsmarried -0.000 0.000 -0.52 0.605 17.85 literacy* 0.054 0.006 9.22 0.000 0.94
spouse literacy* 0.035 0.007 4.73 0.000 0.92 home* 0.001 0.004 0.34 0.732 0.39 urban* 0.024 0.004 5.50 0.000 0.77
employed* 0.071 0.004 18.74 0.000 0.77 intermarried* 0.046 0.005 9.22 0.000 0.36
% Irish -0.003 0.001 -4.08 0.000 5.53 Farmer dy/dx std err z P>|z| x
age 0.000 0.000 4.17 0.000 45.31
spouse age 0.000 0.000 0.51 0.608 41.39 yrsinUS 0.000 0.000 3.75 0.000 26.75 yrsmarried -0.000 0.000 -0.97 0.334 17.85
literacy* 0.002 0.001 2.10 0.036 0.94 spouse literacy* 0.002 0.001 1.22 0.224 0.92
home* 0.012 0.001 8.45 0.000 0.39 urban* -0.148 0.009 -17.39 0.000 0.77 employed* 0.015 0.001 11.27 0.000 0.77
intermarried* 0.001 0.001 1.62 0.106 0.36 % Irish -0.002 0.000 -10.87 0.000 5.53
(*) dy/dx is for discrete change of dummy variable from 0 to 1

191
Skilled dy/dx std err z P>|z| x
age -0.002 0.001 -2.29 0.022 45.31 spouse age 0.000 0.001 0.25 0.804 41.39
yrsinUS 0.003 0.000 7.63 0.000 26.75 yrsmarried 0.000 0.001 0.44 0.657 17.85 literacy* 0.138 0.010 13.91 0.000 0.94
spouse literacy* 0.088 0.011 7.78 0.000 0.92 home* 0.004 0.007 0.59 0.555 0.39
urban* 0.084 0.008 11.26 0.000 0.77 employed* -0.033 0.008 -4.36 0.000 0.77 intermarried* 0.061 0.008 8.06 0.000 0.36
% Irish 0.002 0.001 1.97 0.049 5.53
Semi-skilled dy/dx std err z P>|z| x age -0.003 0.001 -3.11 0.002 45.31
spouse age -0.001 0.001 -1.06 0.289 41.39 yrsinUS 0.001 0.001 2.12 0.034 26.75
yrsmarried 0.000 0.001 0.36 0.717 17.85 literacy* 0.006 0.018 0.33 0.743 0.94 spouse literacy* -0.033 0.017 -2.03 0.043 0.92
home* 0.005 0.009 0.59 0.555 0.39 urban* -0.002 0.010 -0.19 0.847 0.77
employed* 0.060 0.009 6.87 0.000 0.77 intermarried* 0.017 0.009 1.94 0.052 0.36 % Irish 0.007 0.001 5.27 0.000 5.53
Un-skilled dy/dx std err z P>|z| x age 0.001 0.001 0.96 0.339 45.31
spouse age 0.003 0.001 2.89 0.004 41.39 yrsinUS -0.006 0.001 -11.47 0.000 26.75
yrsmarried 0.001 0.001 1.28 0.201 17.85 literacy* -0.253 0.019 -13.61 0.000 0.94 spouse literacy* -0.135 0.017 -8.11 0.000 0.92
home* -0.073 0.009 -8.04 0.000 0.39 urban* 0.020 0.011 1.89 0.058 0.77
employed* -0.202 0.010 -21.17 0.000 0.77 intermarried* -0.172 0.009 -20.00 0.000 0.36 % Irish -0.002 0.001 -1.58 0.114 5.53
(*) dy/dx is for discrete change of dummy variable from 0 to 1
192
In further results not reported here, I also generated a multinomial logistic regression
on the likelihood of an Irish immigrant being in a particular occupational category, in
this case excluding farmers and those immigrants living in rural areas. The purpose of
this additional regression was to examine the impact of geographic clustering solely on
urban workers, where most Irish immigrants lived and where their networks were
likely to have been strongest. The results of this regression support my prior
conclusion that geographic clustering did not aid Irish immigrants in reaching the
highest occupational categories (i.e. high and low white collar), but in fact had a
negative relationship with these two categories. Geographic clustering did have a
positive effect on Irish immigrants in the skilled and semi-skilled categories, but not
for the unskilled. All of the results were statistically significant. Even when restricted
to urban workers, the effect of geographic clustering remains negative for the highest
occupational categories.
In Table 5.8, I present the results of a Duncan dissimilarity index (DDI) calculation for
the occupations held by my sample of Irish immigrants in 1900 based on their level of
geographic clustering. As first described in Chapter III, the DDI is an index which
compares the similarities and differences between two distributions. The index takes a
value between zero and one, with one reflecting no overlap between distributions and
zero representing identical distributions. The index may be interpreted as the
proportion of subjects in a group that would have to change category in order to obtain
the same relative distribution as the group to which it is being compared.
Table 5.8 presents the calculation of DDI for the occupational outcomes of the Irish
immigrants in my sample based on varying degrees of geographic clustering (the top
193
and bottom 50%, 25% and 10%, respectively, of the sample). As Table 5.8 illustrates,
the DDI calculations for the occupations of Irish immigrants in my sample are
significantly impacted by the level of geographic clustering. As the level of geographic
clustering increases, so does the difference between the occupational distributions of
the two groups. Using the 50% cut-off level, the DDI equals .237. This calculation
rises to .358 when the sample is limited to the top and bottom 25%, and to .416 when
the sample is further restricted to the top and bottom 10% level. Using the top and
bottom 10% figures, the results indicate that more than four out of ten Irish immigrants
in my sample would need to change their occupation in order for the two distributions
to match each other. These results serve to further reinforce the conclusion that the
geographic clustering of Irish immigrants in the late nineteenth century had a
significant impact on the occupational outcomes of these immigrants.233
In a further analysis not reported here, I also calculated the DDI excluding farmers and
those immigrants living in rural areas. The results of this analysis, which were also run
at the 50%, 25% and 10% levels, again showed that the occupational distributions of
the respective groups became increasingly dissimilar as the level of geographic
clustering rose. The DDI calculations did reflect a narrowing in the differences
between the two groups, in particular at the 50% level where the figure declined to
.136. However, using the 10% cut-off level, more than three in ten urban immigrants
would have to change jobs for the two distributions to match each other.
233
As mentioned previously, I also analysed the occupational outcomes for these comparisons at the
half, quartile and decile levels and found that the less clustered Irish became even more likely to be in
white collar work and in farming, whereas the more clustered Irish were even more likely to be in semi-
and un-skilled work as the analysis progressed from halves to quartiles to deciles.

194
The results of the multinomial logistic regression analysis as well as the DDI
calculations illustrate the importance of geographic clustering on the occupational
outcomes of Irish immigrants in the late nineteenth century. The multinomial logistic
regression analysis clearly shows that Irish immigrants who lived in more clustered
environments were less likely to work in the higher occupational categories, and were
more likely to find employment in the skilled and semi-skilled categories. The DDI
calculations also show that geographic clustering was a critical factor in influencing
occupational outcomes. Even when these analyses were limited solely to urban
workers, the results were unchanged. Returning to the literature, these results for turn
of the century Irish immigrants would appear to refute the views of Chiswick (2002),
Portes and Rumbaut (1996) and Gordon (1964) who argue that immigrant enclaves
could be advantageous to immigrants seeking work in a new society. These results,
which control for the influence of factors such as age, years living in the US, literacy
and other factors, clearly show that for Irish immigrants in this timeframe, geographic
clustering did not help them to advance up the occupational ladder.

195
Table 5.8
Calculation of Duncan Dissimilarity Index for Irish Immigrant Occupations
Based on Level of Geographic Clustering
Geographic Clustering Measured by Top/Bottom Percentages
50% 25% 10%
DDI .237 .358 .416
No. of Occupations 181 170 145
No. of Observations 26,722 13,528 5,538
One final question that merits attention is whether the more geographically clustered
Irish were disproportionately represented in certain occupations. In the literature,
McCaffrey (1996) and McKivigan and Robertson (1996) argue that Irish immigrants in
the nineteenth century benefited from the networking opportunities and support
systems which had developed in cities such as New York which had large
concentrations of Irish immigrants. McCaffrey (1996) argues that the Irish were able to
make occupational advances in local government, trade unions and the Catholic
Church,234 while McKivigan and Robertson (1996) argue that the Irish in New York
City had particular success in obtaining work “in city government jobs for policemen,
firefighters, rapid transit workers and school teachers.” McKivigan and Robertson
(1996) also argue that by 1900, significant numbers of the city‟s Irish had moved up
into the ranks of professionals and entrepreneurs.”235 Chiswick (2002), Portes and
Rumbaut (1996) and Gordon (1964) also argue that ethnic enclaves provided
significant advantages for new immigrants and immigrant entrepreneurs. These
potential benefits of living in an immigrant enclave with a high proportion of other
234
McCaffrey (1996), p.222. 235
McKivigan and Robertson (1996), p. 312.

196
Irish immigrants can be tested against the evidence which I have assembled using my
sample data. If this literature is correct, I should find evidence that Irish immigrants
benefited from geographic clustering and were able to gain access to jobs in areas such
as city government (government workers, policemen, firemen, public transit workers),
in the Roman Catholic church, as well as in jobs where trade union ties were important
in this timeframe (longshoremen, railroad, mining, lumbermen). This literature implies
that Irish immigrants living in these “enclaves” would have had an advantage in the
employment market versus Irish immigrants who did not live in such areas. Using my
sample data, I will examine these arguments.
I have calculated the average level of geographic clustering for each occupation held
by an Irish immigrant in 1900. I have then indexed this average to the highest level of
clustering in any county in my sample in 1900 (Suffolk County, Massachusetts at
12.02%). This resultant index thus shows the average level of geographic clustering for
each occupation as a ratio of the highest concentration of Irish immigrants in a county
in this time period. Using this index, I can then examine which occupations were held
by Irish immigrants living in more or less geographically clustered areas.
In Appendix 5.1, I present the complete list of occupations held by Irish immigrants in
my sample, along with the number of immigrants who held this occupation and the
clustering ratio described above. The list is sorted from those occupations with the
lowest average level of geographic clustering to the highest. Table 5.9 shows the
average clustering ratio for each occupational category (High White Collar, Low
White Collar, Farmer, Skilled, Semi-skilled, Unskilled) and in Table 5.10 I provide
these results for a selection of notable occupations. There are several conclusions that

197
can be drawn from a review of this data. First of all, as my prior analyses in this
chapter have shown, geographic clustering appears to have an inverse relationship with
occupational category. Other than farmers, for which the clustering index is extremely
low, the ratio of geographic clustering is higher for the lower occupational categories
than it is for the white collar ones. In terms of particular occupations as presented in
Table 5.10, white collar jobs such as managers, teachers, physicians and surgeons,
lawyers and judges, officials and administrators all have relatively low clustering
ratios. Interestingly, clergymen also have a low ratio at just .292. This result would
suggest that those Irish immigrants who entered the church did not live in more
clustered areas in 1900.236 What is also interesting is that there are many jobs that were
more likely to be unionised, such as lumbermen, railroad repairmen, and mine
workers, where the clustering ratio is also relatively low. This result likely reflects the
fact these occupations frequently required workers to live in the more remote regions
of the country where the mines, railroads and forests were located and/or being
constructed. Though as we have seen there were some remote counties where Irish
immigrants were highly concentrated (such as Storey, Nevada, and Silver Bow and
Deer Lodge, Montana), these results would indicate that, for the most part, Irish
immigrants working in these unionised occupations did not live in more clustered
areas.237 With respect to local government related jobs such as government workers,
policemen, firemen, and public transit workers, the results here are also instructive.
Firemen, policemen and motormen have clustering ratios that would place them near
the middle of the distribution, reflecting that they did not live, on average, in
236
What this data does not show, unfortunately, is where the Irish immigrants who entered the clergy
were living at the time that they joined the church. It may have been the case that some of these
immigrants may have lived in more clustered areas when they joined the church, and were later assigned
to parishes in less clustered areas. 237
Among occupations more likely to have been unionised in 1900, only longshoremen had a relatively
high clustering ratio.

198
particularly highly clustered counties. Public officials and administrators actually had a
relatively low ratio of .329 while teachers had an even lower ratio at just .190. The
primary occupational area where I did find consistently high clustering ratios was the
textile industry (spinners, weavers, dyers, loom fixers) as well as in urban service
occupations such as waiters and waitresses, and taxicab drivers. In the case of the
latter, this pattern may reflect local demand for services from other Irish immigrants.
The results of this analysis of specific occupations only serve to reinforce my prior
conclusions that the occupational levels of Irish immigrants in this time frame were
inversely related to their level of geographic clustering. What these results also
demonstrate is that the benefits of living in an area with a high concentration of Irish
immigrants as described by McCaffrey (1996) and McKivigan and Robertson (1996)
may not have been as significant as these authors have suggested. In my data, I find
scarce evidence that geographic clustering led to greater employment opportunities in
local government and unionised work. In fact, much of the evidence presented in this
section would refute that claim. In addition, I found further evidence to support my
prior conclusions that geographic clustering was associated with lower levels of
occupational achievement. One could argue that these results do not undermine the
position that Irish immigrants could have initially benefited from living in immigrant
enclaves, and that as they spent more time living in the US, they migrated towards less
ethnically concentrated areas of the country. However, these results might also support
the view that living in a more ethnically concentrated community, though it may have
improved the initial starting position of Irish immigrants in America, came at the
expense of slower subsequent assimilation and reduced occupational mobility. In my
analysis, I find very limited support for the view that living in an area with a high

199
concentration of Irish immigrants enhanced the occupational outcomes of Irish
immigrants versus those that lived in less geographically clustered areas.

200
Table 5.9
Irish Immigrant Occupational Levels Based on Clustering Index
Occupational Level Clustering Ratio
High White Collar .407
Low White Collar .450 Farmer .183
Skilled .483 Semi-skilled .498 Unskilled .479
Table 5.10
Selected List of Irish Immigrant Occupations Based on Clustering Index
Occupation Occupational Level Clustering Ratio
Teachers High White Collar .190 Managers and superintendents High White Collar .281
Physicians and surgeons High White Collar .284 Clergymen High White Collar .292 Lawyers and judges High White Collar .314
Officials and administrators High White Collar .329
Lumbermen Unskilled .166 Mine operatives Semi-skilled .301 Locomotive engineers Skilled .302
Locomotive firemen Semi-skilled .310 Brakemen, railroad Semi-skilled .394
Firemen Semi-skilled .421 Policemen and detectives Semi-skilled .486
Motormen Semi-skilled .493
Spinners Semi-skilled .575 Weavers Semi-skilled .582 Taxicab drivers and chauffeurs Semi-skilled .592
Dyers Semi-skilled .613 Waiter and waitresses Semi-skilled .687

201
This chapter has assessed the impact of geographic clustering on the degree of
assimilation achieved by Irish immigrants in late nineteenth century America. In this
chapter, I have used the county level US census data available from the University of
Virginia Historical Census Browser to create a database which illustrates the
percentage of Irish immigrants living in each county in the US in 1900. I have also
created a new sample of Irish immigrants who came to the US prior to 1900 using the
IPUMS 2.5% US census sample for 1900. This new sample provides me with the
largest possible sample of Irish immigrants with which to assess the impact of
geographic clustering at the county level in this timeframe.
The first question addressed in this chapter was to what extent geographic clustering
existed for the Irish in late nineteenth century America. In my results I found clear
evidence of geographic clustering. The Irish were not evenly distributed across the US,
but were highly concentrated in the Northeast. By number they were most likely to live
in the New York City and Boston metropolitan areas. In many sections of the US,
particularly the South and West, the percentage of Irish immigrants was extremely
low. It appears that Irish immigrants in the US were drawn to areas close to where they
may have entered the US and close to the major population centres of the Northeast
where jobs were most likely to be available. Certain of them were also willing to move
long distances to work in mining, railroad and farming jobs in the West. In several
Western counties, the percentage of Irish immigrants to the total population was quite
high. However, the actual number of Irish immigrants living in these regions was very
modest.

202
A related question addressed in this chapter is to what extent Irish immigrants were
drawn to areas where earlier generations of Irish immigrants had settled after arriving
in the US. Using the University of Virginia Historical Census Browser, I created maps
of the US illustrating the percentage of Irish born residents relative to the total
population of each county in the US in each of 1870, 1880, 1890 and 1900.238 This
analysis showed that there is a clear pattern of settlement of Irish immigrants in the
major metropolitan areas of the Northeast as far back as 1870 which is very similar to
the settlement patterns observed for Irish immigrants in 1900. In addition to the major
metropolitan areas in the Northeast, Midwestern metropolitan areas such as Chicago,
Illinois and certain Western counties also had high percentages of Irish immigrants in
these earlier census periods. However, in terms of the absolute numbers of Irish
immigrants, the New York and Boston metropolitan areas were much more significant
than any other region in the analysis throughout the late nineteenth century, and the
major metropolitan areas of the Northeast had the highest concentrations of Irish
immigrants in 1900.
In an effort to assess the effect of geographic clustering on the assimilation of Irish
immigrants, I analysed its impact on the socio-economic characteristics of my new
sample of Irish immigrants available in the US census data. In this analysis, I separated
the sample into those immigrants who lived in counties with above and below average
levels of geographic clustering. The results show that the two groups have marked and
statistically significant differences in virtually every characteristic under review. Those
Irish immigrants who lived in counties with below average levels of Irish immigrants
were substantially more rural, more likely to own a home and more likely to have
238
1870 being the earliest year for which there is complete census data available.

203
married a non-Irish born spouse. In addition, their spouses had lower levels of infant
mortality and were less likely to be in the workforce. In all these respects, these Irish
immigrants more closely resembled the native born than did those who lived in more
clustered environments. This analysis confirms that geographic clustering did have a
significant effect on the assimilation of Irish immigrants in the US in the late
nineteenth century, with those Irish immigrants who lived in less geographically
clustered areas much more closely resembling the native born.
With respect to the issue of occupational outcomes, the impact of geographic
clustering also appears to have been highly relevant. Using my sample of Irish
immigrants separated into above and below average levels of geographic clustering, I
found that those Irish immigrants who lived in above average clustered areas were less
likely to be in the white collar categories and in farming, and were more likely to be in
semi- and un-skilled work. Thus geographic clustering appeared to have a negative
effect on occupational outcomes. As mentioned previously, one limitation of this
analysis is that it does not control for the influence of other socio-economic
characteristics on these Irish immigrants. In order to confirm the statistical significance
of these characteristics on occupational outcomes, it was necessary to undertake a
regression analysis.
In this instance, I used a multinomial logistic regression on the likelihood of an Irish
immigrant in my sample being in one of the six occupational categories (High White
Collar, Low White Collar, Farmer, Skilled, Semi-skilled, Unskilled). This form of
regression allows me to assess the impact of individual variables on the likelihood of
being in one of these six occupational categories, while controlling for the impact of all

204
of the variables used in the regression. The results confirmed the importance of
geographic clustering on the occupational outcomes of Irish immigrants. In every
category except the unskilled, the influence of geographic clustering (as measured by
the percentage of the population in a given county of residence whom were born in
Ireland), was statistically significant. For the high white collar, low white collar and
farming categories, this measure of geographic clustering was significant at the 1%
confidence level and was negative, indicating that those Irish who lived in more
heavily concentrated Irish counties were less likely to be in these higher occupational
categories in 1900. As for the skilled and semi-skilled categories, Irish immigrants
who lived in more geographically clustered counties were more likely to work in these
sectors of the workforce. Only in the unskilled category was the effect of geographic
clustering not statistically significant. In this category, factors such as years living in
the US, literacy and intermarriage were critical, in each case with the relationship
being negative. Irish immigrants that were newer to the US, married to an Irish born
spouse, and less literate were more likely to find themselves in unskilled work. These
results show that geographic clustering did not aid Irish immigrants in reaching the
highest occupational categories in 1900, but in fact was a hindrance to advancing up
the occupational ladder. DDI calculations for the occupations of Irish immigrants in
my sample were also significantly impacted by the level of geographic clustering. As
the level of geographic clustering increased, so did the difference between the
occupational distributions of the respective groups.
One final question to be analysed was whether the more geographically clustered Irish
were disproportionately represented in certain occupations. In the literature, McCaffrey
(1996) and McKivigan and Robertson (1996) have suggested that late nineteenth

205
century Irish immigrants benefited from geographic clustering and were able to gain
access to jobs in areas such as city government, in the Roman Catholic church, as well
as in jobs where trade union ties were important. This literature implies that Irish
immigrants living in immigrant enclaves had an advantage in the labour market versus
Irish immigrants who did not live in such areas. Using my sample data, I calculated an
index based on the average level of geographic clustering for each occupation held by
an Irish immigrant in 1900. The results of this analysis again confirmed that
geographic clustering did not appear to help Irish immigrants to obtain white collar
work, as the geographic clustering index for most of these occupations was relatively
low. On the other hand, at higher levels of geographic clustering, most of the largest
concentrations were in skilled, semi- and un-skilled occupations. I also found scarce
evidence that geographic clustering led to greater employment opportunities in local
government, unionised work or the clergy. In fact, much of the evidence presented
Appendix 5.1 would refute that claim. In summary, I found very limited evidence to
support the view that living in an area with a high concentration of Irish immigrants
enhanced the occupational outcomes of Irish immigrants versus those that lived in less
geographically clustered areas.
In this chapter, I have demonstrated that geographic clustering did exist for Irish
immigrants in late nineteenth century America. Irish immigrants were primarily drawn
to the large metropolitan areas of the Northeast, reflecting the importance of these
areas as points of entry to the US, as well as major centres for employment for new
immigrants. In smaller numbers, Irish immigrants also concentrated in certain Western
regions to work in the mining, railroad and farming industries. The settlement choices
of earlier cohorts of Irish immigrants also seem to have been important for the late

206
nineteenth century Irish. Thus it would appear that proximity to ports of entry, job
opportunities, and the settlement choices of earlier groups of Irish immigrants were
critical to the geographic location of the Irish immigrants at the turn of the century.
What is also clear from the analysis presented in this chapter is that geographic
clustering directly impacted the degree of assimilation and occupational mobility of
Irish immigrants in this timeframe. Higher levels of geographic clustering were
associated with both lower degrees of assimilation and lower occupational outcomes.
The benefits of geographic clustering in the job market do not appear to have existed
for Irish immigrants in the late nineteenth century, and this research provides further
support for the argument that such clustering delays the assimilation process.

207
Appendix 5.1
List of Irish Immigrant Occupations Based on Clustering Index
No. of Occupational Clustering
Observations Occupation Level Ratio
1 Officials, lodge, society, union, etc. High WC 0.005
1 Apprentices, printing trades Semi-skilled 0.009
3 Opticians and lens grinders and polishers Low WC 0.045
1 Counter and fountain workers Semi-skilled 0.048
4 Postmasters Low WC 0.085
1 Blasters and powdermen Semi-skilled 0.131
1 Apprentices, other specified trades Semi-skilled 0.151
7 Inspectors, scalers, and graders log and lumber Skilled 0.157
1 Dancers and dancing teachers Low WC 0.158
1 Architects High WC 0.166
48 Lumbermen, raftsmen, and woodchoppers Unskilled 0.166
1 Technicians Low WC 0.173
2094 Farmers (owners and tenants) Farmer 0.183
39 Teachers High WC 0.190
1 Plumbers and pipe fitters apprentice Semi-skilled 0.200
24 Railroad and car shop-mechanics and repairmen Skilled 0.210
10 Religious workers High WC 0.237
1 Credit men Low WC 0.244
6 Farm managers Farmer 0.248
19 Buyers and shippers, farm products High WC 0.248
3 Therapists and healers Low WC 0.250
6 Subject not specified-Professors and instructors High WC 0.253
1 Entertainers Low WC 0.266
13 Millers, grain, flour, feed, etc Skilled 0.268
93 Managers and superintendents, building High WC 0.281
3 Marshals and constables Semi-skilled 0.282
35 Physicians and surgeons High WC 0.284
133 Clergymen High WC 0.292
1 Apprentices, metalworking trades Semi-skilled 0.300
876 Mine operatives and labourers Semi-skilled 0.301
112 Locomotive engineers Skilled 0.302
13 Musicians and music teachers Low WC 0.307
61 Locomotive firemen Skilled 0.310
47 Lawyers and judges High WC 0.314
4 Photoengravers and lithographers Skilled 0.315
11 Sawyers Semi-skilled 0.320
12 Sports instructors and officials Low WC 0.323
31 Officials and administrators, public administration High WC 0.329
16 Baggagemen, transportation Low WC 0.338
10 Civil-Engineers High WC 0.342
1 Photographic process workers Skilled 0.344
1 Chainmen, rodmen, and axmen, surveying Semi-skilled 0.344
384 Foremen Low WC 0.348
7 Stenographers, typists, and secretaries Low WC 0.357
11 Telegraph operators Low WC 0.360
96 Furnacemen, smeltermen and pourers Semi-skilled 0.361
27 Members of the armed services Semi-skilled 0.363
706 Farm labourers, wage workers Unskilled 0.366

208
6 Actors and actresses Low WC 0.368
5 Millwrights Skilled 0.371
19 Officers, pilots, pursers and engineers, ship Low WC 0.374
7 Veterinarians High WC 0.376
124 Boilermakers Skilled 0.377
66 Inspectors Skilled 0.378
9 Messengers and office boys Low WC 0.380
31 Linemen, servicemen, telegraph, telephone and power Skilled 0.380
18 Heaters, metal Semi-skilled 0.384
15 Pharmacists High WC 0.391
104 Brakemen, railroad Semi-skilled 0.394
23 Mechanical-Engineers High WC 0.407
75 Sailors and deck hands Semi-skilled 0.407
4 Athletes Low WC 0.408
17 Boarding and lodging house keepers Semi-skilled 0.411
55 Switchmen, railroad Semi-skilled 0.411
4 Draftsmen Low WC 0.413
5 Oilers and greaser, except auto Semi-skilled 0.417
47 Firemen, fire protection Semi-skilled 0.421
14 Inspectors, public administration Low WC 0.425
75 Insurance agents and brokers Low WC 0.428
205 Clerical and kindred workers Low WC 0.430
9 Paperhangers Skilled 0.431
2 Nurses, professional Low WC 0.433
28 Watchmen (crossing) and bridge tenders Semi-skilled 0.434
2 Farm foremen Unskilled 0.434
6 Cashiers Low WC 0.435
1636 Managers, officials, and proprietors High WC 0.437
15 Sheriffs and bailiffs Semi-skilled 0.443
47 Real estate agents and brokers Low WC 0.443
16 Ticket, station, and express agents Low WC 0.446
26 Deliverymen and routemen Semi-skilled 0.446
22 Laundry and dry cleaning Operatives Semi-skilled 0.447
409 Blacksmiths Skilled 0.447
3 Professional, technical and kindred workers High WC 0.449
77 Bookkeepers Low WC 0.450
3 Attendants, professional and personal service Semi-skilled 0.455
35 Barbers, beauticians, and manicurists Semi-skilled 0.460
328 Stationary engineers Skilled 0.463
25 Rollers and roll hands, metal Skilled 0.465
370 Guards, watchmen, and doorkeepers Semi-skilled 0.467
4 Advertising agents and salesmen Low WC 0.467
8 Photographers Low WC 0.469
8 Chemists High WC 0.470
5 Express messengers and railway mail clerks Low WC 0.470
149 Craftsmen and kindred workers Skilled 0.470
31 Collectors, bill and account Low WC 0.476
20 Jewellers, watchmakers, goldsmiths, and silversmiths Skilled 0.478
12 Funeral directors and embalmers Low WC 0.480
84 Meat cutters, except slaughter and packing house Semi-skilled 0.480
36 Boatmen, canalmen, and lock keepers Semi-skilled 0.484
278 Policemen and detectives Semi-skilled 0.486
7972 Labourers Unskilled 0.487
181 Painters, construction and maintenance Skilled 0.488

209
301 Stationary firemen Semi-skilled 0.488
19 Fishermen and oystermen Unskilled 0.492
156 Motormen, street, subway, and elevated railway Semi-skilled 0.493
544 Carpenters Skilled 0.493
51 Tinsmiths, coppersmiths, and sheet metal workers Skilled 0.494
160 Stone cutters and stone carvers Skilled 0.495
425 Brickmasons,stonemasons, and tile setters Skilled 0.496
54 Conductors, bus and street railway Semi-skilled 0.497
143 Tailors and tailoresses Skilled 0.497
9 Artists and art teachers Low WC 0.498
109 Conductors, railroad Low WC 0.499
268 Molders, metal Skilled 0.500
6 Dentists High WC 0.502
2 Engravers, except engravers Skilled 0.503
5 Laundresses, private household Semi-skilled 0.505
72 Hucksters and peddlers Low WC 0.506
46 Attendants, hospital and other institution Semi-skilled 0.507
590 Salesmen and sales clerks Low WC 0.511
4 Charwomen and cleaners Semi-skilled 0.515
134 Janitors and sextons Semi-skilled 0.518
14 Upholsterers Skilled 0.518
12 Agents Low WC 0.519
32 Mail carriers Low WC 0.521
332 Machinists Skilled 0.521
128 Plasterers Skilled 0.523
61 Cooks, except private household Semi-skilled 0.525
18 Editors and reporters High WC 0.527
7 Pressmen and plate printers, printing Skilled 0.527
15 Service workers, except private household Semi-skilled 0.527
102 Private household workers Semi-skilled 0.529
6 Cement and concrete finishers Skilled 0.531
298 Gardeners, except farm, and groundskeepers Unskilled 0.532
17 Practical nurses Semi-skilled 0.533
1657 Operative and kindred workers Semi-skilled 0.535
269 Bartenders Semi-skilled 0.536
188 Plumbers and pipe fitters Skilled 0.539
44 Filers, grinders, and polishers, metal Semi-skilled 0.548
15 Housekeepers and stewards, except private household Semi-skilled 0.550
58 Compositors and typesetters Skilled 0.552
256 Longshoremen and stevedores Unskilled 0.552
14 Bookbinders Skilled 0.554
92 Bakers Skilled 0.560
20 Structural metal workers Skilled 0.565
48 Electricians Skilled 0.567
51 Shipping and receiving clerks Low WC 0.569
7 Pattern and model makers, except paper Skilled 0.570
38 Mechanics and repairmen Skilled 0.571
943 Truck and tractor drivers Semi-skilled 0.572
51 Painters, except construction or maintenance Semi-skilled 0.574
46 Spinners, textile Semi-skilled 0.575
168 Porters Semi-skilled 0.575
160 Weavers, textile Semi-skilled 0.582
2 Auctioneers Low WC 0.586
16 Bus drivers Semi-skilled 0.587

210
20 Elevator operators Semi-skilled 0.590
4 Buyers and dept heads, store High WC 0.590
373 Taxicab drivers and chauffeurs Semi-skilled 0.592
1 Telephone operators Low WC 0.595
68 Dyers Semi-skilled 0.598
8 Dressmakers and seamstresses except factory Semi-skilled 0.613
9 Tool makers, and die makers and setters Skilled 0.614
3 Farm service labourers, self-employed Unskilled 0.615
1 Cranemen,derrickmen, and hoistmen Skilled 0.633
1 Welders and flame cutters Semi-skilled 0.633
1 Social and welfare workers, except group High WC 0.641
29 Roofers and slaters Skilled 0.649
17 Shoemakers and repairers, except factory Skilled 0.654
17 Cabinetmakers Skilled 0.668
2 Dispatchers and starters, vehicle Low WC 0.673
28 Loom fixers Skilled 0.675
3 Electrotypers and stereotypers Skilled 0.678
8 Accountants and auditors Low WC 0.684
83 Waiters and waitresses Semi-skilled 0.687
2 Glaziers Skilled 0.720
1 Teamsters Skilled 0.725
1 Forgemen and hammermen Skilled 0.725
1 Mining-Engineers High WC 0.725
2 Machinists and toolmakers apprentice Semi-skilled 0.725
3 Furriers Skilled 0.857
Total 26,722

211
VI. The Naming of Irish Immigrant Children as a Measure of Assimilation
In this chapter, I will use information about the first names given to the children of
Irish immigrants to draw further conclusions about the assimilation of these
immigrants into American society in the late nineteenth century. The use of children‟s
names as a measure of assimilation is very appealing as it represents another avenue
for assessing the assimilation of immigrants outside of the workplace. The selection of
a non-Irish name for a child by an Irish immigrant father can be viewed as a sign of
how willing that parent is for his children to become more assimilated as an American,
whereas the selection of a distinctly Irish name may reflect cultural persistence and a
reduced desire to assimilate. The naming of children can also be seen as a reflection of
how the parents see themselves within the context of their new host society, as well as
what aspirations they hold for their children.
In the literature, the study of children‟s names has to date received only limited
attention from economists and sociologists. According to Lieberson and Bell (1992),
“sociologists in the United States rarely study first names despite their distinctive
theoretical potential and despite the existence of excellent large-scale data sets.”239
They argue that first names can “demarcate subgroups of a society along such lines as
gender, race and ethnicity” and, more important for this dissertation, they can also
“signal shifts in assimilation and identification.”240 In addition, as noted by Rossi
(1965), “American parents have considerable leeway in choosing their children‟s
names,” and as a result of this “permissive environment,” the naming patterns of
239
Lieberson and Bell (1992), p. 513. 240
Lieberson and Bell (1992), p. 514.

212
children in the US can be used as effective social indicators.241 Zelinsky (1970) goes so
far as to argue that the choice of a child‟s name “is closer to fulfilling the criteria for an
ideal cultural measure than any other known item.”242 Lieberson (2000) has also
provided us with an excellent summary of the influences which impact the pattern of
name usage in the US: “the imagery associated with each name, the notions parents
have about the children‟s future, estimates of others‟ responses to a name, the
awareness and knowledge of names through the mass media and other sources,
parent‟s beliefs about what names are appropriate for people of their status, and
institutionalised norms and pressures.”243 Lieberson (2000) argues that as institutional
pressures such as the role of extended family and religious rules are reduced, name
choices are “increasingly free to be matters of taste.” He concludes by arguing that
shifts in naming patterns can be analysed in terms of “the combined impact of
exogenous forces, internal mechanisms of fashion change, and idiosyncratic historical
conditions.”244
There are several elements of Lieberson‟s (2000) theory of child naming that can be
tested with my sample data on Irish immigrants. With respect to the relationship
between the naming of children and assimilation, Lieberson (2000) argues that it
would be extremely difficult for an ethnic group to avoid the influence of the larger
society on their naming patterns, mentioning in particular the influence of media,
literacy and mobility aspirations.245 In this chapter, I will seek to assess to what degree
the Irish in America were able to resist the influence of these external forces on their
naming patterns, or whether, in fact, they sought a greater level of assimilation for
241
Rossi (1965), p. 499. 242
Zelinsky (1970), p. 746. 243
Lieberson (2000), p. 24. 244
Lieberson (2000), p. 24. 245
Lieberson (2000), p. 221.
213
themselves and their children by increasingly choosing non-Irish names for their
children. In addition, Lieberson (2000) also argues that the naming of children can be
influenced by external factors such as urbanisation and education. He argues that both
of these forces would help to reduce the role of tradition and lead to “greater
independence of judgement” by parents in the naming of their children.246 Lieberson‟s
views on the impact of urbanisation and education on naming patterns are not solely
limited to immigrant parents, but would apply to all parents in a society. Although we
have found that education levels (as measured by literacy) were quite uniform among
Irish immigrants in the late nineteenth century, urbanisation does represent a measure
that we can use to test whether Lieberson‟s theory is applicable in the case of late
nineteenth century Irish immigrants. In this chapter, we will also examine the impact
of urbanisation on the naming patterns of Irish immigrant parents to determine whether
this external force in fact reduced the use of more traditional Irish names in this time
period.
One potential shortcoming of using names to assess assimilation and cultural
persistence is the issue of data quality. The names to be analysed in this chapter are
drawn from US census data from the late nineteenth and early twentieth centuries.
Hence the influence of the census enumerator could have a significant impact on the
reliability of the name data. In particular, if an enumerator was to change or anglicise
names with which he or she was not familiar, this could influence the results of the
analysis. While there is only limited research available to address this issue, Watkins
and London (1994) have provided us with some comfort on the reliability of US
census data. They addressed the issue of whether names of immigrants taken from the
246
Lieberson (2000), p. 43.

214
1910 US census could be compared with names taken from other sources in the US in
order to assess the extent of name changing or anglicisation of foreign names by
census enumerators. In a study of names taken from the death certificates of funeral
homes that specialised in dealing with turn of the century immigrants in the state of
Rhode Island, they found “a reassuringly high degree of overlap” when comparing the
most popular names from this source versus US census data for 1910.247 Watkins and
London (1994) felt that since the funeral homes in question would have had experience
with immigrant (in this case Jewish) names, that these clerks would have been unlikely
to anglicise ethnic names. The comparison versus names drawn from the US census
would then provide a clear indication of the degree of name changing or anglicisation
by census enumerators.
Using data on children‟s names, this chapter will seek to answer the following
questions. What does the naming of children tell us about the degree of assimilation of
their parents? Did Irish immigrants who married non-Irish born spouses more often
give their children non-Irish names? Are there certain socio-economic characteristics
of these Irish immigrant households that are more strongly associated with non-Irish
children‟s names? How have the naming patterns of Irish children‟s names changed
over the course of the period from the late nineteenth century until the end of the age
of mass migration in the 1920s, and what does this tell us about the relationship
between child naming and assimilation over this time period?
My approach to this chapter relies on the ability to locate the children of Irish
immigrants in US census data. Using information variables provided in the IPUMS
247
Watkins and London (1994), pp. 187-8.

215
data extraction system regarding the location of the father and his spouse, it is possible
to locate the children of Irish immigrants in my existing sample where the spouse was
present in the household at the time of the 1900 US census. For the 611 households in
my sample where the Irish immigrant was married with the spouse present, I was able
to locate their children. With the location information of the children, it is then
possible to go back into the database and obtain their names. This process resulted in a
total of 1,976 children‟s names of Irish immigrants in my sample, which is linked to
the significant amount of socio-economic information regarding their parents available
in that sample.
In this chapter, I will also seek to analyse the naming of Irish immigrant children using
the complete US census sample data available from IPUMS. This approach, while not
linked to my core matched sample of Irish immigrants, will allow me to access a much
broader distribution of name outcomes. In addition, I will also seek to analyse the
naming of Irish immigrant children in several prior and subsequent US censuses,
enabling me to trace patterns across cohorts. Using the IPUMS datasets, I will
construct samples of Irish immigrant children‟s names from the 1870s through to the
1920s,248 thus permitting me to analyse the relationship between children naming
patterns and assimilation over this critical time period for Irish immigration. For these
cohort samples, the IPUMS system allows me to screen for children born to an Irish
immigrant father, and to ensure that the father is the natural father of the child and not
a step father. This distinction is critical as it would have been the natural father who
would have been involved in the naming of a child.
248
Irish immigration to the US declined significantly in the 1920s due to increased restrictions on
immigration put in place by the US government. The period from the 1870s until the 1920s thus
represents an ideal timeframe to assess this relationship between naming patterns and assimilation.

216
In addition to assembling these samples of names of Irish immigrant children born in
the US, I have also located a sample of the first names given to children born in Ireland
in the year 1900. This sample, which comprises 3,000 boys and girls names, was taken
from the official Registry of Births for Ireland, and was compiled by Coghlan
(1979).249 The sample was drawn from the register which provides the names of all the
children born in Ireland in that year. With this sample information, it will be possible
to identify the most commonly used names given to children born in Ireland in 1900. I
will then be able to apply this list of the most common Irish children‟s names to the
children in my samples of Irish immigrant children born in the US. The results of this
comparison will allow me to draw conclusions about the degree of assimilation
achieved by their parents as measured though the lens of children‟s names.250
One potential criticism of this approach is the use of a single sample of Irish names to
compare to the names given to children in the US over several decades spanning the
late nineteenth and early twentieth centuries. It is certainly possible that naming
patterns may have been changing in Ireland as well as in the US in this time period.
Using a sample of names from 1900 may not reflect what an “Irish” name is in the
years prior or subsequent to 1900. However, there are two reasons why this approach
of using a single sample is in fact valid. First of all, Lieberson (2000) found that there
was little change in the most common names given to children in Western nations until
the twentieth century. He noted that “Western nations show remarkably similar
movements from virtually no fashion in names…to an increasingly rapid turnover in
names” in the late twentieth century.251 In fact for England and Wales, as well as for
249
Ronan Coghlan, Irish Christian Names (London: 1979). 250
In my comparative analysis of children‟s names, I have grouped similar names together under one
name. For example, “Anne” and “Annie” are considered to be one name for the purposes of my analysis. 251
Lieberson (2000), p. 36.

217
Scotland - the countries likely to have naming patterns most similar to Ireland,
Lieberson (2000) found little change in naming patterns for male and female children
until the early twentieth century for England and Wales, and the mid-twentieth century
for Scotland.252 As such, the use of a sample of names given to children in Ireland in
1900 to compare to children‟s names given in the three decades immediately preceding
1900 should in fact be quite robust. Secondly, as it relates to the period immediately
following 1900, the use of a sample of Irish names dating from 1900 is also
appropriate. Immigrants coming to the US from Ireland in the late nineteenth and early
twentieth century would have likely thought of Irish names as the ones that were
popular when they left the country, and not necessarily the ones that may have become
popular in the years following their departure from Ireland. As the Irish immigrants
who would have had children in the decades of the 1910s and 1920s would have
immigrated prior to these periods, the names they would have considered to be popular
Irish names would have been those given to children in prior years. As such, using a
1900 sample of Irish children‟s names should also be effective for this group. In
summary, though relying on a single sample of Irish children‟s names is not ideal,
there are several reasons why it is nonetheless valid and appropriate for this study.
In this chapter, my contribution to the literature will be to assess the assimilation of
Irish immigrants using the naming of children as the unit of measurement. The use of
children‟s names as a measure of assimilation has rarely been utilised by other
researchers, and has not been used to examine the experience of Irish immigrants in
this time period.
252
Lieberson (2000), pp. 38-39. Lieberson did not have name data for Ireland in this timeframe, nor was
I able to locate any other sources of such data in the literature.
218
As mentioned in Chapter I, the literature on naming has frequently relied on a
convention of using the 20 most common names in a given category to conduct
analyses on naming patterns. In the works of Levitt and Dubner (2005), Lieberson
(2000) and Watkins and London (1994), the authors frequently use the 20 most
common names in a given category and then look for overlaps among different
categories as a means of making their comparisons. This method provides a robust yet
manageable approach for working with this non-numeric data. In this chapter, I will
also use this convention. Coghlan‟s (1979) sample of names from the official Registry
of Births for Ireland for the year 1900 allows us to identify the most common names
given to the children of Irish parents in that year. Because his sample also includes the
number of times a name appeared in the sample, it is possible to rank names by their
popularity. Table 6.1 lists the 20 most common names given to boys and girls born in
Ireland taken from Coghlan‟s (1979) sample in order of their popularity.

219
Table 6.1
20 Most Common Names in Sample of 1900 Irish Birth Registry
Boys Girls
John Mary
William Anne James Margaret
Thomas Elizabeth Patrick Sarah Robert Ellen
Michael Catherine Samuel Bridget
Joseph Jane George Agnes David Isabella
Richard Kate Edward Norah
Matthew Florence Frederick Johanna Hugh Frances
Andrew Julia Charles Kathleen
Denis Alice Francis Emily
There are several aspects of this list of the 20 most popular names given to Irish-born
children in the year 1900 that are striking to this author. First of all is the lack of
virtually any names that have distinctly Irish roots. Of the 20 most popular boys and
girls names listed above, only Bridget and Norah have their original roots in the Irish
language.253 The remaining 38 names have their origins in other nations and languages,
and were subsequently adopted for use in Ireland. Even Patrick, perhaps the name most
closely associated with Ireland, is drawn from the Latin language. The name Patrick is
derived from the Latin adjective patricius, which signified membership in the Roman
aristocracy. Its popularity in Ireland stems from St. Patrick, the patron saint of Ireland,
253
Coghlan (1979), p. 24. Bridget in Old Irish means the “high one,” and is also the name of a
celebrated Irish saint. Norah is a form of Honora, which is also a name of Irish origin.

220
who was an early Christian missionary in the country.254 Of the names listed in Table
6.1 above, the largest number comes directly or indirectly from the Hebrew language
(John, James, Michael, Samuel, Joseph, David, Matthew, Mary, Anne, Elizabeth,
Sarah, Jane, and Johanna). Names of Greek descent make up the next biggest group
(Agnes, George, Andrew, Denis, Margaret, Ellen, Kate and Kathleen). Germanic
names are the final significant group, all of which happen to be boy‟s names (William,
Robert, Richard, Frederick, Hugh and Charles). Other names in the list have their roots
in Latin, French, Italian, Anglo-Saxon and Aramaic.255 As one might expect, many of
the most popular names on the list above such as Mary, Anne, Elizabeth, John, James
and Thomas are well known from the Bible, and would have been fairly common in
any English speaking Christian nation in this time period. Interestingly, none of the 20
most popular names in use in Ireland in 1900 were in their Gaelic form,
notwithstanding the fact that the Gaelic language had been the principal language used
in Ireland until the mid nineteenth century.256 Despite the lack of historical Irish roots
in virtually all of the names listed in Table 6.1, these names were those that were the
most commonly used by parents of babies born in Ireland in 1900, and they will be
considered to be “Irish” in the analysis of naming patterns to be undertaken in this
chapter.
In contrast, Table 6.2 identifies the 20 most common names for children born in the
US from my sample of Irish immigrants. As can be seen from the list in Table 6.2, a
majority of the names would also appear on the 20 most common Irish names (i.e.
children born in Ireland in 1900 as drawn from the sample of the Irish Birth Registry
by Coghlan (1979)). With respect to the male children, 15 out of 20 names are in
254
Coghlan (1979), p. 97. 255
Coghlan (1979), pp. 9-121. 256
Coghlan (1979), p. 2.
221
common between the two lists, as well as 13 of the top 14 most common names. As for
the female children, the overlap is not quite as high, with just 12 of the 20 most
common names also appearing on the list of children born in Ireland. Similar to the
most common names of children born in Ireland, there is again a lack of any Gaelic
names on the list of the American born children. As these children were born in the
United States where Gaelic would not have been a common language, perhaps this
result is not surprising. One final observation is that the top 20 Irish names constituted
63% of the total sample of names drawn by Coghlan (1979) from the Irish Birth
Registry in 1900. For my Irish sample, the corresponding figure was 65%. Hence the
distribution of the 20 most common names is very similar between the two samples,
and provides a robust basis for comparison as these names make up almost two-thirds
of the overall samples.
One initial conclusion that could be drawn from this comparison of the 20 most
popular names is that Irish immigrants in the US had quite similar naming patterns to
parents living in Ireland in this time period. Particularly for boys, there is very
significant overlap between the most popular names in both locations. This initial
result would signal that cultural persistence in naming patterns may be quite strong for
first generation Irish immigrants living in the US. In the remainder of this chapter, we
will be analysing this question in further detail.

222
Table 6.2
20 Most Common Names in Irish Immigrant Sample
Boys Girls
John* Mary*
James* Anne* William* Margaret*
Thomas* Catherine* Edward* Ellen* Joseph* Elizabeth*
Frank* Kate* Charles* Alice*
Robert* Nellie George * Sarah* Daniel Agnes*
Patrick* Maggie Michael* Florence*
Richard* Julia* Martin Rose Henry Gertrude
Hugh* Mamie Harry Jennie
David* Helen Arthur Theresa
* These names also appear in the list of the 20 most common names from the sample from the 1900 Irish Birth Registry by Coghlan (1979) as listed in Table 6.1.
Delving further into the issue of child naming patterns among Irish immigrants in the
US, the following analysis uses this list of the 20 most common Irish names to
examine the socio-economic characteristics of the parents of children born to Irish
immigrants in the US. As described earlier in this chapter, my matched sample data
provides significant socio-economic information regarding the parents of the 1,976
children in my sample. A summary of this data, categorised based on whether a child
has one of the 20 most common Irish names, is presented in Table 6.3.

223
Table 6.3
Summary Statistics of Parents from
Irish Immigrant Sample Based on Child Name (a)
Variable Irish Name Non Irish Name Observations 1,292 684
Age
1880 30.8 years 31.1 years
1900 50.8 51.1
Age at Marriage (1900) 27.1 years 27.4 years
Rural Status
1880 41.2% 44.3%
1900 34.9%*** 45.0%
Home Ownership (1900) 55.2% 58.8%
Literacy (1900)
Read and write English 93.2% 93.7%
Read or write only 0.6% 0.4%
Spouse Fertility (1900)
Avg. Children Ever Born 8.2 8.2
Avg. Children Surviving 6.5 6.7
Implied Mortality Rate 20.7% 18.0%
Spouse Age (1900) 45.3 years 45.1 years
Spouse Age at Marriage (1900) 21.6 years 21.4 years
Spouse Birthplace (1900)
Ireland 56.8%*** 47.8%
Other Foreign Country 8.6% 7.5%
US 34.6% 44.7%
Spouse Literacy (1900)
Read and write English 91.1%** 93.4%
Read or write only 2.7% 1.7%
Spouse in workforce (1900) 1.9% 1.6%
(a) Names are grouped based on the 20 most popular names in Ireland in 1900 and data is organised on
the basis of child name. Hence parent data is not mutually exclusive.
***Differences between the individuals in the two samples are significant at the 1, 5 and 10% levels,
respectively, using a t test for age and fertility variables, and the chi squared test of independence for the
remaining variables.

224
Table 6.3 organises the children of the Irish immigrants in my sample into those with
and without one of the 20 most common Irish names. The results in the table are thus
organised on the basis of child name.257 As Table 6.3 illustrates, the parents of children
who gave their children a more common Irish name had noticeable and statistically
significant differences from those parents who did not do so. Those Irish immigrant
fathers who gave their children Irish names were more likely to live in urban areas and
were much more likely to have married an Irish born spouse. Their spouses were also
less literate than those who had not given their children Irish names. Given that these
common Irish names, though popular in Ireland, were not strictly Irish in terms of their
provenance, the differences that exist among the parents electing to choose them
versus those who did not are all the more striking.
Another means to assess the relationship between Irish immigrant naming patterns and
socioeconomic outcomes is through an analysis of occupational levels and mobility.
Table 6.4 presents such an analysis, using the same occupational classifications first
described in Chapter II. As Table 6.4 illustrates, those Irish immigrants who gave their
children a more common Irish name experienced lower levels of occupational mobility
in the period between 1880 and 1900. At the end of this period, they were less likely to
be in white collar employment or in farming, and were more likely to be engaged in
semi- or un-skilled work. Almost half of those Irish immigrants who gave their
children Irish names were employed in semi- or unskilled work in 1900, versus a
figure of approximately one-third for those Irish immigrants with non-Irish naming
patterns.
257
Under this approach, the parent data is not mutually exclusive, as a parent could have multiple
children, some with an Irish name and some without.

225
In both of these socioeconomic comparisons, the Irish immigrant fathers who gave
their children Irish names more closely resembled the Irish immigrants who married an
Irish-born spouse (as discussed in Chapter IV). Similar to Irish immigrants who
married an Irish-born spouse, Irish immigrants who gave their children a more
common Irish name would appear to have been less assimilated into American society.
Like the married Irish subset of my sample, they appear to underperform in the
workplace and have socioeconomic characteristics that are distinctly different from
those Irish immigrants who gave their children less Irish names. In both these respects,
they less closely resemble the native born than do the Irish immigrants who chose not
to give their children an Irish name.

226
Table 6.4
Comparison of Occupational Groupings of Irish Immigrants Based on Child
Name
1880-1900
1880 Irish Names % Cum.
High WC 5.9 5.9 Low WC 2.9 8.8 Farmer 10.8 19.6
Skilled 17.1 36.7 Semi-skilled 31.3 68.0
Unskilled 32.0 100.0
1900 Irish Names % Cum. % Change from 1880
High WC 9.7 9.7 64% Low WC 6.6 16.3 128% Farmer 18.4 34.6 70%
Skilled 19.1 53.8 12% Semi-skilled 22.4 76.1 -28%
Unskilled 23.9 100.0 -25%
1880 Non-Irish Names % Cum.
High WC 5.1 5.1 Low WC 3.8 8.9 Farmer 16.1 25.0
Skilled 17.4 42.4 Semi-skilled 28.1 70.5
Unskilled 29.5 100.0
1900 Non-Irish Names % Cum. % Change from 1880
High WC 11.8 11.8 131% Low WC 7.0 18.9 84% Farmer 24.3 43.3 51%
Skilled 21.2 64.3 22% Semi-skilled 18.4 82.8 -35%
Unskilled 16.3 100.0 -45%

227
To further study the relationship between child naming and individual characteristics
available in the US census data; I have also estimated a logistic regression using my
matched sample data. Table 6.5 presents the results of a logistic regression analysis
which assesses the probability of an Irish immigrant giving a child an Irish name.258
Using a dependent variable which identifies whether or not the child‟s name is one of
the 20 most common Irish names, the model has as its independent variables:
intermarriage (i.e. whether the immigrant is married to a non- Irish born spouse), age
and spouse age, year of marriage, number of years living in the US (at the time of birth
of the relevant child), the immigrant‟s age at time of immigration to the US, rural
status, literacy and spouse literacy. This logistic regression analysis allows me to
assess the relationship between these socio-economic variables and the likelihood of an
Irish immigrant giving his child an Irish name. The results of this analysis will
illustrate which socio-economic characteristics are positively and negatively associated
with the giving of an Irish name to children of Irish immigrants in the US in the late
1800s.
The results in Table 6.5 indicate that intermarriage, geographic location in the form of
rural status and the literacy of the spouse are all significant factors in the giving of an
Irish name to a child by an Irish immigrant father in this time period.259 An Irish
immigrant who married a non-Irish spouse was less likely to give their child a common
Irish name, as was one who married a literate spouse. On the other hand, an Irish
immigrant living in an urban location was much more likely to give his child an Irish
258
For the avoidance of doubt, an Irish name is one of the 20 most common names as drawn by Coghlan
(1979) from the Irish Birth Registry in 1900. This list is shown in Table 6.1. 259
Variables related to immigrant age, years living in the US at the time of the birth of the child, and
age at year of immigration are all statistically significant at the 1% confidence level. While the inclusion
of these variables improves the robustness of the estimation results, none of these variables have a
material effect on choosing an Irish name for a child.

228
name. These associations are statistically significant at the 1% confidence level for
intermarriage, and at the 10% confidence level for rural status and spouse literacy.
Using the marginal effects column (dy/dx), we can also estimate the impact of a
discrete change in an independent categorical variable (in this case, intermarriage, rural
status, and spouse literacy) on the change in our dependent variable (the naming of a
child with an Irish name). In the case of intermarriage, the probability of an Irish
immigrant married to a non-Irish spouse giving their child an Irish name was 7% lower
than if that spouse was Irish born. With respect to rural status, the probability of an
Irish immigrant living in an urban location having given their child an Irish name was
4% higher than if he lived in a rural area. Finally, the probability of an Irish immigrant
who married a spouse who could read and write in the English language giving their
child an Irish name was 8% lower than if that spouse was illiterate.
While the logistic regression model cannot explain the reasons for these outcomes, it is
certainly possible to speculate as to their potential causes. In the case of intermarriage,
it seems perfectly reasonable that an Irish immigrant, who was willing to marry a
spouse who was not from Ireland, would also be more willing to choose a non-Irish
name for a child born to that spouse. One possible explanation is that the spouse may
not have been comfortable with a more traditional Irish name, given her non-Irish
background. More interestingly, perhaps the parent‟s selection of a non-Irish name for
his child is a sign of their willingness for that child to become more assimilated in
American society and perhaps have better opportunities in the labour market.260 In this
260
To assess whether there actually was a relationship between non-Irish names and subsequent
assimilation and occupational mobility, I created a sample of 42,000 children of Irish immigrants who
were of working age in 1900. An analysis of their occupations showed that there was no statistical
difference in the occupational outcomes of those children who had an Irish name versus a non -Irish one.
Hence the concern that Irish immigrant parents may have had about the influence of their naming

229
respect, it may be similar to his decision to marry a non-Irish spouse. With respect to
spouse literacy, the lower probability of selecting an Irish name may also be related to
intermarriage. As we saw in Chapter IV, non-Irish born spouses were more literate
than Irish born ones. As non-Irish born spouses are also less likely to choose an Irish
name for their child, it is also likely that literacy of the spouse would have a similar
relationship.
As for the relationship between rural status and child naming, a possible cause of this
outcome could be the influence of the surrounding community on the naming of
children. As Irish immigrants in the US were overwhelming urban in the late
nineteenth century, it may be that the proximity of other Irish immigrants may have led
to a greater use of Irish names among the urban Irish. Irish immigrants living in more
rural areas would likely have had less exposure to other Irish immigrants and a much
greater exposure to native born Americans. The greater degree of exposure to other
Irish immigrants in urban areas is potentially a cause of the increased propensity of
Irish immigrants living in urban areas to have named their children with more common
Irish names in this period.
Returning to Lieberson‟s (2000) theory that the force of urbanisation would help to
reduce the role of tradition and lead to “greater independence of judgement” by parents
in the naming of their children,261 it would appear that this did not hold true for Irish
immigrants in turn of the century America. As these logistic regression results (as well
as the results of the Summary Statistics analysis in Table 6.2) illustrate, Irish
immigrants living in urban areas were actually more likely to give their child an Irish
choices on the subsequent occupational mobility of their children does not appear to have been
warranted. 261
Lieberson (2000), p. 43.

230
name than those that lived in rural areas. Any benefit that Lieberson (2000) may have
attributed to urbanisation reducing the role of tradition in the naming process appears
to have been more than offset by the influence of other Irish immigrants (as well as
second and third generation Irish-Americans) who were also living in urban areas.262
In a separate logistic regression analysis not reported here, I identified those names
which appeared among the Top 20 Irish names in each of my samples from the 1870s
through to the 1920s. As mentioned in the introduction to this chapter, these samples
were drawn using the complete US census sample data available from IPUMS for each
decade. Using a dependent variable which identifies whether or not the child‟s name is
one of the 20 most common Irish names in each of these decades, I ran a logistic
regression using the same independent variables as described above. The results of this
regression were essentially the same as those described above and presented in Table
6.5.
262
Lieberson (2000), p. 10. Lieberson might argue that the preponderance of Irish immigrants living in
urban areas in this timeframe was an “idiosyncratic historical development,” to use his phrase for one of
his three major influences on naming patterns. Nonetheless, it is clear from the evidence presented
above that urbanisation did not the have the effect on reducing the role of tradition that he might have
expected.
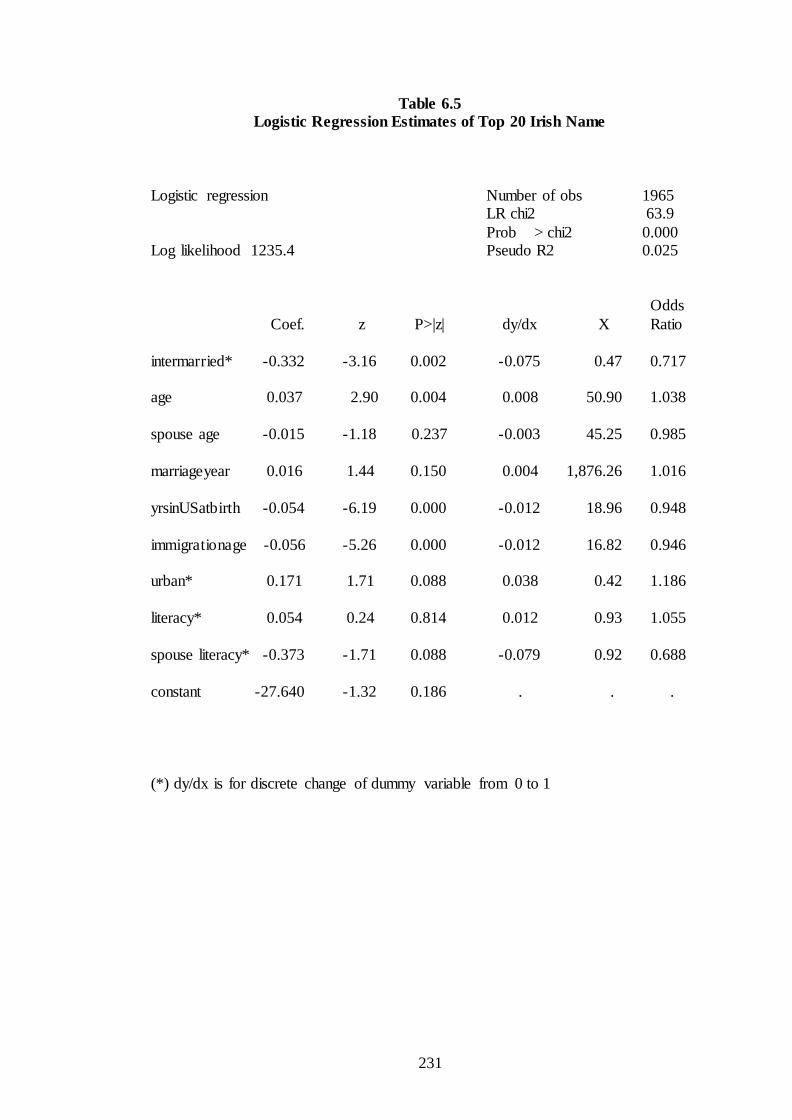
231
Table 6.5
Logistic Regression Estimates of Top 20 Irish Name
Logistic regression Number of obs 1965 LR chi2 63.9
Prob > chi2 0.000 Log likelihood 1235.4 Pseudo R2 0.025
Odds
Coef. z P>|z| dy/dx X Ratio
intermarried* -0.332 -3.16 0.002 -0.075 0.47 0.717 age 0.037 2.90 0.004 0.008 50.90 1.038
spouse age -0.015 -1.18 0.237 -0.003 45.25 0.985
marriageyear 0.016 1.44 0.150 0.004 1,876.26 1.016
yrsinUSatbirth -0.054 -6.19 0.000 -0.012 18.96 0.948
immigrationage -0.056 -5.26 0.000 -0.012 16.82 0.946 urban* 0.171 1.71 0.088 0.038 0.42 1.186
literacy* 0.054 0.24 0.814 0.012 0.93 1.055
spouse literacy* -0.373 -1.71 0.088 -0.079 0.92 0.688
constant -27.640 -1.32 0.186 . . .
(*) dy/dx is for discrete change of dummy variable from 0 to 1

232
Building upon the analysis of the impact of geographic clustering on the assimilation
of Irish immigrants which was presented in Chapter V, I also examined the influence
of such clustering on the naming patterns of Irish immigrants. In order to complete this
analysis, I created a new and much larger sample of children born to Irish immigrants
who were present in the IPUMS 2.5% 1900 US census sample. The purpose of this
new sample was to maximise the universe of potential Irish immigrant children in the
sample so as to better ascertain the influence of geographic clustering at the county
level on the naming patterns of Irish immigrants. This new sample includes those
children who were born to an Irish immigrant family just before the 1900 US census
date. By limiting the sample to children who were just prior to the time of the 1900 US
census,263 I am able to explore the relationship between the naming of children and the
county in which their parents were highly likely to have lived at that time. This new
sample totalled 6,048 children born in the US to families with an Irish immigrant
father. I again employed a logistic regression analysis to assess the probability of an
Irish immigrant giving a child an Irish name, with a dependent variable which
identifies whether or not the child‟s name is one of the 20 most common Irish names.
Critically, in addition to the independent variables used in the regression analysis
presented in Table 6.5, I have added a variable which provides the percentage of Irish
immigrants relative to the overall population living in each county in the US in 1900.
The results of this regression are presented in Table 6.6.
As Table 6.6 illustrates, geographic clustering does have a meaningful and statistically
significant impact on the naming patterns of Irish immigrants in this time period. The
regression analysis shows that giving the child of an Irish immigrant one of the 20
263
I have chosen to limit this sample to children two years and younger at the time of the 1900 US
census.

233
most popular Irish names is positively related to the level of geographic clustering,
even when controlling for other important variables such as ethnic intermarriage and
living in an urban location. The marginal effect output again allows us to calculate the
magnitude of this effect. If we were to assume that an Irish immigrant moved from a
county with no other Irish immigrants to a county in the greater Boston area with the
highest percentage of Irish immigrants in 1900 (12.02%), the effect of this change in
geographic clustering, holding other variables constant, would be to increase his
likelihood of giving his child an Irish name by 6%. Relative to the share of children
with Irish names in my sample, this would represent a 9% increase. This result again
confirms the meaningful influence that geographic clustering had on the assimilation
of Irish immigrants in the late nineteenth century.

234
Table 6.6
Logistic Regression Estimates of Top 20 Irish Name using Geographic Clustering
Logistic regression Number of obs 6048 LR chi2 142.90
Prob > chi2 0.0000 Log likelihood -3758.5 Pseudo R2 0.0187
Coef. z P>z dy/dx x Odds Ratio
intermarried* -.388 -6.17 0.000 -.087 0.35 0.678
age -.049 -1.47 0.142 -.011 36.41 0.952 spouse age .017 2.20 0.028 .004 32.26 1.017
marriageyear .034 4.49 0.000 .007 1890.59 1.034
yrsinUSatbirth .044 1.33 0.185 .010 16.95 1.045
immigrationage .050 1.50 0.133 .011 18.46 1.051
urban* .135 1.84 0.066 .030 0.81 1.144 literacy* -.120 -0.83 0.409 -.026 0.96 0.887
spouse literacy* -.221 -1.55 0.121 -.047 0.95 0.802
percent_Irish .022 2.39 0.017 .005 6.12 1.023
constant -62.835 -4.40 0.000 . . .
(*) dy/dx is for discrete change of dummy variable from 0 to 1

235
Another relevant comparison is how the naming of Irish immigrant children in the US
compared to the child naming patterns of native born parents. A significant overlap
between the names chosen by Irish immigrants with those popular among native born
Americans would indicate an increased degree of assimilation for these immigrants. In
addition, this analysis would also permit me to assess Lieberson‟s (2000) view that it is
extremely difficult for an ethnic group to avoid the influence of the larger society on
their naming patterns, given the strong influences of media, literacy and mobility
aspirations.264 As I was unable to find a sample of native born children‟s names in the
US in this time period, I created my own sample. Using the IPUMS data for the 1900
US census, I created a sample of approximately 210,000 children who were born in the
US to native born parents in the last three decades of the nineteenth century. This time
period fits nicely with that of my Irish sample, which is drawn from a similar
timeframe. In order to be selected for this sample, the child and both of his or her
parents had to have been born in the US, and only the children who could be accurately
matched to their birth father were included in the sample.
The first comparison to be made with this sample data is to examine the overlap
between the 20 most common names in the native sample with those from the Irish
immigrant sample. As Table 6.7 illustrates, there are significant differences between
the most common names in the Irish and native born lists, in particular for girls. For
the boys, 12 of the top 20 native born names would also appear in a similar list for the
Irish immigrant sample. Included in this group of 12 are the eight most common native
born male names. For the girls, the comparison of the most common names yields
surprisingly few children‟s names in common between the Irish and native born
264
Lieberson (2000), p. 221.
236
samples. Just five of the top 20 native born names would also appear on a similar list
from the Irish immigrant sample. And only two of the five most common names for
native born girls would appear in the list of most common names for Irish immigrant
children. Thus this initial comparison of Irish and native born naming patterns would
indicate only modest assimilation by Irish immigrants in this timeframe. In addition,
the distinct difference between the naming patterns of the Irish and native born with
respect to gender is striking. It would appear that for girls born to Irish immigrant
parents in the late nineteenth century, there was limited desire to choose a name that
was common among native born girls.

237
Table 6.7
20 Most Common Names in Native Born Sample
Boys Girls
William* Mary*
John* Annie Charles* Elizabeth*
James* Lillie George* Minnie Frank* Florence*
Robert* Bessie Joseph* Emma
Harry Ethel Henry Nellie Walter Sarah*
Thomas* Edna Edward* Grace
Frederick* Ruth Arthur Maud Clarence Ida
Samuel * Bertha Albert Alice*
Raymond Clara Jessie Helen
* These names are also included in the list of the 20 most common names from my Irish immigrant sample.
To further assess the degree of similarity between the Irish and native born naming
patterns, I also calculated the Duncan Dissimilarity Index for the names of children in
the Irish and native born samples. As previously discussed, the DDI is an index which
compares the similarities and differences between two distributions. The index takes a
value between zero and one, with one reflecting no overlap between distributions and
zero representing identical distributions. The index may be interpreted as the
proportion of subjects in a group that would have to change category in order to obtain
the same relative distribution as the group to which it is being compared. The results of
the DDI analysis indicate that there were significant differences in the naming patterns
of the Irish and native born in this time period. The DDI calculation was .569, which

238
indicates that more than half of the names given to Irish or native born children would
have to change in order for the two distributions to match each other.
Finally, I also calculated the percentage of names in my native born sample which
were among the top 20 most common names in the sample. In contrast to the Irish born
sample, where 65% of the names were among the 20 most common ones, just 38% of
the names in the native born sample were similarly among the 20 most common
names. The significantly lower usage of the most popular names among native born
children stands in stark contrast to the much higher percentage found among Irish
immigrant parents in this timeframe.
Taken together, these comparative analyses of the naming patterns found in the Irish
immigrant and native born samples reveal a distinct lack of assimilation by the Irish
immigrants in my sample. As the comparison of the 20 most common names
highlights, there was limited overlap between the favourite names of the Irish and
native born, in particular among girls names. As for the DDI analysis, more than half
the names of Irish or native born children would have to change in order for the two
distributions to resemble each other. Finally, the Irish were much more likely to choose
from a smaller number of more popular names than were the native born, where just
38% of the names in the native born sample were among the 20 most common. These
results further support the argument that first generation Irish immigrants in America
did not assimilate quickly as measured by the names that they chose for their children.
My results indicate that the Irish were highly likely to use names that were also
popular among parents in Ireland in this timeframe. And the comparison of the Irish
and native born samples also supports the argument for continued cultural persistence

239
in naming patterns with limited assimilation, particularly as it relates to the naming of
girls. These results also find that Irish immigrants who married an Irish born spouse or
lived in urban areas were more likely to adopt an Irish name for their child. In this
respect, these results also reinforce the analysis and conclusions in Chapter IV, where
Irish immigrants who married an Irish-born spouse appeared to have been less
assimilated into American society. Similar to the married Irish subset of the Irish
sample, Irish immigrants who gave their children Irish names under perform in the
workplace and have socioeconomic characteristics that are distinctly different from
those Irish immigrants who gave their children less Irish names. In both these respects,
they less closely resemble the native born than do the Irish immigrants who chose not
to give their children Irish names.
In summary, the results presented in this section indicate continued cultural persistence
by Irish immigrants in the US in the late nineteenth century as it relates to their choice
of names for their children. These results also clearly support the argument that
assimilation was not a uniform process for Irish immigrants in America in this time
period, but that it was in fact a multi-dimensional one. And with respect to the
dimension of child naming, the Irish appear to have been slow to release this tie to
their former homeland and adapt their choice of children‟s names to their new society.
With respect to Lieberson‟s (2000) theory that it would be extremely difficult for an
ethnic group to avoid the influence of the larger society on their naming patterns, the
evidence presented in this section would appear to contradict this view for first
generation Irish immigrants.

240
As mentioned in the introduction to this chapter, I will also analyse the naming of Irish
immigrant children using the complete US census sample data available from IPUMS.
One benefit of this approach is that it allows me to access a much broader distribution
of name outcomes than are available in my matched sample of Irish immigrants. In
addition, I am also able to analyse the naming of Irish immigrant children in US
censuses both preceding and following my matched sample timeframe, enabling me to
trace child naming patterns across time periods. Using the IPUMS datasets, I have
constructed samples of Irish immigrant children‟s names from the 1870s through to the
1920s, thus permitting me to analyse the relationship between children naming patterns
and assimilation over this critical time period for Irish immigration to the US.
In Appendices 6.1 and 6.2, I have assembled the 20 most common names given to
children of Irish immigrant fathers born in the US in each of the decades from the
1870s through the 1920s, using the IPUMS US census datasets for each of these
decades. With respect to the most common boys names presented in Appendix 6.1,
there are several interesting findings. What is perhaps most striking is the lack of
change in this list over such a lengthy time period. The 12 most popular names given
to second generation Irish boys in the 1870s remain among the top 20 most popular
names in each decade under study.265 In total, there are 14 names which appear in the
list of the 20 most popular names in every decade. These names, which we will analyse
in greater detail, are listed in Table 6.8.
With respect to the 20 most popular names given to second generation Irish girls in this
same time period, the results are quite different. There is very significant change in the
265
These names are John, James, William, Thomas, Michael, Joseph, Edward, Patrick, Frank/Francis,
Charles, George and Robert.

241
composition of most popular girls names. In contrast to second generation Irish boys
names, only seven of the girls names appear in each decade from the 1870s through the
1920s. In particular, for the decades after 1900, the pace of change in the most popular
girls‟ names appears to increase markedly. In fact, only seven of the names which
appeared in the first decade under study (the 1870s) also appear in the last (the 1920s).
This result contrasts with a figure of 15 names for the boys using the same periods of
analysis.266
I have also calculated the rate of turnover in these 20 most popular names in the period
from the 1870s through the 1920s. Following Lieberson (2000), I have divided the
number of names which have been replaced in the list of most popular names in each
decade by the total number of years.267 Using this approach, I find that the annual rate
of turnover among names given to second generation Irish boys is .34, whereas the
equivalent figure for second generation Irish girls is a significantly higher .86. These
figures indicate that the rate of change among second generation Irish girls names was
more than two and an half times as high as it was among second generation Irish boys
names in this period.
Figures 6.1 and 6.2 provide a graphical representation of these lists of most popular
boys and girls names given to the children of Irish immigrant fathers in the US. In
these figures, I present both the number and percentage of second generation Irish
children‟s names in each decade which are also found among the 20 most common
names in the sample drawn from the 1900 Irish Birth Registry by Coghlan (1979) as
266
These results would confirm those of Lieberson (2000), pp. 36-37, who also found that girls names
began to change more quickly than boys‟ names during the twentieth century in many Western countries
including the US. 267
Lieberson (2000), p. 36.

242
listed in Table 6.1. The figures show that there is a higher number and percentage of
sons of Irish immigrant fathers whose names were also among the 20 most common
Irish names, than there are of daughters. This relationship holds true for each decade
under study. Taken on its own, these figures would lead one to the following two
conclusions: 1) that there was significant cultural persistence on the part of Irish
immigrant fathers in the selection of children‟s names over the period from the 1870s
through the 1920s, and 2) that this cultural persistence was much more significant
among boys names than it was among girls names. However, before confirming these
conclusions, it is also important to examine how the names selected for children by
Irish immigrant fathers compare to the most common native born names.
Table 6.8 lists the 20 most popular boys and girls names given to second generation
Irish children appearing in each decade between the 1870s and the 1920s. I have also
cross referenced this list against the 20 most common Irish and native born names as
presented in Tables 6.1 and 6.7. The results of this cross referencing are quite
revealing. With respect to the boys, there are 14 names which appeared among the 20
most popular names in each decade from the 1870s until the 1920s. Of these 14 names,
12 also appear in the list of the 20 most common names from the sample from the 1900
Irish Birth Registry by Coghlan (1979) as listed in Table 6.1. In other words, 12 of the
14 most popular names among boys born to Irish immigrant fathers in the US over this
time period were also those names that were the most popular in Ireland. However,
before concluding that these results unconditionally confirm the existence of cultural
persistence and a lack of assimilation by Irish immigrants across this time period, it is
also important to examine the results relative to the native born sample list. As Table
6.8 shows, there was also a noticeable overlap between this list and the most popular

243
native born names from my sample of native born children‟s names. Of the 14 names
which appeared in each decade from the 1870s until the 1920s, 10 also appear in the
list of the 20 most common names from the native born sample as listed in Table 6.7.
Thus, although there was significant overlap with the 20 most common Irish boys
names, there was also a lesser but still noticeable overlap with the most popular native
born names for boys in this timeframe.268 In examining these overlapping names more
closely, what becomes immediately evident is that they are all traditional ones such as
John, James, Thomas and William, which were likely to have been popular in any
English speaking country in this time period. Hence where there is an overlap between
the most popular Irish and native born boys names, it is in these strongly traditional
names.
With respect to the girls names, the results are quite different. As previously
mentioned, there were only seven girls names which appeared in each decade between
the 1870s and the 1920s. As Table 6.8 indicates, there was a much smaller overlap
with the 20 most common Irish girls names. Only six of the seven most popular names
among daughters of Irish immigrant fathers in the US over this time period were also
those names that were the most popular in Ireland. This contrasts with a figure of 12
for the boys names. In addition, only three of these names also appear in the list of the
20 most common names from the native born sample as listed in Table 6.7. These
results reflect a willingness by Irish immigrant fathers to choose names for their
268
However, although this comparison indicates a noticeable degree of overlap between the most
common Irish and native born names for boys, there is also an important distinction. As Figure 2
illustrates, the 20 most common Irish names represent in excess of 70% of the total number of names in
each decade under study. While I do not have similar figures for native born males in each decade, I do
have the results of my native born sample discussed earlier in this chapter. In that s ample, the 20 most
common native born names for boys represent just 46% of total names. Hence, the most common names
make up a far larger percentage of the total name population for the Irish male children than they do for
the native born.

244
daughters that were not necessarily popular in Ireland. In addition, they also reflect a
lack of desire to select names that were popular among the native born.269
269
For girls, Figure 2 shows that the 20 most common Irish names are generally in the range of 60% of
the total name population in each decade under study. Whereas for the native born, the corresponding
figure from my sample is just 30%. Hence the sample data show that nat ive born name population is
significantly less concentrated among the more common names for both girls and boys than is the Irish
immigrant one.
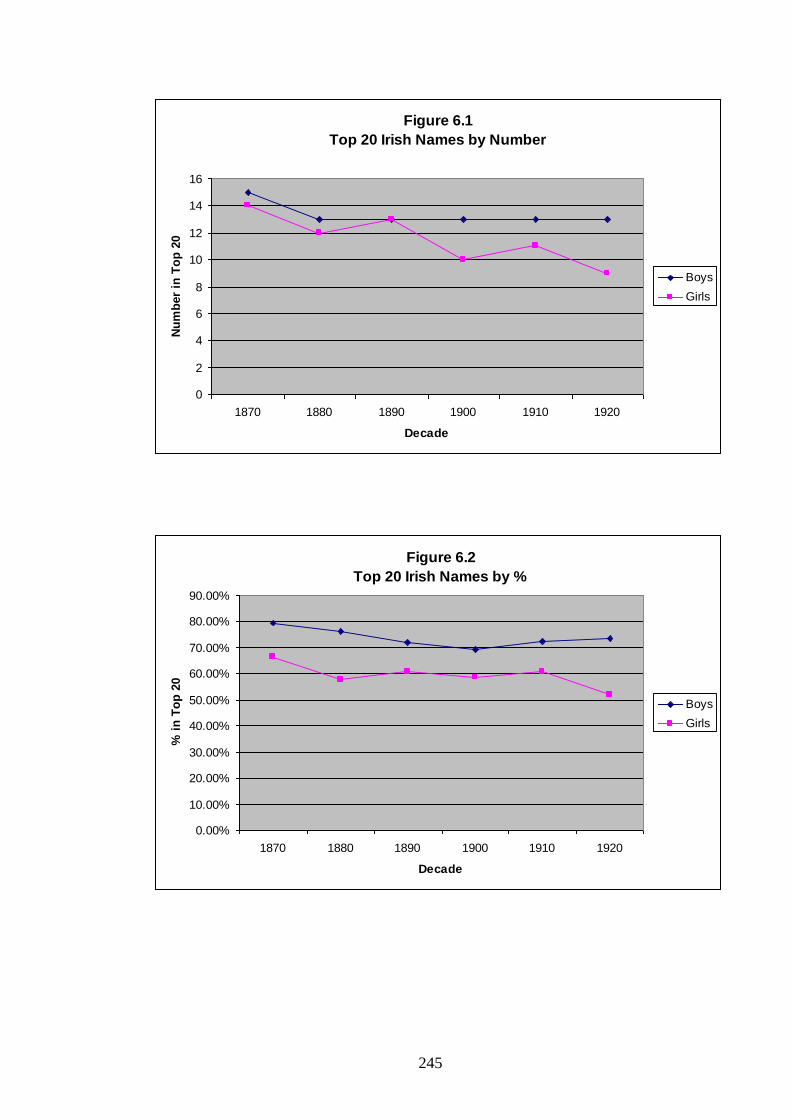
245
Figure 6.1
Top 20 Irish Names by Number
0
2
4
6
8
10
12
14
16
1870 1880 1890 1900 1910 1920
Decade
Nu
mb
er
in T
op
20
Boys
Girls
Figure 6.2
Top 20 Irish Names by %
0.00%
10.00%
20.00%
30.00%
40.00%
50.00%
60.00%
70.00%
80.00%
90.00%
1870 1880 1890 1900 1910 1920
Decade
% i
n T
op
20
Boys
Girls

246
Table 6.8
Names in Appearing in Top 20 in Every Decade 1870s-1920s
Boys Girls
Charles** Agnes* Daniel Ann/Annie**
Edward** Catherine* Frank/Francis** Elizabeth** George** Margaret*
James** Mary** John** Rose
Joseph** Michael* Patrick*
Peter Robert**
Thomas** William**
* These names appear in the list of the 20 most common names from the sample from
the 1900 Irish Birth Registry by Coghlan (1979) as listed in Table 6.1. ** These names appear in both the list of the 20 most common names from the sample
from the 1900 Irish Birth Registry by Coghlan (1979) as listed in Table 6.1, as well as in the list of the 20 most common names from the Native Born sample as listed in
Table 6.7.
247
In conclusion, this analysis of the most common names given to the children of Irish
immigrants in the period from the 1870s through the 1920s does confirm sustained
cultural persistence in child naming patterns, in particular for boys. However, there is
also noticeable overlap for boys names between the most popular Irish names and the
most popular native born ones in this time period, in particular among traditional
names. It would appear that although Irish immigrant fathers were highly likely to
choose an Irish name for their sons, many of the most traditional of these names were
also popular with native born parents. Thus, though the child naming patterns do
support the notion of cultural persistence, it is also true that many of the most popular
names among Irish immigrant fathers were also native born favourites in this time
period. It may have been that these names were popular with the Irish in part because
they would be considered less foreign by native born Americans. Hence, while cultural
persistence in naming patterns appears to continue into the twentieth century among
boys names, it may be that this persistence was reinforced by the popularity of many
common Irish names among the host country population. There was likely to have
been less chance of facing discrimination if an Irish American male had a more
traditional name that was also common among the native born. Based on these results,
it may be the case that the desire to avoid discrimination may have influenced naming
patterns in the period between the 1870s and the 1920s.
With respect to girls names, the results are quite different. In this case, there appeared
to be a greater willingness by Irish immigrant fathers to choose names for their
daughters that were not necessarily popular in Ireland. And these names tended to be
even less popular among the native born. Particularly in the twentieth century, the
patterns in the naming of Irish immigrant daughters appear to have become a domain
248
where both tradition as well as the desire to assimilate into American society breaks
down. Names that were neither well known in Ireland or among the native born in the
US were increasingly selected by Irish immigrant parents. It may have been the case
that Irish immigrant fathers were less concerned about assimilating their daughters into
the workforce than their sons. Given the much higher percentage of men than women
in the workforce in this time period, such an outcome is not unreasonable. On the other
hand, it is much harder to explain why Irish immigrant fathers did not maintain a
stronger sense of tradition or cultural persistence when it came to choosing their
daughters‟ names.
One final observation that can be made about the change in Irish immigrant naming
patterns over the late nineteenth and early twentieth centuries is the continued
popularity of traditional Christian names. A close examination of Appendices 6.1 and
6.2 reveals that the names which are most likely to be found at the top of the lists for
each decade are religious ones. This is true both for boys as well as for girls names.
Among the boys, names such as John, James, Thomas, Michael, Joseph, Patrick and
Francis dominate the top of the list in each decade. As for the girls, names including
Mary, Ann, Margaret, Catherine and Elizabeth are consistently the most popular.
Particularly for the girls, there is a surprising mix of the continued use of traditional
religious names on the one hand, coupled with an overall shift to a wider variety of
more secular names on the other hand. For the boys, traditional names, whether
distinctly religious ones originating in the Hebrew language (such as John, James or
Joseph), or the more secular names originating in the German or Anglo-Saxon
languages (such as William, Edward, Robert or Richard) are consistently the most
popular.
249
In summary, the use of children‟s names as a measure of assimilation has generated
important results regarding the assimilation of Irish immigrants in the US in the late
nineteenth and early twentieth centuries. As previously discussed, the selection of a
non-Irish name for a child by an Irish immigrant father can be viewed as a sign of how
willing a parent is for his children to become more assimilated as an American,
whereas the selection of a distinctly Irish name may reflect cultural persistence. An
analysis of the names given to children in my Irish immigrant sample relative to those
drawn from the sample from the 1900 Irish Birth Registry by Coghlan (1979) indicates
that cultural persistence in naming patterns was quite strong for first generation Irish
immigrants living in the US. There was significant overlap among the 20 most
common names in each sample, with particularly strong overlap for boys names. One
other notable result was the lack of virtually any names that had distinctly Irish roots in
either sample. In addition, none of the most common names were found to be in their
Gaelic form.
An analysis of the relationship between Irish immigrant naming patterns and
socioeconomic characteristics found that Irish immigrant fathers who gave their
children Irish names in many ways resembled the Irish immigrants who married an
Irish-born spouse (which was examined in Chapter IV). Similar to Irish immigrants
who married an Irish-born spouse, they appear to have underperformed in the
workplace and to have socioeconomic characteristics that are distinctly different from
those Irish immigrants who gave their children less Irish names. They were more likely
to live in urban areas, much more likely to have married an Irish born spouse, and their
spouses were less literate than those who had not given their children Irish names. In

250
all these respects, they less closely resemble the native born than do the Irish
immigrants who chose not to give their children Irish names. Logistic regression
analyses of child naming patterns also confirmed that intermarriage, living in an urban
location, the literacy of the spouse as well as the level of geographic clustering were all
significant factors in the giving of an Irish name to a child by an Irish immigrant father
in this time period.
The result that Irish immigrants living in urban areas were actually more likely to give
their child an Irish name than those that lived in rural areas would appear to refute one
of the child naming theories of Lieberson (2000), who wrote that the force of
urbanisation would help to reduce the role of tradition and lead to “greater
independence of judgement” by parents in the naming of their children.270 My results
indicate that the benefit that Lieberson (2000) may have attributed to urbanisation
reducing the role of tradition in the naming process may have been offset by other
factors including the influence of other Irish immigrants (and potentially that of second
and third generation Irish-Americans) who were also living in urban areas in the US in
this time period.
An analysis of the naming patterns of Irish immigrant and native born parents using
my sample data also showed a distinct lack of assimilation by Irish immigrants. This
comparison found limited overlap between the favourite names of the Irish and native
born, in particular among girls names. In a DDI analysis, more than half the names of
Irish or native born children would have to change in order for the two distributions to
resemble each other. Importantly, the Irish were also much more likely to choose from
270
Lieberson (2000), p. 43.
251
a smaller number of more popular names than were the native born, where just 38% of
the names in the native born sample were among the 20 most common names in that
sample, versus a figure of 65% for the Irish born sample. For the native born, the
selection of a most common name was markedly less important than it was for Irish
immigrant families. My results reveal that Irish immigrants preferred children‟s names
that were also popular among parents in Ireland in this timeframe and further confirm
the argument for cultural persistence in naming patterns. In addition, these results also
appear to refute another theory of Lieberson (2000), who argued that it would be
extremely difficult for an ethnic group to avoid the influence of the larger society on
their naming patterns. With respect to first generation Irish immigrants in late
nineteenth century America, the influence of the native born on their naming patterns
does not appear to have been very strong.
In the latter section of this chapter, I used the complete US census sample data
available from IPUMS to assemble samples of the names given to children of Irish
immigrant fathers born in the US in each of the decades from the 1870s through the
1920s. For the boys, the most striking result of this analysis was the lack of change in
the list of the 20 most common names over this lengthy time period. The 12 most
popular names given to second generation Irish boys in the 1870s remain among the
top 20 most popular names in each decade under study. And there are 14 names which
appear in the list of the 20 most popular names in every decade. In addition, a
consistently high percentage of these names were also among the most common Irish
names. However, there was also a lesser but still noticeable overlap with the most
popular native born names, in particular among traditional names. As for the girls, the
results were altogether different. Only seven girls names appeared in each decade

252
between the 1870s and the 1920s, of which just six were also among the most popular
ones in Ireland. In addition, there was much less overlap with the most common native
born names, with only three of these names also appearing in the list of the 20 most
common names from the native born sample.
The analysis of the patterns of child naming by Irish immigrant fathers in the period
from the 1870s through the 1920s generated important conclusions but also raised
some interesting questions. The results confirm cultural persistence by Irish immigrant
fathers in the naming of their sons. However, they also indicate that several traditional
names in this period were also popular with native born parents. Though as I have
discussed, the evidence shows that the use of a common name was much less
significant among native born parents than it was for Irish immigrant parents in this
time period. For the Irish, the selection of certain traditionally popular Irish names did
not preclude the possibility of that name also being popular in their new host country.
This outcome, which could only be identified by analysing the child naming patterns
of Irish immigrants over time, raises the possibility that there were certain Irish names
that would not necessarily be perceived as foreign by native born Americans and hence
were potentially safer choices for immigrant parents.271 Irish immigrant parents could
choose certain names that allowed them to maintain ties to their homeland, while also
achieving a measure of assimilation for their children (and potentially avoiding future
discrimination against their son in the process). This result could be interpreted as Irish
immigrant families attempting to maintain tradition at a low perceived cost.
271
Lieberson (2000) might claim that this result provides some support for his argument that it would be
extremely difficult for an ethnic group to avoid the influence of the larger society on their naming
patterns.
253
With respect to the daughters of Irish immigrant fathers in the period from the 1870s
through the 1920s, the results do not confirm the same degree of cultural persistence in
naming patterns. Nor were there very many common Irish names that were also
popular with native born parents. The naming patterns of second generation Irish girls,
particularly beginning in the twentieth century, reflect both a break down in tradition
and a lack of assimilation. There is a much greater variety in the most popular girls
names than there is for boys, as well as a significantly higher rate of turnover among
the most popular names, both results that were also found by Lieberson (2000) in his
study of naming patterns in a range of Western nations in the nineteenth and twentieth
centuries.272 Lieberson (2000) offers no explanation for this increase in variety in girls
names, and this topic appears to be one that would benefit from future research. With
respect to the Irish immigrants in the US, perhaps they were less concerned about the
future employment prospects of their daughters than they were for their sons. (Women
being much less likely then men to be in labour force in this time period). This may
explain why there was such limited overlap of the most popular names of second
generation Irish daughters and native born girls in this period. However, explaining the
break down in the use of popular Irish names in the early twentieth century is more
difficult. As previously discussed, traditionally popular religious names did maintain
their position among the most commonly chosen names by Irish immigrant fathers,
both for boys and for girls. However, apart from names such as Mary, Ann, Margaret,
Elizabeth and Catherine, second generation Irish girls increasingly received a broader
variety of names from their parents, most of which were neither particularly religious,
nor Irish.
272
Lieberson (2000), p. 37.

254
The results of this review of child naming patterns by Irish immigrants makes an
important contribution to my analysis of the assimilation of Irish immigrants in the US
in the late nineteenth century. Although the use of child naming patterns to assess
assimilation was chosen in part because it represented a measure of assimilation
outside the workplace, certain of the results appear to possibly have been influenced by
future employment considerations. In addition, this analysis has further confirmed that
the assimilation process for Irish immigrants in this time period was indeed a
multidimensional one, with cultural and religious ties to the homeland persisting in
many respects, yet certain differences in assimilation based on naming patterns
emerging based on the gender of the child.

255
Appendix 6.1
Top 20 Irish Boys Names in Each Decade from 1870s until 1920s
1870s 1880s 1890s 1900s 1910s 1920s
John John John John John John
James James James James James Thomas
William William William Thomas Thomas James
Thomas Thomas Thomas William Joseph William
Michael Joseph Joseph Joseph William Joseph
Joseph Edward Francis Edward Francis Patrick
Edward Frank Edward Francis Edward Francis
Patrick Patrick Michael George Robert Robert
Frank Michael George Daniel George Edward
Charles Charles Charles Michael Charles Michael
George George Patrick Robert Michael Daniel
Daniel Robert Daniel Patrick Patrick Richard
Robert Daniel Robert Charles Daniel Charles
Peter Richard Martin Martin Martin Eugene
Richard Henry Henry Bernard Timothy Paul
Henry Martin Richard Frederick Bernard Bernard
Martin Peter Leo Peter Peter Donald
Dennis Harry Walter Walter Dennis George
David Arthur Peter Arthur Morris Peter
Timothy Walter Arthur Timothy Vincent Raymond

256
Appendix 6.2
Top 20 Irish Girls Names in Each Decade from 1870s until 1920s
1870s 1880s 1890s 1900s 1910s 1920s
Mary Mary Mary Mary Mary Mary
Annie Annie Margaret Margaret Margaret Margaret
Kate Margaret Annie Catherine Catherine Anna
Margaret Catherine Catherine Anna Anna Catherine
Catherine Kate Katie Helen Helen Eileen
Maggie Elizabeth Elizabeth Elizabeth Elizabeth Helen
Ellen Nellie Ellen Alice Alice Theresa
Elizabeth Maggie Helen Agnes Dorothy Kathleen
Sarah Agnes Agnes Rose Eleanor Rita
Lizzie Ellen Alice Florence Agnes Dorothy
Nellie Lizzie Nellie Lillian Kathleen Patricia
Julia Alice Sarah Dorothy Eileen Elizabeth
Bridget Julia Maggie Josephine Irene Agnes
Agnes Rose Julia Julia Rita Josephine
Alice Sarah Florence Sarah Frances Rose
Rose Nora Rose Cecilia Gertrude Betty
Hannah Jennie Lizzie Grace Julia Eleanor
Johanna May Gertrude Nora Nora Florence
Ella Helen Francis Gertrude Rose Marion
Jane Josephine May Nellie Winifred Nora

257
VII. Conclusion
My research in this dissertation has provided a multi-faceted view of the assimilation
process. I have endeavoured to explore issues of assimilation which extend beyond the
frequently analysed areas of occupational mobility and earnings. My work has sought
to analyse other aspects of assimilation including variables such as marriage and
spousal characteristics, fertility, child mortality, literacy, geographic location (both in
terms of rural vs. urban locations as well as ethnic clustering), home ownership and the
choice of children‟s names. This dissertation examines all of these variables using
empirical evidence from newly constructed datasets, enabling me to draw conclusions
about these aspects of immigrant assimilation in a statistically robust manner. The
focus on earnings and occupational mobility is an important one, but being able to
assess the assimilation process away from the workplace is also crucial to
understanding the lives of Irish immigrants in late nineteenth century America. In my
work, I have found that characteristics such as the nationality of a spouse or the name
given to a child can have important implications for the assimilation and occupational
mobility of Irish immigrants. The extent of geographic clustering, the number of years
living in the US, age and other non-pecuniary factors also had important assimilation
and labour market implications for the Irish in this time period. The links between
socio-economic characteristics such as these and the relatively poor labour market
outcomes of Irish immigrants in this time period can only be seen by taking the broad,
multi-faceted approach to the study of assimilation that I have done in this dissertation.
My research has sought to assess the degree of assimilation achieved by Irish
immigrants in the US in the last decades of the nineteenth century. It has employed a
matching technique to link specific individuals from the 1880 and 1900 US censuses,

258
which has permitted me to capture significant information concerning these individuals
in both 1880 and again in 1900. This matching technique was utilised to create samples
of both Irish immigrants and native born Americans, enabling me to track the lives of
specific individuals over this twenty year period. Utilising these samples, I assessed
the degree of assimilation and occupational mobility achieved by Irish immigrants with
native born Americans across a range of socio-economic characteristics available in
US census data. I also created various other samples using US census data as well as
other sources to further examine the assimilation of Irish immigrants in late nineteenth
century America, focusing on such characteristics as marriage, geography and
children‟s names.
In this dissertation, I addressed the following principal questions: Were the Irish
immigrants of the late nineteenth century melded in the crucible of the American
melting pot, being reformed into “the American” so dramatically described by
Zangwill? Or did they retain their distinctiveness in their new homeland? Was the
melting pot in fact more of a salad bowl where different ethnic groups were mixed
together, but with each retaining its own identity? Or were there certain areas where
the Irish adapted quickly to their new surroundings and others where their socio-
economic outcomes did not come to resemble those of native born. Was the
assimilation process in fact multi-dimensional as opposed to being uniform in nature?
Did the assimilation outcomes of Irish immigrants vary depending on which subset of
the Irish sample was being reviewed, and which socio-economic characteristics were
under consideration? What was the nature of the relationship between assimilation and
occupational mobility for Irish immigrants in this time period?

259
This research makes contributions to the cliometric literature, as well as to the
literatures on Irish immigration and immigrant assimilation. With respect to the
cliometric literature, the main contribution is the use of matched Irish and native born
samples to assess the assimilation of Irish immigrants in the US at the end of the
nineteenth century. The matching technique (which was introduced in Chapter II and
first utilised in Chapter III) links specific individuals across the two US census
datasets, enabling me to track the experience of particular individuals over time, as
well as to gather information regarding their spouses and children. This approach
allowed me to assess behavioural changes over time as opposed to simply measuring
the status of a group of individuals at one point in time. While other researchers have
used this matching technique in their research to study themes involving immigrants
and domestic migrants,273 none have used this technique to address the assimilation of
the Irish and their relative occupational mobility in the US in the late nineteenth
century timeframe. Secondly, while several researchers have examined the marital
behaviour of Irish immigrants in the US in this time period,274 none have focused
specifically on the issue of intermarriage and its use as a measure of assimilation. In
Chapter IV, I make use of the longitudinal nature of my linked sample data to explore
the relationship between intermarriage and a series of socio-economic variables,
allowing me to assess potential causes and consequences of intermarriage. In Chapter
V, my contribution to this literature is the study of the impact of geographic clustering
on the assimilation and occupational outcomes of Irish immigrants in the late
nineteenth century. In Chapter VI, I assessed the assimilation of Irish immigrants using
the naming of children as the unit of measurement. The use of children‟s names as a
273
See Ferrie (1996, 1997, 1999), Long and Ferrie (2004, 2005, 2007), Stewart (2006), Abramitsky et al
(2010). 274
See Foley and Guinnane (1999), Landale and Tolnay (1993).

260
measure of assimilation has rarely been utilised by other researchers, and has not been
used to examine the experience of Irish immigrants in this time period.
With respect to the literature on Irish immigration, in Chapter III I found that Irish
immigrants did not assimilate quickly relative to either the native born or the broader
American population, and that they also lagged noticeably in measures of occupational
mobility relative to these groups, as well as to the other principal immigrant groups in
the US in this timeframe. In Chapter V, I found that geographic clustering was quite
pronounced for Irish immigrants in late nineteenth century America. Irish immigrants
were primarily drawn to the large metropolitan areas of the Northeast, reflecting the
importance of these areas as points of entry to the US, areas of prior settlement by
previous generations of Irish immigrants, as well as major centres for employment for
new immigrants. In my research, I also found that this geographic clustering directly
impacted the degree of assimilation and occupational mobility of Irish immigrants in
this timeframe. Higher levels of geographic clustering were associated with both lower
degrees of assimilation and lower occupational outcomes. The benefits of geographic
clustering in the job market often described in this literature do not appear to have
existed for Irish immigrants in the late nineteenth century. These outcomes would also
support the view that living in a more ethnically concentrated community, though
perhaps improving the initial starting position of Irish immigrants in America, may
have come at the expense of slower subsequent assimilation and reduced occupational
mobility.
This dissertation also examined the concept of immigrant assimilation itself. In my
research, I have approached assimilation as the process by which an immigrant group

261
attains a level of social and economic integration into their new host society such that
their overall position in these sectors of society, as measured by observable outcomes,
is similar to those of the native born members of the society. In the US in the late
nineteenth century, the native born population was clearly evolving, impacted by prior
inflows of immigrants from Britain, Germany, Ireland, Scandinavia and elsewhere.
Immigrants such as the Irish were certainly influenced by this population, but they also
would have been impacted by their exposure to other immigrants groups in the US in
this time period. The process of assimilation was therefore not a simple one, with the
Irish being absorbed in a uniform fashion into a culture of Anglo-conformity. There
were multiple influences at work, in addition to the desire of Irish immigrants to
maintain aspects of their ethnic heritage. Assimilation was thus a multi-dimensional
process without pre-ordained outcomes. In this context, it was important to examine
relevant segments of both the Irish and native born populations in addition to aggregate
analyses.
For this author, it is also necessary that any definition of assimilation takes into
account the measurement issues that exist with this concept. In order to assess
assimilation, it is important to have evidence that can actually be measured in a
systematic manner, so that conclusions can be reached about the experience of a
particular immigrant group which are robust and not merely anecdotal in nature. I also
recognise that there are elements of the assimilation process where measurement issues
limit the ability of scholars to comprehensively examine this process. Religion is one
such example. The US census does not record the religious affiliation of respondents,
leaving scholars interested in pursuing this particular area to make do with other more
limited and localised sources such as church records that are not easily matched to a

262
larger dataset. Another example would be unobservable aspects of human capital. For
example, in his study of Jewish immigrant skills and occupational attainment,
Chiswick (1991) notes that there may have been “important unmeasured variables”
associated with “Jewishness” as part of his explanation for their rapid improvement in
occupational status in the US in the late nineteenth century.275 Such unobservable
characteristics may have a significant impact on an ethnic group‟s labour market
outcomes, but may not be able to be systematically measured and analysed. In
summary, my use of US census microdata and the creation of the largest possible
sample sizes, coupled with a definition of assimilation which recognises the need for
the robust measurement of a broad range of socio-economic variables, are critical to
my approach to the assessment of immigrant assimilation. But I also recognise that
there are variables which may also be important to the concept of assimilation that are
difficult or impossible to capture and measure.
In the immigration literature, assimilation has been an important concept since the
early twentieth century, with the publication of the congressional report by the US
Immigration Commission (1911) and the subsequent ground-breaking work by
Douglas (1919). Notwithstanding the grand vision of the melting pot which Zangwill
(1908) describes in his turn of the century play, the academic literature on assimilation
has long since moved beyond his vision to incorporate a more nuanced view than the
melting pot. Moynihan and Glazer (1963) questioned the idea that American society
was a melting pot in the nineteenth and twentieth centuries. In their famous work
Beyond the Melting Pot, they argued that the melting pot did not actually exist for
immigrant groups in New York in the late nineteenth and twentieth centuries. They
275
Barry R. Chiswick, “Jewish Immigrant Skill and Occupational Attainment at the Turn of the
Century”, Explorations in Economic History, 28, (1991), p. 80.

263
found that “the assimilating power of American society operated on immigrant groups
in different ways,” but nonetheless left them “distinct and identifiable.”276 Gordon
(1964) was instrumental in expanding the spectrum of possible assimilation outcomes
to encompass both the complete acceptance of the host culture (“Anglo-conformity”)
and significant retention of ancestral ways, alongside the concept of the melting pot.
His recognition that assimilation can occur in varying degrees across characteristics
was an important addition to the literature. Subsequent scholars such as Brubaker
(2001) have taken issue with the concept of assimilation being measured relative to a
“white Protestant core culture;”277 “Anglo-conformity” being one of Gordon‟s (1964)
three primary types of assimilation.278 Brubaker (2001) is supportive of recent studies
of assimilation which are “agnostic about its directions, degrees and modalities and
ambivalent about its desirability.” He argues for a “willingness to consider multiple
reference populations” and “segmented forms of assimilation.”279 Kurthen and Heisler
(2009) and Freeman (2004) also call for a multi-dimensional framework for
understanding how immigrants are incorporated into their new host society and expect
such incorporation to not be linear, but to have different results in different domains.280
Portes and Zhou (1993) make the case that contemporary assimilation in the US has
become segmented. They argue that immigrants no longer assimilate into a single
society, but into one of several sectors of that society. They view immigrants as joining
either the middle class, falling into poverty and joining the underclass, or attaining
rapid economic advancement while preserving many values of their immigrant
community.281 Portes and Rumbaut (2005) build on this concept of segmented
276
Glazer and Moynihan (1963), pp. 13-14. 277
Brubaker (2001), p. 540. 278
Gordon (1964), p. 85. 279
Brubaker (2001), p. 540. 280
Kurthen and Heisler (2009), p. 139; Freeman (2004), p. 960. 281
Portes and Zhou (1993), p. 82.
264
assimilation and also argue that immigrants are impacted by the history of prior
generations, cultural and economic barriers, acculturation of parents, and family and
community resources that exist to confront barriers.282 They conclude that segmented
assimilation results in economic outcomes which vary across immigrant nationalities.
This author agrees that a broad approach is required in assimilation research, and has
frequently used multiple reference populations and segmented analyses to examine the
experience of Irish immigrants in the late nineteenth century. In Chapter III, I found
that those Irish immigrants in my sample who engaged in farming assimilated more
quickly in certain areas (such as home ownership, marital status, child mortality and
nationality of their spouse), than they did in other areas (such as marital fertility). I also
found that while Irish farmers achieved a significant level of assimilation relative to
native born farmers, those Irish who lived in urban areas realised a much lower degree
of assimilation relative to the urban native born. In Chapter III, I also segmented my
Irish sample into cohorts based on age, year of immigration, and age at time of
immigration, and found significant differences in the levels of assimilation and
occupational mobility of these subsets. The younger Irish and those Irish who
immigrated to the US as children achieved the highest levels of occupational mobility,
income and income growth. They were also the most literate and the most likely to
marry an American born spouse. The older Irish and those Irish who were not recent
immigrants were less successful in obtaining white collar work, but were more likely
to own a home or to become a farmer. They also had lower income levels and income
growth. Finally, those Irish who immigrated as adults had the weakest occupational
performance. In Chapters IV and VI, respectively, I found that those Irish immigrants
282
Portes and Rumbaut (2005), p. 986.

265
who married a non-Irish spouse and those who gave their children less Irish names also
experienced greater levels of assimilation. In these findings, it is clear that immigrant
assimilation is not linear, but multi-dimensional. It is also clear that whereas the notion
of the melting pot may have theatrical appeal, it does not capture the overall
experience of the Irish immigrants in my sample. The work of many subsequent
scholars, in fields ranging from economics to sociology to history, has helped to
illuminate the more complex manner in which immigrants adjust to their new host
society.
Another important concept in the literature on immigrant assimilation is the
relationship between assimilation and occupational mobility. Gans (2007) argues that
assimilation and mobility are independent processes, and that immigrants “can
assimilate without being mobile and vice versa.”283 He argues that studies of European
immigrant assimilation during the age of mass migration need to take account of the
fact that this period was one of “nearly universal upward mobility” and that most
Europeans were extremely poor when they arrived in the US “and could only move
up.”284 He makes the case that assimilation and mobility need to be examined as
independent processes and not treated as the same phenomenon. He also argues that
whereas assimilation may not lead to enhanced economic mobility, that mobility does
“encourage acculturation and assimilation.”285 Portes and Zhou (1993) also recognise
that assimilation and occupational mobility are distinct phenomena. In their framework
of contemporary immigrant assimilation in the US, they argue that immigrants can
283
Gans (2007), p. 152. 284
Gans (2007), p. 152. 285
Gans (2007), p. 158.

266
achieve economic advancement without being broadly accepted into their new host
society.286
In my research, I have separated the analyses of assimilation and occupational
mobility, recognising that they are different phenomena. In my results, the two
concepts were consistently positively correlated, with those Irish immigrant subsets
which experienced higher levels of assimilation also more quickly ascending the
occupational ladder. In this respect, my results confirm the views of Gans (2007).
However, I agree that it is important not to take this relationship for granted, but to
constantly assess it with each subset under study. In addition, I have also looked at
occupational mobility on a comparative basis. It is not sufficient to measure the results
of a single group, such as Irish immigrants, without putting their experience into a
comparative context. In Chapter III, I examined the occupational mobility of the Irish
relative to similar samples of German and English immigrants; these two groups being
the other principal immigrant groups in the US in the late nineteenth century. The Irish
lagged behind the performance of both the German and English immigrants during this
time period. Both these groups had higher levels of white collar occupations and lower
levels of unskilled workers than did the Irish, and more closely resembled the native
born in this regard than did the Irish. Only through an analysis of relative occupational
mobility is it possible to draw meaningful conclusions regarding the experience of any
single group, particularly in late nineteenth century America, where average incomes
were rising and overall occupational mobility was expanding.287
286
Portes and Zhou (1993), p. 96. 287
Long and Ferrie (2005), p. 22.

267
A final critical concept in the literature on immigrant assimilation that has been
addressed in this dissertation is the relationship between assimilation and the ethnic
environment in which immigrants live. In the literature, Hatton and Leigh
(forthcoming) make the argument that immigrants do not assimilate as individuals, but
as communities. They state that immigrant assimilation is a two-way street, which
depends not only on how immigrants fit into the labour market and wider culture of
their new host society, but also on the degree to which that society “accepts,
accommodates and adapts to particular immigrant groups.”288 They argue that history
does play a role in the subsequent assimilation experience of immigrant groups in that
the more established is the tradition of an immigrant group, the more integrated that
immigrant community will be in its new host society. As a result, they conclude that
newly arrived immigrants from such a group will assimilate more easily into the labour
market.289 Portes and Zhou (1993) also argue that immigrants who join a well
established ethnic group in their new host society have access to a range of moral and
material resources that can assist new immigrants in the assimilation process.290 Borjas
(1999) also finds a significant role for the ethnic environment in the economic
performance of immigrant groups in the US. He focuses on the quality of that
environment, and argues that an environment with more abundant human capital will
have a positive influence on the economic outcomes of immigrants and their children.
Similar to Hatton and Leigh (forthcoming), he finds that the influence of one‟s ethnic
group is a critical factor in economic assimilation, stating that such ethnic capital
“effectively lowers the flame under the melting pot from a full boil to a slow simmer”
and “makes it hard to escape the economic fate implied by one‟s ethnic
288
Hatton and Leigh (forthcoming), p. 2. 289
Hatton and Leigh (forthcoming), p. 2. 290
Portes and Zhou (1993), p. 86.

268
background.”291 All of these scholars would argue that the outcomes of individual
immigrants are significantly affected by the degree of integration of the immigrant
group as a whole.
In my research, I have also examined aspects of the relationship between the ethnic
environment and immigrant assimilation. In Chapter V, I assessed the impact of
geographic clustering on the assimilation of Irish immigrants in late nineteenth century
America. My results confirmed that such clustering directly affected the degree of
assimilation and occupational mobility of Irish immigrants, with the impact being a
negative one for the Irish in this time period. Similar to Borjas‟ (1999) results for
contemporary immigrants to the US, I found that the ethnic environment did “lower
the flame under the melting pot”292 for Irish immigrants in my period of analysis.
Those Irish who lived in more ethnically concentrated regions of the US experienced
slower assimilation and reduced occupational mobility relative to those who lived in
less clustered environments. Borjas might argue that such a result signals that the
human capital levels in the Irish ethnic community were relatively low in this period.
As this author has speculated, perhaps Irish immigrants experienced difficulty adapting
from the rural, agricultural and largely pre-industrial society from where most of them
came,293 to the more urban and industrialised areas of the American economy where
most chose to live and work. As my research in Chapter III illustrated, the Irish lagged
behind the two other principal immigrant groups in the US in this timeframe – the
Germans and the English, notwithstanding their high rates of literacy and the use of
English as a native language. Perhaps the Irish lacked other critical skills – what Borjas
might consider human capital - necessary to advance up the occupational ladder in late
291
Borjas (1999), p. 14. 292
Borjas (1999), p. 14. 293
Hatton and Williamson (1993), pp. 588-9.

269
nineteenth century America? In the literature, there is surprisingly little comparative
research on the human capital levels of immigrants to the US in the nineteenth century.
Mitch (1992) found that the school attendance and literacy rates of the mid-nineteenth
century English lagged behind those of Americans, Germans and Scandinavians.294 In
a separate study, Atkinson (1969) found that the Irish lagged behind inhabitants of
England, Wales and Scotland in areas such as primary school attendance, teacher pay
and teacher training in this same timeframe.295 While it is clear that the topic of
comparative human capital levels of immigrants to the US in the nineteenth century is
one that would benefit from further research, it is nonetheless evident that the limited
research which has been done would support the view that the Irish were less well
educated and came from a much less advanced economy than the other principal
immigrant groups in the US in the late nineteenth century.
With respect to the assimilation of German and English immigrants, various scholars
have shown that they assimilated well into American society (in particular the
English), and achieved higher levels of occupational mobility than did the Irish in the
late nineteenth century. According to Conzen et al. (1992), the English were welcomed
into society “on the basis of common standards of living, skills, levels of education,
language, religion, and habits of daily life.”296 Erickson (1980) found that the English
faced no discrimination or language barriers in the US,297 regarded themselves as
coming from the same ethnic stock as a majority of the native born, and met few
294
Mitch (1992), p. 1. 295
Atkinson (1969), pp. 101-2. 296
Kathleen Neils Conzen, David A. Gerber, Ewa Morawska, George E. Pozzetta and Rudolph J.
Vecoli, “The Invention of Ethnicity: A Perspective From the U.S.A.”, Journal of American Ethnic
History, 12:1 (Fall 1992), p. 18. Their comments relate specifically to a study of immigrants in Buffalo,
New York, an important economic centre in this time period. 297
Charlotte Erickson, “The English” in Harvard Encyclopedia of American Ethnic Groups, Stephen
Thernstrom, Ann Orlov and Oscar Handlin (eds) Cambridge: 1980), p. 330.

270
obstacles to participation in the social and institutional life of America.298 Whereas
they did not have English as a native language and were viewed as ethnically different
from native born Americans,299 most Germans preferred assimilation to cultural
isolation, so as to benefit from the economic opportunities available in American
society.300 Numerous studies of the mid to late nineteenth century period also found
them to cluster in skilled occupations in the US and to achieve superior labour market
outcomes to the Irish.301 In comparison to both these groups, the Irish fared relatively
poorly in the workplace and assimilated more slowly into American life.
Separately, there was also an immigrant group in the late nineteenth century who
managed to achieve relatively strong labour market outcomes while not assimilating
meaningfully into American society. Chiswick (1991) found that Jewish immigrants to
the US in the late nineteenth century rapidly achieved significant occupational mobility
relative to other immigrant groups, including the Irish.302 Thernstrom (1973) also
found that nineteenth century Jewish immigrants to Boston “found their way into the
higher occupational strata with exceptional speed.”303 Chiswick (1992) argues that this
occupational success extended beyond white collar work and self-employment to
298
Erickson (1980), p. 320. 299
Conzen et al. (1992), p. 7. 300
Kathleen Neils Conzen, “German-Americans and the Invention of Ethnicity”, in America and the
Germans: An Assessment of a Three-Hundred Year History, Frank Trommler and Joseph McVeigh (eds)
(Philadelphia: 1985), p. 138. 301
Nora Faires, “Occupational Patterns of German-Americans in Nineteenth-Century Cities”, in German
Workers in Industrial Chicago, 1850-1910: A Comparative Perspective, Harmet Keil and John B. Jentz
(eds) (Dekalb: 1983), p. 48; Timothy G. Conley and David W. Galenson, “Nativity and Wealth in Mid -
Nineteenth-Century Cities”, Journal of Economic History, Vol. 58, No. 2 (June 1998), p. 471; Bruce
Laurie, Theodore Hershberg and George Alter, “Immigrants and Industry: The Philadelphia Experience:
1850-1880”, Journal of Social History, Vol. 9, No. 2 (Winter 1975), p. 238. 302
Chiswick (1991), p. 79. Since religion is not recorded in the US census, Chiswick made assumptions
based on nationality to create a Jewish sample for his analysis. He assumed that any immigrant that
reported Russia or Poland-Russia as their country of origin was Jewish for his purposes. 303
Thernstrom (1973), p. 250.
271
include relatively high wages in manufacturing.304 He attributes this success to various
aspects of human capital such as education, years spent in the US labour market, as
well as to an immeasurable ability of Jews to identify and develop skills helpful to
them in this labour market.305 However, in spite of their relative economic success, the
Jews achieved only limited acceptance into American society in the late nineteenth
century and were not well assimilated.306 Hence, whereas assimilation and
occupational mobility were positively correlated for groups such as the Germans and
the English, as well as for subsets of the Irish, it was clearly not the case for all
immigrant groups to the US in this period. Jewish immigrants achieved rapid
occupational mobility in the absence of broader assimilation. It is also striking that
both the Irish (particularly those arriving in the late 1840s and 1850s) and the Jews
often arrived in the US as refugees in the nineteenth century, fleeing famine or
religious persecution, and that both groups similarly had very low levels of return
migration. In this circumstance, both groups would have had significant incentive to
develop skills useful to them in the US labour market. It is thus all the more striking
that the Irish were not able to develop such skills to the same extent as the other
principal immigrant groups in this time period.
The comparative results presented here indicate a positive relationship between
assimilation and occupational mobility for many of the principal immigrant groups in
the US in the late nineteenth century. As discussed previously, those subsets of Irish
immigrants who assimilated more quickly also experienced higher levels of
occupational mobility. It is therefore striking how an immigrant group such as the Jews
304
Barry R. Chiswick, “Jewish Immigrant Wages in America in 1909: An Analysis of the Dillingham
Commission Data”, Explorations in Economic History, 29 (1992), p. 286. 305
Chiswick (1991), p. 81 306
Arthur A. Goren, “The Jews” in Harvard Encyclopedia of American Ethnic Groups, Stephen
Thernstrom, Ann Orlov and Oscar Handlin (eds) (Cambridge: 1980), p. 579.

272
was able to achieve strong occupational mobility in the absence of broader
assimilation. It would appear likely that there was also a significant role for the human
capital levels of ethnic communities to play in the occupational mobility of their
members in this time period, irrespective of the degree of assimilation of those
communities.
In conclusion, my analysis of the assimilation of Irish immigrants in the late nineteenth
century has resulted in the following principal conclusions. First of all, Irish
immigrants did not assimilate quickly in the US, nor did they achieve occupational
parity with the native born or with the other primary immigrant groups in the US in
this timeframe. Secondly, assimilation is clearly a multi-dimensional process where
varying outcomes are likely to occur in different areas under measurement. Factors
such as age, years living in the US, age at time of immigration, geography, gender and
marriage choices all appear to influence the socio-economic outcomes of Irish
immigrants in this timeframe. Thirdly, although the outcomes of my analyses of the
assimilation and occupational mobility of the Irish immigrants were consistently
positively correlated, it is nonetheless important to consider these as separate
processes. It is certainly possible for occupational mobility to occur in the absence of
assimilation. In addition, it would also appear that there is a significant role for human
capital in this process, with higher levels of human capital enabling relatively strong
labour market outcomes even in cases of limited assimilation. And finally, the melting
pot analogy first developed by Zangwill (1908) does not accurately describe the
assimilation experience of Irish immigrants in the US in the late nineteenth century. In
this dissertation, I have approached the concept of assimilation as the process by which
an immigrant group attains a level of social and economic integration into their new

273
host society such that their overall position in these sectors of society, as measured by
observable outcomes, is similar to those of the native born members of the society.
Based on this approach, it is clear from my results that Irish immigrants did not fully
assimilate into American society in this timeframe – they maintained many striking
and statistically significant differences with the native born across a range of socio-
economic characteristics and failed to achieve occupational parity in the workplace.
The melting pot analogy does not describe the experience, in aggregate, of the Irish
immigrants in my sample. As my results demonstrate, if there was a flame burning
under the melting pot for Irish immigrants in late nineteenth century America, it was
not very hot.
Returning to the title of this dissertation, one final question to address is whether the
assimilation experience of Irish immigrants in the US in the late nineteenth century
instead resembled a salad bowl. That is, did the Irish retain their own identity in their
new host society and not quickly come to resemble the native born in terms of the
various socio-economic characteristics under review. On an aggregate level, the
answer appears to be that the Irish experience did in fact resemble a salad bowl. First
generation Irish immigrants did not assimilate quickly into American society, but
retained their distinctiveness across virtually all the socio-economic characteristics
available for study using US census data. While this dissertation does not address in a
detailed manner the experience of other immigrant groups in this period, with respect
to the Irish it is clearly the case that they did not, in aggregate, melt into American
society but instead retained their distinctiveness.

274
Nonetheless, there are segments of my Irish immigrant sample that did come to more
closely resemble the native born. The aggregate results mask the fact that certain
subsets of the Irish did experience greater levels of assimilation. As was discussed in
Chapter III, Irish immigrants who became farmers or lived in more rural areas
exhibited higher levels of assimilation. So too did those Irish immigrants who were
younger or immigrated to the US as children. In Chapter IV, I described how those
Irish immigrants who married a non-Irish spouse experienced greater levels of
assimilation, and in Chapter V, I found a similar result for those Irish who lived in less
geographically clustered areas. Finally, in Chapter VI, I found that those Irish
immigrants who gave their children less Irish names also came to more closely
resemble the native born. As these examples all indicate, when the Irish immigrant
sample is segmented in certain ways, the flame burning under these segmented melting
pots becomes much hotter. Certain subsets of the Irish did assimilate more quickly
than others, and in this respect the salad bowl analogy is not an accurate representation
of their experience. The factors which appear to aid the heightened degree of
assimilation of these subsets include more time living in the US (and hence greater
exposure to American society and the skills necessary to advance in its economy), and
living in rural and/or less geographically clustered areas (where exposure to Irish and
other immigrants was reduced and exposure to the native born was likely to have been
higher). In addition, marrying a non-Irish spouse and giving children less Irish names
was also associated with higher levels of assimilation for Irish immigrants. One final
observation is that in this period, occupational mobility did appear to mirror
assimilation outcomes for the Irish. In the aggregate, Irish immigrants exhibited
limited assimilation and noticeably underperformed the native born in the workplace.

275
In the segmented analyses, those groups which had higher levels of assimilation also
experienced greater occupational mobility.
In conclusion, it would appear that for first generation Irish immigrants taken as a
whole, the flame burning under the melting pot was not very hot, and the analogy of a
salad bowl more aptly describes their assimilation process into American society in the
late nineteenth century. However, when the sample of Irish immigrants is segmented,
there are subsets which do achieve higher levels of assimilation as well as greater
occupational mobility. With respect to these subsets, the flame burning under their
melting pots would appear to have been much hotter.

276
References
Ran Abramitsky, Leah Platt Boustan and Katherine Erickson, “Europe‟s Tired, Poor, Huddled Masses: Self-Selection and Economic Outcomes in the Age of Mass
Migration”, NBER Working Paper No. 15684 (January, 2010). Donald Harman Akenson, “Irish Migration to North America, 1800-1920”, in The
Irish Diaspora, Andy Bielenberg (ed) (London: 2000).
Richard D. Alba and Reid M. Goldin, “Patterns of Ethnic Marriage in the United States”, Social Forces, Vol. 65, No. 1 (September 1986).
Norman Atkinson, Irish Education (Dublin: 1969).
Dudley Baines, Emigration from Europe, 1815-1930 (Cambridge: 1991). Francine D. Blau, “Immigration and Labor Earnings in Early Twentieth Century
America”, Research in Population Economics, Volume 2 (1980).
Peter M. Blau, Terry C. Blum, and Joseph E. Schwartz, “Heterogeneity and Intermarriage”, American Sociological Review, Vol. 47, pp. 45-62, (February 1982).
John Bodnar, Roger Simon and Michael Weber, Lives of Their Own (Urbana: 1982).
George J. Borjas, “Long-Run Convergence of Ethnic Skill Differentials: The Children and Grandchildren of the Great Migration”, Industrial and Labor Relations Review, Vol. 47, No. 4 (July 1994).
George J. Borjas, Heaven’s Door (Princeton: Princeton University Press, 1999).
Rogers Brubaker, “The return of assimilation? Changing perspectives on immigration in France, Germany and the United States”, Ethnic and Racial Studies Vol. 24, No. 4
(July 2001).
Barry R. Chiswick, “Jewish Immigrant Skill and Occupational Attainment at the Turn of the Century”, Explorations in Economic History, 28, 64-86. (1991).
Barry R. Chiswick, “Jewish Immigrant Wages in America in 1909: An Analysis of the Dillingham Commission Data”, Explorations in Economic History, 29 (1992).
Barry R. Chiswick, “Do Enclaves Matter in Immigrant Adjustment?”, Discussion Paper No. 449, The Institute for the Study of Labor (2002).
Barry R. Chiswick and Christina A. Houseworth, “Ethnic Intermarriage among
Immigrants: Human Capital and Assortative Mating”, Discussion Paper No. 3740, The Institute for the Study of Labor (2008).
Ronan Coghlan, Irish Christian Names (London: 1979).

277
Raymond L. Cohn, “A Comparative Analysis of European Immigrant Streams to the United States during the Early Mass Migration”, Social Science History, Vol. 19, No. 1
(Spring, 1995).
James S. Coleman, “Social Capital in the Creation of Human Capital”, American Journal of Sociology, Volume 94 (1988).
Timothy G. Conley and David W. Galenson, “Nativity and Wealth in Mid-Nineteenth-Century Cities”, Journal of Economic History, Vol. 58, No. 2 (June 1998).
Kathleen Neils Conzen, “German-Americans and the Invention of Ethnicity”, in America and the Germans: An Assessment of a Three-Hundred Year History, Frank
Trommler and Joseph McVeigh (eds) (Philadelphia: 1985).
Kathleen Neils Conzen, David A. Gerber, Ewa Morawska, George E. Pozzetta and Rudolph J. Vecoli, “The Invention of Ethnicity: A Perspective From the U.S.A.”, Journal of American Ethnic History, 12:1 (Fall 1992).
David M. Cutler, Edward L. Glaeser and Jacob L. Vigdor, “The rise and decline of the
American ghetto”, Journal of Political Economy, 107, 455-506 (1999). David M. Cutler, Edward L. Glaeser and Jacob L. Vigdor, “When are Ghettos Bad?
Lessons from immigrant segregation in the United States”, Journal of Urban Economics 63, 759-774. (2008).
Paul H. Douglas, “Is the New Immigration More Unskilled than the Old?”, American Statistical Association, Vol. 16, No. 126 (June 1919).
David N. Doyle, “Irish and American Labour, 1880-1920”, Saothar, vol. 1, 1975.
Otis Dudley Duncan and Beverly Duncan, “A Methodological Analysis of Segregation Indexes”, American Sociological Review 20: 210-217 (1955).
Dick Eastman, Eastman’s Online Genealogy Newsletter, April 6, 2005.
Barry Eichengreen and Henry A. Gemery, “The Earnings of Skilled and Unskilled Immigrants at the End of the Nineteenth Century”, Journal of Economic History, Vol.
XLVI, No. 2 (June, 1986). Charlotte Erickson, “The English” in Harvard Encyclopedia of American Ethnic
Groups, Stephen Thernstrom, Ann Orlov and Oscar Handlin (eds) Cambridge: 1980).
Charlotte Erickson, “The Uses of Passenger Lists for the Study of British and Irish Emigration”, in Migration Across Time and Nations, Ira A. Glazier and Luigi de Rosa (eds) (New York: 1986).
Charlotte Erickson, “Emigration to the British Isles in 1841: Part I.” Population
Studies 43 (1989).

278
Nora Faires, “Occupational Patterns of German-Americans in Nineteenth-Century Cities”, in German Workers in Industrial Chicago, 1850-1910: A Comparative
Perspective, Harmet Keil and John B. Jentz (eds) (Dekalb: 1983).
Imre Ferenczi and Walter F. Willcox, International Migrations, Volume 1 Statistics (New York: 1929).
Joseph P. Ferrie, “A New Sample of Males Linked from the Public Use Micro Sample of 1850 U.S. Federal Census of Population to the 1860 U.S. Federal Census
Manuscript Schedules”, Historical Methods (Fall 1996). Joseph P. Ferrie, “The Entry into the U.S. Labor Market of Antebellum European
Immigrants, 1840-60”, Explorations in Economic History (July 1997).
Joseph P. Ferrie, Yankeys Now – Immigrants in the Antebellum U.S. 1840-1860 (New York: Oxford University Press, 1999).
David Fitzgerald, Irish Emigration 1801-1921 (Dublin: 1985).
Mark C. Foley and Timothy W. Guinnane, “Did Irish Marriage Patterns Survive the Emigrant Voyage? Irish-American Nuptiality, 1880-1920”, Irish Economic and Social History, 26 (1999).
Gary P. Freeman, “Immigrant Incorporation in Western Democracies”, International
Migration Review, Vol. 38, No. 3 (Fall 2004). Roland G. Fryer, Jr. and Steven D. Levitt, “The Causes and Consequences of
Distinctively Black Names”, The Quarterly Journal of Economics, Vol. CXIX, Issue 3 (August 2004).
Herbert J. Gans, “Acculturation, assimilation and mobility”, Ethnic and Racial Studies, Vol. 30, No. 1 (January 2007).
Nathan Glazer and Daniel Patrick Moynihan, Beyond the Melting Pot (Cambridge:
1963). Arthur A. Goren, “The Jews” in Harvard Encyclopedia of American Ethnic Groups,
Stephen Thernstrom, Ann Orlov and Oscar Handlin (eds) (Cambridge: 1980).
Milton M. Gordon, Assimilation in American Life (New York: 1964). Timothy W. Guinnane, The Vanishing Irish (Princeton: 1997).
Timothy W. Guinnane, Carolyn M. Moehling and Cormac O‟Grada, “The fertility of
the Irish the United States in 1910”, Explorations in Economic History, 43 (2006). Michael R. Haines, “The Use of Historical Census Data for Mortality and Fertility
Research”, NBER Working Paper No. 31 (October 1991).

279
Christopher Hanes, “Immigrants‟ Relative Rate of Wage Growth in the Late 19 th Century”, Explorations in Economic History, 33, 35-64. (1996).
Joan Hannon, “City Size and Ethnic Discrimination: Michigan Agricultural
Implements and Iron Working Industries, 1890.” Journal of Economic History 57. (1982a).
Joan Hannon, “Ethnic Discrimination in a 19th century Mining District: Michigan Copper Mines, 1888.” Explorations in Economic History, 19, 28-50. (1982b).
Timothy J, Hatton, “The Immigrant Assimilation Puzzle in Late Nineteenth Century America,” The Journal of Economic History, Vol. 57, No. 1, 34-62, (March 1997).
Timothy J. Hatton and Andrew Leigh, “Immigrants assimilate as communities, not just
as individuals”, Journal of Population Economics, (forthcoming). Timothy J. Hatton and Jeffery G. Williamson, Migration and the International Labor
Market, 1850-1939 (London: 1994).
Timothy J. Hatton and Jeffery G. Williamson, “The Impact of Immigration on American Labor Markets Prior to the Quotas”, NBER Working Paper No. 5185 (July 1995).
Historical Census Browser. The University of Virginia, Geospatial and Statistical Data
Center: http://fisher.lib.virginia.edu/collections/stats/histcensus/index.html. (2004). August B. Hollingshead, “Cultural Factors in the Selection of Marriage Mates”,
American Sociological Review, Vol. 15 (Oct. 1950).
Mary C. Kelly, The Shamrock and The Lilly – The New York Irish and The Creation of a Transatlantic Identity 1845-1921 (New York: 2005).
Kevin Kenny, “Labor and Labor Organizations” in Making the Irish American: History and Heritage of the Irish in the United States, J.J. Lee and Marion R. Casey
(eds) (New York: 2006). Thomas Kessner, The Golden Door – Italian and Jewish Immigrant Mobility in New
York City 1880-1915 (New York: 1977).
Hermann Kurthen and Barbara Schmitter Heisler, “Immigrant integration: comparative evidence from the United States and Germany”, Ethnic and Racial Studies, Vol. 32, No. 1, (January 2009).
Nancy S. Landale and Stewart E. Tolnay, “Generation, Ethnicity and Marriage:
Historical Patterns in the Northern United States”, Demography, Vol. 30, No.1 (February 1993).
Bruce Laurie, Theodore Hershberg and George Alter, “Immigrants and Industry: The Philadelphia Experience: 1850-1880”, Journal of Social History, Vol. 9, No. 2 (Winter
1975).
280
Steven D. Levitt and Stephen J. Dubner, Freakonomics (New York, 2005).
Stanley Lieberson, A Matter of Taste (New Haven: 2000).
Stanley Lieberson and Eleanor O. Bell, “Children‟s First Names: An Empirical Study of Social Taste,” The American Journal of Sociology, Vol. 98, No. 3, 511-554
(November 1992).
Ivan Light and Richard E. Isralowitz, Immigrant Entrepreneurs and Immigrant Absorption in the United States and Israel (Aldershot: 1996).
Jason Long and Joseph Ferrie, “Geographic and Occupational Mobility in Britain and the U.S. 1850-1881.” Working Paper (2004).
Jason Long and Joseph Ferrie, “‟Everything in Common… But the Language?‟ Intergenerational Mobility in Britain and the US since 1850”, NBER Working Paper
11253 (2005).
Jason Long and Joseph Ferrie, “The Path to Convergence: Intergenerational Occupational Mobility in Britain and the U.S. in Three Eras”, Economic Journal (March 2007).
Diana L. Magnuson and Miriam L. King, Comparability of the Public Use Microdata
Samples: Enumeration Procedures”, Historical Methods, Winter 1995, Volume 28, Number 1, p. 31.
Lawrence J. McCaffrey, “Forging Forward and Looking Back”, in The New York Irish, Ronald H. Bayor and Timothy J, Meagher (eds) (Baltimore: Johns Hopkins University
Press, 1996). Paul F. McGouldrick and Michael B. Tannen, “Did American Manufacturers
Discriminate Against Immigrants Before 1914?” Journal of Economic History 37, No. 3 (September, 1977).
John R. McKivigan and Thomas J. Robertson, „The Irish American Worker in Transition, 1877-1914” in The New York Irish, Ronald H. Bayor and Timothy J,
Meagher (eds) (Baltimore: Johns Hopkins University Press, 1996).
Kerby A. Miller, “Assimilation and alienation: Irish emigrants‟ responses to industrial America, 1871-1921”, in The Irish in America: Emigration, Assimilation and Impact , P.J. Drudy (ed) (Cambridge: 1985).
Jacob Mincer, “Family Migration Decisions,” The Journal of Political Economy, Vol. 86,
No. 5 (Oct., 1978).
Chris Minns, “Income, Cohort Effects, and Occupational Mobility: A New Look at
Immigration to the United States at the Turn of the 20th Century”, Explorations in Economic History, 37 (2000).

281
Minnesota Population Center. North Atlantic Population Project: Complete Count Microdata. Version 2.0 [Machine-readable database]. Minneapolis: Minnesota
Population Center, 2008.
David F. Mitch, The Rise of Popular Literacy in Victorian England (Philadelphia: 1992).
Deanna L. Pagnini and S. Phillip Morgan, “Intermarriage and Social Distance Among US Immigrants at the Turn of the Century”, The American Journal of Sociology, Vol.
96 No. 2. pp. 405-432, (September 1990). Samuel H. Preston and Michael R. Haines, Fatal Years – Child Mortality in Late
Nineteenth Century America (Princeton: 1991).
Alejandro Portes, The Economic Sociology of Immigration (New York: 1995). Alejandro Portes and Ruben G. Rumbaut, Immigrant America (Berkeley: 1996).
Alejandro Portes and Ruben G. Rumbaut, “Introduction: The Second Generation and
the Children of Immigrants Longitudinal Study”, Ethnic and Racial Studies, Vol. 28, No. 6 pp. 983-999, (November, 2005).
Alejandro Portes and Min Zhou, “The New Second Generation: Segmented Assimilation and its Variants”, Annals of the American Academy of Political and
Social Science, Vol. 530, (November 1993). Bryan R. Roberts, “Socially Expected Durations and the Economic Adjustment of
Immigrants”, in The Economic Sociology of Immigration, Alejandro Portes (ed) (New York: 1995).
Alice S. Rossi, “Naming Children in Middle-Class Families,” American Sociological Review, Vol. 30, No. 4, 499-513 (August, 1965).
Steven Ruggles, J. Trent Alexander, Katie Genadek, Ronald Goeken, Matthew B.
Schroeder, and Matthew Sobek. Integrated Public Use Microdata Series: Version 5.0 [Machine-readable database]. Minneapolis: University of Minnesota, 2010.
Robert Schoen, “A Methodological Analysis of Intergroup Marriage”, Sociological Methodology, Vol. 16 (1986).
Matthew Sobek, “Work, Status and Income – Men in the American Occupational Structure since the Late Nineteenth Century”, Social Science Review 20:2 (summer
1996).
Matthew Sobek and Lisa Dillon, “Interpreting work: Classifying occupations in the Public Use of Microdata Samples”, Historical Methods, Winter 1995, Volume 28, Number 1.
Richard H. Steckel, “Census Matching and Migration: A Research Strategy,”
Historical Methods, 21:2 (Spring: 1988).
282
Richard H. Steckel, “The Quality of Census Data for Historical Inquiry: A Research
Agenda,” Social Science History 15:4 (Winter, 1991).
James I. Stewart, “Migration to the agricultural frontier and wealth accumulation, 1860-1870”, Explorations in Economic History, 43 (2006).
R. P. Swierenga, “Dutch International Migration and Occupational Change: A Structural Analysis of Multinational Linked Files”, in Migration Across Time and
Nations, Ira A. Glazier and Luigi de Rosa (eds) (New York: 1986). Stephan Thernstrom, Poverty and Progress – Social Mobility in a Nineteenth Century
City (Cambridge: 1964).
Stephan Thernstrom, The Other Bostonians – Poverty and Progress in the American Metropolis (Cambridge: 1973).
Susan Cotts Watkins and Andrew S. London, “Personal Names and Cultural Change”, Social Science History 18:2 (Summer, 1994).
Israel Zangwill, The Melting Pot (New York: 1909).
Wilbur Zelinsky, “Cultural Variation in Personal Name Patterns in the Eastern United States,” Annals of the Association of American Geographers, Vol. 60, No. 4
(December, 1970).