downlink resource allocation for evolved utran and · pdf filedownlink resource allocation for...
TRANSCRIPT

Downlink resource allocation for evolved UTRAN andWiMAX cellular systemsJorguseski, L.; Lê, T.M.H.; Fledderus, E.R.; Prasad, R.
Published in:IEEE 19th International Symposium on Personal, Indoor and Mobile Radio Communication 2008, PIMRC 2008,15-18 September 2008, Cannes, France
DOI:10.1109/PIMRC.2008.4699547
Published: 01/01/2008
Document VersionPublisher’s PDF, also known as Version of Record (includes final page, issue and volume numbers)
Please check the document version of this publication:
• A submitted manuscript is the author's version of the article upon submission and before peer-review. There can be important differencesbetween the submitted version and the official published version of record. People interested in the research are advised to contact theauthor for the final version of the publication, or visit the DOI to the publisher's website.• The final author version and the galley proof are versions of the publication after peer review.• The final published version features the final layout of the paper including the volume, issue and page numbers.
Link to publication
Citation for published version (APA):Jorguseski, L., Lê, T. M. H., Fledderus, E., & Prasad, R. (2008). Downlink resource allocation for evolvedUTRAN and WiMAX cellular systems. In IEEE 19th International Symposium on Personal, Indoor and MobileRadio Communication 2008, PIMRC 2008, 15-18 September 2008, Cannes, France (pp. 1-5). Piscataway:Institute of Electrical and Electronics Engineers (IEEE). DOI: 10.1109/PIMRC.2008.4699547
General rightsCopyright and moral rights for the publications made accessible in the public portal are retained by the authors and/or other copyright ownersand it is a condition of accessing publications that users recognise and abide by the legal requirements associated with these rights.
• Users may download and print one copy of any publication from the public portal for the purpose of private study or research. • You may not further distribute the material or use it for any profit-making activity or commercial gain • You may freely distribute the URL identifying the publication in the public portal ?
Take down policyIf you believe that this document breaches copyright please contact us providing details, and we will remove access to the work immediatelyand investigate your claim.
Download date: 24. May. 2018

> REPLACE TI-llS LINE WITH YOUR PAPER IDENTIFICATION NUMBER (DOUBLE-CLICK HERE TO EDIT) <
Downlink Resource Allocation for EvolvedUTRAN and WiMAX Cellular Systems
L. Jorguseski, T. M. H. Le, E. R. Fledderus, R. Prasad
Abstract-The future broadband wireless cellular systemsEvolved UTRAN (E-UTRAN) and WiMAX are receiving a lot ofinterest in recent years. Both systems deploy OrthogonalFrequency Division Multiplex (OFDM) physical layer consistingof large number of mutually orthogonal sub-carriers. Thisphysical layer provides high robustness against multi-patheffects, high flexibility in allocation of the physical resources,high bandwidth scalability and relatively easy combination withMultiple-Input-Multiple-Output (MIMO) transmission andreception. In this study we investigate several algorithms forallocation of the downlink resources for E-UTRAN and WiMAXcellular systems. The goal of the study is to see the differences indownlink sector and user throughput, and user throughputversus distance from the reference base station for the resourceallocation algorithms: Reuse-one, Reuse-three, Soft re-use, Reusepartitioning, Proportional Fair and Maximum ell. Additionally,we observe the difference in performance between E-UTRANand WiMAX under the conditions selected in this study. Theevaluations are done via MATLAB simulations of a cellularsystem with one central three-sectored site surrounded with twotiers of interfering three-sector sites.
Index Terms-oFDM, OFDMA, E-UTRAN, WiMAX,downlink resource allocation, resource allocation algorithms,sector throughput, user throughput, user throughput versusdistance.
I. INTRODUCTION
HE future wireless broadband systems such as EvolvedTUTRAN (E-UTRAN) and WiMAX aim at providing high
peak rates, low latency, high efficiency and scalability ofthe bandwidth usage, support for wide range of services
with different QoS requirements to the end users, etc. In orderto meet these goals an Orthogonal Frequency DivisionMultiplex (OFDM) physical layer has been selected for EUTRAN and WiMAX systems. Additionally, the OFDMphysical layer enables the so-called Orthogonal FrequencyDivision Multiple Access (OFDMA) where the different subcarriers are grouped in sub-channels (or resource units) in thetime and frequency domain and consequently allocated todifferent users. The OFDMA combined with advancedphysical layer procedures such as Multiple-Input-MultipleOutput (MIMO) transmission and reception, adaptivemodulation and coding (AMC), power control, etc. and alsochannel aware scheduling introduces high flexibility andefficiency when allocating the available resources to differentusers.
978-1-4244-2644-7/08/$25.00 ©2008 IEEE
In this study we evaluate the downlink throughputperformance in an E-UTRAN system according to therecommendations in [1][2] and a WiMAX system according to[3]-[5]. Here, we extend our previous work presented in [6]
.with the addition of proportional fair resource allocationalgorithm in the analysis and evaluation of the WiMAXsystem. These evaluations are important because operatorsworld-wide are interested in the throughput performance ofthe E-UTRAN and WiMAX systems while few detailedresults are available in the literature. The WiMAX Forum haspresented performance evaluations in [3] without detailedpresentation of the used allocation algorithms and in [4] acomparison is made between WiMAX and HSPA and not withE-UTRAN. In 3GPP downlink throughput evaluations weredone [7]-[9] to test the downlink capabilities of the E-UTRANwithout extensive analysis of different options for theallocation algorithms and with few details about thethroughput versus distance performance.
The rest of the paper is organized as follows. The conceptof downlink resource allocation in E-UTRAN and WiMAX ispresented in Section II. The different resource allocationalgorithms investigated in this study are presented in SectionIII. Section IV contains the simulation set-up, results andobservations. The paper is finalized with the conclusions andrecommendations in Section V.
II. DOWNLINK RESOURCE ALLOCATION IN E-UTRAN ANDWIMAX
Orthogonal Frequency Division Multiplexing Access(OFDMA) employs multiple closely spaced sub-carriers,which are grouped in sub-channels. The sub-carriers that forma sub-channel need not be adjacent. In the downlink, a subchannel may be intended for different users depending on theirchannel conditions and data requirements. The Node B canallocate more transmit power to user devices with lowerSignal-to-Interference-and-Noise Ratio (SINR) per subchannel, and less power to user devices with higher SINR.
In an OFDMA cellular system, there is a two-dimensionalspace of the radio resources - Time-Frequency (T-F) resourceas presented in Fig.l. There are S sub-channels in thefrequency domain F In the time domain T there are NOFDMA symbols, which are signals generated by the inverseFFT in the transmitter including a cyclic prefix and suffix. AnOFDMA symbol is made up of sub-carriers, whose number isdetermined by the size of the FFT used.
Authorized licensed use limited to: Eindhoven University of Technology. Downloaded on January 29, 2010 at 09:06 from IEEE Xplore. Restrictions apply.

> REPLACE THIS LINE WITH YOUR PAPER IDENTIFICATION NUMBER (DOUBLE-CLICK HERE TO EDIT) < 2
MAIN PARAMETERS FOR E-UTRAN AND WIMAX DOWNLINK
Sector 3
Sector 2
Sector 1
B. Reuse-three
The number of available RUs is divided in three disjointsets, which are consequently used in different sectors. Withinone sector the users are allocated for RUs of this sectorrandomly.
C. Soft re-use
All available sub-carriers are used in each sector as in caseof Reuse-one, but the power allocated to sub-carriers is notequal as presented in Fig. 2.
In this section we present in detail the considered downlinkresource allocation algorithms for E-UTRAN and WiMAX.
A. Reuse-one
All available RUs can be allocated in a random fashion ineach sector with reuse one. One user (E-UTRAN system) andone or more users (WiMAX system) are randomly selected foreach RU.
performance and system level simulations [2], [5]. EESM isused to derive throughput (usually determined via link levelsimulations) from SINR calculated on system level.
III. DOWNLINK RESOURCE ALLOCATION ALGORITHMS FOROFDMA SYSTEMS
T........
1 1 1 11 1 1 1
- -.- - , - - r - -1- -1 1 1 11 1 1 1
- -1- - , - - r - -1- -1 1 1 11 1 1 1
- i - - , - - r - -1- -1 1 1 11 1 1 1
- ,- -"i - - r - -I--1 1 1 11 1 1 1
- -1- - 1 - - r - -1- -
1 1 1 1
N symbols( )
"1 1 1 1 11 1 1 1 1
- - T - - r - -1- - , - - 11 1 1 1 11 1 1 1 1
- - i' - - r - -1- - 1 - - 11 1 1 1 11 1 1 1 1
- - i - - r - -1- -1- - T1 1 1 1 1__ J. __ L __I__ J __ !1 1 1 1 11 1 1 1 1__ .1 __ L __1__ J __ 11 1 1 1 11 1 1 1 1
~~I--~I--~I~I~~I--t--~-~--~--t1 1 1 1 1 1 1 1 1 1__~_~__ ~ __ L __~_~ __ L __~_~__ J
Parameter E-UTRAN WiMAX
Nr. OFDMsym. 12 per TTl 35 per DL frame
Total sub-carriers 1024 1024
Used sub-carriers 705 840
Number ofRUs 15 30
Nr. Sub-carriers per RU 47 28
Figure 1 OFDMA downlink resource grid
The time-frequency resources are organized into a numberof Resource Units (RUs) in both E-UTRAN system [2] andWiMAX systems [3]. The other terminology also used in EUTRAN for RU is Physical Resource Block (PRB) [1]. A RUconsists of a set of sub-carriers for a number of consecutiveOFDMA symbols. Some main parameters for both systems indownlink are given as follows:
TABLE 1
where j 1:- s if i =b
Figure 2 Power allocations per RU for soft re-use in E-UTRAN, and WiMAXsystems
(2)
(1)1 N RU
Gavg =-LG(r)N RU r=l
where G(r) is the average geometry per RU and given by [5]:
pRU /LG(r) = J r r,b.s b,s
l\ul/ ]1;_lOr
'" '" pRU /L + N RUL-J L-J r,;,} ;,} til
i=1 }=1
The number of sub-carriers with Pedge (dark color) is 1/3 ofthe total number of sub-carriers, hence, the rest (2/3) will havepower Pclose (light color). The algorithm works as follows.First, we classify users into "close" (close to the cell center)and "edge" (close to the cell edge) users based on comparing
the user's average geometry Gavg with a pre-defined threshold
Gth.
In E-UTRAN systems, both transmissions on localized(consecutive) and distributed (non-consecutive) sub-carriersare supported. In this study only localized sub-carriertransmissions are considered for the E-UTRAN system.
Similarly, in WiMAX TDD systems, diversity permutationand contiguous permutation can be used for subchannelization [3]. Note that the downlink Partially Used SubChannels (PUSC), one type of diversity permutations, is takeninto account in our WiMAX study.
Link adaptation (AMC: Adaptation Modulation andCoding) with various modulation schemes and channel codingrates is applied to each RU and TTl (Transmission TimeInterval) for E-UTRAN and downlink sub-frame for WiMAX.With AMC, the power of transmitted signal is held constantover a frame interval, and the modulation and coding format ischanged to match the current received signal quality orchannel conditions. When the radio link is good, a high levelmodulation is used, and when the radio link is bad, a lowlevel, but robust modulation is used. QPSK, 16QAM, and64QAM are supported downlink data modulation schemes inboth E-UTRAN [2] and WiMAX [3]. The best AMC schemeper RU is selected by using Exponential Effective SIRMapping (EESM), which is the interface between link level
Authorized licensed use limited to: Eindhoven University of Technology. Downloaded on January 29, 2010 at 09:06 from IEEE Xplore. Restrictions apply.
> REPLACE THIS LINE WITH YOUR PAPER IDENTIFICATION NUMBER (DOUBLE-CLICK HERE TO EDIT) < 3
Pr~b~s is the allocated transmission power to the r th RU from
the bth node B and sector s. Li,j is the propagation lossincluding path loss, shadowing, antenna gain between user and
the jth node B and sector j. Nt~U is the thermal noise level forRU.
All users with G avg ~ Gth are "edge" users, and users with
Gavg > Gth are "close" users. Gth is defined upon on the trade
off between average sector throughput and average userthroughput versus distance (see also Table II). All RUs withPclose are allocated to close users while RUs with Pedge are usedby the edge users in random fashion.
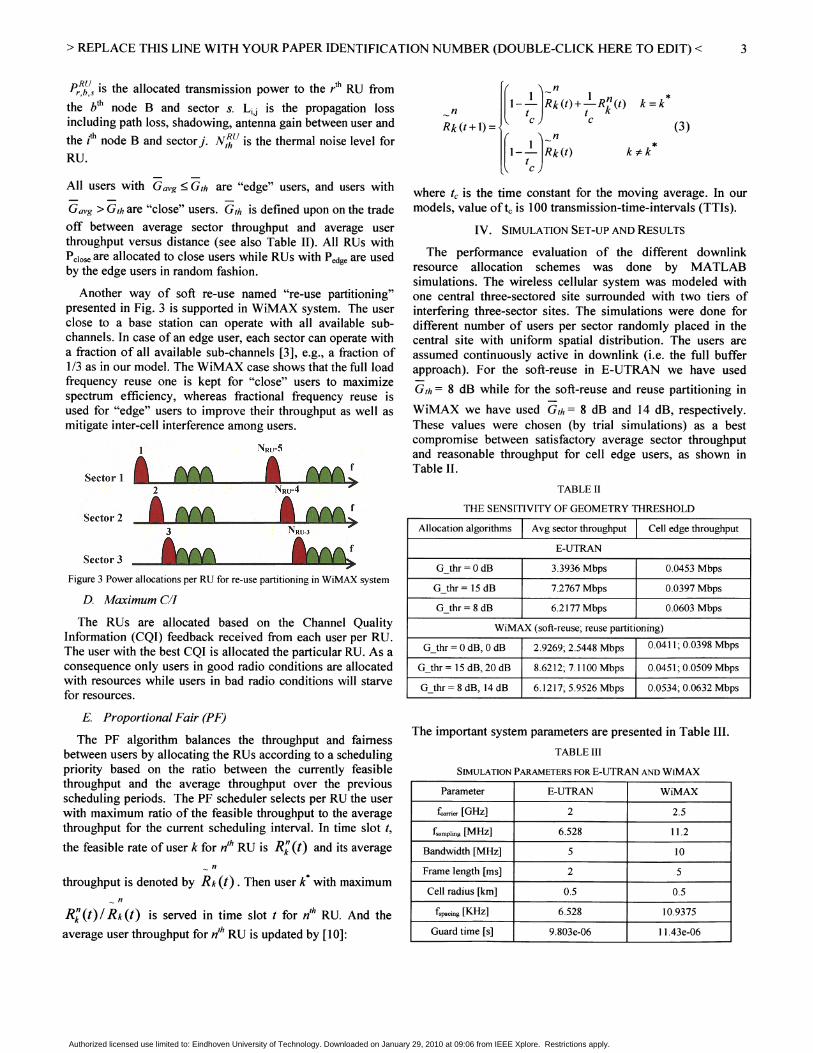
Another way of soft re-use named "re-use partitioning"presented in Fig. 3 is supported in WiMAX system. The userclose to a base station can operate with all available subchannels. In case of an edge user, each sector can operate witha fraction of all available sub-channels [3], e.g., a fraction of1/3 as in our model. The WiMAX case shows that the full loadfrequency reuse one is kept for "close" users to maximizespectrum efficiency, whereas fractional frequency reuse isused for "edge" users to improve their throughput as well asmitigate inter-cell interference among users.
NRU-5
Sector 1
Sector 2
Sector 3
Figure 3 Power allocations per RU for re-use partitioning in WiMAX system
D. Maximum ell
The RUs are allocated based on the Channel QualityInformation (CQI) feedback received from each user per RU.The user with the best CQI is allocated the particular RU. As aconsequence only users in good radio conditions are allocatedwith resources while users in bad radio conditions will starvefor resources.
E. Proportional Fair (PF)
The PF algorithm balances the throughput and fairnessbetween users by allocating the RUs according to a schedulingpriority based on the ratio between the currently feasiblethroughput and the average throughput over the previousscheduling periods. The PF scheduler selects per RU the userwith maximum ratio of the feasible throughput to the averagethroughput for the current scheduling interval. In time slot t,
the feasible rate of user k for nth RU is R; (t) and its average
~n
throughput is denoted by Rk(t). Then user k* with maximum~n
R;(t)/ Rk(t) is served in time slot t for nth RU. And the
average user throughput for nth RU is updated by [10]:
[ J n1 -- 1 *I-t:;"" Rk(t)+t:;""R;(t) k=k
n
Rk(t+l) = (3)
[1- t: }~;(t) *k*k
where tc is the time constant for the moving average. In ourmodels, value of tc is 100 transmission-time-intervals (TTIs).
IV. SIMULATION SET-UP AND RESULTS
The performance evaluation of the different downlinkresource allocation schemes was done by MATLABsimulations. The wireless cellular system was modeled withone central three-sectored site surrounded with two tiers ofinterfering three-sector sites. The simulations were done fordifferent number of users per sector randomly placed in thecentral site with uniform spatial distribution. The users areassumed continuously active in downlink (Le. the full bufferapproach). For the soft-reuse in E-UTRAN we have used
Gth = 8 dB while for the soft-reuse and reuse partitioning in
WiMAX we have used Gth = 8 dB and 14 dB, respectively.These values were chosen (by trial simulations) as a bestcompromise between satisfactory average sector throughputand reasonable throughput for cell edge users, as shown inTable II.
TABLE II
THE SENSITIVITY OF GEOMETRY THRESHOLD
Allocation algorithms Avg sector throughput Cell edge throughput
E-UTRAN
G_thr = 0 dB 3.3936 Mbps 0.0453 Mbps
G_thr = 15 dB 7.2767 Mbps 0.0397 Mbps
G_thr = 8 dB 6.2177 Mbps 0.0603 Mbps
WiMAX (soft-reuse~ reuse partitioning)
G_thr = 0 dB, 0 dB 2.9269~ 2.5448 Mbps 0.0411 ~ 0.0398 Mbps
G_thr = 15 dB, 20 dB 8.6212~ 7.1100 Mbps 0.0451~ 0.0509 Mbps
G_thr = 8 dB, 14 dB 6.1217~ 5.9526 Mbps 0.0534~ 0.0632 Mbps
The important system parameters are presented in Table III.
TABLE III
SIMULATION PARAMETERS FOR E-UTRAN AND WIMAX
Parameter E-UTRAN WiMAX
fcarrier [GHz] 2 2.5
fsampling [MHz] 6.528 11.2
Bandwidth [MHz] 5 10
Frame length [ms] 2 5
Cell radius [km] 0.5 0.5
fspacing [KHz] 6.528 10.9375
Guard time [s] 9.803e-06 11.43e-06
Authorized licensed use limited to: Eindhoven University of Technology. Downloaded on January 29, 2010 at 09:06 from IEEE Xplore. Restrictions apply.

> REPLACE THIS LINE WITH YOUR PAPER IDENTIFICATION NUMBER (DOUBLE-CLICK HERE TO EDIT) < 4
30
30
25
25
- -: - - - "'--~-R-e--u-se-1-----"
15 20Number of Users per Sector
10
10
I,-II
J _III
~- I1
J _I1
1 I"1 - - - - - - - 1- - - - - - - i - - -
I I II I I
Average User Throughput vs Number of Users; Pedestiran B; WiMAXI - - - - - - - ,- - - - - - - T - - - - - - -I - - - - - - - - - - - - - -
I I I I ~Re-use 1I : ~ : _ _ _ _ Re-use 3
I I I Soft Re-use: : : Maximum en
I - - - - - - 1- - - - - - - T - - - - - - -I - - - - Proportional Fair
: : : Soft Partitioning---- --------~------~-------~------4-
I I I I1 I I 1
___ ,_ _ _ _ _ _ .1 I L -.l _
1 I I I II I I I, I I I I
- - 1- - - - - - - T - - - - - -I - - - - - - - I - - - - - - -, -
I I II I I
--- -+------~------- -----~-
I II 1
_ ~ L J_I
o 5
15 20Number of Users per Sector
Figure 6 E-UTRAN sector throughputs with 95% confidence intervals
Average User Throughput vs Number of users; Pedestrian B; E·UTRAN0.4 -, - - - - - - - ,- - - - - - - T - - - - - - -, - - - - - - - r - - - - - - -, -
I : : : ~Re-use 1I I I Re-use 3
- - - - - -:- - - - - - -: - - - - - -: - - - Soft Re-use
I I I I Maximum en~ - - - - - -:- - - - - - - +- - - - - - -: - - - Proportional Fair -
I I I I I II I I I I I
-l 1 .1 I L - - _ ..J -
I 1 1 I I
I I 1 I II 1 1 1
-----+------~-------t_------..,-
1 1 I I
1 I 1 II I I
- - - - -I - - - - - - - I - - - - - - "1 -
I I II I I
I I--------,-
0.4 5
~,g- 0.25C)~e~ 0.2I-...G)en::J 0.15
"G)
.~
~ 0.1oZ
0.05
Average Sector Throughput vs Number of Users; Pedestrian B; E·UTRAN2.4 I - - - - - - - 1- - - - - - - T - - - - - - -I - - - - - - - r - - - - - - I -
I I I 1 I 1
I I 12.2 I - - - - - - - 1- - - - - - - --
N 1
~ 2 ~ - - - - - -:- - - - - - - ~ - - - - - - -: - - - :::::.ee-~se:a I I I Maximum eni 1.8 - - - - - - -:- - - - - - - 7- - - - - - -: - - - Proportional Fair -Q. I I I I I 1
~ 1.6 4 - - - - - - - 1- - - - - - - ~ - - - - - - -I - - - - - - - ~ - - - - - - 4 -
e: : : : : :~ 1.4 .., - - - - - - - 1- - - - - - - + - - - - - - -I - - - - - - - t_ - - - - - - .., -... I I I I I I
~ 10: ~J-- uL 1--u~ __ ~ 1-~ I I 1 I I I
~ J ± -.I I ~... 0.8o I I I I IZ I 1 I I I
O~ 1 t ~ ----~
I I I
o 5 10 15 20 25 30Number of Users per Sector
Figure 5 WiMAX user throughputs with 950/0 confidence intervals
0.16
Figure 7 E-UTRAN user throughputs with 95% confidence intervals
0.18
NJ:iii 0.14;:a
B'5 0.12Q.~C)e 0.1~....:; 0.08en::J
i 0.06.~"iE0.04oz
0.02
Symbol dur. [s] 166.67e-06 102.86e-06
Total DL power [W] 20 40
DL modulation QPSK~ 16QAM QPSK~ 16/64 QAM
Coding rates l/3~ l/2~ 2/3~ 3/4~ 4/5 l/2~ 2/3~ 3/4~ 5/6
Antenna gain 14dBi 16dBi
Antenna FTB ratio 20 dB 25 dB
Link-level interf. EESM EESM
Nth [dBmlHz] -174 -174
(Jsh [dB] 8 8.9
Shadow COIT. 0.5 0.5
0.2 5 10 15 20 25 30Number of Users per Sector
Figure 4 WiMAX sector throughputs with 95% confidence intervals
The Proportional Fair (PF), Soft Re-use and ReusePartitioning have similar performance with regard to theaverage sector/user throughput. In practice it is expected thatthe PF algorithm will perform better as it uses the channelquality feedback from the UEs and tries to achieve fairness byweighting the achieved throughput in the previous allocations.The soft reuse schemes in this study were already 'optimized'for the uniform spatial distribution of the end users byselecting an appropriate geometry threshold for deciding if theUE is 'close' or at the 'cell edge'. In practice this could bedifficult to achieve. The reuse three has the worst performanceas it uses only one third of the available bandwidth.
The link level results [2] (Table 22, 23) and [11] (Table 3.1to 3.4) are used for the E-UTRAN and WiMAX system,respectively, for the mapping between the effective SINR andthe block error rate (BLER) for each AMC combination.
The normalized average sector and user throughput forWiMAX and E-UTRAN systems is presented in Fig. 4 to Fig.7. The normalization is done with the system bandwidth. Notethat the vertical bars in these figures are the 95% confidenceintervals. For both systems the maximum ell resourceallocation algorithm has the best average sector/userthroughput performance. This is because the RUs are allocatedalways to the user that has the best channel conditions at themoment of allocation.
Average Sector Throughput vs Number of Users; Pedestrian B; WiMAX1.8 I - - - - - - - ,- -- - - - - T - - - - - - -, - - - - - - - r - - - - - - I -
, , , I 1 I
I I I I 1 I
N 1.6 ~ - - - - - - -:- - - - - - - +- - - - - - -: - - - - - - - ~ - - - - - - 1_
J: I I 1 I 1lu ~ ------_:~ ------+- - - - - - I
:;: : I I Re-use 3~ 1.2 -l - - - - - - - 1- - - - - - .L - - - - - - -I - - - Soft Re-usem I I I~ I I I ~Maximum enef3. 1 ~ _ _ _ _ - -:- - ~ __ - - - __: ~Proportional Fair -.. 1 1 1 I Soft Partitioning
~: : : : : :~ 0.8 - - - - - - 1- - - - - - - i - - - - - - -I - - - - - - - I - - - - - - "1 -
1 ~uu-= ; _L .._ ..~i 0.6Ell Io I 1 I
zO.4 .. 1t- I
Authorized licensed use limited to: Eindhoven University of Technology. Downloaded on January 29, 2010 at 09:06 from IEEE Xplore. Restrictions apply.

> REPLACE THIS LINE WITH YOUR PAPER IDENTIFICATION NUMBER (DOUBLE-CLICK HERE TO EDIT) < 5
concluded that the throughput performance trends with regardto the different downlink resource allocation algorithms aresame for E-UTRAN and WiMAX. The proportional fairalgorithm can be seen as the best option for the E-UTRAN andWiMAX systems as it has significantly high sector/userthroughput and reasonable fair user throughput distributionwith regard to the distance from the reference site.
The downlink throughput performance of the E-UTRANsystem outperforms the throughput performance of WiMAX.For example, if we select the proportional fair downlinkresource allocation as a reference we see that E-UTRANoutperforms the WiMAX system roughly by 50% regardingthe average sector throughput and 100% regarding the averageuser throughput or user throughput at the cell edge. However,this should be taken with a reserve as it highly depends on thesystem conditions taken in this study and the assumptionsmade for the link level performance in E-UTRAN [2] andWiMAX [11].
As a recommendation for further study we plan to furtherestimate the downlink throughput performance of E-UTRANand WiMAX via an analytical approach and compare theseanalytical estimations with the simulation results presentedhere. Furthermore, this comparison should be repeated whenminimum link-level requirements are available for the EUTRAN system in 3GPP (expected in second half of 2008)and link-level results for WiMAX in IEEE and/or WiMAXforum.
REFERENCES
[1] 3GPP TR 25.912~ "Feasible study for evolved Universal TerrestrialRadio Access (UTRA) and Universal Terrestrial Radio Access Network(UTRAN)'~~ V7.0.0~ June 2006
[2] 3GPP TR 25.892~ "Feasibility study for Orthogonal Frequency DivisionMultiplexing (OFDM) for UTRAN enhancements~~~ V 6.0.0~ June 2004
[3] WiMAX forum~ "Mobile WiMAX Part 1: A technical overview andperformance evaluation"~ August 2006
[4] WiMAX Forum, "Mobile WiMAX - Part II: A Comparative Analysis~~,
August 2006
[5] WiMAX forum~ "WiMAX system evaluation methodology"~ Version2.0, December 15~ 2007
[6] L. Jorguseski, R. Prasad~ ~ "Downlink resource allocation in beyond 3GOFDMA cellular systems", the 18th annual IEEE InternationalSymposium on Personat Indoor, and Mobile Radio Communications(PIMRC 07), September~ 2007~ Athens, Greece.
[7] RI-071991~ "LTE Downlink System Performance Verification Results",Motorola, April 23-24, 2007.
[8] RI-071956, "E-UTRA Performance Checkpoint: Downlink~', Ericsson,April 23-24, 2007.
[9] RI-071967, "DL E-UTRA Performance Checkpoint", Alcatel-Lucent,April 23-24, 2007
[10] J-G Choi and S. Bahk, "Cell throughput analysis of the proportional fairscheduling policy~~, Proceedings of NETWORKING 2004, May 2004,Athens, Greece
[11] WiMAX Forum Applications Working Group, "System Design andAWGN results"~ December 14 2007~ www.wimaxforum.org
..... Reuse 1
...... Reuse3-Soft reuse--Maximum CII~Proportional Fair
1
1
1 I 1 1 I I-1---1-----------------
1
1
The reuse one has better performance than the reuse threeand its performance can be improved by either differentiationbetween close and edge users (e.g. soft reuse or reusepartitioning) or implementing channel aware resourceallocation (e.g. proportional fair).
Another important performance measure is the dependenceof the average user throughput versus the distance from thereference cell. This evaluation is presented in Fig. 8 and Fig. 9for the WiMAX and E-UTRAN system, respectively. Fromthe enlargement of Fig. 9 and Fig. lOwe can see that thedrawback of the maximum ell algorithm is that itdiscriminates users near the cell edge. Especially, the users atthe cell edge (e.g. distances larger than 0.45 km) are starvedfor resources and have a rather low downlink throughput.
0.35 -
00 0.05 0.1 0.15 0.2 0.25 0.3 0.35 0.4 0.45 0.5Distance (km)
Figure 9 E-UTRAN user throughput versus distance for 30 users per sector
The proportional fair algorithm has the best performancewith regard to the user throughput versus distance as it makesthe trade-off between the current channel conditions andpreviously experienced throughputs.
V. CONCLUSIONS AND RECOMMENDATIONS
From the overall results presented in this study it can be
00 0.05 0.1 0.15 0.2 0.25 0.3 0.35 0.4 0.45 0.5
Distance (km)
Figure 8 WiMAX user throughput versus distance for 30 users per sectorNormalized User Throughput vs Distance; 30 users; Pedestrian B; E-UTRAN
0.4r----.------.--.---------.--------.--.-------.-------,---.--------,
N'z~ 0.3B:;,go 0.25C)
=~ 0.2~
'CDen
::::l 0.15"0CD~
~ 0.1oz
0.05
Normalized User Throughput vs Distance; 30 users; Pedestrian B; WiMAX0.4r----.------.--.--------.--------.--...---------.-------.--,------,
: "'Reuse1
0.35 - - ~ - - - :- - - - 1- - - - 1- - - - 1- - - - 1- - - ::=~S::useNil~ 1 1 1 1 1 1 ~MaximumCII
:e 0.3 - - - 1 - - - :- - - - :- - - - :- - - - :- - - - :- - - Proportional FairSo I I I 1 1 1 Soft Partitioning:; I 1 I 1 1 I 1 1 1! 0.25 - - - ~ - - ~ - - - ~ - - - ~ -0i»25~ - - - ~ - - - ~ - 1- - 1- - - - 1- - -
= I I I 1 1 1
~ 0.2 - - - ~ - - - ~ - - ~ - - - ~ - 0.02 - - - - ~ - - - - ~ - - - - ~ - -I- 1 1 1 1 I 1
! 0.15 ~ ~ : ~ _o~~ - - I- - - - - : - -
ill I I 0.01 -'-'-'''IIIlII::::I~~1ISi-L.~ 1 1 I 1 ~~~---.;;:::::::., 1
~ 0.1 - - - ~ - - - ~ - - - :- - - :- -0:005o I I 1 I
Z I 1
0.05
Authorized licensed use limited to: Eindhoven University of Technology. Downloaded on January 29, 2010 at 09:06 from IEEE Xplore. Restrictions apply.