dot/faa/ar-05/58 endurance time tests using the office of
TRANSCRIPT
DOT/FAA/AR-05/58 Office of Aviation Research and Development Washington, DC 20591
Endurance Time Tests Using the NCAR Snow Machine: Results of Round-Robin Tests Using a Constant Test Plate Temperature March 2006 Final Report This document is available to the U.S. public through the National Technical Information Service (NTIS), Springfield, Virginia 22161.
U.S. Department of Transportation Federal Aviation Administration
NOTICE
This document is disseminated under the sponsorship of the U.S. Department of Transportation in the interest of information exchange. The United States Government assumes no liability for the contents or use thereof. The United States Government does not endorse products or manufacturers. Trade or manufacturer's names appear herein solely because they are considered essential to the objective of this report. This document does not constitute FAA certification policy. Consult your local FAA aircraft certification office as to its use. This report is available at the Federal Aviation Administration William J. Hughes Technical Center's Full-Text Technical Reports page: actlibrary.tc.faa.gov in Adobe Acrobat portable document format (PDF).
Technical Report Documentation Page 1. Report No.
DOT/FAA/AR-05/58
2. Government Accession No. 3. Recipient's Catalog No.
5. Report Date
March 2006
4. Title and Subtitle
ENDURANCE TIME TESTS USING THE NCAR SNOW MACHINE: RESULTS OF ROUND-ROBIN TESTS USING A CONSTANT TEST PLATE TEMPERATURE
6. Performing Organization Code
7. Author(s)
Roy M. Rasmussen, Matt Tryhane, Scott Landolt, and Alan Hills 8. Performing Organization Report No.
10. Work Unit No. (TRAIS)
9. Performing Organization Name and Address
National Center for Atmospheric Research Box 3000 Boulder, Colorado 80307
11. Contract or Grant No.
DTFACT-04-P-00023 13. Type of Report and Period Covered
Final Report 12. Sponsoring Agency Name and Address
U.S. Department of Transportation Federal Aviation Administration Office of Aviation Research and Development Washington, DC 20591
14. Sponsoring Agency Code
AFS-200
15. Supplementary Notes
The Federal Aviation Administration Airport and Aircraft Safety R&D Division COTRs were Charles Masters and James Riley. 16. Abstract
This report summarizes the results of round-robin tests with the National Center for Atmospheric Research (NCAR), Aviation Planning Services (APS), and Anti-icing Materials International Laboratory (AMIL) snow machines using a constant plate temperature. Previous results from snow indoor tests showed shorter fluid endurance times of anti-icing fluids for the NCAR snow machine compared to outdoor natural tests. A consistent result of the previous study was higher plate temperatures for outdoor tests exposed to wind compared to indoor tests not exposed to wind. A lower plate temperature will change fluid properties, such as viscosity and surface tension, and therefore, also affect fluid flow behavior and consequently endurance time. Previous tests have shown that most fluids show longer endurance times for warmer plate temperatures, and thus the shorter endurance times observed for the NCAR snow machine may possibly be explained by the lower plate temperatures. The previous report suggested that a method to reduce the bias would be to conduct the indoor snow machine tests at a selected plate temperature that better simulates the affects of the wind. Preliminary results from APS, AMIL, and NCAR all showed improved agreement with the outdoor tests when this procedure was used. The suggested method was tested during the winter of 2003/2004 by conducting indoor round-robin tests with the NCAR, APS, and AMIL snow machines employing selected outdoor snow conditions. The indoor test conditions used commonly agreed to constant plate temperatures for each test and were based upon outdoor tests conducted by APS in previous years. APS provided the outdoor conditions and constant plate temperature to each laboratory, and each laboratory conducted as many of the tests as practicable. NCAR conducted 82 indoor tests at conditions previously tested outdoors and provided the resulting snow machine results to all the other laboratories. The results of these 82 tests and an intercomparison to the other laboratory results are provided in this report. 17. Key Words
Snow, Snow machine, Anti-icing fluid, Endurance time
18. Distribution Statement
This document is available to the public through the National Technical Information Service (NTIS) Springfield, Virginia 22161.
19. Security Classif. (of this report)
Unclassified
20. Security Classif. (of this page)
Unclassified
21. No. of Pages
42 22. Price
Form DOT F1700.7 (8-72) Reproduction of completed page authorized
TABLE OF CONTENTS
Page EXECUTIVE SUMMARY ix 1. INTRODUCTION 1
2. OVERVIEW OF THE NCAR SNOW MACHINE 1
3. ROUND-ROBIN TESTS 3
3.1 Anti-Icing and Deicing Fluids 3 3.2 Plate Temperature Setting 4 3.3 Individual Fluid Endurance Time Tests 5
4. INDIVIDUAL FLUID ENDURANCE TIME TEST EXAMPLES 5
4.1 Round-Robin Test 15, Octagon Max Flight 6 4.2 Round-Robin Test 13, UCAR ULTRA+ 6 4.3 Round-Robin Test 59, SPCA Ecowing 26 7
5. COMPARISON OF NCAR INDOOR TESTS TO APS OUTDOOR DATA 8
6. INTERLABORATORY COMPARISON OF ROUND-ROBIN TESTS 16
7. SUMMARY 18
8. REFERENCES 18
APPENDICES A—Summary of the NCAR Artificial Snow Generation System
B—Technical Description of the NCAR Snow Machine System
C—Extract of the Experimental Program Fluid Endurance Time Testing With Artificial Snow
D—Matrix of NCAR Tests and APS Outdoor Data
iii
LIST OF FIGURES
Figure Page 1 The NCAR Snow Machine 1
2 Tray Assembly Sitting on Top of a Mass Balance 2
3 Curve Used to Determine Constant Plate Temperature From Snowfall Rate 4
4 Round-Robin Test 15, Octagon Max Flight, 50% Dilution Type IV Fluid 6
5 Round-Robin Test 13, UCAR ULTRA+ Neat, Type IV Fluid 7
6 Round-Robin Test 59, SPCA Ecowing 26, 75% Dilution Type II Fluid 8
7 Comparison of Outdoor Endurance Times and NCAR Snow Machine Endurance Times for all Fluid Used in the Round-Robin Tests 9
8 Comparison of Outdoor Endurance Times and NCAR Snow Machine Endurance Times for SPCA AD-480 From Round-Robin Tests 9
9 Comparison of Outdoor Endurance Times and NCAR Snow Machine Endurance Times for SPCA Ecowing 26 From Round-Robin Tests 10
10 Comparison of Outdoor Endurance Times and NCAR Snow Machine Endurance Times for Clariant 2001 From Round-Robin Tests 10
11 Comparison of Outdoor Endurance Times and NCAR Snow Machine Endurance Times for Clariant Safewing Protect 2012 From Round-Robin Tests 11
12 Comparison of Outdoor Endurance Times and NCAR Snow Machine Endurance Times for Clariant 2025 ECO From Round-Robin Tests 11
13 Comparison of Outdoor Endurance Times and NCAR Snow Machine Endurance Times for Clariant 2030 ECO From Round-Robin Tests 12
14 Comparison of Outdoor Endurance Times and NCAR Snow Machine Endurance Times for UCAR ULTRA+ From Round-Robin Tests 12
15 Comparison of Outdoor Endurance Times and NCAR Snow Machine Endurance Times for Octagon Max Flight From Round-Robin Tests 13
16 Comparison of Outdoor Endurance Times and NCAR Snow Machine Endurance Times for Kilfrost ABC 2000 From Round-Robin Tests 13
17 Comparison of Outdoor Endurance Times and NCAR Snow Machine Endurance Times for Kilfrost ABC-II Plus From Round-Robin Tests 14
iv
18 Comparison of Outdoor Endurance Times and NCAR Snow Machine Endurance Times for Kilfrost ABC-S From Round-Robin Tests 14
19 Histogram of Differences in NCAR Snow Machine and Outdoor Endurance Times From Round-Robin Tests 16
20 Round-Robin Test Comparisons of Outdoor Snow Endurance Times and Snow Machine Snow Endurance Times for NCAR, APS, and AMIL 17
21 Histogram of Differences in NCAR and AMIL Snow Machine Endurance Times From Round-Robin Tests 17
22 Histogram of Differences in NCAR and APS Snow Machine Endurance Times From Round-Robin Tests 17
v
LIST OF TABLES
Table Page 1 Summary of Endurance Time Tests Performed for Each Fluid Type and Dilution 3
vi
LIST OF ACRONYMS
AMIL Anti-icing Materials International Laboratory APS Aviation Planning Services EG Ethylene glycol NCAR National Center for Atmospheric Research PG Propylene glycol TPE Total potential energy
vii/viii
EXECUTIVE SUMMARY
This report summarizes the results of round-robin testing with the National Center for Atmospheric Research (NCAR), Aviation Planning Services (APS), and Anti-icing Materials International Laboratory (AMIL) snow machines using a constant selected plate temperature. Previous results showed shorter fluid endurance times of anti-icing fluids for the NCAR snow machine compared to outdoor natural tests. A consistent result of the previous study was the higher plate temperature of the outdoor tests exposed to wind compared to the indoor test not exposed to wind. Previous tests have shown that most fluids exhibit longer endurance times for warmer plate temperatures, and thus the shorter endurance times observed for the NCAR snow machine may possibly be explained by the lower plate temperatures. The report suggested that a method to reduce the bias is to conduct the indoor snow machine tests at a constant plate temperature to simulate the apparent heating affects attributed to the wind. This hypothesis was tested during the winter of 2003/2004 by conducting indoor round-robin testing with the NCAR, APS, and AMIL snow machines. Indoor tests employing each machine were based upon outdoor tests conducted by APS in previous years and used commonly agreed upon constant plate temperatures for each test. APS provided the outdoor conditions and constant plate temperature to be used by each laboratory, and each laboratory conducted as many of the tests as practicable. NCAR conducted 82 indoor tests at conditions previously tested outdoors and provided the resulting snow machine results to the other laboratories. The results of these 82 tests compared well with to the other laboratory results, generally showing good correlation between the indoor and outdoor times for propylene glycol (PG)-based anti-icing fluids. The ethylene glycol (EG) fluid tests showed longer times for the indoor tests compared to the outdoor, suggesting that further tests are required for this fluid. With the exception of the EG-based fluid, overall results from the round-robin tests showed good correlation between all three laboratories and with the outdoor data. This improved result is attributed primarily to the use of a constant plate temperature slightly below the outdoor ambient temperature. By using a constant plate temperature, many of the temperature dependent characteristics of the various deicing fluids (viscosity, surface tension, etc.) were controlled to values close to what the fluids experienced outdoors, allowing for improved endurance time results when employing the snow machines indoors. Other factors such as horizontal snow distribution and the exact crystal shape appear to be of secondary importance. Overall, the current results suggest that the artificial snow generated by the NCAR machine is adequate for reproducing outdoor snow testing of PG anti-icing fluids. More testing appears warranted for EG-based ULTRA+ fluid. This study also showed that fluid endurance time may be estimated through the use of the total potential energy (TPE) if snowfall rates are constant. TPE is defined as the amount of energy used to keep the plate temperature constant.
ix/x
1. INTRODUCTION.
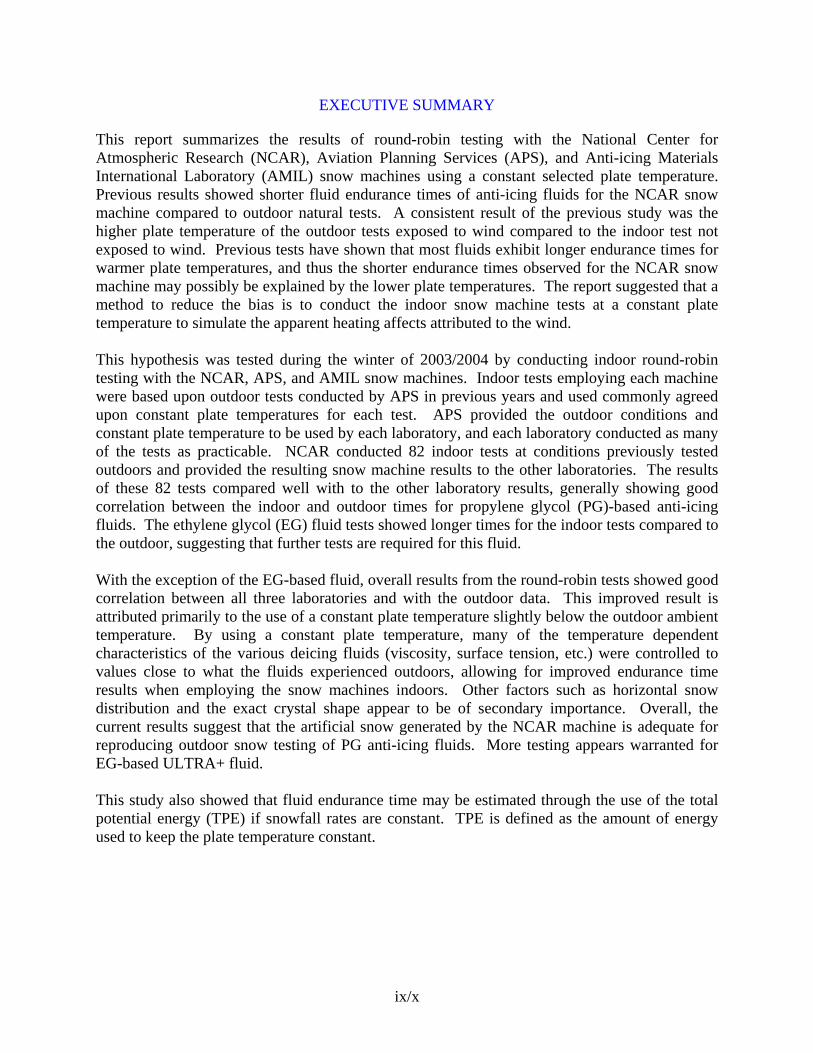
The National Center for Atmospheric Research (NCAR) snow machine is a system designed to perform fluid endurance time tests in a controlled laboratory environment year round instead of the seasonal outdoor tests that are currently being conducted. Outdoor tests are expensive and also subject to the vagaries of the weather. The outdoor method also requires that data be extrapolated and curve fit to be useful for holdover time determination. Two NCAR-developed snow machines [1 and 2], one used at NCAR and one used at Aviation Planning Services (APS), along with one Anti-icing Materials International Laboratory (AMIL)-developed snow machine [3 and 4], were used in a series of tests to determine if the machines could be used to establish endurance times for anti-icing and deicing fluids in the aviation industry. This report summarizes the results of this testing at NCAR and compares the results with the APS and AMIL. A technical description of the NCAR snow machine as used in this study is given in appendix B
2. OVERVIEW OF THE NCAR SNOW MACHINE.
The NCAR snow machine (figure 1) is a system developed to generate artificial snow in a laboratory environment. During this investigation, it was employed as part of a round-robin test with the two other snow machines mentioned above to ascertain endurance time data on aircraft anti-icing fluids for comparison with results from outdoor tests in natural snow conditions. A more complete overview of the system is given in appendix A. Details pertinent to the tests conducted are described below.
FIGURE 1. THE NCAR SNOW MACHINE
1
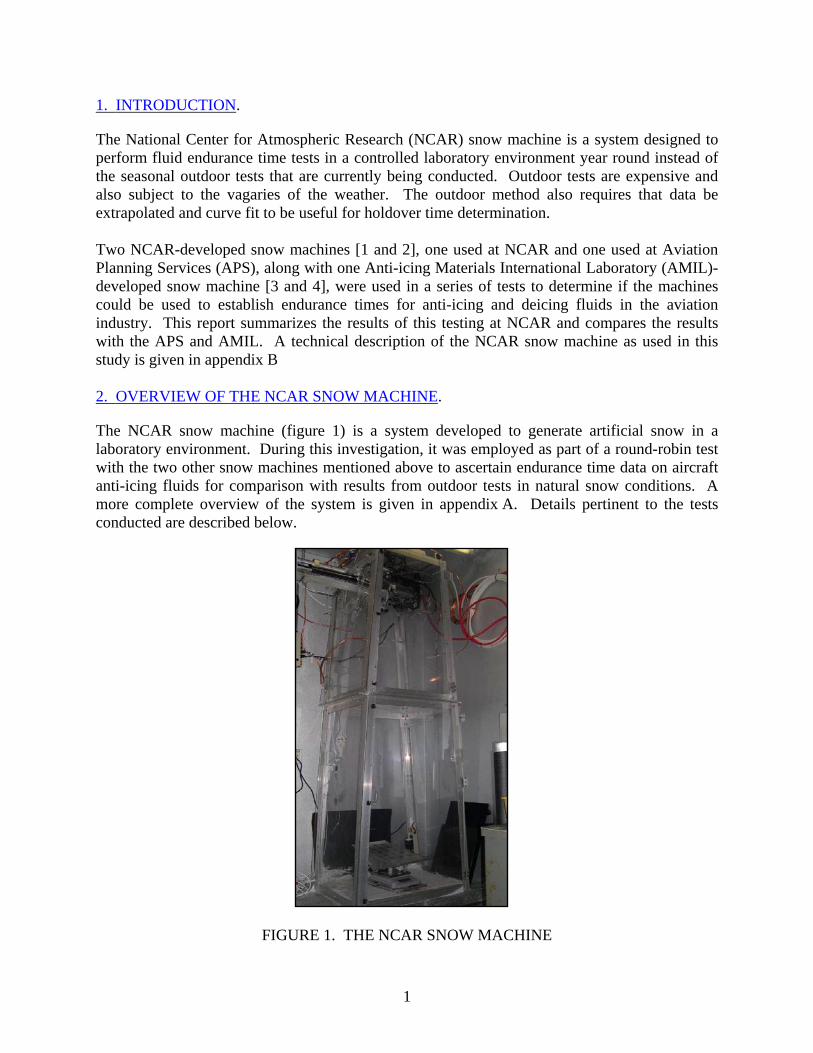
The snow machine generates snow by shaving a horizontally oriented ice core fed into a large, rotating drill bit at a specified rate. The ice shavings have the size, fall speed, and density of natural snow. A tray assembly is placed 2.5 meters below the generation point of the ice shavings (figure 2). The tray assembly consists of a tray, plate, temperature probes, heater, and a 12-kg mass balance. The plate is mounted inside the tray at a 10° angle. A small gap around the plate allows fluid to run off the edges and into the tray. Each plate has two temperature probes embedded into the back of the plate and a heater covering the back of the plate. One temperature probe is used to monitor the temperature of the plate while the other is used to control the heater and maintain a constant plate temperature. The entire tray assembly sits on top of the 12-kg mass balance, which provides 6-second updates of the total mass to the computer and allows the computer to maintain a constant snowfall rate through a feedback loop. A detailed description of the NCAR snow machine and its components is presented in appendix B.
FIGURE 2. TRAY ASSEMBLY SITTING ON TOP OF A MASS BALANCE Previous snow machine results [1 and 2] showed shorter fluid endurance times of anti-icing fluids for the NCAR snow machine compared to outdoor natural tests. In reference 2, a consistent result was the higher plate temperature for the outdoor tests exposed to wind compared to the indoor test not exposed to wind. A lower plate temperature will change fluid properties, such as viscosity and surface tension, and therefore, also affect its flow-off behavior and consequently endurance time. Previous tests have shown that most fluids show longer endurance times for warmer plate temperatures [1], and thus the shorter endurance times observed for the NCAR snow machine are hypothesized to be caused by the lower plate temperatures. Reference 2 suggested that a possible method to reduce the bias is to run the indoor snow machine tests at a constant plate temperature to simulate the heating effects of the wind. Preliminary results from APS, University of Quebec at Chicoutimi, and NCAR all showed much better agreement with the outdoor tests if this procedure was used. This hypothesis was tested during the winter of 2003/2004 by conducting round-robin tests with the NCAR, APS, and AMIL snow machines by using each machine in indoor tests, which were based upon outdoor tests conducted by APS in previous years. Commonly agreed upon constant plate temperatures for each test (see appendix C for details of the experimental procedures used in the round-robin tests) were employed. APS provided the outdoor conditions and constant plate temperature to use (appendix C), and each laboratory ran as many as the tests as
2
practicable. NCAR conducted 82 indoor tests based on conditions tested outdoors and provided the resulting snow machine results to the other laboratories. Appendix D provides a table summarizing each of the tests, including the outdoor test conditions provided by APS. The results of these 82 tests are compared to the other laboratory results in this report. 3. ROUND-ROBIN TESTS.
Round-robin tests were conducted at NCAR, APS, and AMIL. The NCAR snow machines were used for all experiments by NCAR and APS. Outdoor fluid tests to be simulated in the snow machines were chosen by APS from outdoor tests they had performed over the past few years. APS chose endurance time tests that had a wide range of temperature and snowfall rates and removed tests with large fluctuations in snowfall rate. However, some of the tests had unusually high wind speeds. The table in appendix D shows both the APS outdoor data and the relevant NCAR indoor data. Note that the endurance time and initial and final degrees Brix readings are given for each NCAR indoor test. (Brix refers to the reading from a refractometer with gradations in “degrees Brix,” which can be converted to a fluid concentration and an associated freezing point by means of a graph or table.) The round-robin tests required that the plate be maintained at a constant temperature throughout the individual experiments. The initial fluid temperatures were adjusted to the ambient air temperature recorded at the start of each outdoor test. 3.1 ANTI-ICING AND DEICING FLUIDS.
The round-robin tests were conducted using 11 different fluids. Fluids were tested in neat, 75% and 50% dilutions. Ten of the fluids are propylene glycol (PG)-based and one is ethylene glycol (EG)-based (UCAR ULTRA+). Fluids were diluted with tap water by using volumetric measurements. Table 1 summarizes the number of tests conducted with each fluid and dilution. All fluids were received at 100% concentration. Each laboratory diluted the fluids to meet the test requirements.
TABLE 1. SUMMARY OF ENDURANCE TIME TESTS PERFORMED FOR EACH
FLUID TYPE AND DILUTION
Fluid Name Fluid Type Total Number
of Tests Tests of Neat
Dilution Tests at 75%
Dilution Tests at 50%
Dilution Kilfrost ABC-S Type IV -PG 9 3 5 1 Kilfrost ABC 2000 Type II – PG 7 3 3 1 Kilfrost ABC-II Plus Type II – PG 9 3 3 3 UCAR ULTRA+ Type IV – EG 5 5 0 0 Octagon Max Flight Type IV – PG 7 3 3 0 SPCA AD-480 Type IV – PG 9 3 4 2 SPCA Ecowing 26 Type II – PG 9 4 2 3 Clariant 2001 Type IV –PG 9 4 3 2 Clariant 2025 ECO Type II – PG 7 2 2 3 Clariant 2030 ECO Type IV – PG 4 1 1 3 Clariant Safewing Protect 2012 Type IV – PG 7 3 2 2 Total 82 34 28 20
3

3.2 PLATE TEMPERATURE SETTING.
The room temperature was maintained approximately 2 degrees colder than the plate temperature to prevent heating of the plate by the air. In previous years, testing showed that allowing the plate temperature to vary freely caused the fluid endurance times generated by the snow machine to be shorter than the outdoor endurance times [1]. It was also shown that maintaining the plate temperature at the starting ambient temperature from the outdoor endurance tests caused snow machine fluid endurance times to be longer than outdoor. The previous results also showed that using the average plate temperature from outdoor experiments for the indoor snow machine experiments gave results better correlated to outdoor endurance times. Based on a review of past test data by NCAR and APS, a relationship between plate temperature and snowfall rate was determined and is given in equation 1 and also shown in figure 3. Y = Avg. Tdrop = 0.509 + 0.0653I [1] Where Y equals the average temperature drop (Avg. Tdrop) and I equals the snowfall intensity. A related equation is that of the constant plate temperature setting and is given by Tconst. plate = - (0.509 + 0.0653I) – TA [2]
In which TA is the ambient temperature. The average temperature drop is subtracted from the ambient temperature based on the snowfall rate, which results in the constant plate temperature setting for the indoor experiment. For example, if the ambient temperature was -2°C, and the snowfall rate 25 g/dm2/h, then 2.1°C (as determined from figure 3) would be subtracted from -2°C to yield a plate temperature setting of -4.1°C.
0
1
2
3
4
5
0 10 20 30 40 50
y = 0.509 + 0.0653x
Aver
age
Tem
pera
ture
Dro
p ( °
C)
Avg.
OAT
(C) -
Avg
. Pla
te T
empe
ratu
re ( °
C)
Snowfall Rate (g/dm2/h)
FIGURE 3. CURVE USED TO DETERMINE CONSTANT PLATE TEMPERATURE FROM
SNOWFALL RATE
4

The above relationship was derived by NCAR and APS by fitting mean plate temperatures from previous outdoor tests as a function of the mean snowfall rate. 3.3 INDIVIDUAL FLUID ENDURANCE TIME TESTS.
All the fluid endurance time tests were conducted using the same procedure given below: • A new ice core was used for each experiment.
• The room temperature was set to 2°C below the plate temperature. The room temperature was never set to be warmer than -4°C due to difficulties associated with operating the snow machine at warmer temperatures.
• The plate angle was checked using a digital level to ensure that the plate was inclined at 10° ±0.2°.
• The snowfall rate and plate temperature were selected using the user interface, and the initial fluid temperature and degrees Brix readings were checked and recorded to ensure that the fluid temperature was between the ambient and set plate temperature.
• All fans, air jets, and wipers were turned on and checked for proper functioning.
• The fluid was then poured onto the plate starting from the top allowing the entire plate to be covered.
• After pouring the fluid, snow generation was turned on within 2 seconds.
• The timer was then started and data for the experiment were collected.
• The fluid was closely monitored for failure. At the failure point (30% of the surface covered with snow that did not absorb into the fluid in 30 seconds), the time and degrees Brix readings were recorded and a photograph was taken to document the failure. Depending on the amount of ice core left, the test was allowed to continue running to provide as much information as possible about the failure.
4. INDIVIDUAL FLUID ENDURANCE TIME TEST EXAMPLES.
In each of the following examples (figures 4, 5, and 6), three curves were plotted versus time. The plate temperature was plotted to ensure the heaters maintained the proper temperature for the duration of the experiment. The amount of energy required to keep the plate temperature constant was also plotted. These plots provided information on fluid failure by showing a change in the slope of the energy curve at the time of failure. The total potential energy (TPE) released by melting all the snow was also plotted to show the energy required by the plate. The divergence of the energy to plate curve from the TPE curve showed that less power was required to keep the plate temperature constant once the fluid had failed due to the fact that the snow was no longer cooling the fluid by melting.
5

4.1 ROUND-ROBIN TEST 15, OCTAGON MAX FLIGHT.
Round-robin test 15 examined Octagon Max Flight at a 50% dilution. The average snowfall rate used during the experiment was 23.7 g/dm2/h. The plate set temperature was -3°C. The fluid endurance time from the NCAR snow machine was 38 minutes compared to the outdoor endurance time of 41.3 minutes. The initial degrees Brix readings was 19, and at failure, it was 7.25. The mass of the snow on the plate at failure was approximately 260 grams. This experiment was a good example of how the amount of energy required to keep the plate temperature constant decreases after the fluid starts to fail (figure 4).
-10
-8
-6
-4
-2
0
0
100
200
300
400
500
0 10 20 30 40 50 60 70
Plate Temperature ( Approx Energy to Plate (kJ)°C)
Total Potential Energy (kJ)
Tem
pera
ture
(°C
) Energy (kJ)
Test Time (minutes)
Rate = 23.7 g/dm2/hInitial degrees Brix = 19Final degrees Brix = 7.25
Plate SetTemp. = -3°C
Indoor FailTime =38 min
Outdoor FailTime = 41.3 min
FIGURE 4. ROUND-ROBIN TEST 15, OCTAGON MAX FLIGHT, 50%, DILUTION TYPE IV FLUID (Plate temperature (red), energy to the plate (blue), and TPE (green) vs time.)
Figure 4 shows that the slope of the energy curve starts to decrease as the fluid starts to fail and becomes constant 20 minutes after the failure is called. Once the fluid has failed, very little energy is required to keep the plate temperature constant due to the lack of melting snow. 4.2 ROUND-ROBIN TEST 13, UCAR ULTRA+.
Round-robin test 13 tested UCAR ULTRA+. The average snowfall rate used for this experiment was 25.6 g/dm2/h. The plate temperature was set at -4°C. The fluid endurance time for the NCAR snow machine was 41 minutes, whereas the outdoor endurance time for this experiment was 37 minutes (figure 5). The initial degrees Brix reading was 40.25, and the final reading was 8.00. The mass of the snow on the plate at failure was approximately 300 grams.
6

-8
-6
-4
-2
0
2
4
0
70
140
210
280
350
420
0 10 20 30 40 50 60 70
Plate Temperature (°C) Approx Energy to Plate (kJ)
Total Potential Energy (kJ)
Tem
pera
ture
( °C
)
Energy (kJ)
Test Time (minutes)
Rate = 25.6 g/dm2/hInitial Brix = 40.25Final Brix = 8.00
Indoor FailTime =41 min
Outdoor FailTime = 37 min
Plate Set Temp. = -4°C
Rate = 25.6 g/dm2/h Initial degrees Brix = 40.25 Final degrees Brix – 8.00
FIGURE 5. ROUND-ROBIN TEST 13, UCAR ULTRA+ NEAT, TYPE IV FLUID
(Plate temperature (red), energy to the plate (blue), and TPE (green) vs time.) 4.3 ROUND-ROBIN TEST 59, SPCA ECOWING 26.
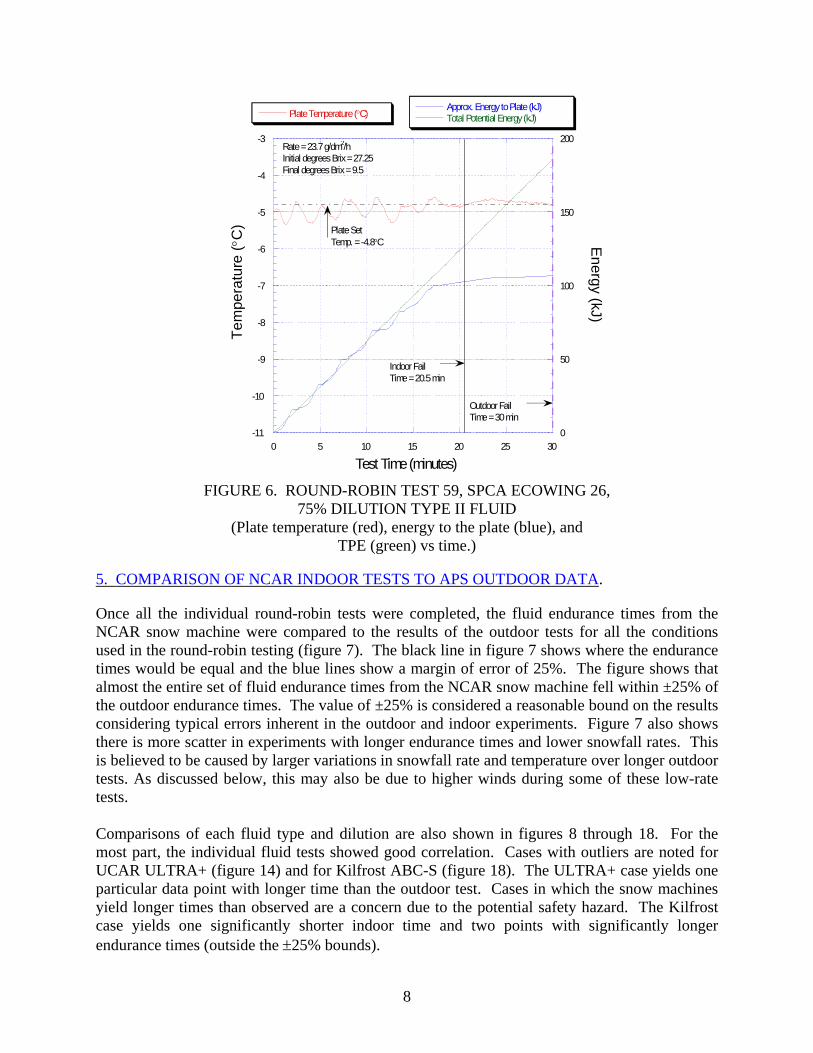
Round-robin test 59 tested SPCA Ecowing 26 at a 75% dilution. The average snowfall rate used during the experiment was 23.7 g/dm2/h. The plate temperature was set to -4.8°C. The fluid endurance time from the NCAR snow machine was 20.5 minutes compared to the outdoor endurance time of 30 minutes (figure 6). The initial degrees Brix reading was 27.25, and the final reading was 9.5. This experiment showed a difference of almost 10 minutes between the snow machine and outdoor fluid failure time. The data suggest that the snow machine failure time was correctly called due to the change in the slope of energy curve.
7
-11
-10
-9
-8
-7
-6
-5
-4
-3
0
50
100
150
200
0 5 10 15 20 25 30
Plate Temperature (°C)Approx. Energy to Plate (kJ)Total Potential Energy (kJ)
Tem
pera
ture
( °C
) E
nergy (kJ)
Test Time (minutes)
Rate = 23.7 g/dm2/hInitial degrees Brix = 27.25Final degrees Brix = 9.5
Indoor FailTime = 20.5 min
Outdoor FailTime = 30 min
Plate SetTemp. = -4.8°C
FIGURE 6. ROUND-ROBIN TEST 59, SPCA ECOWING 26, 75% DILUTION TYPE II FLUID
(Plate temperature (red), energy to the plate (blue), and TPE (green) vs time.)
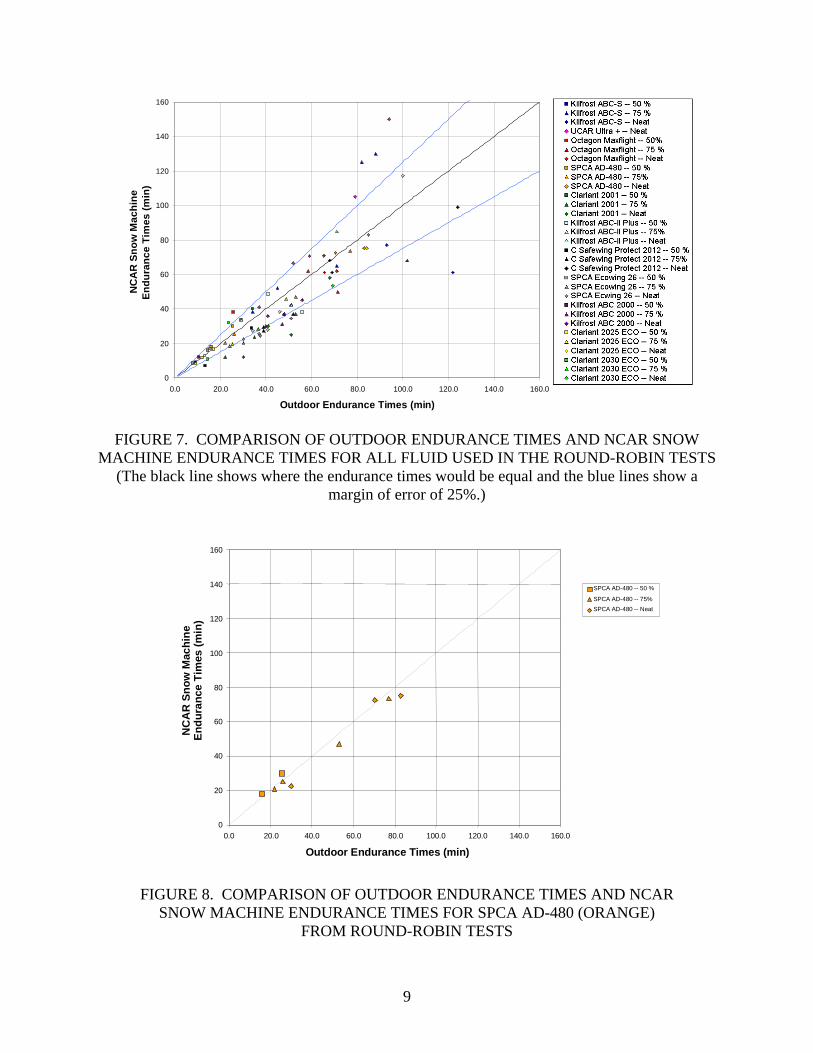
5. COMPARISON OF NCAR INDOOR TESTS TO APS OUTDOOR DATA.
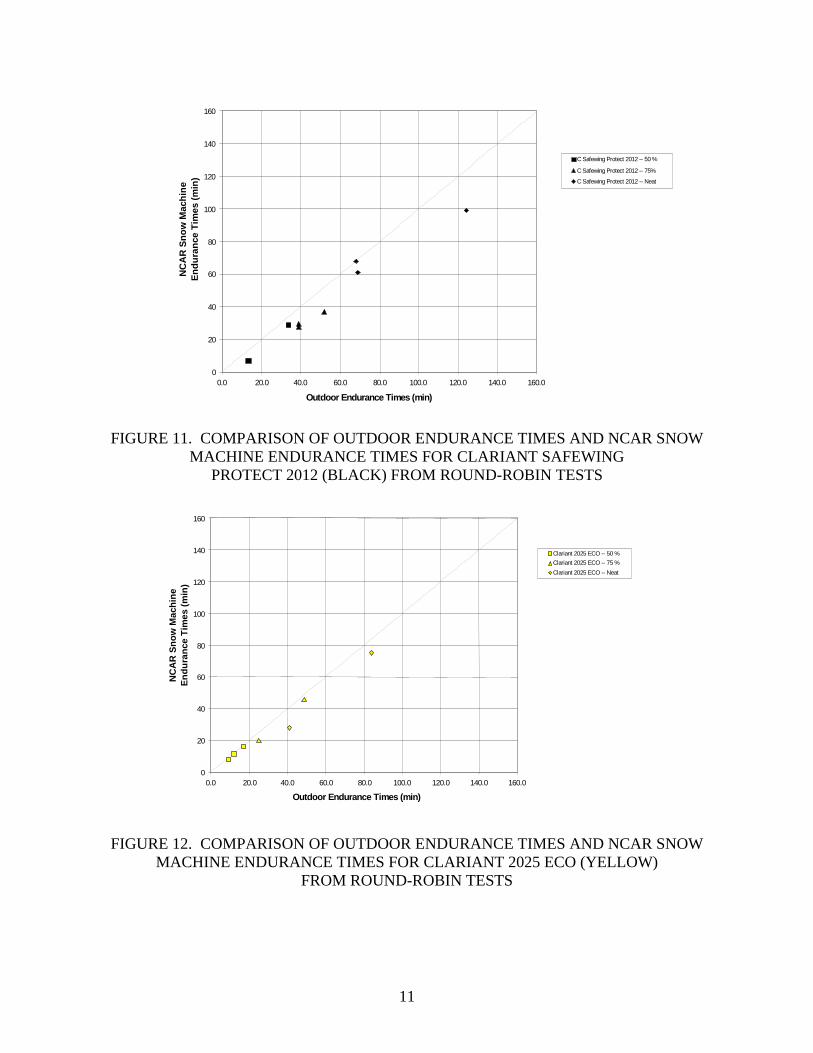
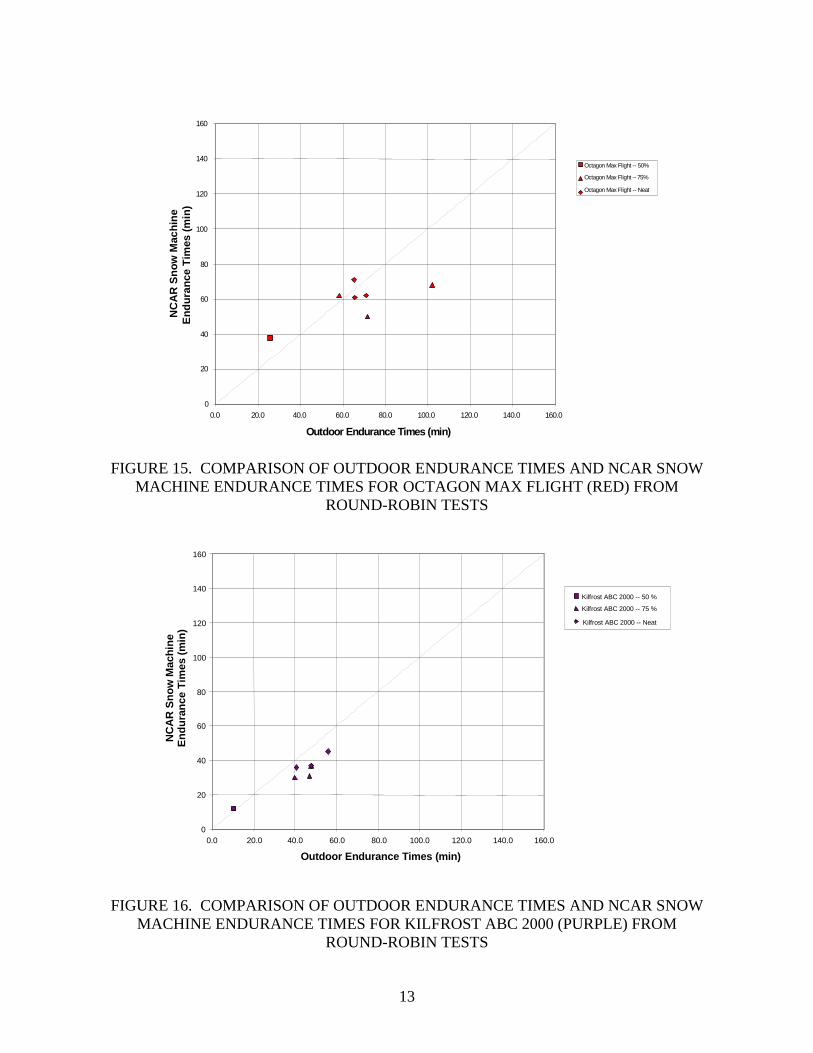
Once all the individual round-robin tests were completed, the fluid endurance times from the NCAR snow machine were compared to the results of the outdoor tests for all the conditions used in the round-robin testing (figure 7). The black line in figure 7 shows where the endurance times would be equal and the blue lines show a margin of error of 25%. The figure shows that almost the entire set of fluid endurance times from the NCAR snow machine fell within ±25% of the outdoor endurance times. The value of ±25% is considered a reasonable bound on the results considering typical errors inherent in the outdoor and indoor experiments. Figure 7 also shows there is more scatter in experiments with longer endurance times and lower snowfall rates. This is believed to be caused by larger variations in snowfall rate and temperature over longer outdoor tests. As discussed below, this may also be due to higher winds during some of these low-rate tests. Comparisons of each fluid type and dilution are also shown in figures 8 through 18. For the most part, the individual fluid tests showed good correlation. Cases with outliers are noted for UCAR ULTRA+ (figure 14) and for Kilfrost ABC-S (figure 18). The ULTRA+ case yields one particular data point with longer time than the outdoor test. Cases in which the snow machines yield longer times than observed are a concern due to the potential safety hazard. The Kilfrost case yields one significantly shorter indoor time and two points with significantly longer endurance times (outside the ±25% bounds).
8
0
20
40
60
80
100
120
140
160
0.0 20.0 40.0 60.0 80.0 100.0 120.0 140.0 160.0
Outdoor Endurance Times (min)
NC
AR
Sno
w M
achi
ne
Endu
ranc
e Ti
mes
(min
)
FIGURE 7. COMPARISON OF OUTDOOR ENDURANCE TIMES AND NCAR SNOW MACHINE ENDURANCE TIMES FOR ALL FLUID USED IN THE ROUND-ROBIN TESTS
(The black line shows where the endurance times would be equal and the blue lines show a margin of error of 25%.)
0
20
40
60
80
100
120
140
160
0.0 20.0 40.0 60.0 80.0 100.0 120.0 140.0 160.0
Outdoor Endurance Times (min)
NC
AR
Sno
w M
achi
ne
Endu
ranc
e Ti
mes
(min
)
SPCA AD-480 -- 50 %
SPCA AD-480 -- 75% SPCA AD-480 -- Neat
FIGURE 8. COMPARISON OF OUTDOOR ENDURANCE TIMES AND NCAR
SNOW MACHINE ENDURANCE TIMES FOR SPCA AD-480 (ORANGE) FROM ROUND-ROBIN TESTS
9

0
20
40
60
80
100
120
140
160
0.0 20.0 40.0 60.0 80.0 100.0 120.0 140.0 160.0
Outdoor Endurance Times (min)
NC
AR
Sno
w M
achi
ne
Endu
ranc
e Ti
mes
(min
) SPCA Ecowing 26 -- 50 % SPCA Ecowing 26 -- 75 % SPCA Ecwing 26 -- Neat
FIGURE 9. COMPARISON OF OUTDOOR ENDURANCE TIMES AND NCAR
SNOW MACHINE ENDURANCE TIMES FOR SPCA ECOWING 26 (GREY) FROM ROUND-ROBIN TESTS
0
20
40
60
80
100
120
140
160
0.0 20.0 40.0 60.0 80.0 100.0 120.0 140.0 160.0 Outdoor Endurance Times (min)
NC
AR
Sno
w M
achi
ne
Endu
ranc
e Ti
mes
(min
)
Clariant 2001 -- 50 % Clariant 2001 -- 75 % Clariant 2001 -- Neat
FIGURE 10. COMPARISON OF OUTDOOR ENDURANCE TIMES AND NCAR SNOW MACHINE ENDURANCE TIMES FOR CLARIANT 2001 (DARK GREEN)
FROM ROUND-ROBIN TESTS
10
0
20
40
60
80
100
120
140
160
0.0 20.0 40.0 60.0 80.0 100.0 120.0 140.0 160.0
Outdoor Endurance Times (min)
NC
AR
Sno
w M
achi
ne
Endu
ranc
e Ti
mes
(min
)
C Safewing Protect 2012 -- 50 %
C Safewing Protect 2012 -- 75%
C Safewing Protect 2012 -- Neat
FIGURE 11. COMPARISON OF OUTDOOR ENDURANCE TIMES AND NCAR SNOW
MACHINE ENDURANCE TIMES FOR CLARIANT SAFEWING PROTECT 2012 (BLACK) FROM ROUND-ROBIN TESTS
0
20
40
60
80
100
120
140
160
0.0 20.0 40.0 60.0 80.0 100.0 120.0 140.0 160.0
Outdoor Endurance Times (min)
NC
AR
Sno
w M
achi
ne
Endu
ranc
e Ti
mes
(min
)
Clariant 2025 ECO -- 50 % Clariant 2025 ECO -- 75 % Clariant 2025 ECO -- Neat
FIGURE 12. COMPARISON OF OUTDOOR ENDURANCE TIMES AND NCAR SNOW
MACHINE ENDURANCE TIMES FOR CLARIANT 2025 ECO (YELLOW) FROM ROUND-ROBIN TESTS
11

0
20
40
60
80
100
120
140
160
0.0 20.0 40.0 60.0 80.0 100.0 120.0 140.0 160.0
Outdoor Endurance Times (min)
NC
AR
Sno
w M
achi
ne
Endu
ranc
e Ti
mes
(min
) Clariant 2030 ECO -- 50 % Clariant 2030 ECO -- 75 % Clariant 2030 ECO -- Neat
FIGURE 13. COMPARISON OF OUTDOOR ENDURANCE TIMES AND NCAR SNOW MACHINE ENDURANCE TIMES FOR CLARIANT 2030 ECO (LIGHT GREEN)
FROM ROUND-ROBIN TESTS
0
20
40
60
80
100
120
140
160
0.0 20.0 40.0 60.0 80.0 100.0 120.0 140.0 160.0
Outdoor Endurance Times (min)
NC
AR
Sno
w M
achi
ne
Endu
ranc
e Ti
mes
(min
)
UCAR Ultra + -- Neat
FIGURE 14. COMPARISON OF OUTDOOR ENDURANCE TIMES AND NCAR SNOW
MACHINE ENDURANCE TIMES FOR UCAR ULTRA+ (PINK) FROM ROUND-ROBIN TESTS
12
0
20
40
60
80
100
120
140
160
0.0 20.0 40.0 60.0 80.0 100.0 120.0 140.0 160.0
Outdoor Endurance Times (min)
NC
AR
Sno
w M
achi
ne
Endu
ranc
e Ti
mes
(min
) Octagon Max Flight -- 50% Octagon Max Flight – 75% Octagon Max Flight -- Neat
FIGURE 15. COMPARISON OF OUTDOOR ENDURANCE TIMES AND NCAR SNOW MACHINE ENDURANCE TIMES FOR OCTAGON MAX FLIGHT (RED) FROM
ROUND-ROBIN TESTS
0
20
40
60
80
100
120
140
160
0.0 20.0 40.0 60.0 80.0 100.0 120.0 140.0 160.0
Outdoor Endurance Times (min)
NC
AR
Sno
w M
achi
ne
Endu
ranc
e Ti
mes
(min
)
Kilfrost ABC 2000 -- 50 %
Kilfrost ABC 2000 -- 75 %
Kilfrost ABC 2000 -- Neat
FIGURE 16. COMPARISON OF OUTDOOR ENDURANCE TIMES AND NCAR SNOW
MACHINE ENDURANCE TIMES FOR KILFROST ABC 2000 (PURPLE) FROM ROUND-ROBIN TESTS
13

0
20
40
60
80
100
120
140
160
0.0 20.0 40.0 60.0 80.0 100.0 120.0 140.0 160.0 Outdoor Endurance Times (min)
NC
AR
Sno
w M
achi
ne
Endu
ranc
e Ti
mes
(min
)
Kilfrost ABC-II Plus -- 50 %
Kilfrost ABC-II Plus -- 75%
Kilfrost ABC-II Plus -- Neat
FIGURE 17. COMPARISON OF OUTDOOR ENDURANCE TIMES AND NCAR SNOW MACHINE ENDURANCE TIMES FOR KILFROST ABC-II PLUS (LIGHT BLUE) FROM
ROUND-ROBIN TESTS
0
20
40
60
80
100
120
140
160
0.0 20.0 40.0 60.0 80.0 100.0 120.0 140.0 160.0 Outdoor Endurance Times (min)
NC
AR
Sno
w M
achi
ne
Endu
ranc
e Ti
mes
(min
)
Kilfrost ABC-S -- 50 %Kilfrost ABC-S -- 75 %
Kilfrost ABC-S -- Neat
FIGURE 18. COMPARISON OF OUTDOOR ENDURANCE TIMES AND NCAR SNOW
MACHINE ENDURANCE TIMES FOR KILFROST ABC-S (DARK BLUE) FROM ROUND-ROBIN TESTS
14
For the ULTRA+ outlier data point, the snow machine gave an endurance time of 150 minutes, while the outdoor tests gave a time of 94 minutes. Previous NCAR comparisons of indoor and outdoor tests for ULTRA+ with the NCAR snow machine [1 and 2] always showed the snow machine to produce shorter times than observed outdoors. The previous tests presented in reference 2 matched outdoor and indoor snowfall rates every minute when doing a comparison. The main difference between the outdoor and indoor tests was the plate temperature, with the outdoor tests usually a few degrees warmer than the indoor tests. In one case from reference 2, however, an ULTRA+ test at 4.73 g/dm2/h snow fall rate showed a longer outdoor time compared to indoor despite that fact that the indoor plate temperature was higher than the outdoor plate temperature. This result was attributed to the decrease of viscosity with increasing temperature for ULTRA+, allowing more fluid to run off for the indoor test, yielding a shorter time. Since the wind speed during the current test was unusually high (30 km/h or 9 m/s), the plate temperature was likely close to ambient, while the test temperature was 1°C colder than ambient. This is similar to the plate temperature difference in the Rasmussen, et al. report [2] in which shorter times were reported for the warmer ULTRA+ fluid. Another possibility is that the ULTRA+ fluid was sheared off the test plate during the outdoor test due to the high winds. This behavior has been noted by the author of this report during previous outdoor tests of fluids when wind speeds are near 9 m/s. This would lead to a shorter outdoor time due to less glycol on the plate. Further investigation is needed to resolve this discrepancy. The Kilfrost test discrepancy is a little harder to understand since the wind speed was much lower, and previous results always showed shorter indoor times than outdoor times for Kilfrost fluids. It should be noted that both cases occurred at snowfall rates less than 5 g/dm2/h, which is a relatively long time (on the order of an hour or more) for failure. During this period, outdoor test conditions may have varied significantly (such as ambient temperature and wind), while the indoor conditions are constant. A colder temperature at the beginning of the Kilfrost tests may have resulted in the short outdoor times compared to the indoor test, and visa versa for the ULTRA+ tests. One suggestion to evaluate this further would be to use previous NCAR outdoor tests of ULTRA+ and Kilfrost in which the accumulation rate is recorded every minute and run the indoor tests using a constant plate temperature as a function of rate as outlined in this report. This would eliminate some of the potential uncertainties introduce by possible time variations occurring during the long test period for these three outlier points. Figure 19 shows a normal distribution of time differences between outdoor and NCAR snow machine tests for the round-robin experiments, showing that the data are more or less randomly distributed about a mean of zero.
15

0
4
8
12
16
20
24
-80 -70 -60 -50 -40 -30 -20 -10 0 10 20 30 40 50 60 70 80
Num
ber o
f Occ
urre
nces
Snow Machine - Outdoor Endurance Time (min)
FIGURE 19. HISTOGRAM OF DIFFERENCES IN NCAR SNOW MACHINE AND OUTDOOR ENDURANCE TIMES FROM ROUND-ROBIN TESTS
6. INTERLABORATORY COMPARISON OF ROUND-ROBIN TESTS.
A comparison of the results between the NCAR snow machine operated at NCAR, the NCAR snow machine operated by APS, and the snow machine developed and run by AMIL for the round-robin tests (figure 20) shows that all the machines were in good agreement with each other. It is interesting to note, however, that all three machines show larger scatter at the longer times (lower rates) than at the shorter times. Figures 21 and 22 show the difference in the fluid endurance times for APS and AMIL compared to NCAR. Note that the NCAR and APS results show nearly a zero bias and a normal distribution, while the AMIL results are biased slightly to longer test times by 5-10 minutes. This difference could possibly be attributed to a consistent bias in the subjective fluid failure calling between AMIL and the other two laboratories, or some other consistent bias in the machines.
16

FIGURE 20. ROUND-ROBIN TEST COMPARISONS OF OUTDOOR SNOW ENDURANCE
TIMES AND SNOW MACHINE SNOW ENDURANCE TIMES FOR NCAR (BLUE), APS (RED), AND AMIL (GREEN)
FIGURE 21. HISTOGRAM OF DIFFERENCES IN NCAR AND AMIL
SNOW MACHINE ENDURANCE TIMES FROM ROUND-ROBIN TESTS
FIGURE 22. HISTOGRAM OF DIFFERENCES IN NCAR AND APS
SNOW MACHINE ENDURANCE TIMES FROM ROUND-ROBIN TESTS
0
20
40
60
80
100
120
140
160
0.0 20.0 40.0 60.0 80.0 100.0 120.0 140.0 160.0 Outdoor Snow Endurance Times (min)
Snow
Mac
hine
Sn
ow E
ndur
ance
Tim
es (m
in)
NCARAPSAMILY=X
0
4
8
12
16
20
-80 -70 -60 -50 -40 -30 -20 -10 0 10 20 30 40 50 60 70 80
Num
ber o
f Occ
urre
nces
N C AR - A M IL Endurance T im e (m in)
0
4
8
12
16
20
-80-70-60-50-40-30-20-10 0 10 20 30 40 50 60 70 80
Num
ber o
f Occ
urre
nces
N C AR - APS Endurance T im e (m in)
17
7. SUMMARY.
The results from the round-robin tests have correlated well among the three laboratories and with the outdoor data for the propylene glycol-based anti-icing fluids. This improvement was primarily attributed to the use of a constant plate temperature slightly below the ambient temperature from the outdoor tests. By using a constant plate temperature, many of the temperature dependent characteristics of the various deicing fluids (viscosity, surface tension, etc.) were controlled to values close to what the fluids experienced outdoors, allowing for improved accuracy in endurance times when snow machines are used in a laboratory environment. Other factors such as horizontal snow distribution and the exact crystal shape seem to be of secondary importance. The ethylene glycol (EG) fluid had longer indoor times than the outdoor tests for low snowfall rates. Further tests will be required to resolve this discrepancy. The current results suggest that the artificial snow generated by the NCAR machine is adequate for reproducing outdoor snow test results of all current aircraft anti-icing thickened fluids except for EG-based fluid UCAR ULTRA+. Additional investigations appear warranted for this fluid, especially at low snowfall rates. This study also showed that fluid endurance time may be estimated through the use of the total potential energy (TPE) if snowfall rates are constant. TPE is defined as the amount of energy used to keep the plate temperature constant. 8. REFERENCES.
1. Rasmussen, R.M., Hills, A., Landolt, S., and Knight, C., “Results of Holdover Time Testing of Type IV Anti-Icing Fluids With the Improved NCAR Artificial Snow Generation System,” FAA Report DOT/FAA/AR-99/10, December 1999.
2. Rasmussen, R.M., Landolt, S., Tryhane, M., and Hills, A., “Endurance Time Testing
Using the NCAR Snow Machine: Reconciliation of Outdoor and Indoor Tests of Type IV Fluids,” FAA Report DOT/FAA/AR-03/54, October 2003.
3. Bernardin, S., Dubuisson, C., and Laforte, J.L., “Development of Laboratory Test
Procedures to Replace Field Anti-Icing Fluid Tests,” TP 13141E, 1997. 4. Beisswenger, A., Bouchard, K., and LaForte, J.L., “Development of a Procedure for
Indoor Testing of Type IV Fluids to Replicate Natural Snow,” FAA Report DOT/FAA/AR-02/82, August 2002.
18

APPENDIX A—SUMMARY OF THE NCAR ARTIFICIAL SNOW GENERATION SYSTEM
The principal factor causing aircraft deicing and anti-icing fluids to lose their ability to prevent snow buildup on a wing is the liquid-equivalent snowfall rate. Thus, it is important for pilots and airlines to know the expected endurance or holdover time of a deicing and anti-icing fluid for natural snow conditions. Traditionally, establishing holdover times (the time window when an aircraft surface remains snow and ice free) for deicing and anti-icing fluids under snow conditions involves outdoor testing using an aluminum plate placed at a 10-degree angle to horizontal to simulate an aircraft wing (hereafter called frosticator). Briefly, the test procedure is to pour a specified amount of deicing and anti-icing fluid on the frosticator and then wait for the onset of snow buildup on ≥ 30% of the frosticator area. While providing data on the performance of a particular fluid under actual snow conditions, this test procedure can only be performed during winter snow conditions, requiring considerable effort and expense. In addition, outdoor conditions often are highly variable, with quantities such as wind speed and direction, temperature, and rapidly changing snowfall intensity. Thus, in practice it is often difficult to compare tests from a particular snowstorm with tests conducted during other snowstorms, or even within a particular storm, since particular conditions of snowfall intensity, wind speed and direction, and rapid temperature changes and are seldom duplicated. In contrast to outdoor testing, indoor snow testing in a cold room provides a well-controlled environment in terms of temperature and wind (calm) and year-round testing. The factor preventing the testing of deicing and anti-icing fluids with snow in cold rooms has been the lack of an appropriate method to generate realistic snowfall in terms of duration, rate, density, and spatial uniformity. To investigate the feasibility of indoor deicing and anti-icing testing for snow, the Federal Aviation Administration William J. Hughes Technical Center funded the National Center for Atmospheric Research (NCAR) to develop an artificial snow system that could be used to perform indoor testing of anti-icing fluids. NCAR developed a method to generate artificial snow by shaving an ice core mechanically with a rotating carbide drill bit. The ice core is oriented horizontally and fed into the rotating carbide bit with a computer controlled translator. The translator movement is controlled via a computer operated stepper motor system. The ice flakes are disbursed by a series of directed airflows as they fall 2.5 m onto a 30- by 50-cm aluminum frosticator plate. The plate is a component of a fluid containment unit that collects and weighs all the snow falling on the plate and also retains any deicing fluid applied on the plate. The plate and fluid containment unit rest on an electronic balance so that total mass is measured in real time, allowing accurate calculation and control of the snowfall rate. A thermistor is inserted into the frosticator plate to measure the plate temperature every 6 seconds during fluid tests. In addition, a thin plate heater is glued to the back side of the frosticator plate to control the plate temperature if so desired. Figure 2 of this report shows the tray assembly during a snow test. Note that the plate fails (as indicated by the white snow accumulation region) from the top of the plate down, as observed in outdoor snow testing. This method of measuring and controlling snowfall rate was a significant improvement over previous snow measurement techniques, which used manual methods to estimate snowfall rate. The snow generation system is computer controlled with a PC running LabView software.
A-1

The artificial snow generation system produces fine ice shavings that mimic natural snow in density, size distribution, fall velocity, and mass accumulation rates. In deicing and anti-icing studies, the snow has demonstrated to be functionally equivalent to natural snow with a density between 0.05 and 0.12 g/cm3, depending on the feed rate and cutter rotational speed. The system has been used to generate artificial snow over the range 0-75 g/dm2/h and at temperatures from -2° to -35°C. The system has been replicated and used in various cold chambers for anti-icing and deicing studies and for testing snow gauges. A key initial finding with the system was the cooling of the frosticator plate by the release of latent heat during the melting of snow. The plate cooling rate was shown to be proportional to the snowfall rate from both direct plate temperature measurements and theoretical considerations. Holdover times for Type IV fluids were shown to be significantly shorter when the plate temperature was allowed to freely cool as opposed to being maintained at a constant temperature. This was attributed to the cooler plate temperature for the freely cooling plate as a result of snow melting. Measurement of the temperature of frosticator plates during outdoor natural snow tests showed that the outdoor plates did not cool as much as the indoor tests due to the wind heating the plates towards outdoor ambient temperature. Through a series of comparisons to outdoor and indoor snow tests, it was determined that the best correlation to outdoor snow tests occurred when the indoor frosticator plate was set at a controlled temperature 1°-2.5°C below the ambient temperature, depending on the snowfall rate. By controlling the snowfall rate and temperature of the frosticator plate, very good agreement was found between outdoor test results and the NCAR indoor snow generation system (comparisons were made with over 80 individual tests during the winter of 2003-2004) establishing the NCAR artificial snow generation system as a viable method to test deicing and anti-icing fluids under indoor conditions.
A-2
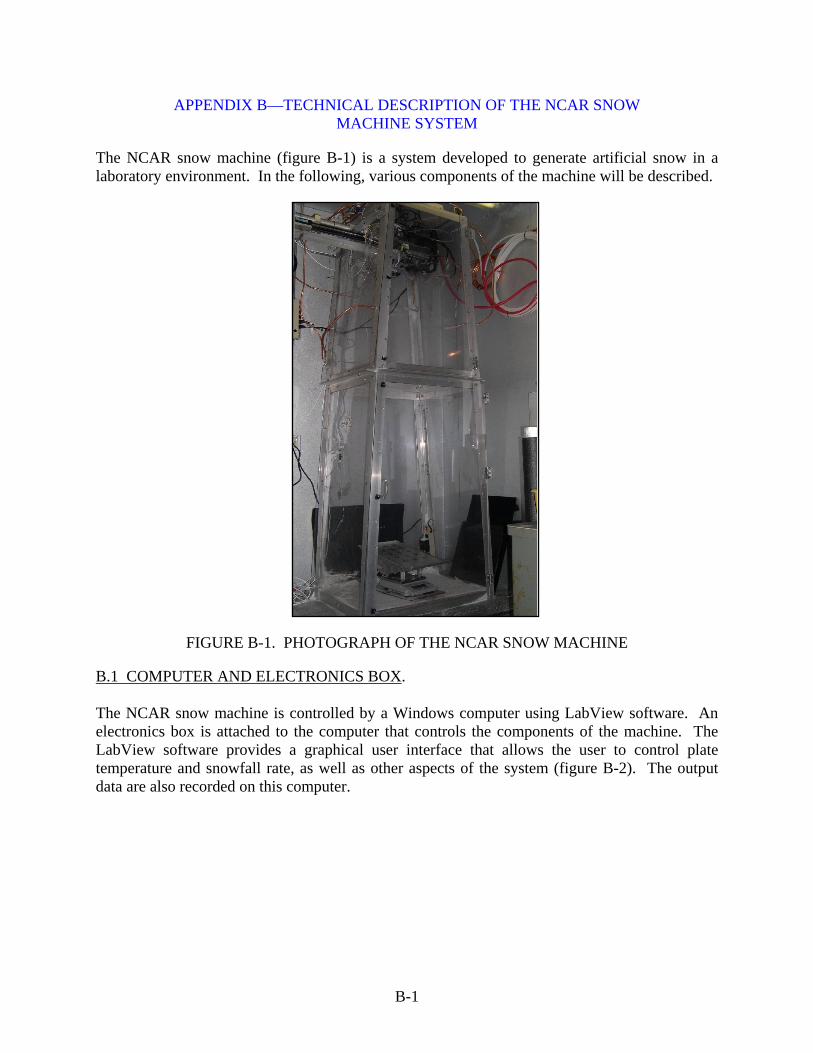
APPENDIX B—TECHNICAL DESCRIPTION OF THE NCAR SNOW MACHINE SYSTEM
The NCAR snow machine (figure B-1) is a system developed to generate artificial snow in a laboratory environment. In the following, various components of the machine will be described.
FIGURE B-1. PHOTOGRAPH OF THE NCAR SNOW MACHINE
B.1 COMPUTER AND ELECTRONICS BOX. The NCAR snow machine is controlled by a Windows computer using LabView software. An electronics box is attached to the computer that controls the components of the machine. The LabView software provides a graphical user interface that allows the user to control plate temperature and snowfall rate, as well as other aspects of the system (figure B-2). The output data are also recorded on this computer.
B-1

FIGURE B-2. LABVIEW GRAPHICAL USER INTERFACE USED TO CONTROL THE NCAR SNOW MACHINE
B.2 WIPER ASSEMBLY. The wiper assembly (figures B-3 and B-4) is located above the ice core and drill and consists of a perforated shield assembly and a wiper blade. The perforated shield assembly allows air from two fans to pass through the perforated shield to help reduce snow buildup on the shield. The wiper assembly uses two air cylinders that move a wiper across the perforated shield removing any snow buildup. Before introduction of the wiper assembly to the snow machine, snow buildup at the top of the machine would cause large clumps of snow to fall onto the plate during an experiment, causing an invalid experiment.
FIGURE B-3. SNOW BUILDUP ON TOP SHROUD OF SNOW MACHINE PRIOR TO
USE OF WIPER ASSEMBLY
FIGURE B-4. SNOW BUILDUP ON TOP SHROUD OF SNOW MACHINE AFTER
USE OF WIPER ASSEMBLY
B-2

The wiper assembly has been found to be extremely important for warmer temperatures (-3° to -8°C) when snow buildup on the perforated shield is more common. At very cold temperatures (< -16°C), the use of the wiper assembly is not required because snow does not stick to the perforated shield at these temperatures. B.3 ICE CORES AND TRANSLATOR. The NCAR snow machine uses ice cores to generate snow. Distilled water is frozen in metal tubes using thick insulation near the tops of the tubes and tapering to no insulation at the bottom of the tubes. This has the effect of forcing the water to freeze from the bottom upward, decreasing the likelihood of ice cores cracking upon removal. Removal of the ice cores requires the tubes to be placed in a warm room and set on 1-inch-thick foam to prevent heat exchange with the floor to thaw the bottom faster than the top. The ice cores are loaded onto a translator that is controlled by a stepper motor capable of producing snowfall rates up to 110 g/dm2/h. Once an ice core has been loaded onto the translator, it is fed into a drill bit that shaves the ice producing ice shavings similar to snow in both size distribution and fall velocity. B.4 TRAY ASSEMBLY. The tray assembly (figure B-5) of the NCAR snow machine consists of a tray, plate, temperature probes, heater, and a 12-kg mass balance. The plate is mounted inside the tray at a 10° angle. A small gap around the plate allows fluid to run off the edges and into the tray. Each plate has two temperature probes embedded into the back of the plate and a heater covering the back of the plate. One temperature probe is used to monitor the temperature of the plate while the other is used to control the heater and maintain a constant plate temperature. The entire tray assembly sits on top of the 12-kg mass balance, which provides 6-second updates of the total mass to the computer and allows the computer to maintain a constant snowfall rate through a feedback loop.
FIGURE B-5. IMAGE OF TRAY ASSEMBLY SITTING ON TOP OF A MASS BALANCE
B-3

B.5 AIR JETS. Computer-controlled air jets were added this year to improve the distribution of the snow on the plate at the bottom of the machine. The air jets are controlled by a 20-gallon air compressor that can produce 150 psi. The front-left jet is located 85 1/2″ from the bottom of the machine facing the back right corner at a -16º elevation. The back right jet is located 74 1/2″ from the bottom of the machine facing the front left corner at a +3º elevation. Another jet is located just below the drill press center on the back wall pointed 10º toward the left wall and has a -25º elevation. The last jet is located inches from the midpoint of the top shroud point at a +24º elevation. The air jets pulse air in a set sequence to optimize the distribution. The air jet sequence and times are shown in table B-1. The drill-shroud jet combines both the air jet located below the drill press and the air jet located near the top shroud. Interjet refers to periods where no air is being pulsed through any of the jet components.
TABLE B-1. CURRENT AIR JET CONFIGURATION FOR OPTIMAL SNOW DISTRIBUTION
Air Jet
Component Period of Pulse
(seconds) Order 1 Front Left Jet 0.1 2 Inter Jet 0.4 3 Back Right Jet 0.2 4 Inter Jet 0.4 5 Drill-Shroud Jet 0.1 6 Interjet 0.4
The entire sequence takes 1.6 seconds to complete and repeats throughout the experiment. The values for each jet can be adjusted individually, allowing users the ability to test different sequences to find an optimal distribution.
B-4

APPENDIX C—EXTRACT OF EXPERIMENTAL PROGRAM FLUID ENDURANCE TIME TESTING WITH ARTIFICIAL SNOW
C-1/C-2
Appendix C
EXTRACT OF EXPERIMENTAL PROGRAM FLUID ENDURANCE TIME TESTING WITH ARTIFICIAL SNOW
Winter 2003-04
Prepared for Anti–icing Material International Laboratory (AMIL), National Centre for Atmospheric Research (NCAR), Federal Aviation Administration (FAA) and Transportation Development Centre (TDC)
Prepared by: Richard Campbell, Nicoara Moc and John D’Avirro
Reviewed by: John D’Avirro
February 5, 2004 Version 1.0
C-3
ROUND–ROBIN FLUID ENDURANCE TIME TESTING UNDER ARTIFICIAL SNOW
EXPERIMENTAL PROGRAM FLUID ENDURANCE TIME TESTING WITH ARTIFICIAL SNOW
Winter 2003-04
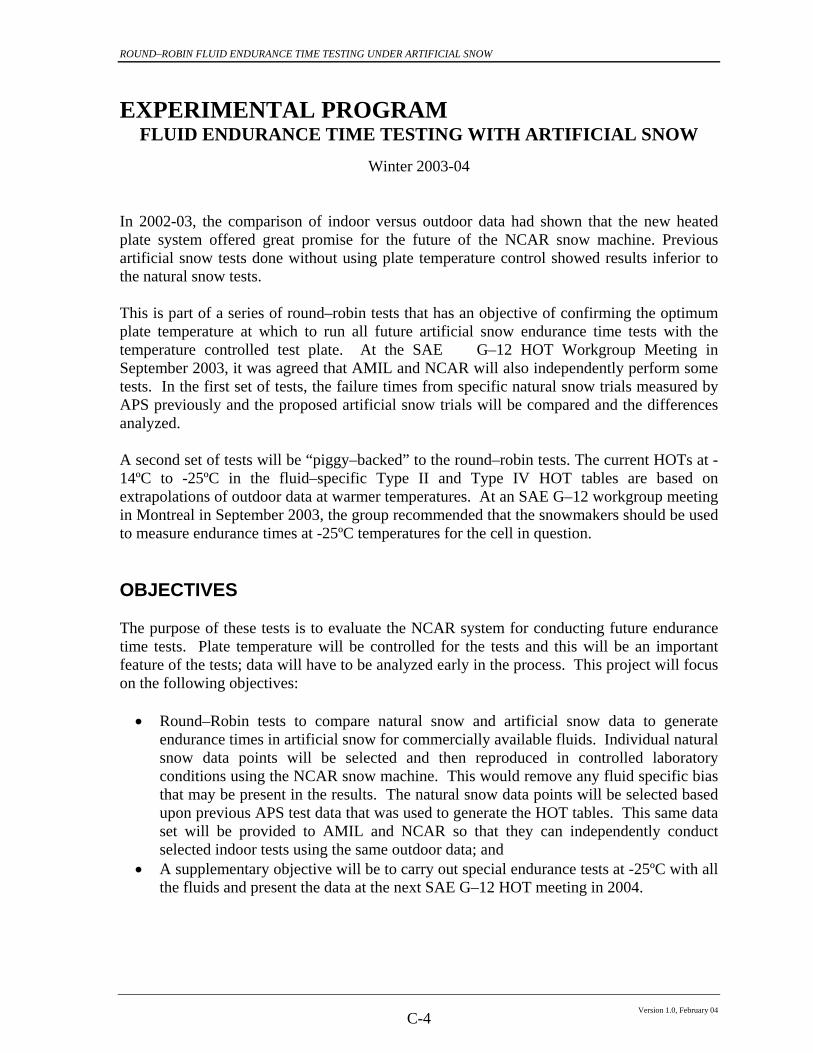
In 2002-03, the comparison of indoor versus outdoor data had shown that the new heated plate system offered great promise for the future of the NCAR snow machine. Previous artificial snow tests done without using plate temperature control showed results inferior to the natural snow tests. This is part of a series of round–robin tests that has an objective of confirming the optimum plate temperature at which to run all future artificial snow endurance time tests with the temperature controlled test plate. At the SAE G–12 HOT Workgroup Meeting in September 2003, it was agreed that AMIL and NCAR will also independently perform some tests. In the first set of tests, the failure times from specific natural snow trials measured by APS previously and the proposed artificial snow trials will be compared and the differences analyzed. A second set of tests will be “piggy–backed” to the round–robin tests. The current HOTs at -14ºC to -25ºC in the fluid–specific Type II and Type IV HOT tables are based on extrapolations of outdoor data at warmer temperatures. At an SAE G–12 workgroup meeting in Montreal in September 2003, the group recommended that the snowmakers should be used to measure endurance times at -25ºC temperatures for the cell in question. OBJECTIVES The purpose of these tests is to evaluate the NCAR system for conducting future endurance time tests. Plate temperature will be controlled for the tests and this will be an important feature of the tests; data will have to be analyzed early in the process. This project will focus on the following objectives:
• Round–Robin tests to compare natural snow and artificial snow data to generate endurance times in artificial snow for commercially available fluids. Individual natural snow data points will be selected and then reproduced in controlled laboratory conditions using the NCAR snow machine. This would remove any fluid specific bias that may be present in the results. The natural snow data points will be selected based upon previous APS test data that was used to generate the HOT tables. This same data set will be provided to AMIL and NCAR so that they can independently conduct selected indoor tests using the same outdoor data; and
• A supplementary objective will be to carry out special endurance tests at -25ºC with all the fluids and present the data at the next SAE G–12 HOT meeting in 2004.
Version 1.0, February 04
C-4

ROUND–ROBIN FLUID ENDURANCE TIME TESTING UNDER ARTIFICIAL SNOW
Indoor Endurance Time Testing Tests will be conducted using icing intensity (rates) and temperatures observed in selected individual natural snow data points. For these indoor tests the test plate of the NCAR bucket assembly will be maintained at a temperature that best correlates indoor endurance times with the outdoor times. It is has been shown that controlling the plate temperature brings the fluid endurance times closer to those found under natural snow. The matrix of tests for endurance time testing is given in Appendix D. Natural Snow Endurance Time Tests Individual natural snow tests were selected from the data set amassed for each fluid over the past several years by APS personnel. Selection Criteria for Natural Snow Tests The following criteria were used in determining acceptable natural snow tests;
1) Only commercially available fluids will be selected; 2) Several points chosen for each fluid concentration; 3) A similar range of test temperatures used to simplify indoor testing; 4) Limit total number of tests to approximately ten; 5) Icing intensities in natural snow have to be consistent and reproducible; 6) Endurance times for similar natural snow tests have to be consistent; 7) A range of icing intensities and temperature must be chosen; 8) Icing intensity of natural snow tests should not fluctuate excessively; 9) Minimize variance from regression equations; and 10) Minimize points with temperature above -2ºC and certainly not above 0ºC.
Test Matrix and Priorities Appendix C contains the plan of tests for both projects that were previously described. Test numbers were assigned and labeled with the preface “RR” for the round robin comparison, while tests labeled with preface “25C” are the -25ºC series of tests to develop endurance time data for the neat fluids. The criteria that will be used for scheduling the tests will be as follows: a) The -25ºC series of tests are highest priority (priority 1) but should be done towards the
end of the schedule, once it has been ascertained what the plate temperature control is. Tests will be done in duplicate;
Version 1.0, February 04
C-5

ROUND–ROBIN FLUID ENDURANCE TIME TESTING UNDER ARTIFICIAL SNOW
b) While all the fluids ordered have been listed in the matrix, it may be that a few of these
fluids will not be received; and c) Tests in the round–robin comparison series have been prioritized. Lower priorities were
given to tests that have similar rates and temperatures. Lower priorities were also given to the longer duration tests in an attempt to optimize on the number of tests.
Plate Temperature Set Point At the SAE G–12 HOT Workgroup Meeting, it had been suggested that the plate temperature should be set at 1ºC and 2ºC colder than OAT at rates of 10 and 25 g/dm²/h, respectively. Subsequently, both NCAR and APS examined plate temperature profile data collected from tests that were conducted using the NCAR bucket as well as the leading edge thermal equivalent surfaces. These types of surfaces (rather than plates), better replicate what may happen on a wing. The combined data sets generated a best fit curve that resulted in the following equation: Avg. Tdrop = 0.0653 x Rate + 0.509 Tdrop represents the average decrease in surface temperature over the course of the test when compared to the OAT. Independently, APS and NCAR points generated a similar fit. As a start to the experiments, the equation above will be applied. This equation provides values at 10 and 25 g/dm²/h almost equal to the values that were selected at the Work Group Meeting.
Version 1.0, February 04
C-6

APPENDIX D—MATRIX OF NCAR TESTS AND APS OUTDOOR DATA
D-1/D-2

FY04
Fin
al R
epor
t on
Flui
d En
dura
nce
Tim
e Te
stin
g us
ing
the
NC
AR
Sno
w M
achi
ne
Nat
iona
l Cen
ter f
or A
tmos
pher
ic R
esea
rch
D-3
M
atri
x of
the
NC
AR
Sno
w M
achi
ne T
ests
incl
udin
g th
e A
PS O
utdo
or D
ata
O
utdo
or M
SC
Dat
a B
rix
Uni
que
Test
N
o.
Orig
inal
Te
st
No.
D
ate
Flui
d D
ilutio
n Fl
uid
Nam
e *
Flui
d Ty
pe
Out
door
E
ndur
ance
Ti
me
(min
)
Out
door
Ic
ing
Inte
nsity
(g
/dm
2 /h)
Air
Tem
p.
(°C
)
Win
d S
peed
(k
m/h
)
Pla
te S
et
Tem
p (°
C)
Priority
Initi
al
Flui
d Te
mp.
(°
C)
Initi
al
Fina
l
NC
AR
Indo
or
End
uran
ce
Tim
e (m
in)
Test
#
R
R 1
23
7 M
ar-0
3-19
99
50%
K
ILFR
OS
T A
BC
-S
4a
9.0
28.4
-1
.7
17
-4.1
1
-3.0
20
.25
11.2
5 9
1 R
R 2
39
7 M
ar-1
1-19
99
75%
K
ILFR
OS
T A
BC
-S
4b
45.0
12
.5
-5.5
18
-6
.8
1 -8
.0
27.5
14
52
1
RR
3
449
Mar
-12-
1999
75
%
KIL
FRO
ST
AB
C-S
4b
88
.0
5.7
-7.6
15
-8
.5
2 -9
.0
28
12.2
5 13
0 1
RR
4
450
Mar
-12-
1999
75
%
KIL
FRO
ST
AB
C-S
4b
82
.0
6.0
-7.6
16
-8
.5
3 -9
.0
28.2
5 12
.25
125
1 R
R 5
37
2 M
ar-0
6-19
99
75%
K
ILFR
OS
T A
BC
-S
4b
71.0
7.
5 -1
2.2
32
-13.
2 2
-14.
5 27
.5
12.7
5 65
1
RR
6
243
Mar
-03-
1999
75
%
KIL
FRO
ST
AB
C-S
4b
34
.0
23.1
-1
.8
16
-3.8
1
-4.5
27
.75
15.5
38
.5
1 R
R 7
40
4 M
ar-1
1-19
99
Nea
t K
ILFR
OS
T A
BC
-S
4 93
.0
10.7
-5
.4
18
-6.7
1
-7.5
36
13
.5
77
2 R
R 8
32
6 M
ar-0
6-19
99
Nea
t K
ILFR
OS
T A
BC
-S
4 12
2.0
4.8
-12.
9 26
-1
3.7
2 -1
4.5
36
15.2
5 61
1
RR
9
233
Mar
-03-
1999
N
eat
KIL
FRO
ST
AB
C-S
4
51.0
32
.3
-1.8
17
-4
.4
1 -4
.0
36.2
5 11
.25
42
1 R
R 1
0 27
7 M
ar-0
3-19
99
Nea
t U
CA
R U
LTR
A +
4
52.0
14
.9
-0.9
17
-2
.4
3 -2
.0
40.2
5 10
.25
66.5
1
RR
11
367
Mar
-06-
1999
N
eat
UC
AR
ULT
RA
+
4 79
.0
8.2
-12.
3 32
-1
3.3
1 -1
3.5
40.2
5 12
.25
105
1 R
R 1
2 36
2 M
ar-0
6-19
99
Nea
t U
CA
R U
LTR
A +
4
94.0
5.
4 -1
2.4
30
-13.
3 2
-14.
0 40
.25
12.2
5 15
0 1
R
R 1
3 23
1 M
ar-0
3-19
99
Nea
t U
CA
R U
LTR
A +
4
37.0
25
.6
-1.8
17
-4
.0
1 -4
.0
40.2
5 8
41
1 R
R 1
4 40
2 M
ar-1
1-19
99
Nea
t U
CA
R U
LTR
A +
4
59.0
11
.6
-5.4
18
-6
.7
1 -7
.0
40.2
5 10
.25
70.5
1
RR
15
405
Mar
-13-
2001
50
%
Oct
agon
Max
Flig
ht
4a
41.3
23
.7
-0.9
10
-3
.0
1 -2
.5
19
7.25
38
1
RR
16
49
Dec
-30-
2000
75
%
Oct
agon
Max
Flig
ht
4b
58.5
20
.8
-4.6
43
-6
.5
1 -7
.0
27.5
15
62
1
RR
17
126
Feb-
14-2
001
75%
O
ctag
on M
ax F
light
4b
71
.5
16.5
-6
.0
4.8
-7.6
2
-8.0
28
14
.25
50
1 R
R 1
8 22
0 Fe
b-25
-200
1 75
%
Oct
agon
Max
Flig
ht
4b
102.
0 11
.8
-8.6
21
-9
.9
1 -9
.5
26.5
16
.5
68
1 R
R 1
9 17
3 Fe
b-19
-200
1 N
eat
Oct
agon
Max
Flig
ht
4 71
.0
24.1
-2
.4
27.2
-4
.4
2 -5
.0
36.2
5 10
.25
62
1 R
R 2
0 50
D
ec-3
0-20
00
Nea
t O
ctag
on M
ax F
light
4
65.6
21
.2
-4.7
42
-6
.6
1 -7
.0
36.2
5 13
.25
61
1 R
R 2
1 48
D
ec-3
0-20
00
Nea
t O
ctag
on M
ax F
light
4
65.3
18
.8
-4.5
44
-6
.2
1 -5
.0
36.2
5 14
.25
71
1 R
R 2
2 44
9 Fe
b-16
-200
0 50
%
SP
CA
AD
-480
4a
25
.3
9.2
-2.8
20
-3
.9
1 -3
.5
19
10.7
5 30
1
RR
23
433
Feb-
16-2
000
50%
S
PC
A A
D-4
80
4a
16.0
15
.1
-3.0
26
-4
.5
1 -4
.0
19.5
11
18
.1
1 R
R 2
4 44
0 Fe
b-16
-200
0 75
%
SP
CA
AD
-480
4b
77
.0
9.0
-2.8
20
-3
.9
1 -4
.0
28.2
5 11
.75
73.6
1
RR
25
511
Mar
-11-
2000
75
%
SP
CA
AD
-480
4b
53
.0
13.8
-3
.2
21
-4.6
2
-3.8
27
.25
10.2
5 47
1
RR
26
391
Feb-
14-2
000
75%
S
PC
A A
D-4
80
4b
26.0
29
.5
-5.5
44
-8
.0
1 -8
.5
26.2
5 14
.25
25.2
1
RR
27
260
Feb-
11-2
000
75%
S
PC
A A
D-4
80
4b
22.0
23
.6
-11.
0 31
-1
3.1
2 -1
4.0
28.2
5 19
.25
20.5
1
RR
28
497
Mar
-11-
2000
N
eat
SP
CA
AD
-480
4
83.0
10
.1
-3.0
21
-4
.2
1 -3
.5
36.2
5 11
.25
75
1 R
R 2
9 67
1 M
ar-1
4-20
00
Nea
t S
PC
A A
D-4
80
4 70
.4
12.7
-5
.4
14
-6.8
2
-7.5
36
13
72
.5
1 R
R 3
0 26
1 Fe
b-11
-200
0 N
eat
SP
CA
AD
-480
4
30.0
26
.5
-11.
0 32
-1
3.2
1 -1
4.0
36
20.2
5 22
.5
1

ROU
ND
–RO
BIN
FLU
ID E
ND
URA
NC
E TI
ME
TEST
ING
UN
DER
ART
IFIC
IAL
SNO
W
V
ersi
on 1
.0, F
ebru
ary
04
D-4
O
utdo
or M
SC
Dat
a B
rix
Uni
que
Test
N
o.
Orig
inal
Te
st
No.
D
ate
Flui
d D
ilutio
n Fl
uid
Nam
e *
Flui
d Ty
pe
Out
door
E
ndur
ance
Ti
me
(min
)
Out
door
Ic
ing
Inte
nsity
(g
/dm
2 /h)
Air
Tem
p.
(°C
)
Win
d S
peed
(k
m/h
)
Pla
te S
et
Tem
p (°
C)
Priority
Initi
al
Flui
d Te
mp.
(°
C)
Initi
al
Fina
l
NC
AR
Indo
or
End
uran
ce
Tim
e (m
in)
Test
#
R
R 3
1 41
6 M
ar-1
9-19
98
50%
C
laria
nt 2
001
4a
34.0
3.
9 -2
.8
29
-3.6
2
-3.5
19
11
.25
40
1 R
R 3
2 39
4 M
ar-1
9-19
98
50%
C
laria
nt 2
001
4a
29.0
4.
7 -2
.7
28
-3.5
1
-4.0
20
.25
11
33.5
1
RR
33
305
Mar
-22-
1998
75
%
Cla
riant
200
1 4b
53
.0
11.9
-3
.2
35
-4.5
1
-4.0
27
.75
9 37
1
RR
34
324
Mar
-22-
1998
75
%
Cla
riant
200
1 4b
35
.0
27.8
-3
.7
34
-6.0
1
-5.5
26
.75
10.2
5 23
.5
1 R
R 3
5 64
Ja
n-23
-199
8 75
%
Cla
riant
200
1 4b
22
.0
22.6
-1
3.0
22
-15.
0 1
-16.
5 27
.75
21
12
1 R
R 3
6 13
6 Ja
n-23
-199
8 N
eat
Cla
riant
200
1 4
51.0
22
.3
-6.4
18
-8
.4
2 -1
0.0
35.5
14
.25
25
1 R
R 3
7 14
7 Ja
n-23
-199
8 N
eat
Cla
riant
200
1 4
68.0
13
.1
-4.9
15
-6
.3
1 -6
.0
35.5
11
.25
58
1 R
R 3
8 71
Ja
n-23
-199
8 N
eat
Cla
riant
200
1 4
30.0
37
.0
-11.
6 21
-1
4.5
1 -1
5.0
35.7
5 21
12
1
RR
39
52
Jan-
23-1
998
Nea
t C
laria
nt 2
001
4 41
.0
13.1
-1
4.6
23
-15.
9 2
-9.5
35
.75
18.5
30
1
RR
40
236
Mar
-03-
1999
50
%
KIL
FRO
ST
AB
C-II
Plu
s 2a
13
.0
28.4
-1
.7
17
-4.1
1
-3.0
19
.75
9.25
12
.8
1 R
R 4
1 28
6 M
ar-0
4-19
99
50%
K
ILFR
OS
T A
BC
-II P
lus
2a
41.0
6.
6 -1
.7
31
-2.7
1
-2.0
19
.5
7 48
.5
1 R
R 4
2 38
6 M
ar-1
1-19
99
50%
K
ILFR
OS
T A
BC
-II P
lus
2a
56.0
6.
9 -5
.5
20
-6.5
1
-7.0
19
.5
10
38
1 R
R 4
3 33
7 M
ar-0
6-19
99
75%
K
ILFR
OS
T A
BC
-II P
lus
2b
29.0
7.
1 -1
2.6
24
-13.
6 1
-15.
0 28
.25
18.5
33
.5
1 R
R 4
4 32
2 M
ar-0
6-19
99
75%
K
ILFR
OS
T A
BC
-II P
lus
2b
51.0
6.
3 -1
3.3
28
-14.
2 2
-15.
0 28
16
.75
42
1 R
R 4
5 12
3 Fe
b-06
-199
9 75
%
KIL
FRO
ST
AB
C-II
Plu
s 2b
71
.0
4.5
-7.4
12
-8
.2
2 -9
.5
28.2
5 13
.25
85
1 R
R 4
6 39
9 M
ar-1
1-19
99
Nea
t K
ILFR
OS
T A
BC
-II P
lus
2 46
.0
12.6
-5
.5
18
-6.8
1
-7.5
36
.5
13.5
38
.5
1 R
R 4
7 23
0 M
ar-0
3-19
99
Nea
t K
ILFR
OS
T A
BC
-II P
lus
2 34
.0
25.2
-1
.8
17
-4.0
1
-3.0
36
.25
9.25
27
.5
1 R
R 4
8 12
5 Fe
b-06
-199
9 N
eat
KIL
FRO
ST
AB
C-II
Plu
s 2
100.
0 3.
9 -7
.2
11
-8.0
2
-9.5
36
.25
12
117
1 R
R49
15
8 Fe
b-19
-200
1 50
%
C S
afew
ing
Pro
tect
201
24a
13
.3
23.8
-2
.4
24.2
-4
.5
1 -3
.5
18.7
5 8.
25
7 1
RR
50
97
Mar
-11-
2001
50
%
C S
afew
ing
Pro
tect
201
24a
33
.7
6.1
-2.4
14
-3
.3
1 -4
.0
20.2
5 8.
5 29
1
RR
51
104
Feb-
05-2
001
75%
C
Saf
ewin
g P
rote
ct 2
012
4b
52.0
7.
9 -8
.0
17
-9.0
1
-8.5
27
.25
11.2
5 37
2
RR
52
83
Jan-
31-2
001
75%
C
Saf
ewin
g P
rote
ct 2
012
4b
39.0
12
.0
-8.3
26
-9
.6
1 -8
.3
28.2
5 14
.5
29.4
1
RR
52
83
Jan-
31-2
001
75%
C
Saf
ewin
g P
rote
ct 2
012
4b
39.0
12
.0
-8.3
26
-9
.6
1 -1
0.5
27.2
5 15
27
.5
2 R
R53
55
Ja
n-15
-200
1 N
eat
C S
afew
ing
Pro
tect
201
24
124.
0 4.
9 -8
.0
21
-8.8
2
-8.0
36
.25
13
99
1 R
R54
10
1 Fe
b-05
-200
1 N
eat
C S
afew
ing
Pro
tect
201
24
69.0
8.
1 -7
.9
16
-9.0
1
-7.9
35
.5
13.2
5 61
1
RR
55
193
Feb-
22-2
001
Nea
t C
Saf
ewin
g P
rote
ct 2
012
4 68
.0
4.0
-15.
8
-16.
6 1
-17.
5 36
17
68
1
RR
56
407
Feb-
19-2
001
50%
S
PC
A E
cow
ing
26
2a
15.5
13
.3
-2.6
22
.1
-3.9
1
-7.5
19
6.
75
17
1 R
R 5
7 67
0 M
ar-1
1-20
01
50%
S
PC
A E
cow
ing
26
2a
14.3
16
.1
-1.5
15
.2
-3.1
2
-4.0
20
.25
7.25
16
1
RR
58
250
Feb-
19-2
001
50%
S
PC
A E
cow
ing
26
2a
7.7
32.4
-2
.8
31.3
-5
.4
1 -4
.0
19.7
5 10
.5
8.3
1 R
R 5
9 25
9 Fe
b-19
-200
1 75
%
SP
CA
Eco
win
g 26
2b
30
.0
23.7
-2
.7
30.2
-4
.8
1 -5
.0
27.2
5 9.
75
20.5
1
RR
60
238
Mar
-13-
2001
75
%
SP
CA
Eco
win
g 26
2b
24
.0
23.7
-6
.1
25.3
-8
.2
1 -8
.5
27.2
5 13
.25
18.5
1
RR
61
276
Mar
-13-
2001
N
eat
SP
CA
Eco
win
g 26
2
51.0
16
.1
-1.6
5
-3.2
2
-3.0
36
.25
7 34
.5
1 R
R 6
2 52
0 M
ar-1
3-20
01
Nea
t S
PC
A E
cow
ing
26
2 37
.0
24.1
-0
.9
10
-3.0
3
-3.5
36
.25
7.5
25.5
1
RR
63
195
Feb-
22-2
001
Nea
t S
PC
A E
cow
ing
26
2 85
.0
3.9
-15.
7
-16.
5 1
-17.
0 36
16
83
1
RR
64
386
Mar
-13-
2001
N
eat
SP
CA
Eco
win
g 26
2
37.5
24
.0
-6.1
26
.9
-8.2
1
-9.0
35
.75
15.2
5 24
.5
1

FY04
Fin
al R
epor
t on
Flui
d En
dura
nce
Tim
e Te
stin
g us
ing
the
NC
AR
Sno
w M
achi
ne
Nat
iona
l Cen
ter f
or A
tmos
pher
ic R
esea
rch
D-5/D-6
Out
door
MS
C D
ata
Brix
U
niqu
e Te
st
No.
Orig
inal
Te
st
No.
D
ate
Flui
d D
ilutio
n Fl
uid
Nam
e *
Flui
d Ty
pe
Out
door
E
ndur
ance
Ti
me
(min
)
Out
door
Ic
ing
Inte
nsity
(g
/dm
2 /h)
Air
Tem
p.
(°C
)
Win
d S
peed
(k
m/h
)
Pla
te S
et
Tem
p (C
)
Priority
Initi
al
Flui
d Te
mp.
(°
C)
Initi
al
Fina
l
NC
AR
Indo
or
End
uran
ce
Tim
e (m
in)
Test
#
R
R 7
2 71
0 M
ar-2
6-20
02
50%
K
ilfro
st A
BC
200
0 2a
10
.5
26.3
-2
.9
28
-5.1
1
-5
19.2
5 10
.25
12
1 R
R 7
3 24
7 M
ar-2
-200
2 75
%
Kilf
rost
AB
C 2
000
2b
48.0
10
.6
-9.3
-10.
5 1
-10
27.5
15
37
1
RR
74
170
Feb-
26-2
002
75%
K
ilfro
st A
BC
200
0 2b
47
.0
15.4
-6
.0
-7
.5
2 -9
28
.25
14
31
1 R
R 7
5 49
8 M
ar-1
8-20
02
75%
K
ilfro
st A
BC
200
0 2b
40
.0
23.2
-0
.9
-2
.9
1 -2
.5
29.2
5 7
30
1 R
R 7
6 26
5 M
ar-2
-200
2 N
eat
Kilf
rost
AB
C 2
000
2 56
.0
8.5
-9.0
-10.
1 2
-9
36
14.2
5 45
1
RR
77
249
Mar
-2-2
002
Nea
t K
ilfro
st A
BC
200
0 2
48.0
10
.3
-9.3
-10.
5 1
-11
36
14.2
5 37
1
RR
78
497
Mar
-18-
2002
N
eat
Kilf
rost
AB
C 2
000
2 40
.7
23.2
-0
.9
-2
.9
1 -2
.5
36
6.25
36
1
RR
79
206
Mar
-09-
2003
50
%
Cla
riant
202
5 E
CO
2a
12
.0
21.8
-2
.4
18.9
-4
.3
2 -3
.5
19
9 11
.7
1 R
R 8
0 21
3 M
ar-0
9-20
03
50%
C
laria
nt 2
025
EC
O
2a
9.3
29.0
-2
.5
18.3
-4
.9
1 -5
.5
18.5
9.
25
8 1
RR
81
23
Feb-
04-2
003
50%
C
laria
nt 2
025
EC
O
2a
17.0
9.
1 -2
.4
23
-3.5
1
-3.5
19
8.
25
16.5
1
RR
82
202
Mar
-09-
2003
75
%
Cla
riant
202
5 E
CO
2b
25
.2
23.7
-2
.3
18.3
-4
.4
1 -4
.5
28
9.5
20
1 R
R 8
4 65
Fe
b-23
-200
3 75
%
Cla
riant
202
5 E
CO
2b
48
.8
9.3
-4.8
19
-5
.9
1 -5
25
.5
10
46
1 R
R 8
5 20
9 A
pr-0
5-20
03
Nea
t C
laria
nt 2
025
EC
O
2 40
.8
23.4
-2
.5
19.2
-4
.5
1 -4
.5
35.2
5 9
28
1 R
R 8
8 16
7 M
ar-0
5-20
03
Nea
t C
laria
nt 2
025
EC
O
2 84
.0
6.5
-7.8
13
.8
-8.7
1
-9
35.2
5 13
.25
75
1 R
R 8
9 21
4 M
ar-0
9-20
03
50%
C
laria
nt 2
030
EC
O
4a
14.5
28
.9
-2.5
18
.5
-4.9
1
-4
19
9.75
11
1
RR
91
218
Mar
-09-
2003
50
%
Cla
riant
203
0 E
CO
4a
23
.5
7.7
-2.3
13
.7
-3.3
1
-3.5
20
.25
10.7
5 32
1
RR
92
215
Mar
-09-
2003
75
%
Cla
riant
203
0 E
CO
4b
36
.5
25.5
-2
.5
19.3
-4
.6
1 -4
.75
27.5
9.
25
28.5
1
RR
96
39
Feb-
22-2
003
Nea
t C
laria
nt 2
030
EC
O
4 69
.2
14.2
-6
.4
46
-7.8
1
-8.5
35
.5
13
53.5
1